")
Back to Journals » Drug Design, Development and Therapy » Volume 11
Differences of statin activity in 2D and 3D pancreatic cancer cell cultures
Authors Paškevičiūtė M, Petrikaitė V
Received 17 August 2017
Accepted for publication 7 October 2017
Published 16 November 2017 Volume 2017:11 Pages 3273—3280
DOI https://doi.org/10.2147/DDDT.S149411
Checked for plagiarism Yes
Review by Single anonymous peer review
Peer reviewer comments 2
Editor who approved publication: Dr Qiongyu Guo
Miglė Paškevičiūtė,1 Vilma Petrikaitė1,2
1Department of Drug Chemistry, Faculty of Pharmacy, Lithuanian University of Health Sciences, Kaunas, Lithuania; 2Department of Biothermodynamics and Drug Design, Vilnius University Institute of Biotechnology, Vilnius, Lithuania
Purpose: To evaluate the anticancer activity of lovastatin (LOVA), mevastatin (MEVA), pitavastatin (PITA), and simvastatin (SIMVA) in 2D and 3D models of three human pancreatic cancer cell lines (BxPC-3, MIA PaCa-2, and PANC-1).
Methods: The effect of statins on cell viability was estimated by 3-(4,5-dimethylthiazol-2-yl)-2,5-diphenyltetrazolium bromide test. The activity of statins in 3D pancreatic cancer cell cultures was examined by measuring the size change of spheroids. The type of cell death was identified by cell staining with Hoechst 33342 and propidium iodide. The activity of statins on the clonogenicity of cancer cells was tested by evaluating the effect on the colony-forming ability of cells.
Results: The rank order of the activity of tested statins on cell viability was as follows: PITA > SIMVA > LOVA > MEVA. Among the tested statins, PITA had the greatest effect on cell viability (half maximal effective concentration values after 72 h on BxPC-3, MIA PaCa-2, and PANC-1 cells were 1.4±0.4 µM, 1.0±0.2 µM, and 1.0±0.5 µM, respectively). PITA also showed the strongest effect on tumor spheroid growth. Statins suppressed the colony formation of cancer cells. PITA demonstrated the greatest reduction in colony size and number. Apoptosis and necrosis assay results showed that at lower concentrations statins mostly induced cell death through apoptosis, whereas higher concentrations of compounds activated also necrotic processes.
Conclusion: Statins, especially PITA, demonstrate an anticancer activity against pancreatic cancer cell lines BxPC-3, MIA PaCa-2, and PANC-1 in both 2D and 3D models.
Keywords: HMG-CoA reductase, cell viability, spheroid, apoptosis
Introduction
Pancreatic cancer is one of the deadliest cancers. Usually it is diagnosed at a late stage, and the efficacy of treatment is limited by the resistance to chemotherapy. According to the International Agency for Research on Cancer, there were more than 337,000 new cases of pancreatic cancer around the world in 2012. It is predicted that over the next two decades, the number of pancreatic cancer cases will increase by 70%.1 The 5-year survival rate for patients with pancreatic cancer is about 5%2 and the median survival for patients with metastatic cancer is 2.8–5.6 months.3
Statins, also known as 3-hydroxy-3-mehylglutaryl coenzyme A reductase (HMG-CoA) inhibitors, are a class of medicines that are used to treat hypercholesterolemia by inhibiting cholesterol synthesis.4 Also, their anticancer activity has been widely investigated. By inhibiting HMG-CoA reductase, statins reduce the synthesis of isoprenoids – geranylgeraniol and farnesylfarnesol.5 These substances bind to Ras protein, which is involved in signaling pathways essential for cell growth, proliferation, differentiation, and cancer development.6,7 Lack of isoprenoids leads to Ras protein inactivation, perturbation of cell signaling, and tumor regression.8 Based on the results of the recent studies, we analyzed the activity of four lipophilic statins from different classes (I class: lovastatin (LOVA), mevastatin (MEVA), and simvastatin (SIMVA); and II class: pitavastatin (PITA)) in 2D and 3D human pancreatic cancer cell (BxPC-3, MIA PaCa-2, and PANC-1) cultures.
Materials and methods
Materials
MEVA and LOVA were bought from Alfa Aesar (Ward Hill, MA, USA). SIMVA and PITA calcium were purchased from Abcam (Cambridge, UK).
Cell cultures
Human pancreatic cancer cell lines BxPC-3, MIA PaCa-2, and PANC-1 were obtained from the American Type Culture Collection (ATCC, Manassas, VA, USA). Human foreskin fibroblast cells CRL-4001 labeled with green fluorescent protein (HF-GFP) were kindly provided from Dr Ramūnas Valiokas (Center for Physical Sciences and Technology, Department of Nanoengineering). This cell line was originally purchased from ATCC. BxPC-3 cells were grown in Roswell Park Memorial Institute 1640 GlutaMAX medium, MIA PaCa-2 and PANC-1 cell lines were cultured in Dulbecco’s Modified Eagle’s Medium GlutaMAX medium. Both media were supplemented with 10,000 U/mL penicillin, 10 mg/mL streptomycin, and 10% fetal bovine serum. HF-GFP cells were grown in Medium 106 with Low Serum Growth Supplement. Media and supplements were purchased from Gibco (Carlsbad, CA, USA). Cells were maintained in a humidified atmosphere containing 5% CO2 at 37°C.
Cell viability
To determine the effect on cell viability, 3-(4,5-dimethylthiazol-2-yl)-2,5-diphenyltetrazolium bromide (MTT; Sigma-Aldrich Co., St Louis, MO, USA) assay was performed. BxPC-3, MIA PaCa-2, and PANC-1 cells were seeded in 96-well plates in a volume of 100 μL (5,000 cells/well). After 24 h preincubation, the cells were treated with 100 μL of different concentrations of statins. Only medium without cells was used as a positive control, and the medium with 0.5% DMSO (Sigma-Aldrich Co.) served as a negative control. After 24, 48, and 72 h the cells were incubated for 3 h with the MTT solution (Sigma-Aldrich Co.). The absorbance was measured at wavelengths of 570 and 630 nm.
Spheroid growth
Spheroids were formed from BxPC-3, MIA PaCa-2, and PANC-1 cells by 3D Bioprinting method.9 The cancer cells were mixed with human fibroblasts (1:1) to better represent the tumor microenvironment because noncancer cells, like fibroblasts, endothelial, immune cells (eg, monocytes, neutrophils, and lymphocytes), and extracellular matrix components (eg, proteoglycans, glycosaminoglycans, and collagens) play an important role in cell signaling, tumor growth and development.10,11 The cells were incubated with nanoparticles NanoShuttle (Nano3D Biosciences Inc., Houston, TX, USA) for 8–10 h. Then cells were resuspended and seeded into ultra-low attachment 96-well plates in a volume of 100 μL (2,000 pancreatic cancer cells and 2,000 human fibroblasts per well). The plate was placed on a magnetic drive and incubated in a humidified atmosphere containing 5% CO2 at 37°C until spheroids were formed. After 2 days of incubation, the photos of spheroids were taken and the medium was replaced by new medium containing 5, 10, and 20 μM of statins. Photos were taken every 48 h, and medium was replaced every 96 h.
The effect of statins in 3D pancreatic cancer cell cultures was examined by measuring the size change of spheroids using ImageJ software (National Institutes of Health).
Cell colony formation
BxPC-3, MIA PaCa-2, and PANC-1 cells were seeded in 12-well plates in a volume of 1 mL (100 cells/well) and treated with 100 μL of 10 and 90% half maximal effective concentration (EC50) of statin solutions. Cells were incubated in a humidified atmosphere containing 5% CO2 at 37°C.
After 12 days, the cells were rinsed with phosphate-buffered saline (PBS, Gibco) and fixed with 4% paraformaldehyde (Thermo Scientific, Waltham, MA, USA) solution in PBS for 15 min. Then the cells were rinsed with PBS two more times, incubated with 0.1% aqueous crystal violet solution for 15 min, and washed with sterile deionized water.
Pictures were taken using G:BOX gel documentation system (Syngene International Ltd, Bengaluru, India) and Genesys software (Syngene International Ltd). The number and percentage area of colonies were calculated.
Type of cell death
Pancreatic cancer cells were seeded in 24-well plates in a volume of 0.5 mL (1,500 cells/well) and incubated in a humidified atmosphere containing 5% CO2 at 37°C for 24 h. After incubation, cells were treated with 10, 50, and 90% EC50 of statins. After 72 h, cells were rinsed with PBS and the medium was replaced with the fresh one. 3 μL of 10 mg/mL Hoechst 33342 aqueous solution and 1 μL of 1 mg/mL propidium iodide were added into each well and cells were incubated for 10 min. The type of cell death was examined by fluorescence microscopy, and the percentage number of apoptotic and necrotic cells was calculated.
Statistical analysis
Statistical analysis was performed using Microsoft Office Excel 2007 software (Microsoft Corporation, Redmond, WA, USA). All the experiments were done in at least triplicate independent measurements and the obtained values were reported as mean ± standard deviation. Student’s t-test was used and p-values were calculated. A value of p<0.05 was considered as the level of significance.
Results
Statins inhibit proliferation of pancreatic cancer cells
Among tested statins, PITA had the greatest effect on cell viability (EC50 values after 72 h on BxPC-3, MIA PaCa-2, and Panc-1 were 1.4±0.38 μM, 1.0±0.17 μM, and 1.0±0.54 μM, respectively) (Figure 1A). The rank order of the activity of tested statins on cell viability was as follows: PITA > SIMVA > LOVA > MEVA. There was no significant difference on cell proliferation between all three cell lines. Moreover, statins showed a profile similar to antimetabolites,12 ie, even at high concentrations they did not kill the cells immediately. Significant cytotoxic effect was determined only after 48 or 72 h (Figure 1B and C).
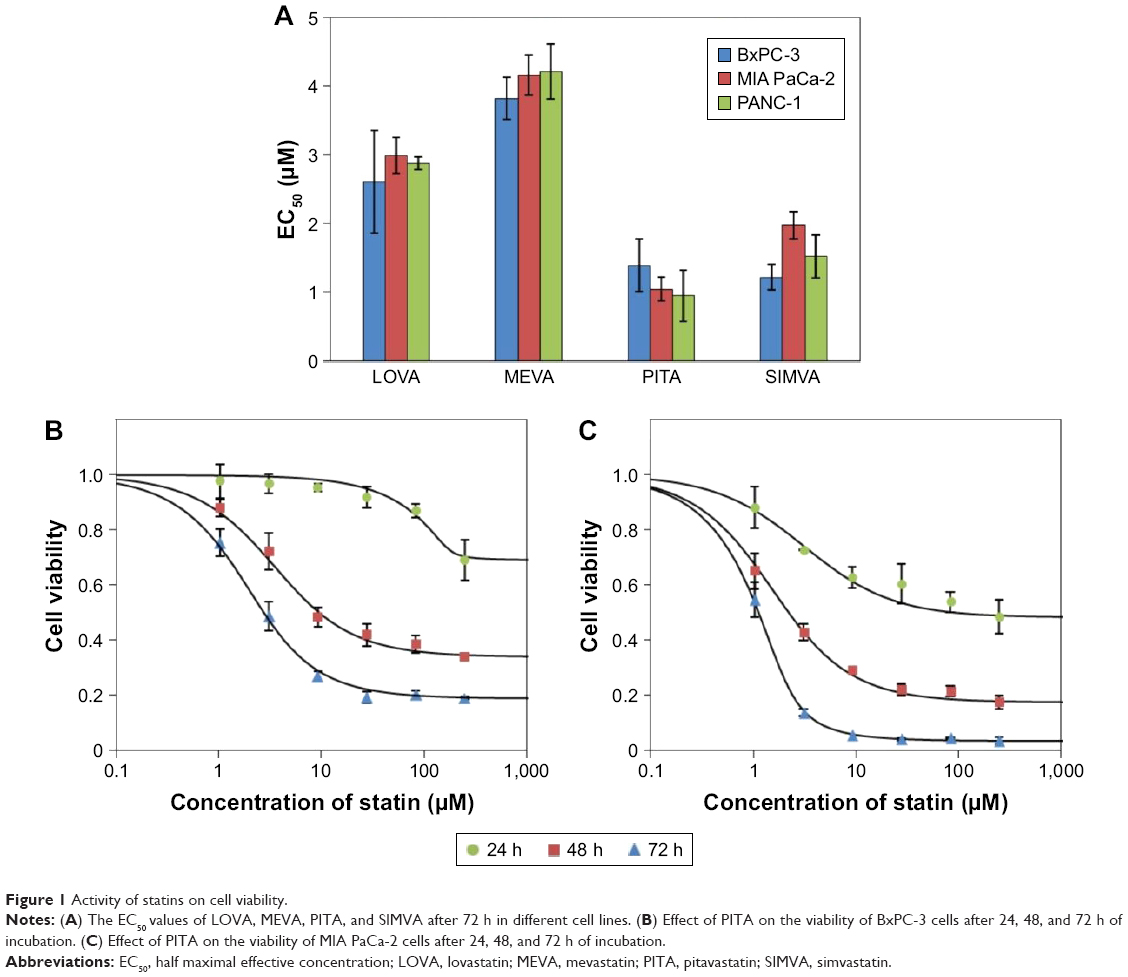 | Figure 1 Activity of statins on cell viability. |
Statins affect the growth of pancreatic cancer cell spheroids
BxPC-3 formed small compact spheroids, whereas PANC-1 and MIA PaCa-2 spheroids were bigger and irregular in shape. The strongest spheroid size reduction in all three cell lines was caused by PITA. SIMVA was less potent, while LOVA and MEVA showed the lowest activity (Figure 2). BxPC-3 spheroids incubated with 20 μM concentration statins and 5 μM PITA and SIMVA started to disintegrate after 2 days of incubation. The most intense size reduction was from the second till the 6th day (Figure 3A).
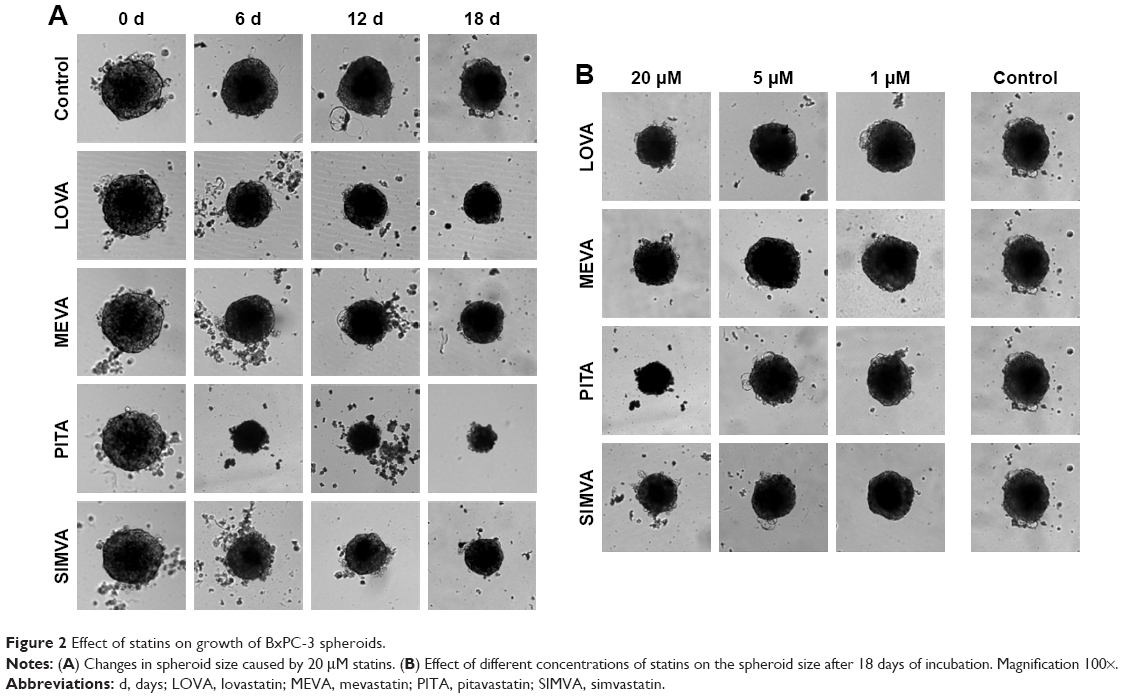 | Figure 2 Effect of statins on growth of BxPC-3 spheroids. |
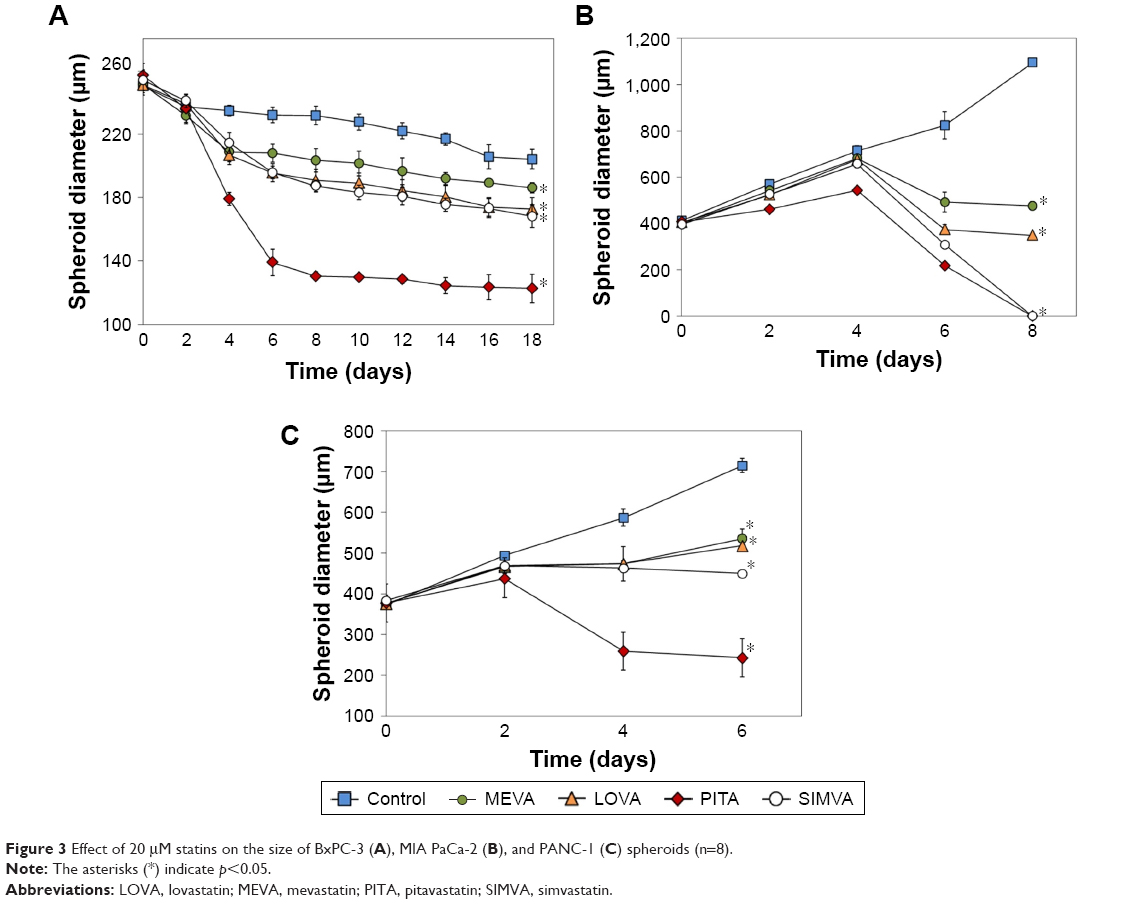 | Figure 3 Effect of 20 μM statins on the size of BxPC-3 (A), MIA PaCa-2 (B), and PANC-1 (C) spheroids (n=8). |
In contrast to BxPC-3 3D cultures, the size of MIA PaCa-2 spheroids was gradually increasing. From the beginning of experiment, all four statins at 20 μM concentration, and PITA and SIMVA at 1 and 5 μM concentration, significantly inhibited the growth of spheroids. On the eighth day, MIA PaCa-2 spheroids incubated with 5 and 20 μM of PITA and 20 μM of SIMVA were completely disintegrated (Figure 3B).
Similar results were found in PANC-1 3D cultures. Spheroids incubated with 5 and 20 μM of PITA started to disintegrate on the fourth day of the experiment. On the eighth day, they were, respectively, 1.3 and 1.6 times smaller compared to the control (Figure 3C).
Statin effect on the reduction in colony formation in MIA PaCa-2 and PANC-1 cells is greater than in BxPC-3 cells
Statins had a similar activity on MIA PaCa-2 and PANC-1 cell colony formation, but they were less potent in the case of BxPC-3 cell line (Figure 4A). PITA demonstrated the greatest effect both on the reduction of number and area of colonies, while MEVA, LOVA, and SIMVA had a similar activity. Only PITA significantly decreased the number of BxPC-3 cell colonies (Figure 4B). However, the BxPC-3 cell colony size was reduced by all statins: PITA, SIMVA, and MEVA reduced it 2.3, 1.3, and 1.3 times, respectively (Figure 4C). In the case of MIA PaCa-2 cell line, 90% EC50 of PITA reduced the area of colonies from 13.2% to 0.2%. Also, it completely killed PANC-1 cells.
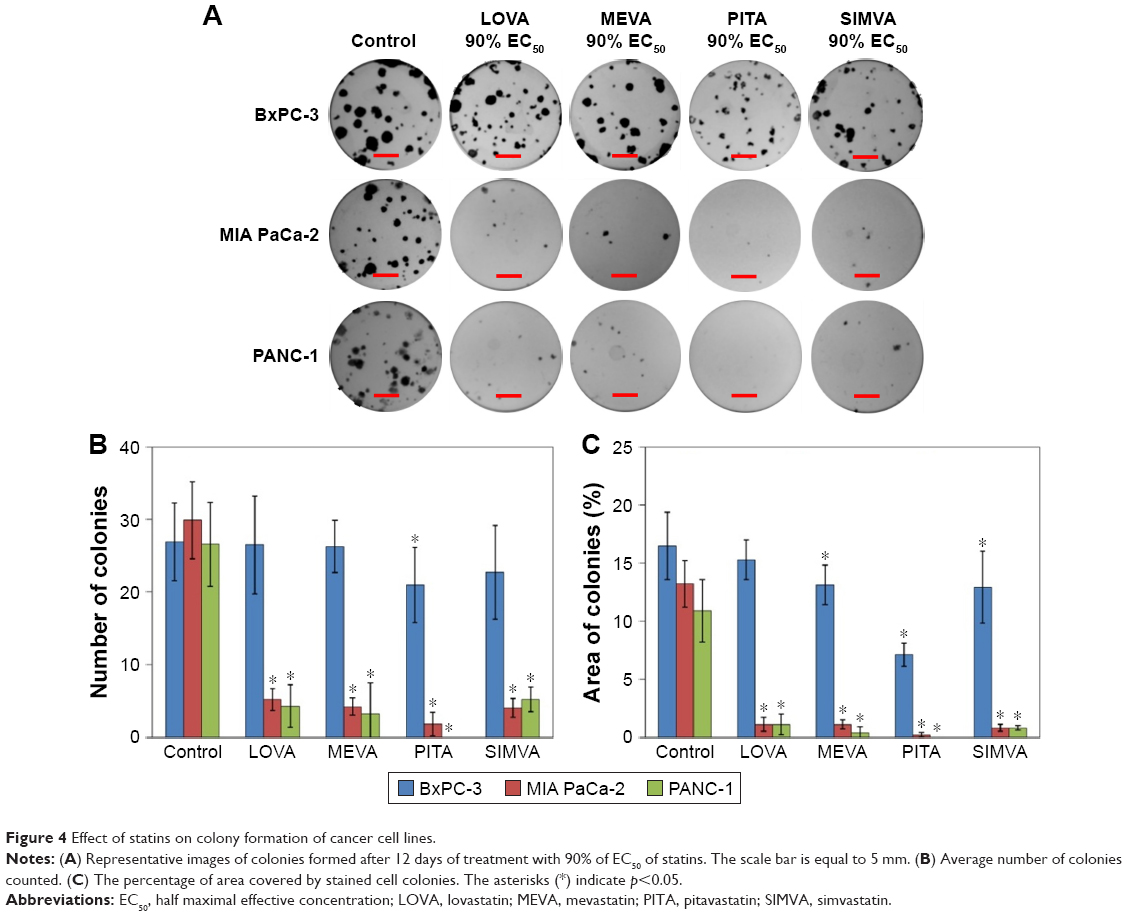 | Figure 4 Effect of statins on colony formation of cancer cell lines. |
The effect of statins on cell apoptosis and necrosis is concentration-dependent
We found that at low concentrations (10% of EC50), statins caused neither apoptosis nor necrosis of cancer cells, while at higher concentrations (50% and 90% of EC50) the number of apoptotic cells in all three cell lines significantly increased (Figure 5A). Moreover, statins at concentrations close to 90% of EC50 started activating the necrotic processes. Intensity of apoptosis and necrosis was depended not only on the concentration of statins, but on the cell line too. The greater number of apoptotic and necrotic cells was determined in MIA PaCa-2 and PANC-1 cell lines than in BxPC-3 cells. Also, different results among statins were observed. PITA showed the strongest effect on induction of the apoptosis in BxPC-3 and PANC-1 cell lines (Figure 5B). On the other hand, no difference among statins was found in MIA PaCa-2 cell line. PITA and SIMVA caused the highest necrosis rates in PANC-1 cells, while there was no significant difference in the number of necrotic cells in other two cell lines (Figure 5C).
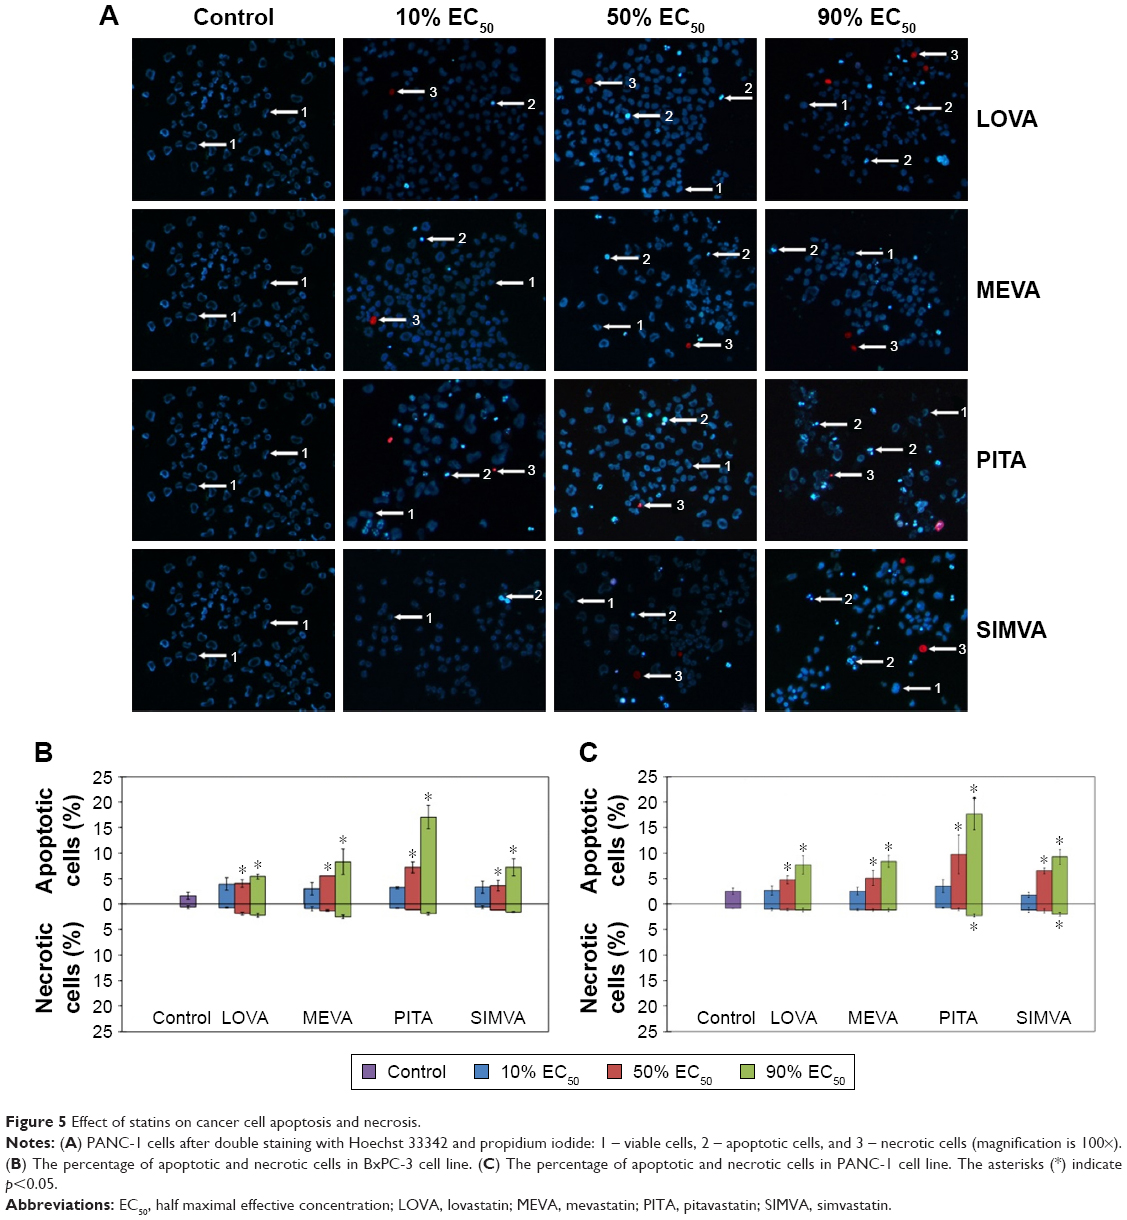 | Figure 5 Effect of statins on cancer cell apoptosis and necrosis. |
Discussion
Recent studies show that statins exert antineoplastic effects against multiple types of cancer, such as breast,13 colon,14 and prostate cancer.15 According to other studies, statins have antiproliferative activity;16 they induce apoptosis by activation of caspases17 and proapoptotic proteins such as Bax18 and by reduction of antiapoptotic proteins such as Bcl-2 and Bcl-xl.19 Furthermore, they exert antimetastatic effects.20 It was shown that only lipophilic, not hydrophilic statins, such as rosuvastatin and pravastatin, possess the anticancer activity.16,21
In our study, PITA showed the highest anticancer activity. These results are consistent with the findings of Istvan and Igel that PITA is the most effective inhibitor of HMG-CoA reductase compared to other three statins: SIMVA and LOVA are slightly less potent and MEVA has the weakest enzyme inhibitory activity.22,23 It is also known that due to their structural characteristics, type II statins, including PITA, form more interactions with HMG-CoA reductase and have a stronger binding affinity to this enzyme, compared to type I statins, such as SIMVA, LOVA, and MEVA.24
PITA has also been reported to possess a strong antiproliferative activity against other cancer lines. According to Jiang, PITA, as well as cerivastatin, triggered the most pronounced inhibitory effect on proliferation of glioblastoma and breast cancer cells: after 72 h, EC50 values in different cell lines varied from 0.1 to 7.3 μM.25
The correlation was noticed between the results in 2D (MTT test) and 3D cell culture models (tumor spheroids): PITA had the strongest effect on spheroid growth, SIMVA and LOVA were less potent, and MEVA showed the weakest activity. However, statins had greater potency in 2D monolayer cultures than in 3D spheroid cultures. Longati et al26 have found that some drugs such as gemcitabine, alicin, or microtubule inhibitors also exerted weaker activity in 3D cell cultures compared to those in 2D.
To our knowledge, no studies have been conducted to evaluate the effects of statins on the colony formation of human pancreatic cancer cells. Nevertheless, there are some data showing that statins reduce the colony formation of various other types of cancer cells. You et al27 have found that 0.5 and 1 μM concentrations of PITA inhibit the colony formation of hepatic cancer cells. Also, Jung et al28 determined that 0.1 μM concentration of SIMVA suppress the clonogenicity of breast cancer cell lines.
Furthermore, in our study we found that statins induce cell death mostly through apoptosis. However, at concentrations close to 90% of determined EC50 values, necrotic processes become activated too. In other research, it has been estimated that 10 μM SIMVA induced apoptosis of colon cancer cells, whereas 50 μM SIMVA significantly increased the number of late apoptotic and necrotic cells.14 According to the literature, lipophilicity of statins is essential to trigger cell apoptosis. Kato and Smalley29 found that lipophilic statins LOVA and SIMVA at concentrations of 1 and 10 μM caused apoptosis of ovarian and cervical cancer cells; however, hydrophilic statin pravastatin did not show this effect.
Conclusion
In conclusion, statins exert anticancer activity in pancreatic cancer cell lines. The most potent and the most promising statin was PITA, for which it is worth carrying out further comprehensive studies of anticancer therapy.
Disclosure
The authors report no conflicts of interest in this work.
References
Ferlay J, Soerjomataram I, Dikshit R, et al. Cancer incidence and mortality worldwide: sources, methods and major patterns in GLOBOCAN 2012. Int J Cancer. 2015;136(5):E359–E386. | ||
Ducreux M, Cuhna AS, Caramella C, et al. Cancer of the pancreas: ESMO Clinical Practice Guidelines for diagnosis, treatment and follow-up. Ann Oncol. 2015;26(suppl 5):v56–v68. | ||
Carrato A, Falcone A, Ducreux M, et al. A systematic review of the burden of pancreatic cancer in Europe: real-world impact on survival, quality of life and costs. J Gastrointest Cancer. 2015;46(3):201–211. | ||
McKenney JM. Pharmacologic characteristics of statins. Clin Cardiol. 2003;26(4 Suppl 3):III32–III38. | ||
Wang CY, Liu PY, Liao JK. Pleiotropic effects of statin therapy: molecular mechanisms and clinical results. Trends Mol Med. 2008;18(9):1199–1216. | ||
Osmak M. Statins and cancer: current and future prospects. Cancer Lett. 2012;324(1):1–12. | ||
Kubatka P, Kruzliak P, Rotrekl V, Jelinkova S, Mladosievicova B. Statins in oncological research: from experimental studies to clinical practice. Crit Rev Oncol Hematol. 2014;92(3):296–311. | ||
Berndt N, Hamilton AD, Sebti SM. Targeting protein prenylation for cancer therapy. Nat Rev Cancer. 2011;11(11):775–791. | ||
Tseng H, Gage JA, Shen T, et al. A spheroid toxicity assay using magnetic 3D bioprinting and real-time mobile device-based imaging. Sci Rep. 2015;5(1):13987. | ||
Li H, Fan X, Houghton J. Tumor microenvironment: The role of the tumor stroma in cancer. J Cell Biochem. 2007;101(4):805–815. | ||
Afratis N, Gialeli C, Nikitovic D, et al. Glycosaminoglycans: Key players in cancer cell biology and treatment. FEBS J. 2012;279(7):1177–1197. | ||
Fallahi-Sichani M, Honarnejad S, Heiser LM, Gray JW, Sorger PK. Metrics other than potency reveal systematic variation in responses to cancer drugs. Nat Chem Biol. 2013;9(11):708–714. | ||
Liu S, Uppal H, Demaria M, Desprez PY, Campisi J, Kapahi P. Simvastatin suppresses breast cancer cell proliferation induced by senescent cells. Sci Rep. 2015;5:17895. | ||
Cho SJ, Kim JS, Kim JM, Lee JY, Jung HC, Song IS. Simvastatin induces apoptosis in human colon cancer cells and in tumor xenografts, and attenuates colitis-associated colon cancer in mice. Int J Cancer. 2008;123:951–957. | ||
Hoque A, Chen H, Xu XC. Statin induces apoptosis and cell growth arrest in prostate cancer cells. Cancer Epidemiol Biomarkers Prev. 2008;17(1):88–94. | ||
Brown M, Hart C, Tawadros T, et al. The differential effects of statins on the metastatic behaviour of prostate cancer. Br J Cancer. 2012;106(10):1689–1696. | ||
Nishida S, Matsuoka H, Tsubaki M, et al. Mevastatin induces apoptosis in HL60 cells dependently on decrease in phosphorylated ERK. Mol Cell Biochem. 2005;269(1–2):109–114. Available from: http://www.ncbi.nlm.nih.gov/pubmed/15786722 | ||
Yongjun Y, Shuyun H, Lei C, Xiangrong C, Zhilin Y, Yiquan K. Atorvastatin suppresses glioma invasion and migration by reducing microglial MT1-MMP expression. J Neuroimmunol. 2013;260(1–2):1–8. | ||
Campbell MJ, Esserman LJ, Zhou Y, et al. Breast cancer growth prevention by statins. 2006;66(17):8707–8714. | ||
Sławińska-Brych A, Zdzisińska B, Kandefer-Szerszeń M. Fluvastatin inhibits growth and alters the malignant phenotype of the C6 glioma cell line. Pharmacol Reports. 2014;66(1):121–129. | ||
Robinson E, Nandi M, Wilkinson LL, Arrowsmith DM, Curtis ADM, Richardson A. Preclinical evaluation of statins as a treatment for ovarian cancer. Gynecol Oncol. 2013;129(2):417–424. | ||
Istvan ES, Deisenhofer J. Structural mechanism for statin inhibition of HMG-CoA reductase. Science. 2001;292(5519):1160–1164. | ||
Igel M, Sudhop T, von Bergmann K. Pharmacology of 3-hydroxy-3-methylglutaryl-coenzyme A reductase inhibitors (statins), including rosuvastatin and pitavastatin. J Clin Pharmacol. 2002;42(8):835–845. | ||
Istvan E. Statin inhibition of HMG-CoA reductase: A 3-dimensional view. Atheroscler Suppl. 2003;4(1):3–8. | ||
Jiang P, Mukthavaram R, Chao Y, et al. In vitro and in vivo anticancer effects of mevalonate pathway modulation on human cancer cells. Br J Cancer. 2014;111(8):1562–1571. | ||
Longati P, Jia X, Eimer J, et al. 3D pancreatic carcinoma spheroids induce a matrix-rich, chemoresistant phenotype offering a better model for drug testing. BMC Cancer. 2013;13(1):95. | ||
You HY, Zhang WJ, Xie XM, Zheng ZH, Zhu HL, Jiang FZ. Pitavastatin suppressed liver cancer cells in vitro and in vivo. Onco Targets Ther. 2016;9:5383–5388. | ||
Jung HH, Lee SH, Kim JY, Ahn JS, Park YH, Im YH. Statins affect ETS1-overexpressing triple-negative breast cancer cells by restoring DUSP4 deficiency. Sci Rep. 2016;6:33035. | ||
Kato S, Smalley S, Sadarangani A, et al. Lipophilic but not hydrophilic statins selectively induce cell death in gynecological cancers expressing high levels of HMGCoA reductase. J Cell Mol Med. 2010;14(5):1180–1193. |
 © 2017 The Author(s). This work is published and licensed by Dove Medical Press Limited. The full terms of this license are available at https://www.dovepress.com/terms.php and incorporate the Creative Commons Attribution - Non Commercial (unported, v3.0) License.
By accessing the work you hereby accept the Terms. Non-commercial uses of the work are permitted without any further permission from Dove Medical Press Limited, provided the work is properly attributed. For permission for commercial use of this work, please see paragraphs 4.2 and 5 of our Terms.
© 2017 The Author(s). This work is published and licensed by Dove Medical Press Limited. The full terms of this license are available at https://www.dovepress.com/terms.php and incorporate the Creative Commons Attribution - Non Commercial (unported, v3.0) License.
By accessing the work you hereby accept the Terms. Non-commercial uses of the work are permitted without any further permission from Dove Medical Press Limited, provided the work is properly attributed. For permission for commercial use of this work, please see paragraphs 4.2 and 5 of our Terms.