")
Back to Journals » International Journal of Nanomedicine » Volume 14
DIBc, a nanochelating-based nano metal-organic framework, shows anti-diabetic effects in high-fat diet and streptozotocin-induced diabetic rats
Authors Fakharzadeh S, Kalanaky S , Hafizi M , Nazaran MH , Zardooz H
Received 26 November 2018
Accepted for publication 8 February 2019
Published 27 March 2019 Volume 2019:14 Pages 2145—2156
DOI https://doi.org/10.2147/IJN.S196050
Checked for plagiarism Yes
Review by Single anonymous peer review
Peer reviewer comments 2
Editor who approved publication: Prof. Dr. Anderson Oliveira Lobo
Saideh Fakharzadeh,1–3 Somayeh Kalanaky,2 Maryam Hafizi,2 Mohammad Hassan Nazaran,2 Homeira Zardooz1,3
1Department of Physiology, School of Medicine, Shahid Beheshti University of Medical Sciences, Tehran, Iran; 2Department of Research and Development, Sodour Ahrar Shargh Company, Tehran, Iran; 3Neurophysiology Research Center, Shahid Beheshti University of Medical Sciences, Tehran, Iran
Aims: Despite daily increase in diabetic patients in the world, currently approved medications for this disease, at best, only reduce its progression speed. Using novel technologies is a solution for synthetizing more efficient medicines. In the present study, we evaluated anti-diabetic effects of DIBc, a nano metal–organic framework, which is synthetized based on nanochelating technology.
Methods: High-fat diet and streptozotocin-induced diabetic rats were treated by DIBc or metformin for 6 weeks.
Results: DIBc decreased plasma glucose, triglyceride, cholesterol, high-density lipoprotein, and low-density lipoprotein compared with diabetic and metformin groups. In DIBc-treated rats, significant homeostasis model assessment of insulin resistance index, malondialdehyde, and tumor necrosis factor-α decrease was observed. H&E staining showed increased islet number and area in DIBc-treated rats compared with diabetic controls.
Conclusion: The results showed anti-diabetic effects of nanochelating-based framework. So DIBc, as a nano structure, has the capacity to be evaluated in future studies as a novel anti-diabetic agent.
Keywords: DIBc, nanochelating technology, metal organic framework, diabetes, streptozotocin, high-fat diet
Introduction
“Despite the significant scientific advances of the last century, diabetes remains a major health challenge across the world, is responsible for millions of deaths annually and limits many lives with life-threatening complications”.1 Unfortunately, the available drugs, including metformin, which is the first-line drug in diabetes, can only delay the disease progression.2
Other than that, hypoglycemic adverse effects, lactic acidosis, overweight, and liver dysfunction are the side effects in patients using these drugs.2,3 In many patients, after the treatments start, tolerance is seen, so it is necessary to combine multiple drug regimens to control the disease.4
Oxidative stress, inflammatory conditions (increase in inflammatory cytokines, eg, tumor necrosis factor [TNF]-α) and impaired metabolism of metal ions, such as iron, zinc, selenium, and magnesium are the factors involved in the initiation, progression, and development of diabetes and also its complications, which have already been investigated and proven by numerous studies.5–8
In recent years, nanotechnology and smart nano structures have shown considerable potential for a large number of biomedical applications like monitoring, diagnosis, repair, and treatment of human biological systems.9 Nanoscale metal–organic frameworks (NMOFs) are categorized as one group of hybrid materials, which are created by self-assembly of polydentate bridging ligands and metal-connecting points having a number of benefits compared with conventional nanomedicines, including their intrinsic biodegradability and structural and chemical variety.10,11
Nanochelating technology is a modern field capable of designing and synthetizing efficient nano structures by self-assembly method. In the previous studies, therapeutic aspects of nanochelating-based structures were evaluated in vitro and in vivo.12–15 In the current study, we assessed the effects of DIBc, a nanochelating-based NMOF on high-fat diet and streptozotocin (STZ)-induced diabetic rats.16,17 According to the beneficial effects of selenium, zinc, and chromium supplementation on diabetic patients and also diabetic animal models, the NMOF structure contained these elements.18–23 We compared anti-diabetic effects of DIBc NMOF with metformin as a first-line medication of diabetic patients and evaluated their effects on key blood parameters and pancreatic islets’ tissue as well as hepatic iron content.
Materials and methods
DIBc NMOF synthesis
Sodour Ahrar Shargh company designed and synthesized DIBc by using nanochelating technology, registered at USPTO (US20120100372A1). DIBc is a structure from the family of MOFs in which carboxylic ligands are used. The clusters used in it include chrome, zinc, and selenium. Due to the chelate form of these elements and their nanoscale and porous structure, they have taken a new spatial structure with new and specific properties. First, 3 g of Zn (NO3) and 1 g of CrO should be completely dissolved in distilled water. Then, the solution should be heated a little and kept, and stirred at 40°C for 15 minutes. After that, 20 g of carboxylic acid should be slowly added to the solution while it is still being stirred. After stirring is finished, 0.5 g of Na2SeO3 is added to let the reaction start. The heater should be turned off exactly when the exothermic reaction is finished and then the solution should be allowed to get mixed gently and lose its temperature during 8 hours so that it slowly reaches the temperature of the surrounding environment. The resulting solution contains nano MOFs of DIBc, which will be separated from the solution through dialysis and then dried slowly at 40–45°C.
Brunauer, Emmett and Teller (BET) test was done on this drug to specify its porosity; the test showed that the porosity of the drug is 4,460 m2/g, which is the best amount of porosity for carboxylic MOFs (Table 1).
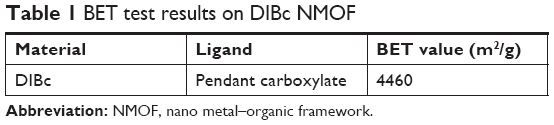 | Table 1 BET test results on DIBc NMOF |
High-resolution transmission electron microscopy (HRTEM)
DIBc HRTEM images were captured by a transmission electron microscope (Philips CM30-250KV model) in the University of Tehran Science and Technology Park.
Evaluation of DIBc toxicity
To assess the toxicity of DIBc, standard tests were carried out to evaluate the median lethal dose (LD50) according to the guidelines of the Organization for Economic Co-operation and Development (guideline 420), in the School of Pharmacy at Tehran University of Medical Sciences.
Animal model and treatment protocols
Male Wistar rats (150–180 g) were used in this study. The study started 1 week after animals’ environmental adaptation. All animals were maintained under 12-hour dark/light cycles with proper access to food and water, 3 animals in every polycarbonate conventional cages. The grouping pattern is shown in Table 2 and the time line of the study is shown in Figure 1. The high-fat diet consisted of 65% normal chow and 35% butter. The composition of normal chow and high-fat diet is shown in Table 3. Regular diet was given to normal control groups. Following 2 weeks of dietary intervention and 12 hours of fasting, the rats in groups C to G were injected intraperitoneally (i.p) with low dose of STZ (35 mg/kg, dissolved in 0.1 M sodium citrate buffer, pH 4.4), while the normal control group received injection of citrate buffer vehicle in a dose volume of 1 mL/kg. Fasting blood glucose was measured 3 weeks after the injection. The rats with fasting blood glucose levels >250 mg/dL were considered diabetic. The diabetic rats were divided into five groups: low (n=8), medium (n=8) and high dose (n=8) DIBc groups, Metformin (n=8), and control groups (n=8). All diabetic groups were fed on the high-fat diet for another 6 weeks. DIBc was dissolved in distilled water and injected i.p once a day during 6 weeks (Figure 1). Body weight and food and water intake were measured at weeks 5, 8, and 11 (Figure 1) by measuring the difference between food or water amount in the cage and the remaining amount after 24 hours. At the end of the study, rats were euthanized using an overdose of isoflurane anesthesia. All the animal studies were conducted according to the relevant national and international guidelines of Shahid Beheshti University of Medical Sciences for the care and use of laboratory animals and Shahid Beheshti University of Medical Sciences also approved the experiments (SBMU.REC.1392.73).
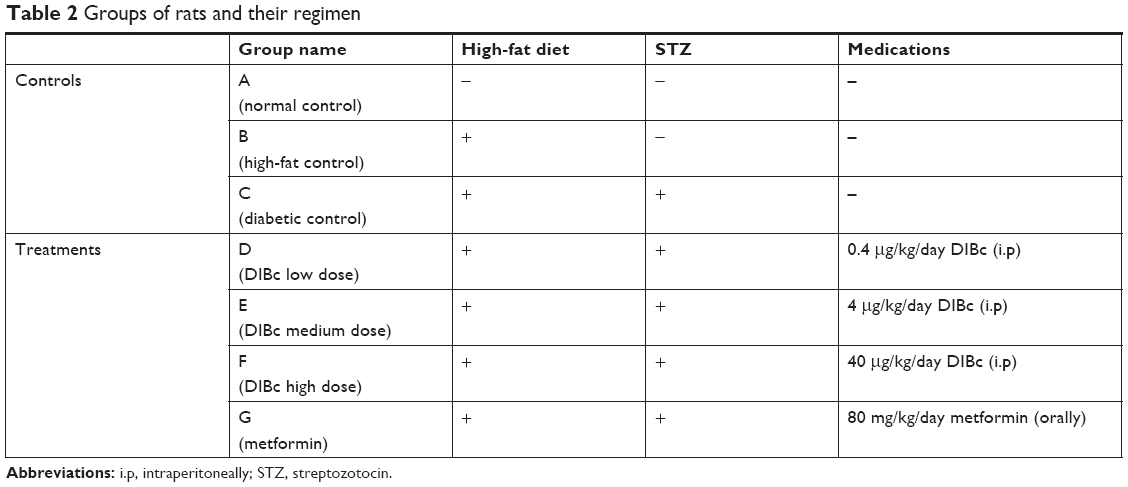 | Table 2 Groups of rats and their regimen |
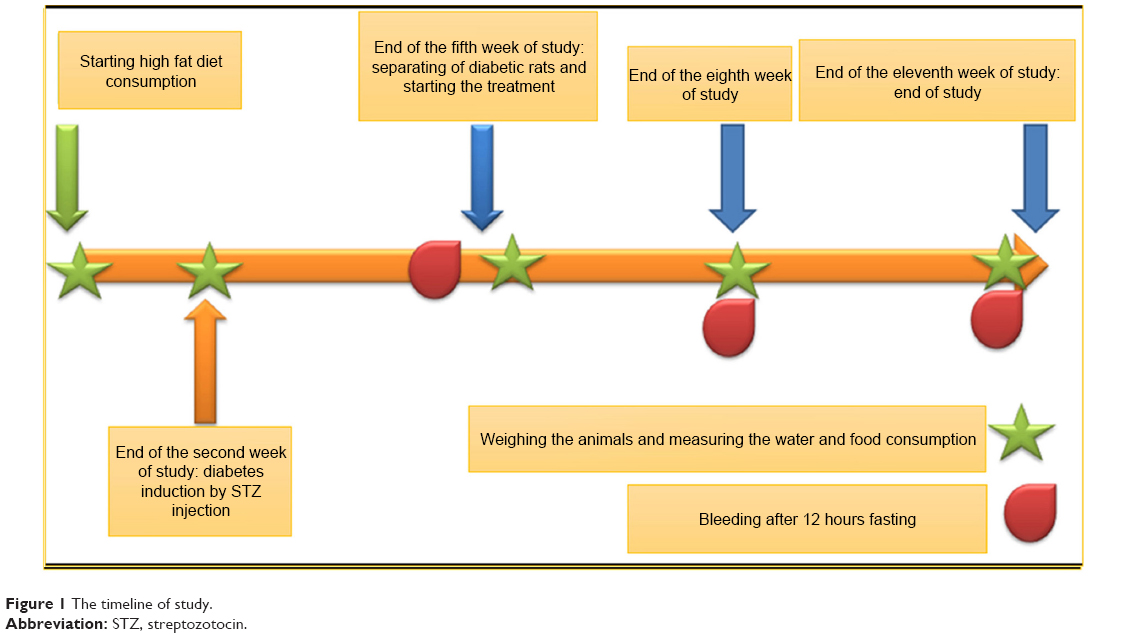 | Figure 1 The timeline of study. |
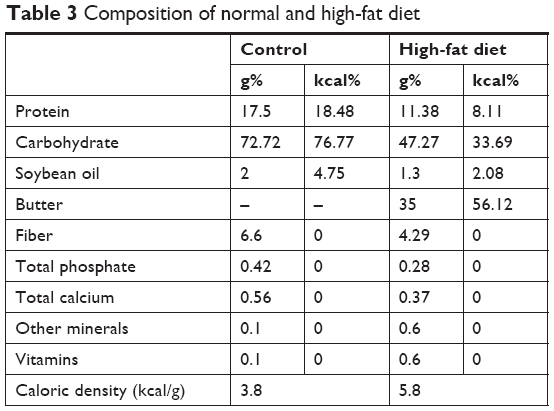 | Table 3 Composition of normal and high-fat diet |
Blood sampling and biochemical analysis
The sample collection was performed at weeks 5, 8, and 11 (Figure 1). The samples were put in micro tubes, which contained 0.5% heparin, centrifuged at 3,000 rpm for 5 minutes and then stored at -20°C for the analysis of glucose, insulin, total cholesterol (TC), triglycerides (TG), low-density lipoprotein (LDL), and high-density lipoprotein (HDL) (commercial ELISA kits, Pars Azmoon, Tehran, Iran). On the basis of fasting plasma insulin and glucose levels, homeostasis model assessment of insulin resistance (HOMA-IR) index was calculated according to the formula: HOMA-IR = fasting insulin (μg/L)× fasting blood glucose (mg/dL)/405.24,25 The contents of plasma malondialdehyde (MDA) and TNF-α (ELISA kits, Zellbio, Ulm, Germany) were determined by commercially available kits according to the manufacturer’s directions at week 11.
Hepatic iron level and the hematologic parameters
The blood samples collected at week 11 were used for hematologic parameters assay. The hepatic iron level and hematologic parameters were assayed based on the previous study.26
Histopathological examination of the pancreas
Optical microscopy was applied to conduct histopathological analyses on paraffin material. The fixation of pancreas tissue sections was carried out in 10% buffered formalin. After fixation, water was used to clean the sample, then it was soaked in 70% ethyl alcohol for 3–4 days and submerged in paraffin. Paraffin sections of 5 μm were obtained from rotational microtome and stained with H&E to evaluate the size and number of Langerhans islets.
Statistics
One-way ANOVA was performed followed by post hoc tests (Bonferroni’s test) for multiple comparisons. P-value of <0.05 was considered statistically significant.
Results
DIBc characteristics
Imaging and analytical characterization of nanoparticles by HRTEM is carried out to determine the nanoparticle size. The image of DIBc indicates that the size of the NMOF is almost 25–30 nm (Figure 2).
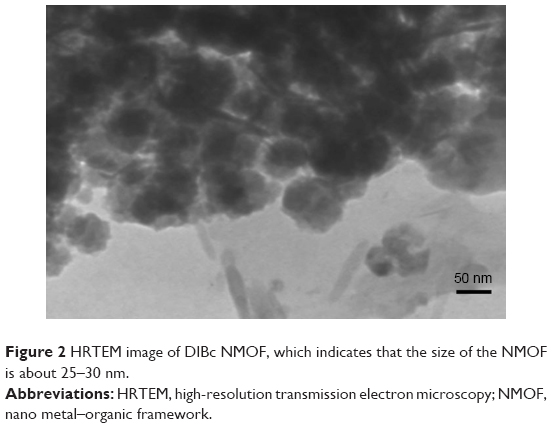 | Figure 2 HRTEM image of DIBc NMOF, which indicates that the size of the NMOF is about 25–30 nm. |
DIBc toxicity
DIBc toxicity report showed that intraperitoneal and oral LD50 of this NMOF was 37 and 130.5 mg/kg in mice, respectively.
DIBc effects on food and water intake and weight gain
The high-fat diet induced significant weight gain and decreased water intake in group B (High-fat diet group without STZ injection) compared with normal controls (P<0.05). The consumption of this diet decreased food intake, but it was not significant (Table 4). In group C (diabetic control group), STZ injection induced significant water intake and decreased weight gain (P<0.05).
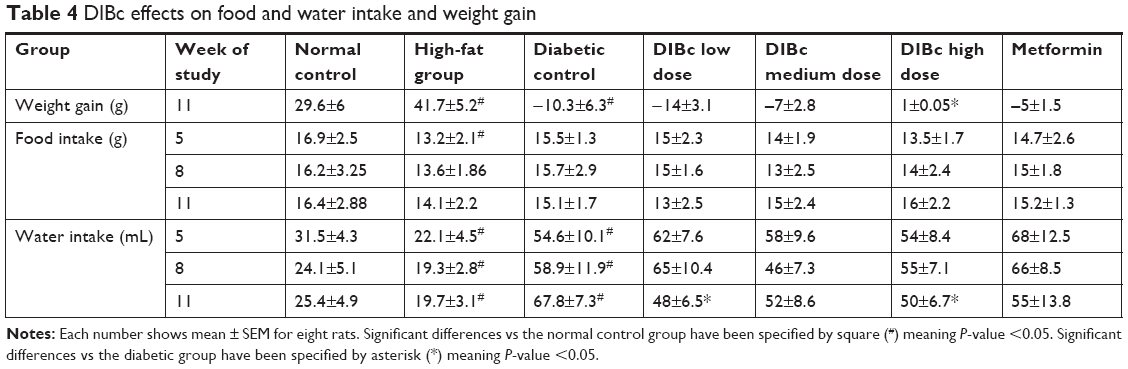 | Table 4 DIBc effects on food and water intake and weight gain |
DIBc in group D (low dose) significantly decreased water intake compared with group C (diabetic controls) (P<0.05). It had no significant effects on food intake and weight gain. DIBc in group E (medium dose) had no significant effects on weight gain, and water and food intake. The DIBc NMOF in group F (high dose) significantly increased weight gain and decreased water intake compared with group C (diabetic controls) (P<0.05). It had no significant effects on food intake (Table 4).
Metformin had no significant effects on water and food intake and weight gain compared with group C (diabetic controls).
DIBc effects on plasma glucose, insulin, TG, cholesterol, LDL, and HDL level
The high-fat diet induced significant increase in level of plasma glucose, insulin, TG, TC, LDL, and HDL (high fat diet group without STZ injection) compared with normal controls (P<0.05).
In group C (diabetic control group), STZ injection induced significant increase in level of plasma glucose, TG, TC, LDL, and HDL (P<0.05). At the end of week 5 and 8 of the study, significant increase in plasma insulin level was seen in this group, but at the end of the study (P<0.05), there was no significant difference between group C and A (Table 5).
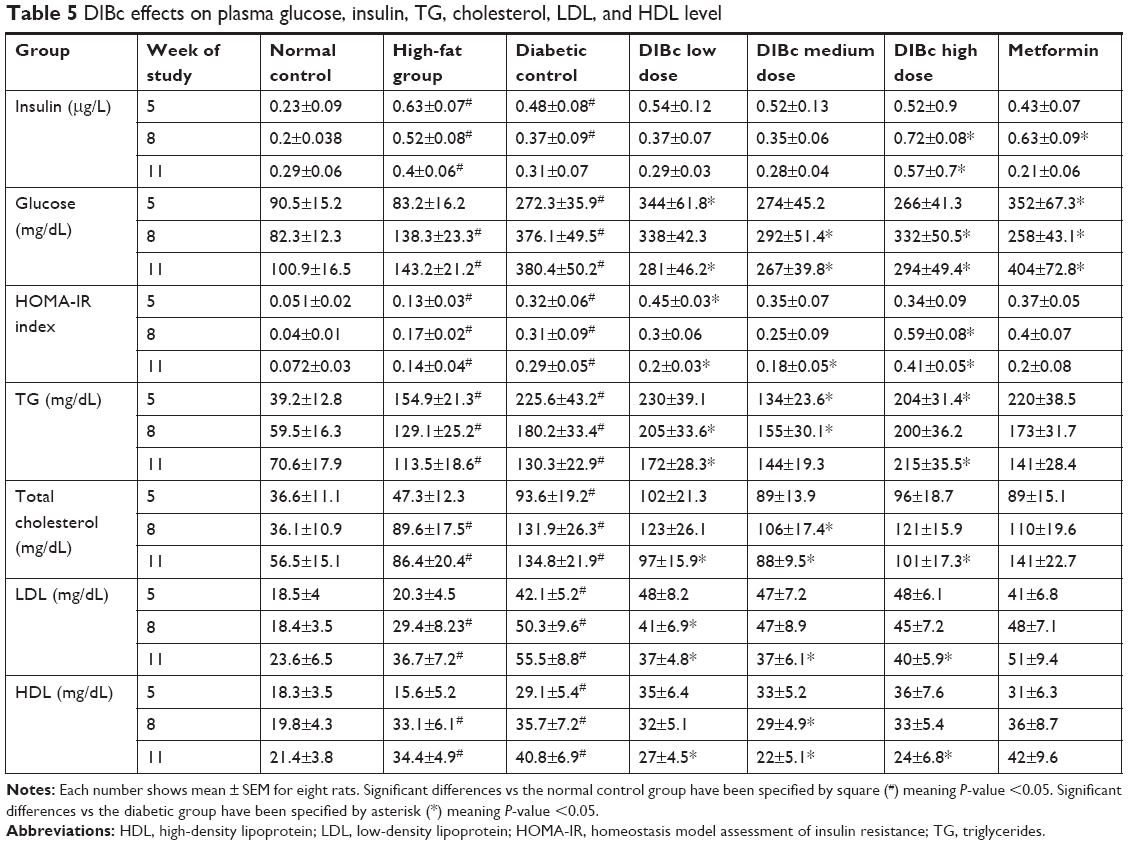 | Table 5 DIBc effects on plasma glucose, insulin, TG, cholesterol, LDL, and HDL level |
DIBc at all three doses significantly reduced glucose levels compared with diabetic control group (P<0.05). The high dose of DIBc increased insulin level compared with diabetic controls (P<0.05). This NMOF decreased HOMA-IR index at low and medium dose significantly (P<0.05), while it increased HOMA-IR index at high dose. The greatest hypoglycemic effect was observed in the low-dose group (Table 5 and Figure 3).
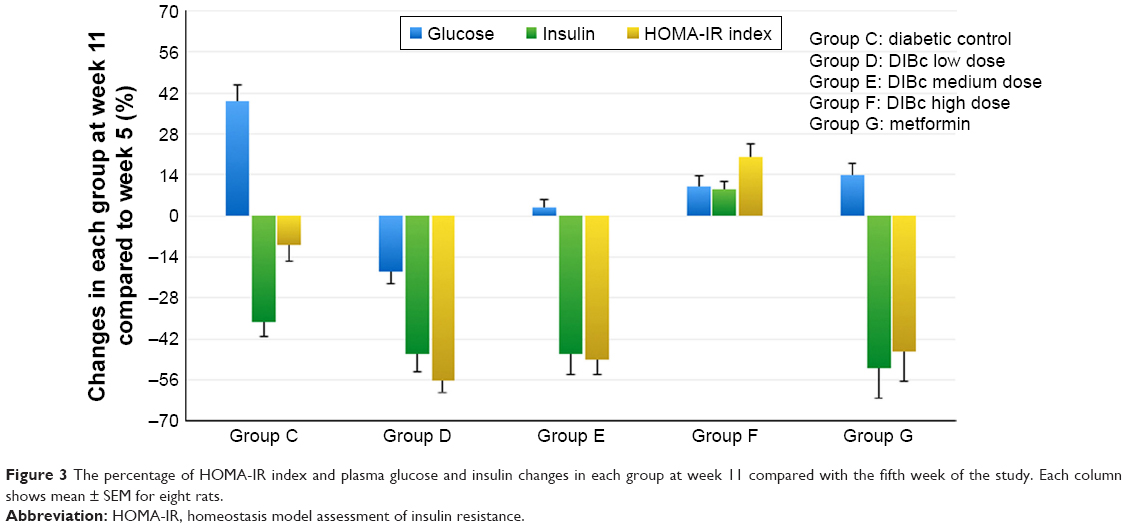 | Figure 3 The percentage of HOMA-IR index and plasma glucose and insulin changes in each group at week 11 compared with the fifth week of the study. Each column shows mean ± SEM for eight rats. |
DIBc in group D (low dose) significantly decreased plasma level of TG, TC, HDL, and LDL (Table 5) compared with group C (diabetic controls) (P<0.05). DIBc in group E (medium dose) significantly decreased plasma level of TC, HDL, and LDL compared with group C (diabetic controls) (P<0.05). It had no significant effects on plasma level of TG. The DIBc NMOF in group F (high dose) significantly decreased plasma level of TC, HDL, and LDL and increased TG level compared with group C (diabetic controls) (P<0.05).
At the end of the third week of the treatment (eighth week of the study, Figure 1), metformin significantly reduced glucose level (P<0.05). But at the end of the treatment (eleventh week of the study), glucose level increased significantly in this group (Table 5 and Figure 3), in a way that glucose level was significantly higher in metformin-treated group compared with group C (P<0.05). At the end of the study, insulin level and HOMA-IR index in the metformin group were lower than the diabetic control group, but not significant. Metformin had no significant effects on plasma level of TG, TC, HDL and LDL compared to group C (diabetic controls).
DIBc effects on plasma TNF-α and MDA level
In high-fat diet group (B), no significant change of TNF-α was seen compared with normal controls (Figure 4). But combination of high-fat diet and STZ injection increased TNF-α level significantly (P<0.05). DIBc significantly decreased this cytokine in three doses compared with diabetic controls (P<0.05)
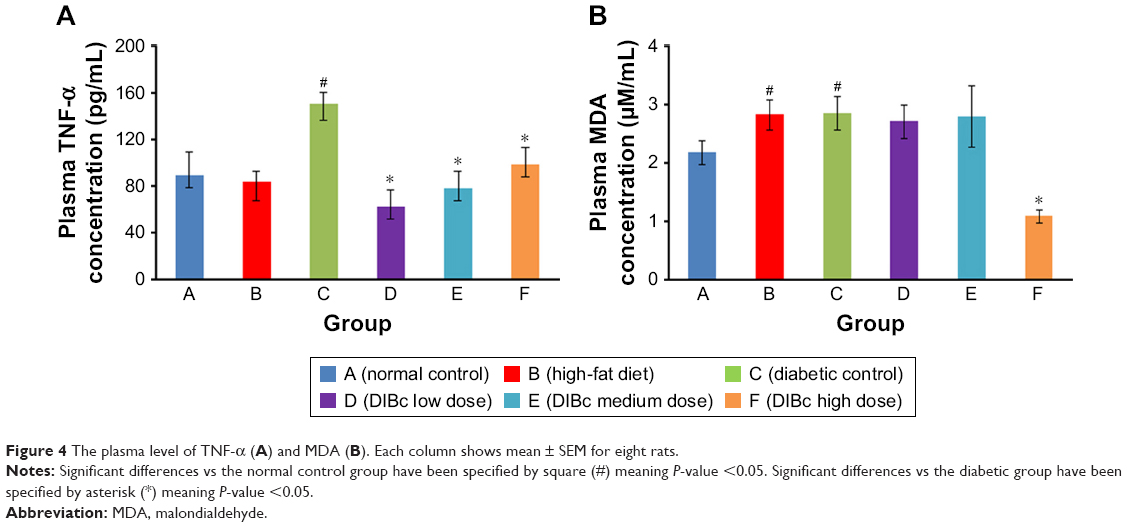 | Figure 4 The plasma level of TNF-α (A) and MDA (B). Each column shows mean ± SEM for eight rats. |
In high-fat diet (B) and diabetic groups, plasma MDA level increased (Figure 4) compared with normal control (P<0.05). DIBc high-dose treated rats had lower MDA concentration compared with diabetic controls (P<0.05).
DIBc effects on liver iron level and hematological indices
Liver iron level significantly increased in the high-fat diet group (Figure 5) compared with the normal control group (P<0.05). However, no significant difference in the liver iron level of all diabetic groups was observed (P<0.05).
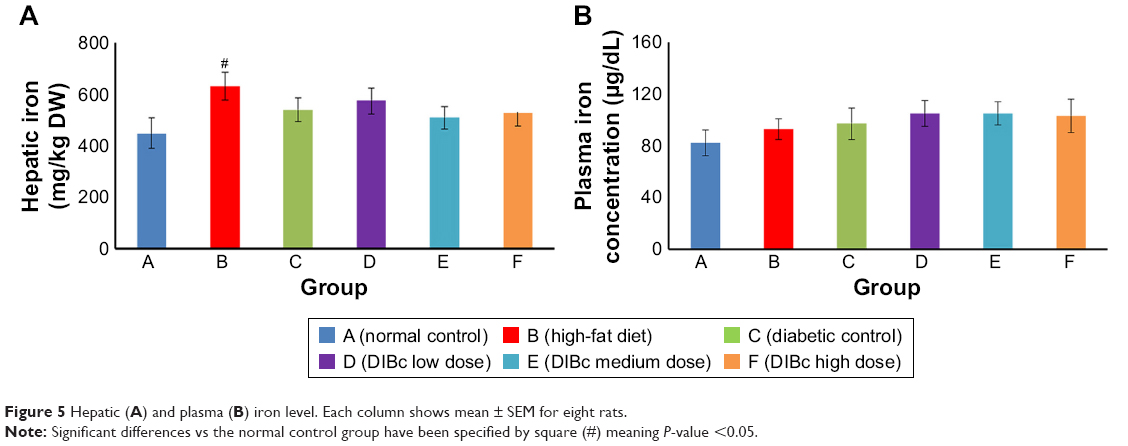 | Figure 5 Hepatic (A) and plasma (B) iron level. Each column shows mean ± SEM for eight rats. |
Hemoglobin concentration and mean corpuscular volume in different groups were not significantly different from each other (Figure 6). But the number of red blood cells and hematocrit percentage in the diabetic control group significantly decreased compared with the normal control group (P<0.05). DIBc significantly increased (P<0.05) the red blood cells count and hematocrit percentage compared with diabetic control group.
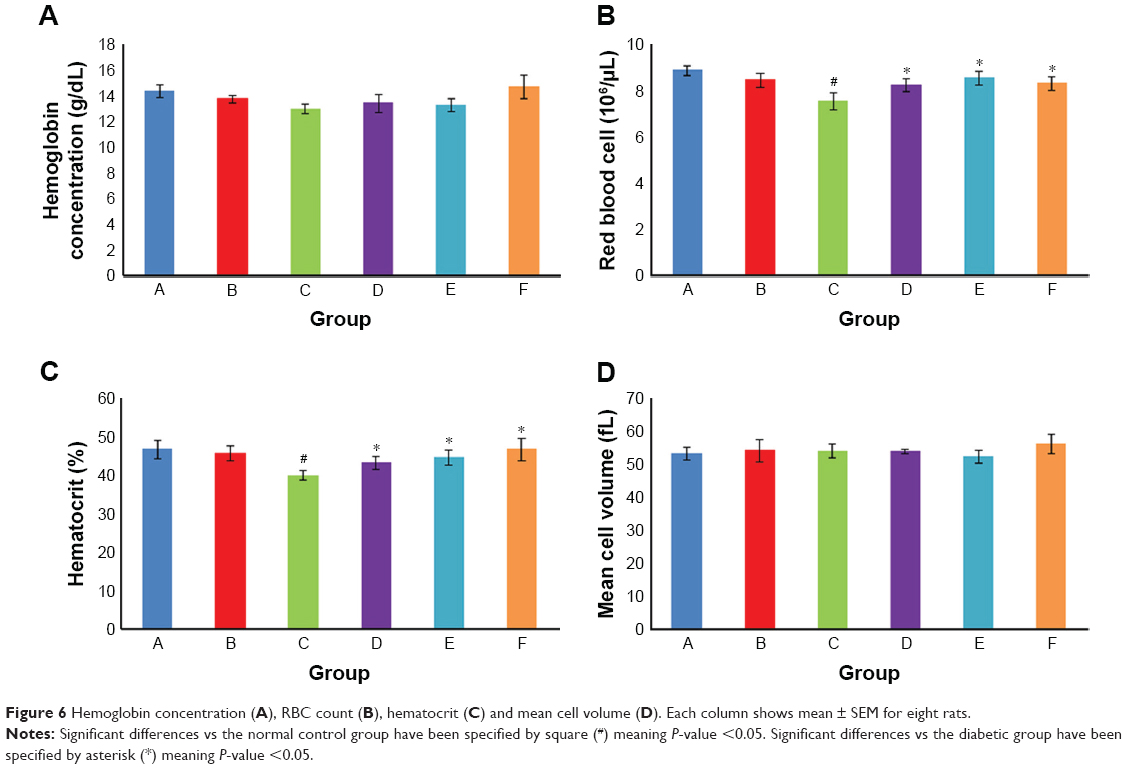 | Figure 6 Hemoglobin concentration (A), RBC count (B), hematocrit (C) and mean cell volume (D). Each column shows mean ± SEM for eight rats. |
DIBc effects on islet count and area
The results showed that the consumption of high-fat diet significantly increased the area of the islets of Langerhans in group B compared with the normal control group (P<0.05). The number of islets in the two groups was not significantly different from each other (Figures 7 and 8).
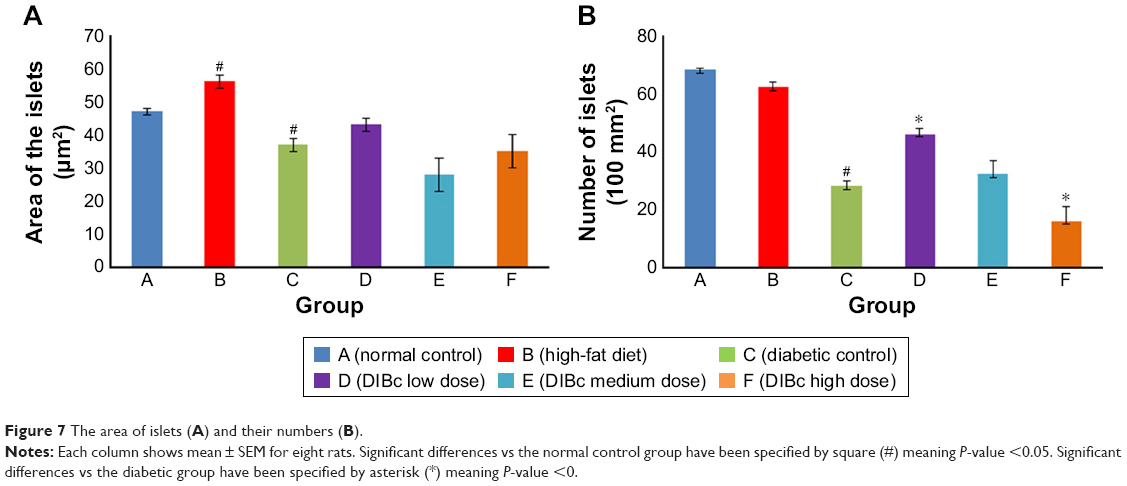 | Figure 7 The area of islets (A) and their numbers (B). |
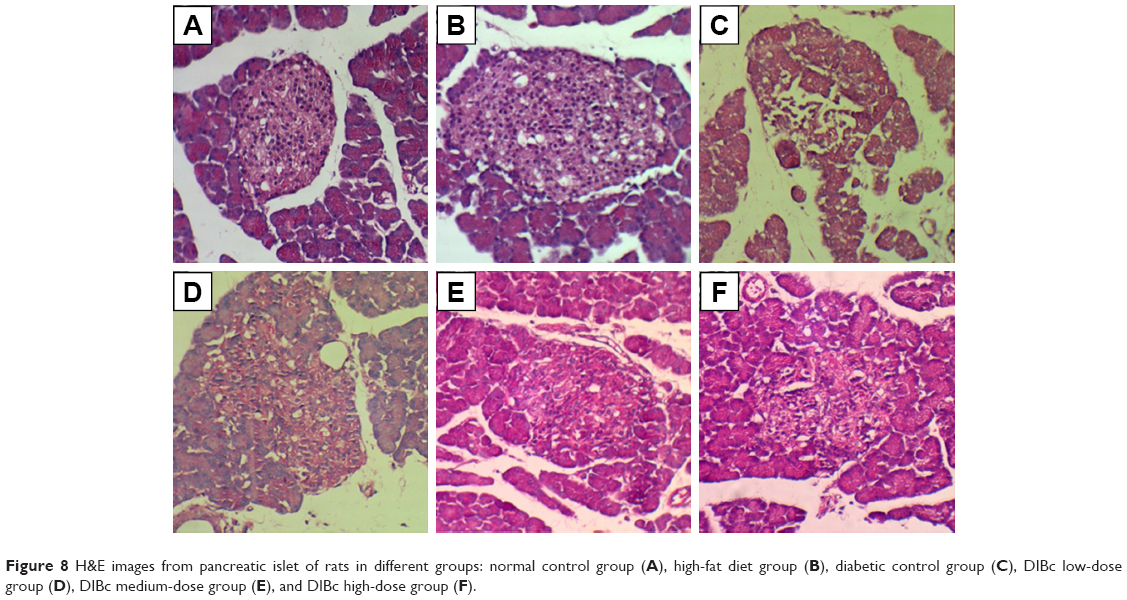 | Figure 8 H&E images from pancreatic islet of rats in different groups: normal control group (A), high-fat diet group (B), diabetic control group (C), DIBc low-dose group (D), DIBc medium-dose group (E), and DIBc high-dose group (F). |
The number and area of Langerhans islets in the diabetic control group decreased significantly (P<0.05). H&E stained samples of pancreatic islet in diabetic control group showed cells with degenerated hydropic cytoplasm in unclear boundaries.
Treatment with DIBc in low-dose group significantly increased the number and area of islets compared with diabetic control group (P<0.05). In the group treated with the intermediate dose of NMOF, no significant difference in these two parameters was observed compared with diabetic control group. In the group treated with high doses, the number of islets decreased compared with diabetic control group.
Discussion
The global spread of diabetes and disorders of glucose metabolism have strongly motivated the international communities to solve this problem. Also, the International Diabetes Federation has announced research on new medications as priorities.
Access to innovative technologies has opened new doors to designing efficient methods for the treatment of this disease. For example, by using nanocarriers, nanotechnology has introduced non-invasive methods for insulin therapy.27 Recently, in dozens of studies in animal models induced by STZ, with or without high-fat diet, multiple herbal or synthetic compounds have been evaluated compared with metformin. In many of these articles, like the study done by Ugochukwu and Babady, the tested compounds had similar anti-diabetic studies compared to metformin15,28 and a very small handful of studies have shown better effects than metformin.29 In the present study, the anti-diabetic effect of DIBc metal framework, synthesized based on the novel technology of nanochelating by self-assembly method, was evaluated in a diabetic animal model, and its higher therapeutic potency in controlling plasma glucose and lipids level was proved compared with metformin.
In the present animal model of diabetes, we used a combination of high-fat diet and low dose of STZ.16,30,31 In the pilot study, hyperinsulinemia appeared 2 weeks after high-fat diet consumption similar to the study by Skovsø.17 As shown in Table 5, the combination of high-fat diet and STZ induced hyperglycemia, hyperinsulinemia, and HOMA-IR index increase (as a parameter, which shows insulin resistance) at weeks 5, 8, and 11. So it can simulate diabetes disease in animals.
The NMOF reduced glucose level and insulin resistance at low and medium dose and suppressed hyperglycemic process at high dose, while increased HOMA-IR index at high dose. According to histopathological examination in the group treated with low dose of DIBc, the number and area of Langerhans islets were improved. It should be mentioned that studies have shown that nano structures evoke nonlinear responses in living systems and sometimes low vs high doses of a nanoparticle can exert effects in opposite directions.32 So in the present study, low, medium, and high doses showed different effects, and as mentioned previously, low dose of DIBc decreased HOMA-IR index and high dose increased it. But all three doses decreased plasma glucose compared with diabetic control group. Various studies have proved the link between oxidative stress and diabetes.33,34 Kamalakanthan et al in a diabetic model with STZ showed that the decrease in MDA is one of the mechanisms through which the complications of diabetes can be avoided.35 Also, studies show that, in people with diabetes, the level of inflammatory cytokines increases36 and a direct link has been found between chronic inflammation and diabetes.37 TNF-α was the first cytokine whose direct impact on the development of diabetes was detected.38 In the present study, DIBc in all doses decreased TNF-α and in high dose, reduced MDA level. So it seems that one mechanism of anti-diabetic effects of this NMOF can be its anti-oxidative and immunomodulatory effects (Figure 9). In the previous studies, it was revealed that nanochelating-based structures could protect cell viability against oxidative stress.13,39,40
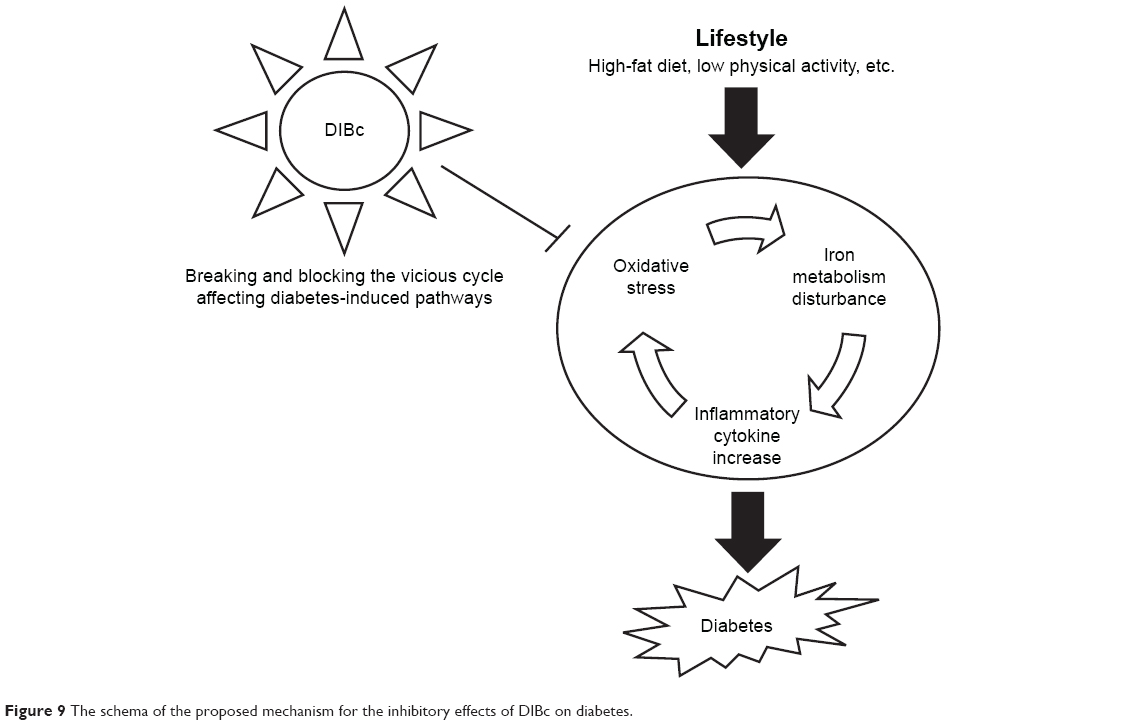 | Figure 9 The schema of the proposed mechanism for the inhibitory effects of DIBc on diabetes. |
Numerous studies have reported pivotal role of iron in diabetes and also its complications. Free iron can make a vicious cycle, which progresses more oxidative stress and more inflammation.41 So modification of iron metabolism and using structures with chelating property can be a candidate to affect this cycle.42 But it should be noted that due to the importance and vital physiological role of iron in the body, chelating the iron should not lead to the removal of this element. In diseases, such as diabetes, real iron overload does not exist and true purpose of chelating the iron should be redistribution of iron and not its disposal.43 In the present study, DIBc improved glucose and lipid metabolism in diabetic animals but did not have any negative effects on liver iron level and also hematological indices. So another benefit of DIBc metal framework is its chelating property. However, in the study by Kalanaky et al, in vitro and in vivo studies showed that another nanochelating-based structure, named TLc-A nano chelator, had greater performance in hepatic iron decrease than the commercially available and extensively used deferoxamine for iron removal in thalassemia models. The difference between structures comes from the technology, which is used for synthesis of the noted nano structures because self-assembly is defined as engineering the interactions among particles by functionalizing their surfaces chemically in a way that the desired structure is formed by this method. Self-assembly, as a strategy, is full of merits. This method can be used to perform the most difficult steps in nanofabrication such as atomic-level modification of structures by fully developed techniques of synthetic chemistry. Due to the need for target structures to be thermodynamically stable and open to the system, this method mostly produces defect-free and self-healing structures.44 So DIBc benefits from the advantages of this method of synthesis.
Treatment by DIBc in three doses decreased TC, HDL, and LDL, and in the group treated with low-dose plasma, TG level was also reduced. Studies show that high-fat diet, by increasing acetyl coenzyme A in the liver, increases the production of cholesterol in the body leading to increase in the plasma density of cholesterol, LDL, and HDL. Any disorders in insulin secretion or function and an increase in the density of free fatty acids cause the liver to pick the fatty acids in plasma and make more cholesterol. In this case, the density of plasma lipoproteins increases.45 In a survey conducted by Hayek et al, it was found that the consumption of high-fat diet increases HDL serum concentrations due to an increase in transferring speed and slows down the catabolism of HDL A-esters and apolipoprotein A-1.46 Nicholls et al found that dietary intake of saturated fatty acids results in disruption of anti-inflammatory properties of HDL.47 Thus, based on the findings of the present study, DIBc could improve fat metabolism in diabetic animals by reducing LDL, HDL, and TC levels. Metformin failed to decrease lipid profile in the present study. In the study by Erejuwa et al and also Salemi et al on diabetic rats, metformin could not decrease cholesterol and even increased it.48,49 Furthermore, in several clinical trials, metformin failure in decreasing TC level is reported.50 It is recommended that initiating metformin consumption soon after diabetes diagnosis is important to prevent failure of metformin monotherapy.50 As we started treatment 3 weeks after STZ injection in all groups, metformin failure may have been due to the starting time of treatment and also type of animal model. On the other hand, the role of supplementation of micronutrients like selenium, zinc, and chromium in lowering plasma lipids is mentioned in several studies.51–54 Moreover, Matthews et al showed that iron chelator deferiprone (L1) significantly decreased total plasma cholesterol and LDL cholesterol.55 Since DIBc has iron chelating property and contains selenium, zinc, and chromium, maybe its lowering effects on lipid parameters could be related to the previously mentioned items, but the exact mechanisms should be evaluated in future studies.
In numerous studies, beneficial effects of selenium, zinc, and chromium supplementation in diabetic patients and also diabetic animals were evaluated. In the study by Dkhil et al, they demonstrated the effects of selenium nanoparticles in attenuating diabetes-induced oxidative damage.19 Shahin et al, evaluated anti-diabetic effects of chromium picolinate and showed anti-diabetic activities of this supplement in high-fat diet and STZ animal model.56 Pattar et al reported that “chromium picolinate positively influences the glucose transporter system”.57 Also, Barman et al demonstrated that zinc supplementation can ameliorate the severity of diabetic hyperglycemia and insulin resistance in STZ-induced diabetic rats.21 So it seems that DIBc anti-glycemic effects and insulin sensitivity increase can be partially because of having these minerals.
Toxicity evaluation survey showed that DIBc i.p LD50 is equivalent to 37 mg/kg. The highest dose used in this study was 40 mg/kg. The highest dose used for this NMOF in the present study was >900 times less than LD50. DIBc low dose of the active ingredient proves it as a biocompatible NMOF.
In conclusion, the DIBc showed anti-diabetic effects, probably through its antioxidant, iron chelating properties and also delivery of three beneficial elements: zinc, selenium, and chromium. Even, its anti-diabetic effects were more potent than metformin and could be considered a novel anti-diabetic agent, which should be further evaluated in future studies. Because this is the first study on DIBc NMOF, we could only evaluate anti-diabetic effects of this nanostructure. In further studies, it is needed to study the pharmacokinetic and pharmacodynamics of DIBc, the effects of DIBc on complications (nephropathy, neuropathy, etc.) of diabetes and also other detailed mechanisms of this nano structure.
Data sharing statement
The datasets generated during the current study are available from the corresponding author on reasonable request.
Acknowledgment
We thank the Department of Research and Development at Sodour Ahrar Shargh and the Department of Physiology at School of Medicine, Shahid Beheshti University of Medical Sciences, for their kind support in this project.
Disclosure
The authors report no conflicts of interest in this work.
References
https://www.idf.org [homepage on the Internet]. Strategic Implementation Plan. International Diabetes Federation; 2016. Available from: https://www.idf.org/component/attachments/?task=download&id=394. Accessed March 20, 2016. | ||
Rojas LBA, Gomes MB. Metformin: an old but still the best treatment for type 2 diabetes. Diabetol Metab Syndr. 2013;5(1):6. | ||
Raz I, Eldor R. Rational therapy for diabetes: early recognition of adverse effects and avoidance of disruptive false alarms. Diabetes Metab Res Rev. 2012;28(4):321–324. | ||
Chen ZC, Zhang SL, Yan L, Wu MC, Chen LH, Ji LN. Association between side effects of oral anti-diabetic drugs and self-reported mental health and quality of life among patients with type 2 diabetes. Zhonghua Yi Xue Za Zhi. 2011;91(4):229–233. | ||
Tahrani AA, Piya MK, Kennedy A, Barnett AH. Glycaemic control in type 2 diabetes: targets and new therapies. Pharmacol Ther. 2010;125(2):328–361. | ||
Foster M, Samman S. Zinc and regulation of inflammatory cytokines: implications for cardiometabolic disease. Nutrients. 2012;4(7):676–694. | ||
Zheng Y, Li XK, Wang Y, Cai L. The role of zinc, copper and iron in the pathogenesis of diabetes and diabetic complications: therapeutic effects by chelators. Hemoglobin. 2008;32(1–2):135–145. | ||
Domingueti CP, Dusse LM, Carvalho M, de Sousa LP, Gomes KB, Fernandes AP. Diabetes mellitus: the linkage between oxidative stress, inflammation, hypercoagulability and vascular complications. J Diabetes Complications. 2016;30(4):738–745. | ||
He J, Qi X, Miao Y, Wu HL, He N, Zhu JJ. Application of smart nanostructures in medicine. Nanomedicine. 2010;5(7):1129–1138. | ||
Dincă M, Long JR. Hydrogen storage in microporous metal-organic frameworks with exposed metal sites. Angew Chem Int Ed. 2008;47(36):6766–6779. | ||
Rowsell JLC, Yaghi OM. Strategies for hydrogen storage in metal-organic frameworks. Angew Chem Int Ed. 2005;44(30):4670–4679. | ||
Kalanaky S, Hafizi M, Safari S, et al. TLc-A, the leading nanochelating-based nanochelator, reduces iron overload in vitro and in vivo. Int J Hematol. 2016;103(3):274–282. | ||
Fakharzadeh S, Sahraian MA, Hafizi M, et al. The therapeutic effects of Msc1 nanocomplex, synthesized by nanochelating technology, on experimental autoimmune encephalomyelitic C57/BL6 mice. Int J Nanomedicine. 2014;9:3841–3853. | ||
Reis CP, Damgé C. Nanotechnology as a promising strategy for alternative routes of insulin delivery. Methods Enzymol. 2012;508:271–294. | ||
Ugochukwu NH, Babady NE. Antihyperglycemic effect of aqueous and ethanolic extracts of Gongronema latifolium leaves on glucose and glycogen metabolism in livers of normal and streptozotocin-induced diabetic rats. Life Sci. 2003;73(15):1925–1938. | ||
Srinivasan K, Viswanad B, Asrat L, Kaul CL, Ramarao P. Combination of high-fat diet-fed and low-dose streptozotocin-treated rat: a model for type 2 diabetes and pharmacological screening. Pharmacol Res. 2005;52(4):313–320. | ||
Skovsø S. Modeling type 2 diabetes in rats using high fat diet and streptozotocin. J Diabetes Investig. 2014;5(4):349–358. | ||
Febiyanto N, Yamazaki C, Kameo S, et al. Effects of selenium supplementation on the diabetic condition depend on the baseline selenium status in KKAy mice. Biol Trace Elem Res. 2018;181(1):71–81. | ||
Dkhil M, Zrieq R, Al-Quraishy S, Abdel Moneim A. Selenium nanoparticles attenuate oxidative stress and testicular damage in streptozotocin-induced diabetic rats. Molecules. 2016;21(11):1517. | ||
Jayawardena R, Ranasinghe P, Galappatthy P, Malkanthi R, Constantine G, Katulanda P. Effects of zinc supplementation on diabetes mellitus: a systematic review and meta-analysis. Diabetol Metab Syndr. 2012;4(1):13. | ||
Barman S, Srinivasan K. Zinc supplementation alleviates hyperglycemia and associated metabolic abnormalities in streptozotocin-induced diabetic rats. Can J Physiol Pharmacol. 2016;94(12):1356–1365. | ||
San Mauro-Martin I, Ruiz-León AM, Camina-Martín MA, et al. Chromium supplementation in patients with type 2 diabetes and high risk of type 2 diabetes: a meta-analysis of randomized controlled trials. Nutr Hosp. 2016;33(1):27. | ||
Sundaram B, Aggarwal A, Sandhir R. Chromium picolinate attenuates hyperglycemia-induced oxidative stress in streptozotocin-induced diabetic rats. J Trace Elem Med Biol. 2013;27(2):117–121. | ||
Antunes LC, Elkfury JL, Jornada MN, Foletto KC, Bertoluci MC. Validation of HOMA-IR in a model of insulin-resistance induced by a high-fat diet in Wistar rats. Arch Endocrinol Metab. 2016;60(2):138–142. | ||
Al-Trad B, Alkhateeb H, Alsmadi W, Al-Zoubi M. Eugenol ameliorates insulin resistance, oxidative stress and inflammation in high fat-diet/streptozotocin-induced diabetic rat. Life Sci. 2019;216:183–188. | ||
Karunakaran U, Park KG. A systematic review of oxidative stress and safety of antioxidants in diabetes: focus on islets and their defense. Diabetes Metab J. 2013;37(2):106–112. | ||
Sharma G, Sharma AR, Nam JS, Doss GPC, Lee SS, Chakraborty C. Nanoparticle based insulin delivery system: the next generation efficient therapy for type 1 diabetes. J Nanobiotechnol. 2015;13(1):74. | ||
Vianna R, Brault A, Martineau LC, Couture R, Arnason JT, Haddad PS. In vivo anti-diabetic activity of the ethanolic crude extract of Sorbus decora C.K.Schneid. (Rosacea): a medicinal plant used by Canadian James Bay Cree Nations to treat symptoms related to diabetes. Evid Based Complement Alternat Med. 2011;2011:237941. | ||
Xie W, Zhao Y, Gu D, Du L, Cai G, Zhang Y. Scorpion in combination with gypsum: novel antidiabetic activities in streptozotocin-induced diabetic mice by up-regulating pancreatic PPAR-γ and PDX-1 expressions. Evid Based Complement Alternat Med. 2011;2011(3):1–9. | ||
Ali SM, Khalifa H, Mostafa DK, El Sharkawy A. Suppression of connective tissue growth factor mediates the renoprotective effect of sitagliptin rather than pioglitazone in type 2 diabetes mellitus. Life Sci. 2016;153:180–187. | ||
Srimaroeng C, Ontawong A, Saowakon N, et al. Antidiabetic and renoprotective effects of Cladophora glomerata Kutzing extract in experimental type 2 diabetic rats: a potential nutraceutical product for diabetic nephropathy. J Diabetes Res. 2015;2015:320167. | ||
Bell IR, Ives JA, Wayne BJ, Jonas WB. Nonlinear effects of nanoparticles: biological variability from hormetic doses, small particle sizes, and dynamic adaptive interactions. Dose Response. 2014;12(2):202–232. | ||
Maritim AC, Sanders RA, Watkins JB. Diabetes, oxidative stress, and antioxidants: a review. J Biochem Mol Toxicol. 2003;17(1):24–38. | ||
Nourooz-Zadeh J, Rahimi A, Tajaddini-Sarmadi J, et al. Relationships between plasma measures of oxidative stress and metabolic control in NIDDM. Diabetologia. 1997;40(6):647–653. | ||
Kamalakkannan N, Prince PSM. Antihyperglycaemic and antioxidant effect of rutin, a polyphenolic flavonoid, in streptozotocin-induced diabetic Wistar rats. Basic Clin Pharmacol Toxicol. 2006;98(1):97–103. | ||
Maiorino MI, Bellastella G, Giugliano D, Esposito K. From inflammation to sexual dysfunctions: a journey through diabetes, obesity, and metabolic syndrome. J Endocrinol Invest. 2018;41(11):1249–1258. | ||
El-Refaei MF, Abduljawad SH, Alghamdi AH. Alternative medicine in diabetes – role of angiogenesis, oxidative stress, and chronic inflammation. Rev Diabet Stud. 2014;11(3–4):231–244. | ||
Hotamisligil GS, Shargill NS, Spiegelman BM. Adipose expression of tumor necrosis factor-alpha: direct role in obesity-linked insulin resistance. Science. 1993;259(5091):87–91. | ||
Hafizi M, Hajarizadeh A, Atashi A, et al. Nanochelating based nanocomplex, GFc7, improves quality and quantity of human mesenchymal stem cells during in vitro expansion. Stem Cell Res Ther. 2015;6(1):226. | ||
Maghsoudi A, Fakharzadeh S, Hafizi M, et al. Neuroprotective effects of three different sizes nanochelating based nano complexes in MPP(+) induced neurotoxicity. Apoptosis. 2015;20(3):298–309. | ||
Hubler MJ, Peterson KR, Hasty AH. Iron homeostasis: a new job for macrophages in adipose tissue? Trends Endocrinol Metab. 2015;26(2):101–109. | ||
Lehmann C, Islam S, Jarosch S, et al. The utility of iron chelators in the management of inflammatory disorders. Mediators Inflamm. 2015;2015(3):1–12. | ||
Kakhlon O, Breuer W, Munnich A, Cabantchik ZI. Iron redistribution as a therapeutic strategy for treating diseases of localized iron accumulation. Can J Physiol Pharmacol. 2010;88(3):187–196. | ||
Freddy C, Adams CB. Nanoscience, nanotechnology and spectrometry. Spectrochim Acta Part B Atomic Spectrosc. 2013;86(3):3–13. | ||
Guyton AC, Hall JE. Guyton and Hall Textbook of Medical Physiology (Guyton Physiology).11th ed. Philadelphia: Saunders; 2006. | ||
Hayek T, Ito Y, Azrolan N, et al. Dietary fat increases high density lipoprotein (HDL) levels both by increasing the transport rates and decreasing the fractional catabolic rates of HDL cholesterol ester and apolipoprotein (Apo) A-I. Presentation of a new animal model and mechanistic studies in human Apo A-I transgenic and control mice. J Clin Invest. 1993;91(4):1665–1671. | ||
Nicholls SJ, Lundman P, Harmer JA, et al. Consumption of saturated fat impairs the anti-inflammatory properties of high-density lipoproteins and endothelial function. J Am Coll Cardiol. 2006;48(4):715–720. | ||
Erejuwa OO, Sulaiman SA, Wahab MS, Sirajudeen KN, Salleh MS, Gurtu S. Glibenclamide or metformin combined with honey improves glycemic control in streptozotocin-induced diabetic rats. Int J Biol Sci. 2011;7(2):244–252. | ||
Salemi Z, Rafie E, Goodarzi MT, Ghaffari MA. Effect of metformin, acarbose and their combination on the serum visfatin level in nicotinamide/streptozocin-induced type 2 diabetic rats. Iran Red Crescent Med J. 2016;18(3):e23814. | ||
Brown JB, Conner C, Nichols GA. Secondary failure of metformin monotherapy in clinical practice. Diabetes Care. 2010;33(3):501–506. | ||
Wang N, Tan HY, Li S, Xu Y, Guo W, Feng Y. Supplementation of micronutrient selenium in metabolic diseases: its role as an antioxidant. Oxid Med Cell Longev. 2017;2017:7478523. | ||
Ghaffari T, Nouri M, Irannejad E, Rashidi MR. Effect of vitamin E and selenium supplement on paraoxonase-1 activity, oxidized low density lipoprotein and antioxidant defense in diabetic rats. Bioimpacts. 2011;1(2):121–128. | ||
Ranasinghe P, Wathurapatha WS, Ishara MH, et al. Effects of zinc supplementation on serum lipids: a systematic review and meta-analysis. Nutr Metab. 2015;12(1):26. | ||
Sundaram B, Singhal K, Sandhir R. Anti-atherogenic effect of chromium picolinate in streptozotocin-induced experimental diabetes. J Diabetes. 2013;5:43–50. | ||
Matthews AJ, Vercellotti GM, Menchaca HJ, et al. Iron and atherosclerosis: inhibition by the iron chelator deferiprone (L1). J Surg Res. 1997;73(1):35–40. | ||
Sahin K, Tuzcu M, Orhan C, et al. Anti-diabetic activity of chromium picolinate and biotin in rats with type 2 diabetes induced by high-fat diet and streptozotocin. Br J Nutr. 2013;110(2):197–205. | ||
Pattar GR, Tackett L, Liu P, Elmendorf JS. Chromium picolinate positively influences the glucose transporter system via affecting cholesterol homeostasis in adipocytes cultured under hyperglycemic diabetic conditions. Mutat Res. 2006;610(1–2):93–100. |
 © 2019 The Author(s). This work is published and licensed by Dove Medical Press Limited. The full terms of this license are available at https://www.dovepress.com/terms.php and incorporate the Creative Commons Attribution - Non Commercial (unported, v3.0) License.
By accessing the work you hereby accept the Terms. Non-commercial uses of the work are permitted without any further permission from Dove Medical Press Limited, provided the work is properly attributed. For permission for commercial use of this work, please see paragraphs 4.2 and 5 of our Terms.
© 2019 The Author(s). This work is published and licensed by Dove Medical Press Limited. The full terms of this license are available at https://www.dovepress.com/terms.php and incorporate the Creative Commons Attribution - Non Commercial (unported, v3.0) License.
By accessing the work you hereby accept the Terms. Non-commercial uses of the work are permitted without any further permission from Dove Medical Press Limited, provided the work is properly attributed. For permission for commercial use of this work, please see paragraphs 4.2 and 5 of our Terms.