")
Back to Journals » Drug Design, Development and Therapy » Volume 11
Development of highly potent melanogenesis inhibitor by in vitro, in vivo and computational studies
Authors Abbas Q, Ashraf Z, Hassan M, Nadeem H, Latif M , Afzal S, Seo S
Received 20 March 2017
Accepted for publication 8 May 2017
Published 5 July 2017 Volume 2017:11 Pages 2029—2046
DOI https://doi.org/10.2147/DDDT.S137550
Checked for plagiarism Yes
Review by Single anonymous peer review
Peer reviewer comments 2
Editor who approved publication: Dr Sukesh Voruganti
Qamar Abbas,1 Zaman Ashraf,2 Mubashir Hassan,1 Humaira Nadeem,3 Muhammad Latif,4 Samina Afzal,5 Sung-Yum Seo1
1Department of Biology, College of Natural Sciences, Kongju National University, Gongju, Republic of Korea; 2Department of Chemistry, Allama Iqbal Open University, Islamabad, 3Riphah Institute of Pharmaceutical Sciences, Riphah International University, Islamabad, Pakistan; 4Center for Genetics and Inherited Diseases, Taibah University, Almadinah Almunawwarah, Kingdom of Saudi Arabia; 5Faculty of Pharmacy, Bahauddin Zakria University, Multan, Pakistan
Abstract: The present work describes the synthesis of few hydroxylated amide derivatives as melanogenesis inhibitors. In vitro, in vivo and computational studies proved that compound 6d is a highly potent melanogenesis inhibitor compared to standard kojic acid. The title amides 4a–e and 6a–e were synthesized following simple reaction routes with excellent yields. Most of the synthesized compounds exhibited good mushroom tyrosinase inhibitory activity, but compound 6d showed excellent activity (IC50 0.15 µM) compared to standard kojic acid (IC50 16.69 µM). Lineweaver–Burk plots were used for the determination of kinetic mechanism, and it was found that compounds 4c and 6d showed non-competitive inhibition while 6a and 6b showed mixed-type inhibition. The kinetic mechanism further revealed that compound 6d formed irreversible complex with the target enzyme tyrosinase. The Ki values determined for compounds 4c, 6a, 6b and 6d are 0.188, 0.84, 2.20 and 0.217 µM respectively. Results of human tyrosinase inhibitory activity in A375 human melanoma cells showed that compound 6d exhibited 91.9% inhibitory activity at a concentration of 50 µg/mL. In vivo cytotoxicity evaluation of compound 6d in zebrafish embryos showed that it is non-toxic to zebrafish. Melanin depigmentation assay performed in zebrafish indicated that compound 6d possessed greater potential in decreasing melanin contents compared to kojic acid at the same concentration. Computational studies also supported the wet lab findings as compound 6d showed a highest binding affinity with the target protein (PDBID: 2Y9X) with a binding energy value of -7.90 kcal/mol. Molecular dynamic simulation studies also proved that amide 6d formed the most stable complex with tyrosinase. Based upon our in vitro, in vivo and computational studies, we propose that compound 6d is a promising candidate for the development of safe cosmetic agent.
Keywords: melanogenesis, computational studies, tyrosinase inhibition, zebrafish, melanin quantification
Introduction
Melanogenesis, the process of skin color formation, is controlled by a complex molecular regulatory network embedded in the keratinocytes and melanocytes, which results in the skin and hair pigmentation.1–3 Melanin biosynthesis in melanosomes is regulated by a copper-containing metalloenzyme tyrosinase. Tyrosine in the presence of tyrosinase is converted into melanin through a series of biochemical reactions.4,5 L-tyrosine and L-3,4-dihydroxyphenylalanine (L-DOPA) are the important substrates involved in melanin biosynthesis.6–8 The presence of melanins in the surrounding keratinocytes is the important factor that determines the color of the human skin.9,10
Ultraviolet exposure, α-melanocyte-stimulating hormone, melanocortin 1 receptor and agouti-related protein are some of the other factors involved in melanogenesis.11,12 Melanogenesis corresponds to a possible cellular danger and is confined to special melanosomes in melanocytes, which synthesize pigments and transfer them to recipient cells.13 The abnormal proliferation of melanocytes results in melanoma, a type of skin cancer.14,15 Melasma and post-inflammatory disorders are examples of hyperpigmentation disorders for which patients pursue treatment.16
Higher quantity of tyrosinase activity can also be linked to neurodegenerative diseases due to o-quinones formation by oxidation of dopamine results in neuronal damage and cell death.17–19 The agents that are clinically used for hyperpigmentation disorders are usually associated with side effects. Therefore, there arises a need to develop some novel melanogenesis inhibitors with decreased side effects. A number of hydroxy-substituted aromatic acids and esters have been reported as potent melanogensis inhibitors.20–23 Takahashi and Miyazawa also reported the potential of hydroxylated amides and analogues to potentially inhibit melanogenesis.24 The present work describes the synthesis of hydroxylated amides and their melanogenesis potency.
Materials and methods
Chemicals
2-amino-p-cymene, mushroom tyrosinase, L-DOPA and other required chemicals were purchased from Sigma-Aldrich, St Louis, MO, USA. Melting points were determined using a Digimelt MPA 160 melting point apparatus and are reported uncorrected. FTIR spectra were recorded using Shimadzu FTIR–8400S spectrometer (Kyoto, Japan; υ, cm−1). 1H NMR and 13C NMR spectra (DMSO-d6) were recorded using a Bruker 400 MHz spectrometer (Brüker Biospin, Switzerland). Chemical shifts (δ) were reported in parts per million (ppm) downfield from the internal standard tetramethylsilane. The purity of the compounds was checked by thin layer chromatography (TLC) on silica gel plate using n-hexane and ethyl acetate as mobile phase.
Synthesis of 2-chloro-N-[2-methyl-5-(propan-2-yl)phenyl]acetamide (2)
2-amino-p-cymene 1 (0.01 mol) and triethylamine (0.01 mol) were reacted with chloroacetyl chloride (0.01mol) in anhydrous dichloromethane (25 mL) at 0°C to −5°C. The reaction mixture was stirred over a period of 1 h at constant temperature. The reaction mixture was then stirred at room temperature for further 5 h and progress of the reaction was determined by TLC. The mixture was washed with 5% HCl and 5% sodium hydroxide solution; the organic layer was washed with saturated aqueous NaCl, dried over anhydrous magnesium sulfate, filtered and the solvent was removed under reduced pressure. The crude 2-chloro-N-[2-methyl-5-(propan-2-yl)phenyl]acetamide 2 was recrystallized in ethanol as needle-like crystals: melting point 94°C–96°C; yield 82%; Rf=0.54 (n-hexane: ethyl acetate 2:1); FTIR νmax cm−1: 3,354 (N–H), 2,987 (sp2 C–H), 2,893 (sp3 C–H), 1,656 (C=O ester), 1,598 (C=C aromatic), 1,140 (C–O, ester).
Synthesis of amide derivatives (4a–e) and (6a–e)
The hydroxy-substituted benzoic acids 3a–e (0.01 mol), triethyl amine (0.01 mol), potassium iodide (0.01 mol) in dimethyl formamide (25 mL) and intermediate 2 (0.01 mol) were stirred overnight at room temperature (Scheme 1). After the completion of reaction, the mixture was poured into finely crushed ice by stirring and extracted with ethyl acetate (4×25 mL). The combined organic layer was washed with 5% HCl, 5% sodium hydroxide and finally with aqueous NaCl solution. The organic layer was dried over anhydrous magnesium sulfate, filtered and the solvent was removed under reduced pressure to afford the crude products 4a–e. The title compounds 4a–e were purified by silica gel column chromatography (n-hexane: ethyl acetate 3:1). The compounds 6a–e were prepared by reacting intermediate 2 with substituted cinnamic acids 5a–e (Scheme 2). The reaction conditions were same as described for the preparation of compounds 4a–e.
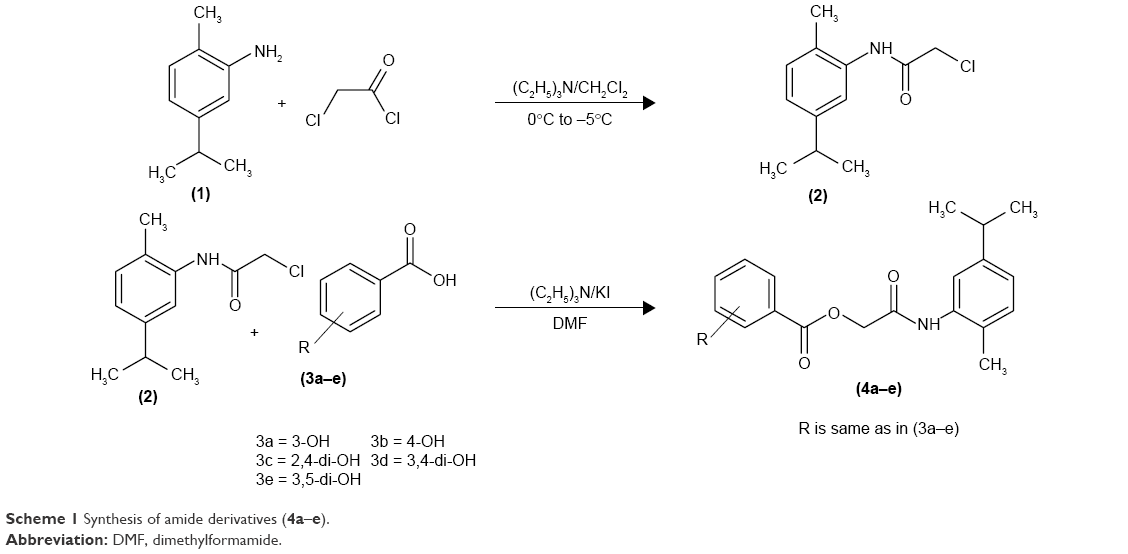 | Scheme 1 Synthesis of amide derivatives (4a–e). |
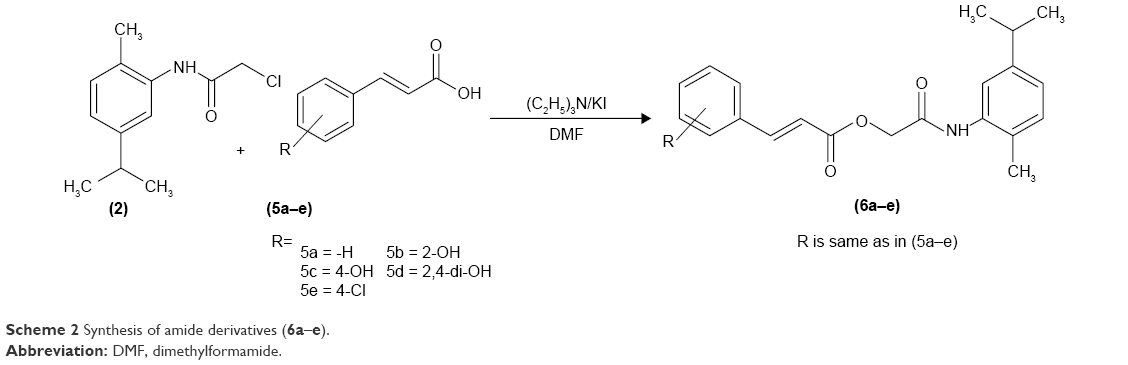 | Scheme 2 Synthesis of amide derivatives (6a–e). |
2-[2-methyl-5-(propan-2-yl)anilino]-2-oxoethyl 3-hydroxybenzoate (4a)
Yield, 85%; melting point, 116°C–118°C; Rf=0.56 (n-hexane:ethyl acetate 2:1); FTIR νmax cm−1: 3,354 (N–H), 3,166 (O–H), 2,987 (sp2 C–H), 2,913 (sp3 C–H), 1,735 (C=O ester), 1,657 (C=O amide), 1,590 (C=C aromatic), 1,149 (C–O, ester); 1H NMR (DMSO-d6, δ ppm): 8.63 (s, 1H, –NH), 7.76 (d, J=6.8 Hz, 1H, H-6), 7.52 (s, 1H, H-2), 7.42 (dd, J=6.8, 7.6 Hz, 1H, H-5), 7.36 (d, J=7.6 Hz, 1H, H-4), 7.14 (d, J=2.4 Hz, 1H, H-3′), 7.05 (d, J=7.6 Hz, 1H, H-4′), 6.96 (s, 1H, H-6′), 4.98 (s, 2H, –CH2), 3.06 (sept, 1H, J=6.5 Hz, H-1″), 2.32 (s, 3H, H-3″), 1.36 (s, 1H, –OH), 1.25 (d, J=6.5 Hz, 6H, H-2″); 13C NMR (CDCl3, δ ppm); 165.6 (C=O ester), 162.5 (C=O, amide), 152.4 (C-3), 144.7 (C-1′), 138.6 (C-2′), 136.4 (C-5′), 133.6 (C-6), 131.3 (C-2), 129.6 (C-1), 127.6 (C-3′), 124.5 (C-4′), 122.3 (C-6′), 120.8 (C-4), 116.4 (C-5), 60.3 (–CH2), 27.4 (C-1″), 26.5 (C-3″), 20.3 (C-2″).
2-[2-methyl-5-(propan-2-yl)anilino]-2-oxoethyl 4-hydroxybenzoate (4b)
Yield, 80%; melting point, 121°C–123°C; Rf=0.53 (n-hexane:ethyl acetate 2:1); FTIR νmax cm−1: 3,332 (N–H), 3,153 (O–H), 2,966 (sp2 C–H), 2,901 (sp3 C–H), 1,732 (C=O ester), 1,645 (C=O amide), 1,593 (C=C aromatic), 1,148 (C–O, ester); 1H NMR (DMSO-d6, δ ppm): 8.64 (s, 1H, –NH), 8.12 (dd, J=7.6, 2.4 Hz, 2H, H-2, H-6), 7.34 (d, J=2.2 Hz, 1H, H-2′), 7.19 (dd, J=7.6, 2.2 Hz, 1H, H-4′), 7.04 (d, J=7.6, 1H, H-6′), 6.92 (dd, J=7.6, 2.2 Hz, 2H, H-3, H-5), 5.01 (s, 2H, –CH2), 4.93 (s, 1H, –OH), 2.72 (sept, J=6.4 Hz, 1H, H-1″), 2.22 (s, 3H, –H-3″), 1.24 (d, J=6.4 Hz, 6H, H-2″); 13C NMR (DMSO-d6, δ ppm); 164.5 (C=O ester), 160.2 (C=O, amide), 154.5 (C-4), 149.7 (C-1′), 139.5 (C-2′), 136.5 (C-5′), 133.6 (C-3, C-5), 130.4 (C-1), 128.3 (C-3′), 126.4 (C-4′), 123.5 (C-6′), 119.4 (C-2, C-6), 61.4 (–CH2), 28.5 (C-1″), 26.8 (C-3″), 21.9 (C-2″).
2-[2-methyl-5-(propan-2-yl)anilino]-2-oxoethyl 2,4-dihydroxybenzoate (4c)
Yield, 78%; melting point, 136°C–138°C; Rf=0.44 (n-hexane:ethyl acetate 2:1); FTIR νmax cm−1: 3,364 (N–H), 3,163 (O–H), 2,966 (sp2 C–H), 2,895 (sp3 C–H), 1,728 (C=O ester), 1,651 (C=O amide), 1,590 (C=C aromatic), 1,160 (C–O, ester); 1H NMR (DMSO-d6, δ ppm): 8.64 (s, 1H, –NH), 7.64 (d, J=7.4 Hz, 1H, H-6), 7.19 (d, J=7.4 Hz, 1H, H-5), 7.11 (d, J=2.2 Hz, 1H, H-6′), 6.89 (s, 1H, H-3), 6.42 (d, J=7.6 Hz, 1H, H-3′), 6.31 (dd, J=7.6, 2.2 Hz, 1H, H-4′), 5.11 (s, 2H, –CH2), 4.67 (s, 2H, –OH), 2.850 (sept, J=7.1 Hz, 1H, H-1″), 2.09 (s, 3H, H-3″), 1.13 (d, J=7.1 Hz, 6H, H-2″); 13C NMR (DMSO-d6, δ ppm); 166.5 (C=O ester), 162.1 (C=O amide), 160.3 (C-2), 155.6 (C-4), 148.2 (C-1′), 138.5 (C-2′), 136.3 (C-5′), 134.6 (C-6), 129.9 (C-4′), 127.7 (C-3′), 120.8 (C-6′), 112.3 (C-3), 108.3 (C-5), 105.1 (C-1), 59.3 (–CH2), 29.1 (C-1″), 27.5 (C-3″), 20.5 (C-2″).
2-[2-methyl-5-(propan-2-yl)anilino]-2-oxoethyl 3,4-dihydroxybenzoate (4d)
Yield, 76%; melting point, 126°C–128°C; Rf=0.48 (n-hexane:ethyl acetate 2:1); FTIR νmax cm−1: 3,376 (N–H), 3,171 (O–H), 2,973 (sp2 C–H), 2,905 (sp3 C–H), 1,730 (C=O ester), 1,671 (C=O amide), 1,592 (C=C aromatic), 1,156 (C–O, ester); 1H NMR (DMSO-d6, δ ppm): 8.45 (s, 1H, –NH), 7.69 (d, J=2.4 Hz, 1H, H-2), 7.52 (dd, J=7.6, 2.4 Hz, 1H, H-6), 7.36 (d, J=7.4 Hz, 1H, H-5), 7.16 (d, J=1.4 Hz, 1H, H-5′), 6.89 (d, J=7.6 Hz, 1H, H-3′), 6.78 (dd, J=7.6, 1.4 Hz, 1H, H-4′), 4.96 (s, 2H, –CH2), 4.40 (s, 2H, –OH), 2.80 (sept, J=5.8 Hz, 1H, H-1″), 2.19 (s, 3H, H-3″), 1.19 (d, J=5.8 Hz, 6H, H-2″); 13C NMR (DMSO-d6, δ ppm); 169.6 (C=O ester), 162.7 (C=O amide), 152.3 (C-3), 146.7 (C-4), 142.5 (C-1′), 138.5 (C-2′), 134.5 (C-5′), 131.9 (C-6), 128.6 (C-4′), 123.7 (C-3′), 122.5 (C-6′), 119.6 (C-2), 116.7 (C-5), 114.8 (C-1), 60.2 (–CH2), 29.5 (C-1″), 24.5 (C-3″), 22.3 (C-2″).
2-[2-methyl-5-(propan-2-yl)anilino]-2-oxoethyl 3,5-dihydroxybenzoate (4e)
Yield, 84%; melting point, 143°C–145°C; Rf=0.45 (n-hexane:ethyl acetate 2:1); FTIR νmax cm−1: 3,385 (N–H), 3,154 (O–H), 2,954 (sp2 C–H), 2,893 (sp3 C–H), 1,731 (C=O ester), 1,643 (C=O amide), 1,590 (C=C aromatic), 1,160 (C–O, ester); 1H NMR (DMSO-d6, δ ppm): 8.49 (s, 1H, –NH), 7.33 (d, J=7.4 Hz, 1H, H-3′), 7.19 (d, J=7.4 Hz, 1H, H-4′), 6.98 (d, J=1.8 Hz, 2H, H-3, H-5), 6.87 (d, J=1.8 Hz, 1H, H-4), 6.67 (s, 1H, H-6′), 5.02 (s, 2H, –CH2), 4.62 (s, 2H, –OH), 2.83 (sept, J=6.2 Hz, 1H, H-1″), 2.20 (s, 3H, H-3″), 1.12 (d, J=6.2 Hz, 6H, H-2″); 13C NMR (DMSO-d6, δ ppm); 169.1 (C=O ester), 161.2 (C=O amide), 158.3 (C-3, C-5), 155.3 (C-1′), 149.0 (C-2′), 139.1 (C-5′), 133.9 (C-2, C-6), 130.1 (C-4′), 126.3 (C-3′), 123.1 (C-6′), 109.3 (C-4), 108.4 (C-1), 62.7 (–CH2), 25.5 (C-1″), 22.6 (C-3″), 19.6 (C-2″).
2-[2-methyl-5-(propan-2-yl)anilino]-2-oxoethyl (2E)-3-phenylprop-2-enoate (6a)
Yield, 86%; melting point, 138°C–140°C; Rf=0.62 (n-hexane:ethyl acetate 2:1); FTIR νmax cm−1: 3,381 (N–H), 2,951 (sp2 C–H), 2,898 (sp3 C–H), 1,729 (C=O ester), 1,665 (C=O amide), 1,597 (C=C aromatic), 1,148 (C–O, ester); 1H NMR (DMSO-d6, δ ppm): 8.21 (s, 1H, –NH), 7.62 (d, J=16.0 Hz, 1H, H-2), 7.48 (dd, J=7.2, 2.4 Hz, 2H, H-2′, H-6′), 7.35–7.39 (m, 3H, H-3′, H-4′, H-5′), 7.15 (d, J=7.2 Hz, 1H, H-3″), 7.01 (d, J=7.2 Hz, 1H, H-4″), 6.91 (s, 1H, H-6″), 6.61 (d, J=16.0 Hz, 1H, H-1), 4.97 (s, 2H, –CH2), 2.81 (sept, J=6.8 Hz, 1H, H-1′″), 2.28 (s, 3H, H-3′″), 1.21 (d, J=6.8 Hz, 6H, H-2′″); 13C NMR (DMSO-d6, δ ppm); 166.8 (C=O ester), 160.5 (C=O, amide), 151.3 (C-1″), 140.9 (C-2), 137.2 (C-2″), 135.3 (C-5″), 130.3 (C-2′, C-6′), 128.4 (C-3′, C-5′), 124.8 (C-4′), 123.5 (C-1′), 121.2 (C-3″), 119.2 (C-4″), 115.2 (C-6″), 60.5 (–CH2), 27.8 (C-1′″), 24.6 (C-3′″), 19.5 (C-2′″).
2-[2-methyl-5-(propan-2-yl)anilino]-2-oxoethyl (2E)-3-(2-hydroxyphenyl)prop-2-enoate (6b)
Yield, 82%; melting point, 190°C–192°C; Rf=0.54 (n-hexane:ethyl acetate 2:1); FTIR νmax cm−1: 3,365 (N–H), 3,138 (O–H), 2,965 (sp2 C–H), 2,895 (sp3 C–H), 1,738 (C=O ester), 1,673 (C=O amide), 1,595 (C=C aromatic), 1,162 (C–O, ester); 1H NMR (DMSO-d6, δ ppm): 8.24 (s, 1H, –NH), 7.83 (d, J=16.0 Hz, 1H, H-2), 7.62 (d, J=7.6, Hz, 2H, H-6′), 7.58 (dd, J=7.6, 2.2 Hz, 1H, H-4′), 7.42 (dd, J=7.6, 2.4 Hz, 2H, H-5′), 7.38 (d, J=7.6 Hz, 1H, H-3′), 7.18 (d, J=7.4 Hz, 1H, H-3″), 7.09 (d, J=7.4 Hz, 1H, H-4″), 6.91 (s, 1H, H-6″), 6.56 (d, J=16.0 Hz, 1H, H-1), 5.02 (s, 2H, –CH2), 3.13 (sept, J=7.1 Hz, 1H, H-1′″), 2.31 (s, 3H, H-3′″), 1.21 (d, J=7.1 Hz, 6H, H-2′″); 13C NMR (DMSO-d6, δ ppm); 165.9 (C=O ester), 162.2 (C=O, amide), 156.8 (C-1″), 147.2 (C-2), 141.3 (C-2″), 138.9 (C-5″), 129.4 (C-3′, C-5′), 127.3 (C-4′), 125.2 (C-1′), 121.5 (C-3″), 119.4 (C-4″), 114.3 (C-2′, C-6′), 111.1 (C-6″), 62.4 (–CH2), 28.4 (C-1′″), 25.4 (C-3′″), 21.8 (C-2′″).
2-[2-methyl-5-(propan-2-yl)anilino]-2-oxoethyl (2E)-3-(4-hydroxyphenyl)prop-2-enoate (6c)
Yield, 84%; melting point, 206°C–208°C; Rf=0.52 (n-hexane:ethyl acetate 2:1); FTIR νmax cm−1: 3,363 (N–H), 3,193 (O–H), 2,975 (sp2 C–H), 2,898 (sp3 C–H), 1,725 (C=O ester), 1,652 (C=O amide), 1,596 (C=C aromatic), 1,166 (C–O, ester); 1H NMR (DMSO-d6, δ ppm): 8.78 (s, 1H, –NH), 7.62 (d, J=16.0 Hz, 1H, H-2), 7.53 (dd, J=7.4, 2.2 Hz, 2H, H-2′, H-6′), 7.39 (dd, J=7.4, 2.2 Hz, 2H, H-3′, 5′), 7.19 (d, J=7.6 Hz, 1H, H-3″), 7.08 (d, J=7.6 Hz, 1H, H-4″), 6.98 (s, 1H, H-6″), 6.68 (d, J=16.0 Hz, 1H, H-1), 4.99 (s, 2H, –CH2), 2.98 (sept, J=6.2 Hz, 1H, H-1′″), 2.31 (s, 3H, H-3′″), 1.21 (d, J=6.2 Hz, 6H, H-2′″); 13C NMR (DMSO-d6, δ ppm); 166.3 (C=O ester), 161.3 (C=O, amide), 156.5 (C-1″), 142.8 (C-2), 139.5 (C-2″), 136.4 (C-5″), 132.5 (C-3′, C-5′), 130.4 (C-4′), 127.3 (C-1′), 121.6 (C-3″), 119.4 (C-4″), 117.5 (C-2′, C-6′), 112.7 (C-6″), 62.4 (–CH2), 28.4 (C-1′″), 25.5 (C-3′″), 21.4 (C-2′″).
2-[2-methyl-5-(propan-2-yl)anilino]-2-oxoethyl (2E)-3-(2,4-hydroxyphenyl)prop-2-enoate (6d)
Yield, 76%; melting point, 224°C–226°C; Rf=0.44 (n-hexane:ethyl acetate 2:1); FTIR νmax cm−1: 3,387 (N–H), 3,158 (O–H), 2,958 (sp2 C–H), 2,890 (sp3 C–H), 1,735 (C=O ester), 1,648 (C=O amide), 1,598 (C=C aromatic), 1,168 (C–O, ester); 1H NMR (DMSO-d6, δ ppm): 8.89 (s, 1H, –NH), 7.78 (d, J=16.0 Hz, 1H, H-2), 7.49 (d, J=7.2 Hz, 1H, H-6′), 7.43 (d, J=7.2 Hz, 1H, H-5′), 7.39 (s, 1H, H-3′), 7.19 (d, J=7.2 Hz, 1H, H-3″), 7.02 (d, J=6.6 Hz, 1H, H-4″), 6.94 (s, 1H, H-6″), 6.62 (d, J=16.0 Hz, 1H, H-1), 5.01 (s, 2H, –CH2), 3.21 (sept, J=6.8 Hz, 1H, H-1′″), 2.35 (s, 3H, H-3′″), 1.31 (d, J=7.2 Hz, 6H, H-2′″); 13C NMR (DMSO-d6, δ ppm); 166.3 (C=O ester), 160.2 (C=O, amide), 157.6 (C-1″), 147.9 (C-2), 146.2 (C-2″), 137.5 (C-5″), 130.5 (C-3′), 127.1 (C-5′), 126.4 (C-4′), 127.2 (C-1′), 125.5 (C-3″), 123.2 (C-4″), 121.6 (C-2′), 118.5 (C-6′), 112.7 (C-6″), 62.4 (–CH2), 27.3 (C-1′″), 26.3 (C-3′″), 21.3 (C-2′″).
2-[2-methyl-5-(propan-2-yl)anilino]-2-oxoethyl (2E)-3-(4-chlorophenyl)prop-2-enoate (6e)
Yield, 86%; melting point, 139°C–141°C; Rf=0.62 (n-hexane:ethyl acetate 2:1); FTIR νmax cm−1: 3,365 (N–H), 2,967 (sp2 C–H), 2,898 (sp3 C–H), 1,735 (C=O ester), 1,656 (C=O amide), 1,598 (C=C aromatic), 1,148 (C–O, ester); 1H NMR (DMSO-d6, δ ppm): 8.24 (s, 1H, –NH), 7.82 (d, J=16.0 Hz, 1H, H-2), 7.51 (d, J=7.6 Hz, 2H, H-2′, 6′), 7.36 (d, J=7.6 Hz, 1H, H-3″), 7.16 (d, J=7.6 Hz, 1H, H-4″), 6.98 (s, 1H, H-6″), 6.77 (d, J=7.6 Hz, 2H, H-3′, H-5′), 6.48 (d, J=16.0 Hz, 1H, H-1), 5.01 (s, 2H, –CH2), 3.11 (sept, J=5.8 Hz, 1H, H-1′″), 2.48 (s, 3H, H-3′″), 1.19 (d, J=5.8 Hz, 6H, H-2′″); 13C NMR (CDCl3, δ ppm); 167.6 (C=O ester), 161.3 (C=O, amide), 153.4 (C-1″), 148.8 (C-2), 137.6 (C-2″), 134.6 (C-5″), 131.8 (C-2′, C-6′), 129.5 (C-3′, C-5′), 127.9 (C-4′), 124.5 (C-1′), 122.5 (C-3″), 120.4 (C-4″), 118.3 (C-6″), 62.9 (–CH2), 29.4 (C-1′″), 25.6 (C-3′″), 22.3 (C-2′″).
Mushroom tyrosinase inhibition assay
Mushroom tyrosinase (Sigma-Aldrich, St Louis, MO, USA) inhibition was performed following our previously reported methods.25 In detail, 140 μL of phosphate buffer (20 mM, pH 6.8), 20 μL of mushroom tyrosinase (30 U/mL) and 20 μL of the inhibitor solution were placed in the wells of a 96-well microplate. After preincubation for 10 min at room temperature, 20 μL of L-DOPA (3,4-dihydroxyphenylalanine, Sigma-Aldrich) (0.85 mM) was added and the assay plate was further incubated at 25°C for 20 min. Afterwards, the absorbance of dopachrome was measured at 475 nm using a microplate reader (Optimax Max Tunable, Sunnyvale, CA, USA). Kojic acid was used as a reference inhibitor and phosphate buffer was used as a negative control. The extent of inhibition by the test compounds was expressed as the percentage of concentration necessary to achieve 50% inhibition (IC50). Each concentration was analyzed in three independent experiments. IC50 values were determined by data analysis and by a graphing software, Origin 8.6, 64-bit.
Percent inhibition of tyrosinase was calculated using the following equation:
|
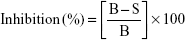
Here, B and S are the absorbance of the blank and samples.
Elastase inhibition assay
Elastase (elastase from porcine pancreas) inhibition assay was performed based on the methods reported by Kraunsoe et al26 and Kim et al27 with a few modifications. In order to perform elastase inhibition assay, the amount of released p-nitroaniline, which was hydrolyzed from the substrate (N-succinyl-Ala-Ala-Ala-p-nitroanilide) by elastase, was determined by measuring the absorbance at 410 nm. In detail, 0.8 mM solution of N-succinyl-Ala-Ala-Ala-p-nitroanilide was prepared in a 0.2 M Tris–HCl buffer (pH 8.0) and this buffer (130 μL) was added to the test sample (10 μL) in a 96-well microplate. The microplate was preincubated for 10 min at 25°C before elastase (0.0375 unit/mL) stock solution (10 μL) was added. After the addition of the enzyme, the microplate was kept at 25°C for 30 min and the absorbance was measured at 410 nm using microplate reader. All experiments were carried out in triplicate and elastase inhibitory activity was calculated according to the following formula:
|
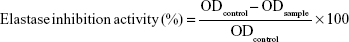
where ODcontrol is the optical density of the control and ODsample is the optical density of the sample. Oleanolic acid was used as the standard inhibitor for elastase.
Free radical scavenging assay
Free radical scavenging activity of amide derivatives was determined based on previously reported methods with few modifications.28,29 The assay solution consisted of 100 μL of DPPH (150 μM) and 20 μL of increasing concentration of test compounds, and the volume was adjusted to 200 μL in each well with DMSO. The reaction mixture was then incubated for 30 min at room temperature. Ascorbic acid (vitamin C) was used as a reference inhibitor. The assay measurements were carried out using a microplate reader (OPTIMax, Tunable) at 517 nm. The reaction rates were compared and the percent inhibition caused by the presence of tested inhibitors was calculated. Each concentration was analyzed in three independent experiments run in triplicate.
Kinetic analysis of the inhibition of tyrosinase
A series of experiments was performed to calculate the inhibitory kinetics of compounds 4c, 6a, 6b and 6d following the previously reported method.30 The compounds’ concentrations were as follows: 0, 3.125, 6.25 and 12.5 μM for 4c; 0, 0.3915 and 0.783 μM for 6a; 0, 0.453, 0.965, 1.813 and 3.626 μM for 6b; and 0, 0.08, 0.16 and 0.32 μM for 6d. Substrate L-DOPA concentration was between 0.0625 and 2 mM in all kinetic studies. Preincubation and measurement time was the same as discussed in mushroom tyrosinase inhibition assay protocol. Maximal initial velocity was determined from initial linear portion of absorbance up to 5 min after addition of enzyme at a 30 s interval. The type of inhibition was determined by using Lineweaver–Burk plots. The enzyme inhibitor (EI) dissociation constant Ki was determined by secondary plot of 1/V versus inhibitor concentrations, while enzyme–substrate–inhibitor (ESI)-dissociation constant Ki′ was determined by intercept versus inhibitor concentrations. The reversible kinetics of the EI complex was also determined for different concentrations of compound 6d versus the enzyme concentration (4, 6, 8, 10, 15 and 20 μg/mL).
Human tyrosinase inhibition assay
Cell culture and preparation of tyrosinase
A375 human melanoma cells were obtained from American Type Culture Collection (ATCC, Rockville, MD, USA). A375 cells were grown in Dulbecco’s Modified Eagle’s Medium (Invitrogen, Burlington, ON, Canada) supplemented with L-glutamine, 10% (v/v) fetal bovine serum (Invitrogen), 50 μg/mL streptomycin (Sigma-Aldrich), 50 units/mL penicillin (Sigma-Aldrich) and supplemented with 200 μM of L-tyrosine for tyrosinase induction. Cell cultures were incubated at 37°C, in a humidified atmosphere of 5% CO2. Cells were scraped out from the tissue culture plate with phosphate-buffered saline (PBS) and were homogenized at 4°C in PBS. The homogenate was centrifuged at 1,000× g for 10 min. The precipitate was sonicated in PBS on ice and the mixture was centrifuged at 10,000× g for 30 min. The supernatant containing tyrosinase was used for the measurement of the inhibitory effects.
Tyrosinase inhibition assay
The tyrosinase inhibitory activity of the synthesized amides was determined following the previously reported method with few modifications.31,32 The assay reaction mixture (200 μL) contained 3.3 mM L-DOPA in 0.33 M phosphate buffer (pH 7.0) and the enzyme in the presence and absence of inhibitors. Fifteen or 20 units of tyrosinase was used to determine the % inhibition. The reaction mixture was incubated at 37°C for 10 min and the absorbance was recorded at 475 nm using a microplate reader (OPTI Max, Tunable). One unit of enzyme was defined as the amount of enzyme that increases the absorbance value by 0.001 at 475 nm per minute under the same conditions as described earlier.
In vivo depigmentation assay in zebrafish
In vivo depigmentation assay was performed in zebrafish according to the previously described method.33
Zebrafish husbandry
Adult wild-type zebrafish (Danio rerio) were purchased from a commercial dealer and were acclimated for 1 month in standard laboratory conditions using a photoperiod of 14 h light and 10 h dark at a temperature of 28.5°C. Fish were fed two times daily with dry food and live brine shrimp larvae. They were kept in thermostatic tanks under constant chemical, biological and mechanical water filtration and aeration. Embryos were obtained from natural spawning that was induced at the morning by turning on the light. Collection of embryos was completed within 30 min. All procedures were performed as described in the “Principles of Laboratory Animal Care” (NIH publication no 85-23, revised 1985), and the study was approved by the Institutional Review Board of Kongju National University (IRB No 2011-2).
Compound treatment and phenotype-based evaluation
The collected synchronized embryos were arrayed by pipette into a 96-well plate: two to three embryos per well with 200 μL of E3 medium (NaCl 5 mM, KCl 0.17 mM, CaCl2 0.33 mM and MgSO4 0.33 mM). The most potent compound 6d solution (in 0.1% DMSO) was added to the E3 medium from 9 to 72 hpf (hours post-fertilization, a total exposure time of 63 h). The positive control was treated with kojic acid. Dechorionated embryos were anesthetized in tricaine methanesulfonate MS-222 solution (Sigma-Aldrich), mounted in 1% methyl cellulose on a depression slide and photographs were taken using stereomicroscope (SMZ745T; Nikon, Shinagawa, Japan) for observation. Pixel measurements were carried out using ImageJ software package (National Institutes of Health, Bethesda, MD, USA).
Determination of melanin contents in zebrafish
Melanin contents in zebrafish were determined following the previously reported method.34,35 For melanin contents determination, 50 μM dose was selected on the basis of in vivo depigmentation results. The collected synchronized embryos were arrayed by dropper into the dish: 20±2 embryos were used in the dish and treated with compound 6d and 50 μM of reference drug kojic acid in 3 mL of E3 medium. After 72 hpf, embryos were anesthetized in tricaine methanesulfonate MS-222 solution. After anesthetizing, embryos were washed three times with E3 medium and eyes were removed from all the treated and non-treated embryos. Embryos extract (pellet) was prepared by homogenization and centrifugation, and the pellet was dissolved in 1 mL of 1N NaOH at 100°C for 10 min. The level of melanin was measured at an absorbance of 405 nm, and the result was compared with a standard curve of synthetic melanin. All experiments were repeated three times.
Zebrafish toxicity assay
Zebrafish toxicity assay was performed according to the previously reported method.36 Prior to compounds treatment, 48 hpf embryos were enzymatically dechorionated using pronase (protease from Streptomyces griseus, 3 mg/mL; Sigma-Aldrich) for 15 min, then rinsed with E3 medium three times and two to three embryos were dispensed in 96-well plate with 200 μL of E3 medium. Embryos were treated with 10, 20 and 50 μM doses of compounds and pates were maintained at 28°C for further 72 h. The survival rate of larvae was assessed at day 5, and during the experiment no food was provided to larvae. In order to evaluate any extent of apoptotic cellular death, after 3 days of treatment (total 5 days), embryos were stained with 1 μg/mL of acridine orange in E3 medium for 30 min. Excess dye was removed by washing three times with E3 medium. The embryos were anesthetized and photographs were taken as described in section “In vivo depigmentation zebrafish assay”.
Computational studies
Retrieval of protein structure
The three dimensional (3D) crystal structure of mushroom tyrosinase (Agaricus bisporus) (PDBID: 2Y9X) was retrieved from Protein Data Bank (PDB) (http://www.rcsb.org). The energy minimization of target protein was carried out by employing conjugate gradient algorithm and Amber force field in UCSF Chimera 1.10.1.37 Stereochemical properties and Ramachandran graph and values38 of mushroom tyrosinase were assessed by Molprobity server,39 while the hydrophobicity graph was generated by Discovery Studio 4.1 Client.40 The protein architecture and statistical percentage values of helices, beta-sheets, coils and turns were accessed by VADAR 1.8.41
Candidate structures
The synthesized amide derivatives 4a–e and 6a–e were drawn by ACD/ChemSketch tool. The designed ligands were further visualized and minimized by UCSF Chimera 1.10.1. The biochemical properties of these compounds 4a–e and 6a–e were predicted by various computational tools such as Molinspiration (http://www.molinspiration.com/) and Molsoft (http://www.molsoft.com/). Lipinski’s rule of five (RO5) was justified by Molsoft and Molinspiraion tools.
Molecular docking
Molecular docking experiment was employed on all synthesized ligands 4a–e and 6a–e against mushroom tyrosinase using diverse PyRx tool.42 The preferred orientation of ligands within the active region of target proteins was determined in docking studies. To run the docking experiment, grid box parametric dimension values were adjusted as X =61.0781, Y =56.3001 and Z =63.1015, whereas the centered values were fixed as X =−2.9272, Y =22.0164 and Z =−32.4883, respectively. The default exhaustiveness value was set as 8 to obtain the finest binding conformational pose of protein-ligand docked complexes. All compounds were docked separately against the crystal structure of mushroom tyrosinase. The docked complexes were further evaluated on lowest binding energy (Kcal/mol) values and hydrogen and hydrophobic bond analysis using Discovery Studio (4.1) and UCSF Chimera 1.10.1. 2D graphical depictions of all other compounds were carried out by LIGPLOT.43
Molecular dynamics (MD) simulations
Based on in vitro analysis, docking energies and conformational pose analysis, four best complexes were selected for MD simulation. Groningen Machine for Chemicals Simulations (GROMACS) 4.5.4 package44 with GROMOS 53A6 force field was applied on all complexes to interpret the backbone residual flexibility.45 The receptor and ligands topology files were created using GROMOS 53A6 force field and online PRODRG Server,46 respectively. Moreover, the receptor–ligand complexes were solvated and placed in a cubic box center adjusted at a distance of 9Å. Ions were added to neutralize the charge of the system. Energy minimization (nsteps =50,000) was done by steepest descent method (1,000 ps). Energy calculation was done by Particle Mesh Ewald method,47 whereas covalent bond constraints were calculated by linear constraint solver algorithm.48 For final MD setup in md.mdp file, time step for integration was adjusted as 0.002 ps, while the cut-off distance for short range neighbor list was adjusted as 0.8 nm. The MD run was set to 15,000 ps with nsteps =750,000 for each protein–ligand complexes, and trajectories files analysis was done by Xmgrace tool (http://plasma-gate.weizmann.ac.il/Grace/).
Results and discussion
Chemistry
The title amide analogues 4a–e and 6a–e were prepared following the previously described method49 with slight modification shown in Schemes 1 and 2. The 2-amino-p-cymene in the first step is converted into 2-chloro-N-[2-methyl-5-(propan-2-yl)phenyl]acetamide (2) by treating with chloroacetyl chloride in the presence of (C2H5)3N and anhydrous methylene chloride. The structure of the intermediate 2 was ascertained by the presence of amide carbonyl (–NHC=O) stretching at 1,656 cm−1 and –NH stretching at 3,354 cm−1 in FTIR spectra. The compounds 4a–e and 6a–e were synthesized by simple nucleophilic replacement of chloro group from intermediate 2 by carboxylic group (–COOH) of substituted benzoic acids 3a–e and cinnamic acids 5a–e, respectively. The structures of the final products were confirmed by FTIR, 1HNMR and 13CNMR spectral data.
In vitro enzymes inhibition assay
Mushroom tyrosinase and elastase inhibitory activities were determined and it was found that most of the synthesized amides showed better tyrosinase inhibition than standard drug. The hydroxylated amides with cinnamic acid moiety showed higher tyrosinase inhibitory activity than those with benzoic acid residue. The IC50 value of compound 6d bearing 2,4-dihydroxy substituted cinnamic acid functionality was 0.15 μM, which explains its excellent tyrosinase inhibitory activity, whereas the IC50 value of standard kojic acid was 17.20 μM. The same compound (6d) also displayed higher elastase inhibitory potential compared to all other synthesized amide derivatives (Table 1). Bioassay results showed that the substitution of hydroxyl groups at phenyl ring is the decisive factor of inhibitory activity.
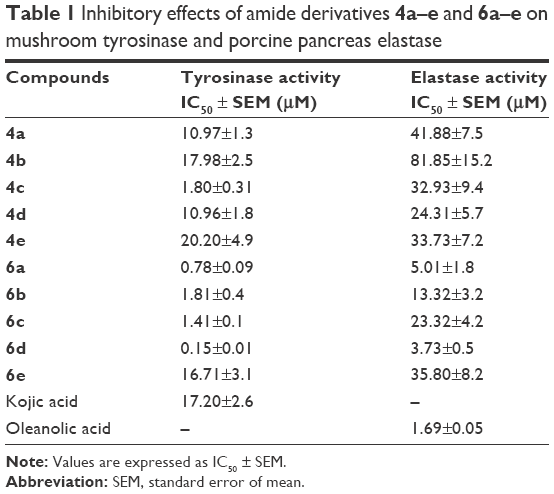 | Table 1 Inhibitory effects of amide derivatives 4a–e and 6a–e on mushroom tyrosinase and porcine pancreas elastase |
In vitro human tyrosinase inhibition assays showed that compound 6d exhibited 91.9% inhibitory capacity at 50 μg/mL (Table 2). This shows that the amide 6d has a greater potential to inhibit human tyrosinase compared to standard kojic acid (72.9% inhibitory capacity). Hence, we propose that substitution of hydroxyl group in phenyl ring in case of compound 6d impedes the molecule to interact well with the active sites of enzyme. The kinetic analysis and docking studies helped us to explore the mode of binding and residual interactions between the enzyme and synthesized inhibitors.
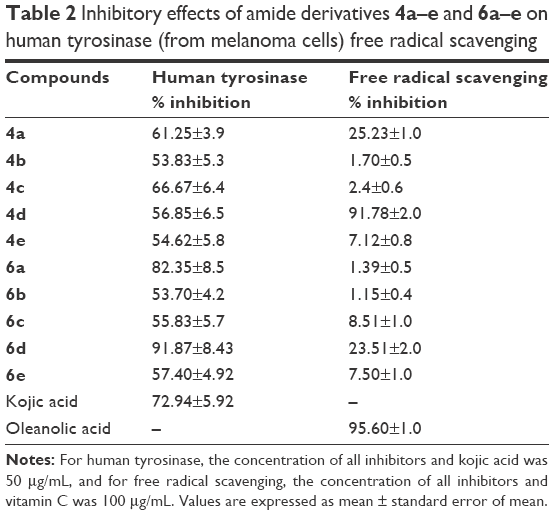 | Table 2 Inhibitory effects of amide derivatives 4a–e and 6a–e on human tyrosinase (from melanoma cells) free radical scavenging |
Kinetic mechanism
Among the synthesized amide derivatives, 4c, 6a, 6b and 6d were selected to determine their inhibition type and inhibition constants on mushroom tyrosinase. The potential of these derivatives to inhibit the free enzyme and enzyme–substrate complex was determined in terms of EI and ESI constants, respectively. The kinetic studies of the enzyme by Lineweaver–Burk plot of 1/V versus 1/[L-DOPA] in the presence of different inhibitors concentrations gave a series of straight lines as shown in Figures 1–4A. Figures 2A and 3A show that compounds 6a and 6b intersected within the second quadrant. The analysis showed that Vmax decreased with increasing Km in the presence of increasing concentrations of compounds 6a and 6b, respectively. This behavior of compounds 6a and 6b indicated that it inhibits tyrosinase by two different pathways: competitively forming EI complex and non-competitively interrupting ESI complex. The EI dissociation constants Ki (Figures 2B and 4B) of compounds 6a and 6b are shown by the secondary plots of slope versus concentration of compounds, whereas the ESI dissociation constants Ki′ are shown by the secondary plots of intercept versus concentration of compounds (Figures 2C and 3C). A lower value of Ki than Ki′ pointed out stronger binding between enzyme and compounds 6a and 6b, which suggested preferred competitive over non-competitive manners (Table 3).
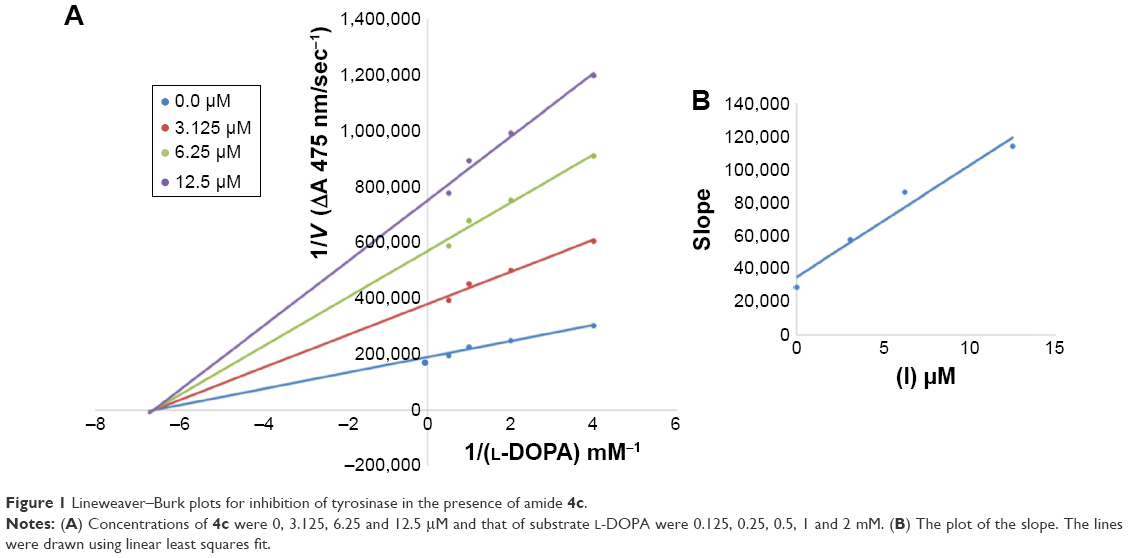 | Figure 1 Lineweaver–Burk plots for inhibition of tyrosinase in the presence of amide 4c. |
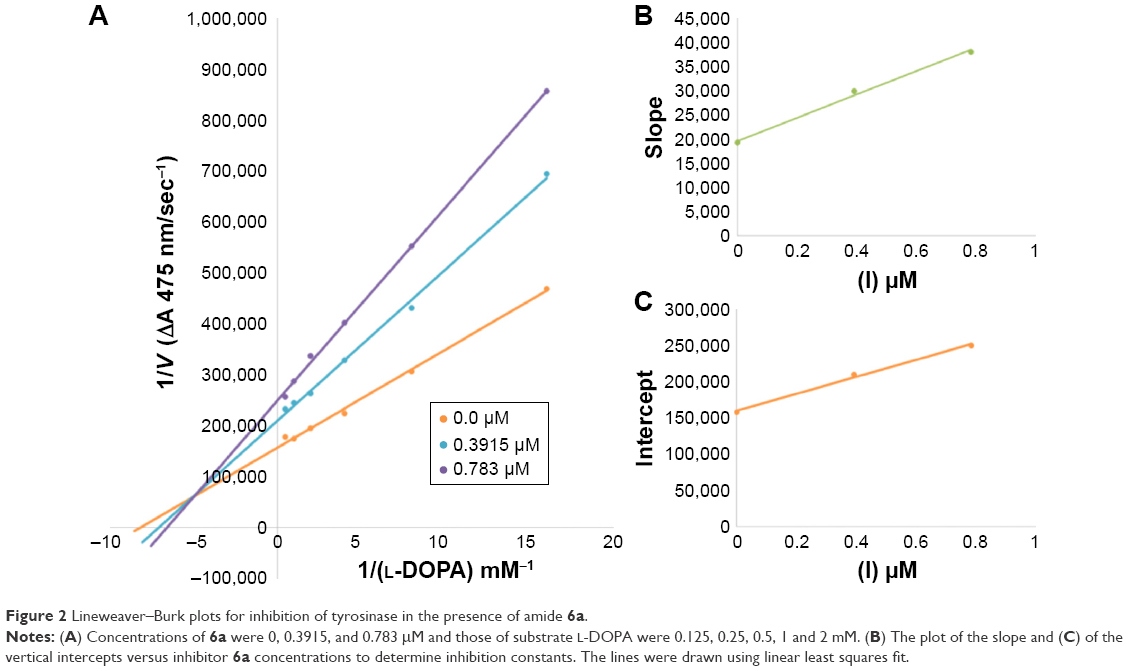 | Figure 2 Lineweaver–Burk plots for inhibition of tyrosinase in the presence of amide 6a. |
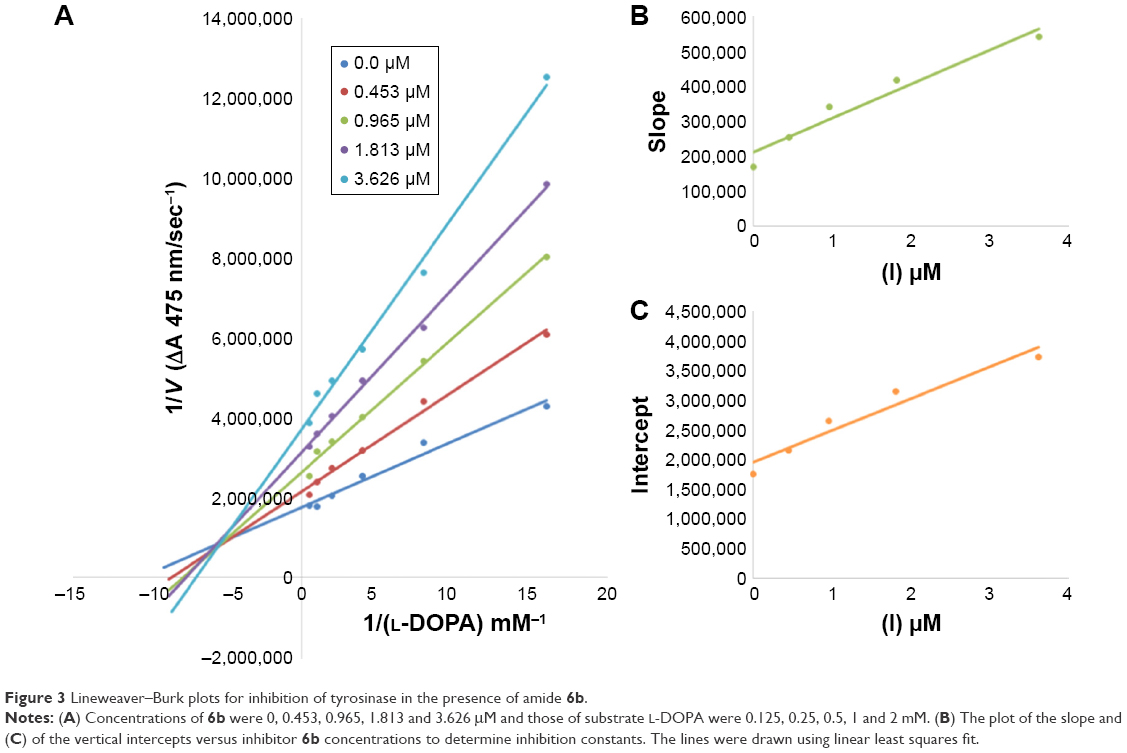 | Figure 3 Lineweaver–Burk plots for inhibition of tyrosinase in the presence of amide 6b. |
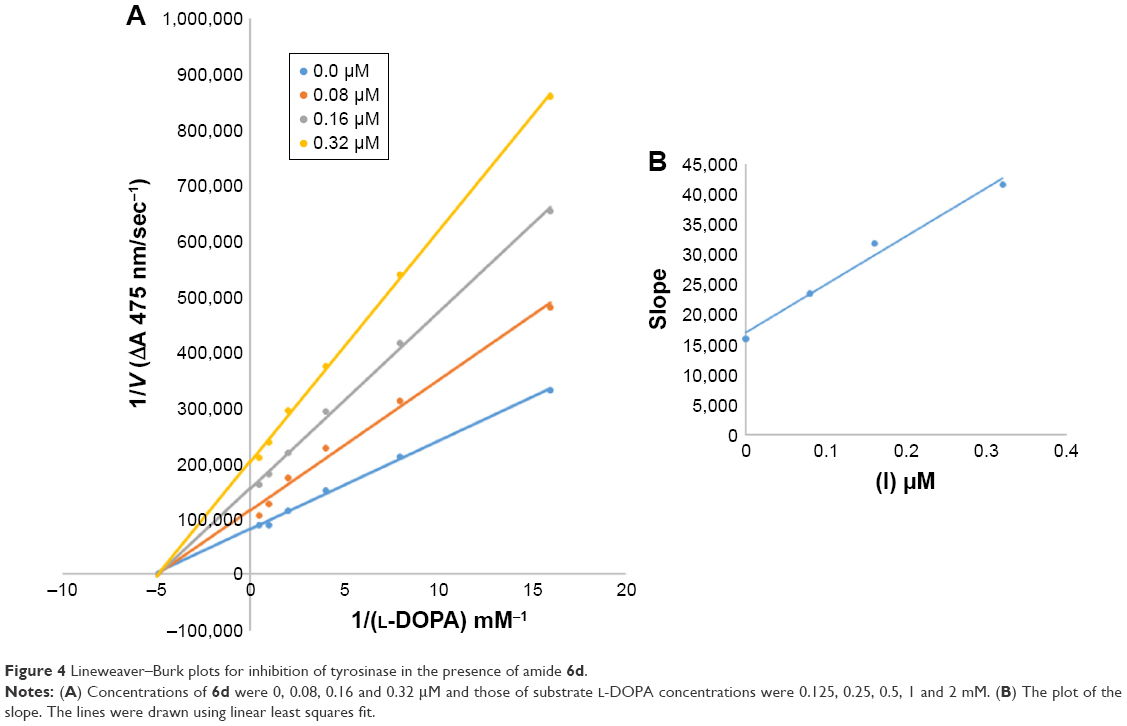 | Figure 4 Lineweaver–Burk plots for inhibition of tyrosinase in the presence of amide 6d. |
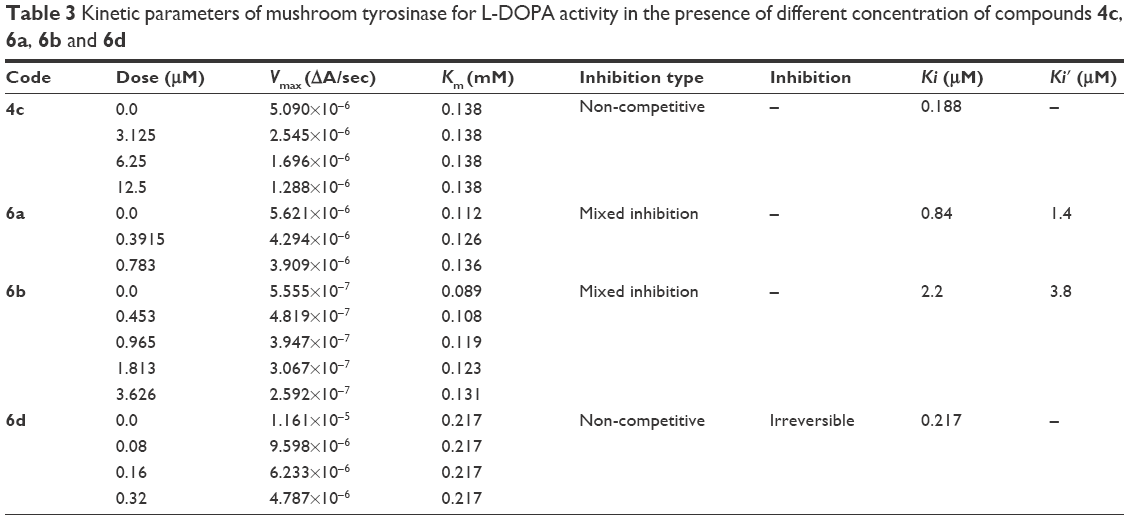 | Table 3 Kinetic parameters of mushroom tyrosinase for L-DOPA activity in the presence of different concentration of compounds 4c, 6a, 6b and 6d |
In case of compounds 4c and 6d, Lineweaver-Burk plot gave a family of straight lines, all of which intersected at the same point on the x-axis (Figures 1A and 4A). The analysis showed that 1/Vmax increased to a new value but Km remained the same as a result of increase in the concentrations of compounds 4c and 6d. This behavior indicates that compounds 4c and 6d inhibit tyrosinase non-competitively to form EI complex. Secondary plot of slope against concentration of 4c and 6d shows the EI dissociation constant (Ki) (Figures 1B and 4B). The inhibitory mechanism of mushroom tyrosinase by compounds 6d at different concentrations (0.0, 0.08, 0.16 and 0.32 μM) was investigated. The plots of the remaining enzyme activity versus the concentration of enzyme (4, 6, 8, 10, 15 and 20 μg/mL) at different inhibitor concentrations for the catalysis of L-DOPA gave a series of parallel straight lines with the same slopes indicating that the inhibitory effect of 6d on tyrosinase was irreversible (Figure 5). These results suggest that the compound 6d effectively inhibited the enzyme by binding to its binuclear active site irreversibly.50
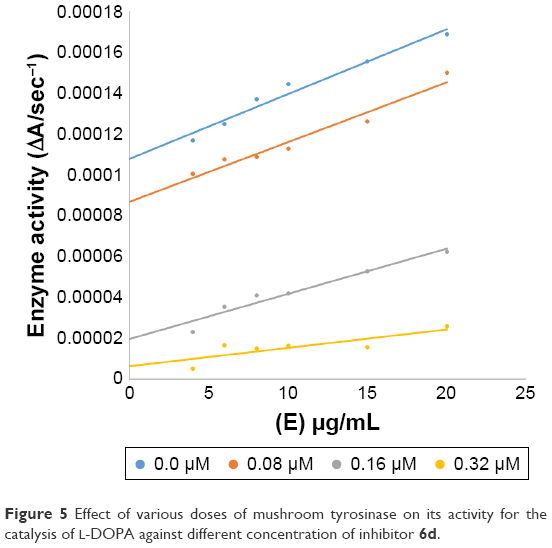 | Figure 5 Effect of various doses of mushroom tyrosinase on its activity for the catalysis of L-DOPA against different concentration of inhibitor 6d. |
In vivo depigmentation assay in zebrafish
Zebrafish is a very important vertebrate animal model because it possesses similar gene sequence system to human.51 Zebrafish embryos were used to determine the depigmentation activity of compound 6d through in vivo assay. The inhibitory effects of 6d on the pigmentation of zebrafish were evaluated by adding 6d at concentrations of 5, 10, 20 and 50 μM to the embryos, and same concentrations were used for positive control kojic acid. Compound 6d significantly decreased (P<0.05, Figure 6) the pigmentation level to about 57.3%, while positive control kojic acid decreased the pigmentation level to 24.2% at 50 μM. Moreover, inhibitor 6d showed better depigmenting effects than kojic acid at 10 and 20 μM.
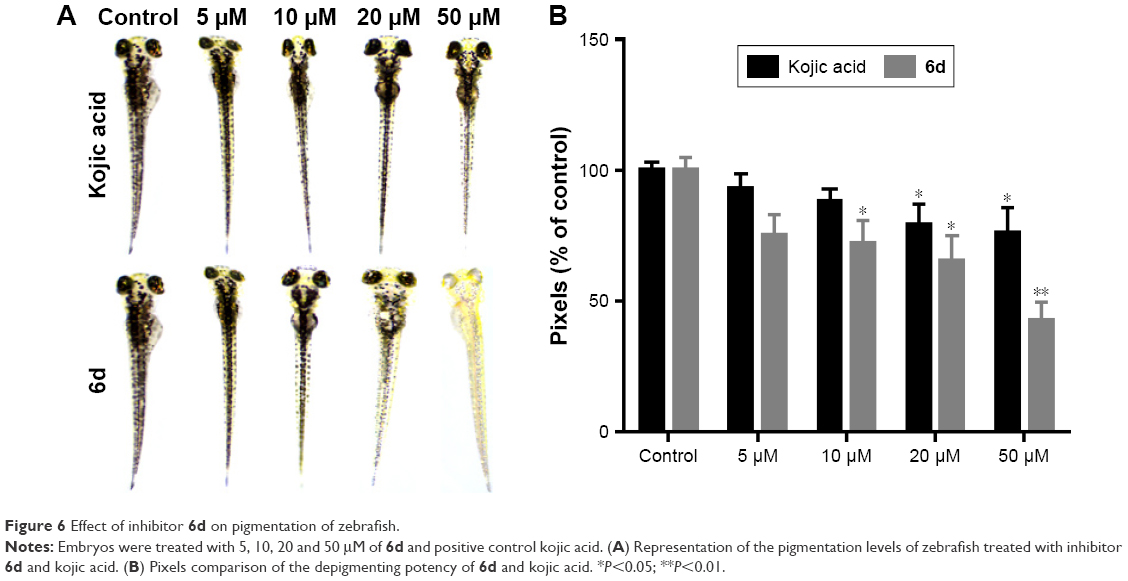 | Figure 6 Effect of inhibitor 6d on pigmentation of zebrafish. |
Determination of melanin contents in zebrafish
Melanin contents were measured using the extract of zebrafish embryos. Results showed that melanin contents significantly (P<0.001) decreased in the 6d-treated zebrafish embryos at 50 μM compared to non-treated embryos and reference drug. Kojic acid only slightly reduced the melanin contents in zebrafish embryos, whereas 6d highly reduced the melanin contents (Figure 7).
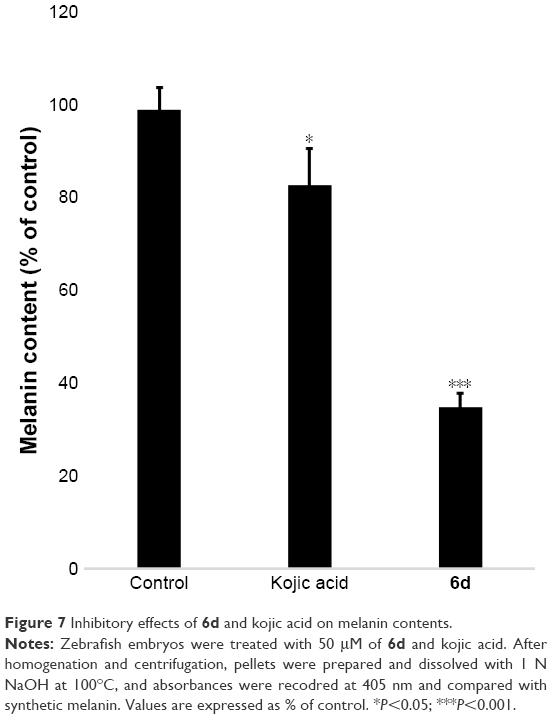 | Figure 7 Inhibitory effects of 6d and kojic acid on melanin contents. |
Zebrafish toxicity assay
In addition to the depigmenting capacity, other factors are also important in selecting the lead compound for skin whitening and related disorders. For that purpose, additional in vivo zebrafish toxicity was also performed. In recent years, zebrafish has emerged as an important tool for early screening of toxicity of drugs. Acute toxicity is determined by treating the larvae after 48 hpf with 10, 20 and 50 μM of inhibitor 6d, and fish were examined after 3 days of treatment by staining with acridine orange (Figure 8). The larvae developed into zebrafish normally without any evidence of apoptotic deformities. This absence of acute toxicity was encouraging for safer drug development. Importantly, no death was recorded in any treatment.
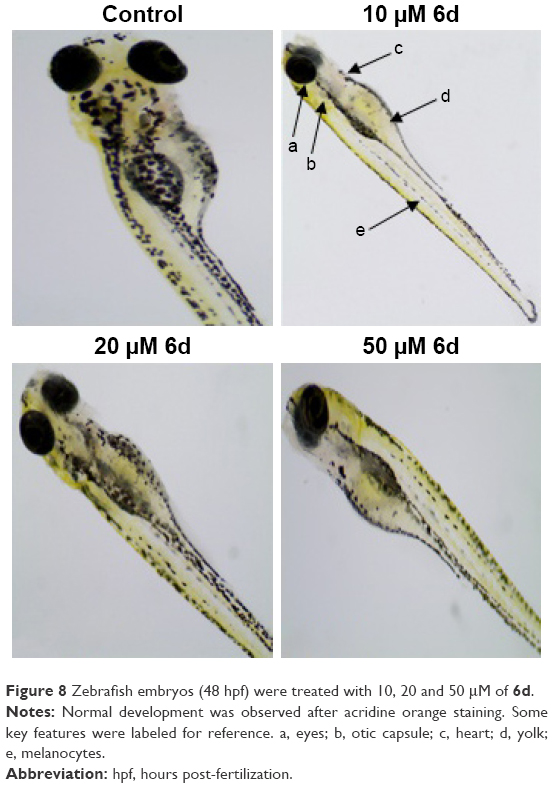 | Figure 8 Zebrafish embryos (48 hpf) were treated with 10, 20 and 50 μM of 6d. |
Computational studies
Structural assessment of target protein
Mushroom tyrosinase is a class of oxidoreductase copper-containing protein that comprises 391 amino acids. The structure architecture of mushroom tyrosinase showed that it consists of 39% α-helices (154 residues), 14% β-sheets (57 residues) and 46% coils (180 residues). The crystal structure showed its resolution 2.78Å, R-value 0.238 and unit cell crystal dimensions such as length and angles of coordinates. The unit cell length values were observed for a =103.84, b =104.82 and c =119.36 with angles 90°, 110.45° and 90° for all α, β and γ dimensions, respectively. The Ramachandran plots and values indicated that 95.9% of protein residues were present in favored region and 100.0% residues were lie in allowed region. The Ramachandran graph values showed a good accuracy of phi (φ) and psi (ψ) angles among the coordinates of receptor, and most of residues were plunged in acceptable region.
Chemo-informatics properties and Lipinski’s RO5
The predicted chemo-informatics properties such as molecular weight (g/mol), molar volume (A3) and polar surface area (PSA) were evaluated by computational tools. The literature study established a standard value for molecular weight (160–480 g/mol) and PSA (x).52 Results showed that all the predicted values of synthesized compounds 4a–e and 6a–e were comparable with standard values. The obtained drug score is very important for various properties such as physicochemical, pharmacokinetics and pharmacodynamics of chemical compound. Higher drug scores mean good drug characteristics.53 The drug scores obtained emphasize that all the synthesized amides 4a–e and 6a–e exhibited drug-like behavior. The highest and lowest drug scores of both 4c and 6a are 1.41 and 0.35, respectively. Moreover, RO5 did not explain anything about the specific chemistry or structural features of the drugs or non-drugs. The computational results showed that all the synthesized compounds possessed <10 HBA, <5 HBD and <5.0 Log P-values, which significantly justified its drug-like behavior. Moreover, their molecular weight was also <500 g/mol, which also justified the compounds’ better drug-like behavior. Rule of 5 indicates that molecules with poor absorption are more likely to have more than 5 HBD, MWT over 500, Log P over 5 and more than 10 HBA. However, there are plenty of examples that explain RO5 violation among the existing drugs.54 In summary, the values obtained justify the significance of the synthesized compounds as good candidate molecules (Table 4).
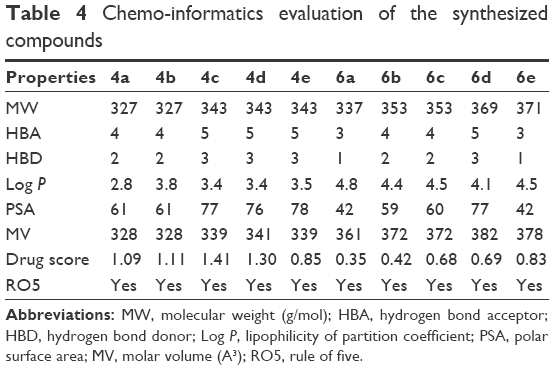 | Table 4 Chemo-informatics evaluation of the synthesized compounds |
Molecular docking analyses
The docked complexes of all amide derivatives 4a–e and 6a–e were analyzed on the basis of lowest binding energy values (kcal/mol) and hydrogen/hydrophobic bonding analyses. Results showed that 6d was the most active compound with best binding energy value (−7.90 kcal/mol) compared to other derivatives. The docking pose was selected on the basis of energy value and interaction patterns of ligand within the active region of the target protein. The conformational position within the active region of the target protein was confirmed by superimposition. The docked complex of 6d was superimposed against the experimental crystal structure of tyrosinase. Results showed that the ligand 6d actively bound within the binding pocket of the target protein. The docking energy values of all the docking complexes were calculated by the following equation:
|
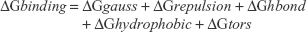
where,
ΔGgauss: attractive term for the dispersion of two Gaussian functions,
ΔGrepulsion: square of the distance if closer than a threshold value,
ΔGhbond: ramp function – also used for interactions with metal ions,
ΔGhydrophobic: ramp function,
ΔGtors: proportional to the number of rotatable bonds.
Docking results justified that the synthesized amides 6b, 6d and 6e exhibited good binding energy values (−8.0, −7.9 and −7.9 kcal/mol, respectively). The standard error for Autodock is reported as 2.5 kcal/mol. Though the basic nucleus of all the synthesized compounds was the same, most of the ligands possessed efficient energy values and did not show any significant difference in energy fluctuations. The comparative binding energies of all the docking complexes are presented in Figure 9.
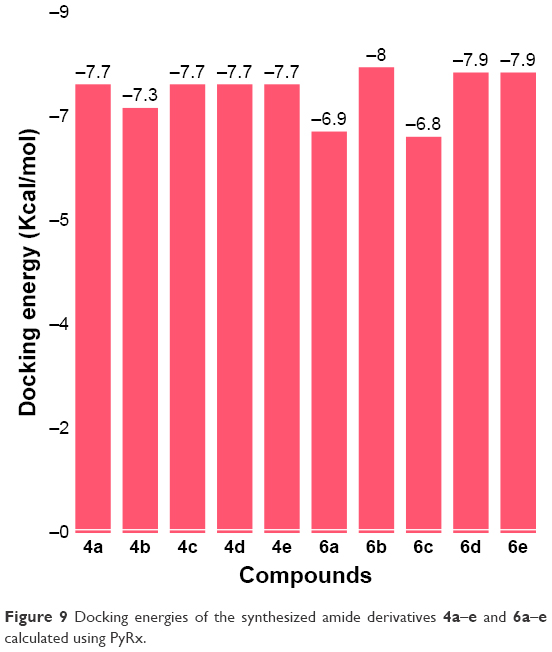 | Figure 9 Docking energies of the synthesized amide derivatives 4a–e and 6a–e calculated using PyRx. |
This comparative analysis shows that 6d directly interacts with the active residues of the target protein. The structure–activity relationship analysis showed that 6d formed two hydrogen bonds and one π–π interaction at specific residues His244, Met280 and His363 of target protein. The ester carbonyl oxygen in 6d interacts with His244, while benzyl oxygen moiety interacts with Met280 and forms strong hydrogen bonds with lengths of 1.98Å and 2.87Å, respectively. Another π–π interaction between the benzene and metal-bonded His363 residue was formed with a bond length of 4.07Å. The literature study also justified that these interacted residues are significant in the downstream signaling pathways.55 The binding interactions of 6d with the amino acids of the target protein are presented in Figure 10, and the 2D-generated docking complexes of all ligands are presented in Figures S3–S11.
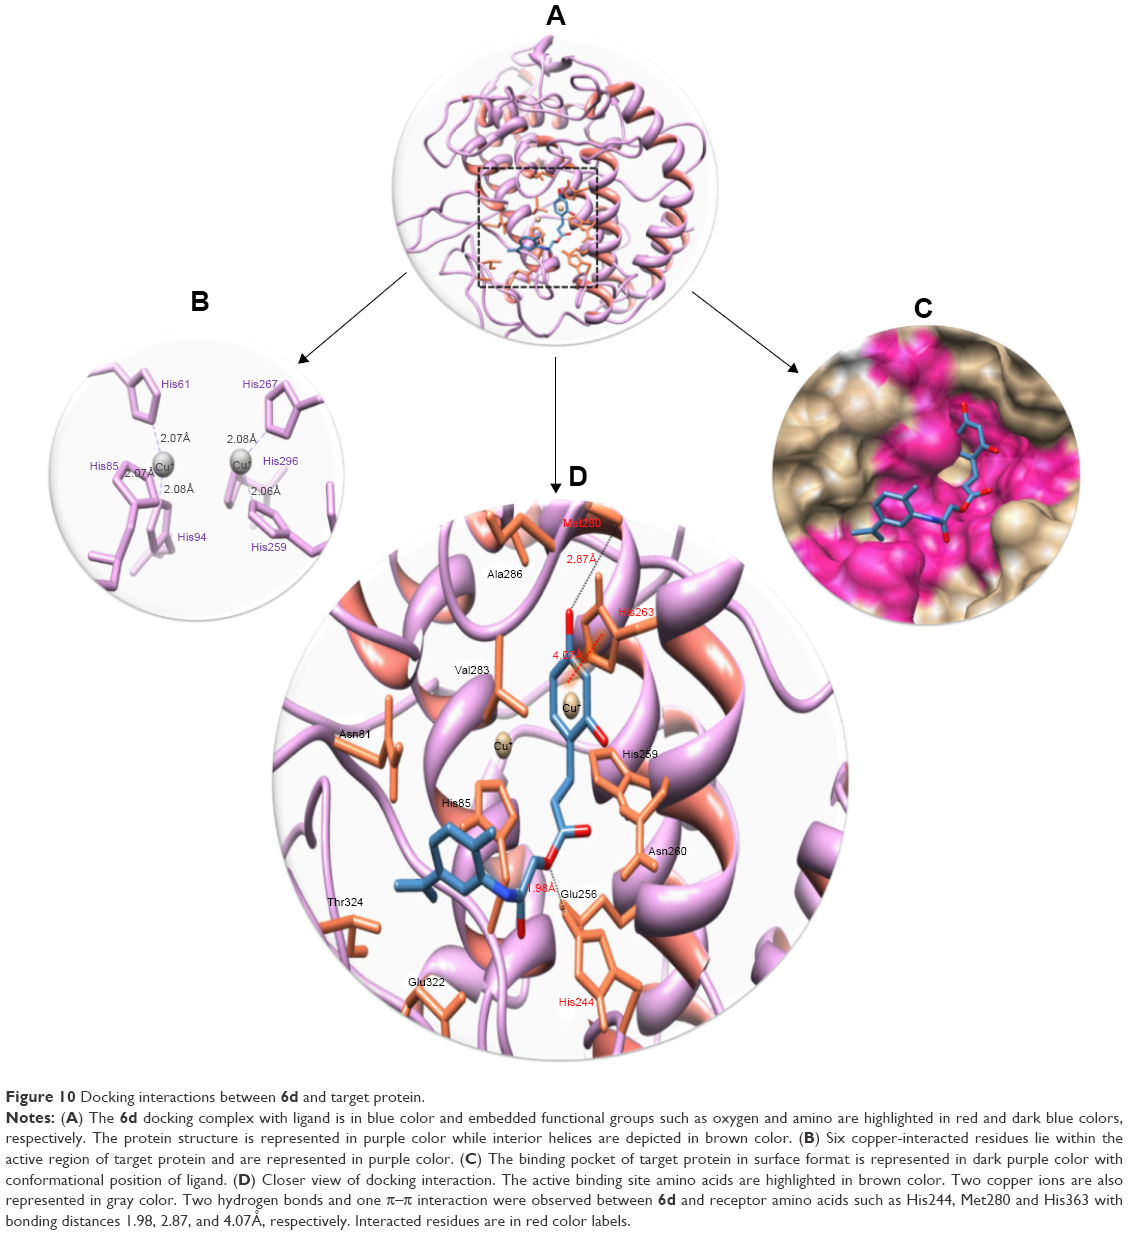 | Figure 10 Docking interactions between 6d and target protein. |
MD simulations analyses
Root mean square deviation and fluctuations of target protein
To evaluate the mushroom tyrosinase flexibility and overall stability of docking complexes, we executed time-dependent MD simulation at 15 ns using Gromacs 4.5.4. The residual deviations and fluctuation of the complexes 6a and 6d were determined by root mean square deviation and fluctuation (RMSD/F) graphs generated by Xmgrace software. Both docked complexes were run separately in simulation to check the fluctuating differences of the residual backbone of the target protein. An increasing trend was observed in the graph lines of both complexes with an RMSD value of 0–0.2 nm at time 0–1,250 ps, after which both complexes showed slight fluctuations and attained a little stability from 1,250 to 5,000 ps with a constant RMSD value of 0.2 nm. From 5,000 to 75,000 ps, 6d graph line remained steadily constant and showed no fluctuations, whereas 6a graph line showed an increasing trend and depicted higher RMSD value of 0.25 nm. Comparative analysis showed that 6d had more stable behavior compared to 6a complex. These results justified that the binding of 6d toward the target protein is more stable compared to all other 6a derivative (Figure 11).
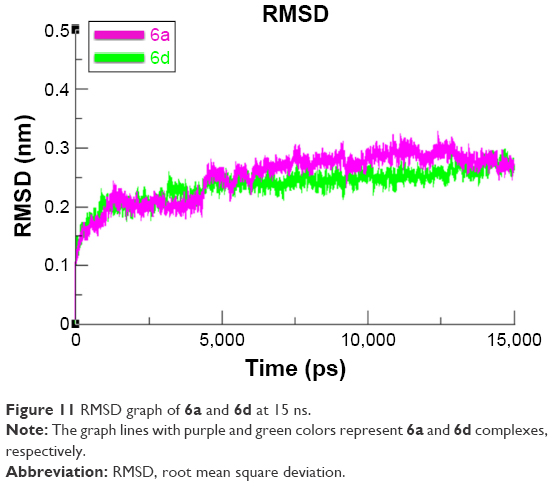 | Figure 11 RMSD graph of 6a and 6d at 15 ns. |
The overall RMSD results justified that 6d did not change the conformational symmetry of the target protein compared to 6a. The RMSF results also reflected that both C- and N-terminal lobes of mushroom tyrosinase are fluctuated throughout the simulation period. Comparative analysis justified that 6d is more stable and less fluctuated throughout the simulation period compared to 6a (Figure 12). MD simulation graphs showed stable behaviors of 6d docked complex throughout MD trajectories thus increasing the efficacy of docking results.
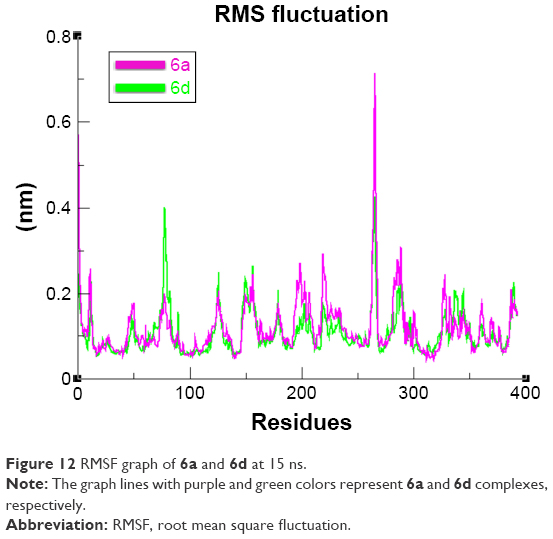 | Figure 12 RMSF graph of 6a and 6d at 15 ns. |
The compactness of the target protein was measured by radius of gyration (Rg). The results obtained for both 6a and 6d showed that the Rg value underwent a little fluctuation between 2 and 2.03 nm throughout the simulation time 0–15 ns. These results justified that the residual backbone and folding of the receptor protein 6d was comparatively stable compared with 6a. The Rg values and graph lines of 6a and 6d are shown in Figure 13. The solvent accessible surface area and dihedral pattern (Chi) of the target protein are given in Figures S12 and S13.
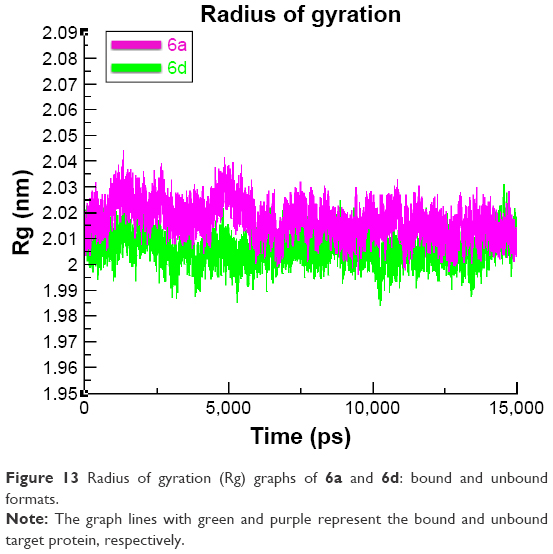 | Figure 13 Radius of gyration (Rg) graphs of 6a and 6d: bound and unbound formats. |
Conclusion
Hydroxylated amide derivatives 4a–e and 6a–e were synthesized following simple reaction routes with excellent yields as melanogenesis inhibitors. The in vitro, in vivo and computational studies proved that compound 6d is a highly potent melanogenesis inhibitor compared to standard kojic acid. Among the synthesized amides, 6d showed excellent mushroom tyrosinase inhibitory activity (IC50 0.15 μM) compared to standard kojic acid (IC50 16.69 μM). The enzyme inhibition kinetics determined by Lineweaver–Burk plots showed that compounds 4c and 6d exhibited non-competitive inhibition, while 6a and 6b exhibited mixed-type inhibitions. The kinetic mechanism further revealed that compound 6d formed irreversible complex with the target enzyme tyrosinase. The Ki values of compounds 4c, 6a, 6b and 6d were 0.188 μM, 0.84 μM, 2.20 μM and 0.217 μM, which shows that compound 6d possessed stronger binding capacity. The same compound 6d also showed an inhibitory activity of 91.9% on human tyrosinase. The in vivo cytotoxicity evaluation of 6d in zebrafish embryos showed that it is non-toxic to zebrafish. The melanin depigmentation assay in zebrafish indicated that compound 6d had a greater potential in decreasing melanin contents compared to kojic acid at same concentration. The computational studies also supported the wet lab findings as the compound 6d exhibited highest binding affinity with the target protein (PDBID: 2Y9X) with a binding energy value of −7.90 kcal/mol. The MD simulation studies also proved that amide 6d formed the most stable complex with tyrosinase. Based upon our in vitro, in vivo and computational studies, we propose that compound 6d is a promising candidate for the development of safe cosmetic agent.
Disclosure
The authors report no conflicts of interest in this work.
References
Levy C, Khaled M, Fisher DE. MITF: master regulator of melanocyte development and melanoma oncogene. Trends Mol Med. 2006;12(9):406–414. | ||
Lin JY, Fisher DE. Melanocyte biology and skin pigmentation. Nature. 2007;445(7130):843–850. | ||
Raj D, Brash DE, Grossman D. Keratinocyte apoptosis in epidermal development and disease. J Invest Dermatol. 2006;126(2):243–257. | ||
Sánchez-Ferrer A, Rodríguez-López JN, García-Cánovas F, García-Carmona F. Tyrosinase: a comprehensive review of its mechanism. Biochem Biophys Acta. 1995;1247(1):1–11. | ||
Van Holde KE, Miller KI, Decker H. Hemocyanins and invertebrate evolution. J Biol Chem. 2001;276(19):15563–15566. | ||
Solminski A, Constantino R. L-tyrosine induces tyrosinase expression via a post transcriptional mechanism. Experientia. 1991;47(7):721–724. | ||
Solminski A, Constantino R. Molecular mechanism of tyrosinase regulation by L-dopa in hamster melanoma cells. Life Sci. 1991;48(21):2075–2079. | ||
Slominski A, Paus R. Are L-tyrosine and L-dopa hormone-like bioregulators? J Theor Biol. 1990;143(1):123–138. | ||
Prota G. Melanins and Melanogenesis. New York: Academic Press Inc; 1992. | ||
Prota G. The chemistry of melanins and related metabolites. Fortsch Chem Organ Natur. 1995;64:93–148. | ||
Kadekaro AL, Kanto H, Kavanagh R, Abdel-Malek ZA. Significance of the melanocortin 1 receptor in regulating human melanocytes pigmentation, proliferation and survival. Ann N Y Acad Sci. 2003;994:359–365. | ||
Petit L, Pierard GE. Skin-lightening products revisited. Int J Cosmet Sci. 2003;25(4):169–181. | ||
Riley PA. Melanogenesis and melanoma. Pigment Cell Res. 2003;16(5):548–552. | ||
Uong A, Zon LI. Melanocytes in development and cancer. J Cell Physiol. 2010;222(1):38–41. | ||
Yamaguchi Y, Hearing VJ. Melanocytes and their diseases. Cold Spring Harb Perspect Med. 2014;4(5):pii:a017046. | ||
Lynde CB, Kraft JN, Lynde CW. Topical treatments for melasma and postinflammatory hyperpigmentation. Skin Therapy Lett. 2006;11(9):1–6. | ||
Asanuma M, Miyazaki I, Ogawa N. Dopamine- or L-DOPA induced neurotoxicity: the role of dopamine quinone formation and tyrosinase in a model of Parkinson’s disease. Neurotox Res. 2003;5(3):165–176. | ||
Zhu YJ, Zhou HT, Hu YH, et al. Antityrosinase and antimicrobial activities of 2-phenylethanol, 2-phenylacetaldehyde and 2-phenylacetic acid. Food Chem. 2011;124(1):298–302. | ||
Xu Y, Stokes AH, Roskoski R Jr, Vrana KE. Dopamine, in the presence of tyrosinase, covalently modifies and inactivates tyrosine hydroxylase. J Neurosci Res. 1998;54(5):691–697. | ||
Menezes JC, Kamat SP, Cavaleiro JA, Gaspar A, Garrido J, Borges F. Synthesis and antioxidant activity of long chain alkyl hydroxycinnamates. Eur J Med Chem. 2011;46(2):773–777. | ||
Miliovsky M, Svinyarov I, Mitrev Y, et al. A novel one-pot synthesis and preliminary biological activity evaluation of cis-restricted polyhydroxy stilbenes incorporating protocatechuic acid and cinnamic acid fragments. Eur J Med Chem. 2013;66:185–192. | ||
Liu XD, Huang H, Chen QX. Studies on inhibitory effects of benzoic acid on mushroom tyrosinase. J Xiamen Univ Natur Sci. 2003;42(1):102–106. | ||
Chen QX, Song KK, Qiu L, Liu XD, Huang H, Guo HY. Inhibitory effects on mushroom tyrosinase by p-alkoxybenzoic acids. Food Chem. 2005;91(2):269–274. | ||
Takahashi T, Miyazawa M. Synthesis and structure–activity relationships of phenylpropanoid amides of serotonin on tyrosinase inhibition. Bioorg Med Chem Lett. 2011;21(7):1983–1986. | ||
Ashraf Z, Rafiq M, Seo SY, Babar MM, Zaidi NSS. Design, synthesis and bioevaluation of novel umbelliferone analogues as potential mushroom tyrosinase inhibitors. J Enzyme Inhib Med Chem. 2015;30(6):874–883. | ||
Kraunsoe JA, Claridge TD, Lowe G. Inhibition of human leukocyte and porcine pancreatic elastase by homologues of bovine pancreatic trypsin inhibitor. Biochemistry. 1996;35(28):9090–9096. | ||
Kim SJ, Sancheti SA, Sancheti SS, Um BH, Yu SM, Seo SY. Effect of 1, 2, 3, 4, 6-penta-O-galloyl-beta-D-glucose on elastase and hyaluronidase activities and its type II collagen expression. Acta Pol Pharm. 2010;67(2):145–150. | ||
Reddy CVK, Sreeramulu D, Raghunath M. Antioxidant activity of fresh and dry fruits commonly consumed in India. Food Res Int. 2010;43(1):285–288. | ||
Ashraf Z, Rafiq M, Seo SY, Babar MM, Zaidi NSS. Synthesis, kinetic mechanism and docking studies of vanillin derivatives as inhibitors of mushroom tyrosinase. Bioorg Med Chem. 2015;23(17):5870–5880. | ||
Ashraf Z, Rafiq M, Seo SY, Kwon KS, Babar MM, Zaidi NSS. Kinetic and in silico studies of novel hydroxy-based thymol analogues as inhibitors of mushroom tyrosinase. Eur J Med Chem. 2015;98:203–211. | ||
Sugimoto K, Nishimura T, Nomura K, Sugimoto K, Kuriki T. Syntheses of arbutin-alpha-glycosides and a comparison of their inhibitory effects with those of alpha-arbutin and arbutin on human tyrosinase. Chem Pharm Bull (Tokyo). 2003;51(7):798–801. | ||
Funayama M, Nishino T, Hirota A, Murao S, Takenishi S, Nakano H. Enzymatic synthesis of (+) catechin-α-glucoside and its effect on tyrosinase activity. Biosci Biotech Biochem. 1993;57(10):1666–1669. | ||
Choi T-Y, Kim J-H, Ko DH, et al. Zebrafish as a new model for phenotype-based screening of melanogenic regulatory compounds. Pigment Cell Res. 2007;20(2):120–127. | ||
Hsu KD, Chen HJ, Wang CS, et al. Extract of Ganoderma formosanum mycelium as a highly potent tyrosinase inhibitor. Sci Rep. 2016;6:32854. | ||
Baek SH, Lee SH. Sesamol decreases melanin biosynthesis in melanocyte cells and zebrafish: possible involvement of MITF via the intracellular cAMP and p38/JNK signalling pathways. Exp Dermatol. 2015;24(10):761–766. | ||
Thompson MJ, Louth JC, Ferrara S, et al. Discovery of 6-substituted indole-3-glyoxylamides as lead antiprion agents with enhanced cell line activity, improved microsomal stability and low toxicity. Eur J Med Chem. 2011;46(9):4125–4132. | ||
Pettersen EF, Goddard TD, Huang CC, et al. UCSF Chimera – a visualization system for exploratory research and analysis. J Comput Chem. 2006;25(13):1605–1612. | ||
Lovell SC, Davis IW, Arendall WB 3rd, et al. Structure validation by Calpha geometry: phi, psi and Cbeta deviation. Proteins. 2002;50(3):437–450. | ||
Chen VB, Arendall WB 3rd, Headd JJ, et al. MolProbity: all-atom structure validation for macromolecular crystallography. Acta Crystallogr D Biol Crystallogr. 2010;66(Pt 1):12–21. | ||
Discovery Studio. Version 2.1. San Diego, CA: Accelrys; 2008. Available from: http://accelrys.com/products/collaborative-science/biovia-discovery-studio/requirements/technical-requirements-450.html. Accessed June 1, 2017. | ||
Willard L, Ranjan A, Zhang H, et al. VADAR: a web server for quantitative evaluation of protein structure quality. Nucleic Acids Res. 2003;31(13):3316–3319. | ||
Dallakyan S, Olson AJ. Small-molecule library screening by docking with PyRx. Methods Mol Biol. 2015;1263:243–250. | ||
Wallace AC, Laskowski RA, Thornton JM. LIGPLOT: a program to generate schematic diagrams of protein-ligand interactions. Protein Eng. 1996;8(2):127–134. | ||
Pronk S, Pall S, Schulz R, et al. GROMACS 4.5: a high-throughput and highly parallel open source molecular simulation toolkit. Bioinformatics. 2013;29(7):845–854. | ||
Chiu SW, Pandit SA, Scott HL, Jakobsson E. An improved united atom force field for simulation of mixed lipid bilayers. J Phys Chem B. 2009;113(9):2748–2763. | ||
Schüttelkopf AW, van Aalten DMF. PRODRG: a tool for high-throughput crystallography of protein-ligand complexes. Acta Crystallogr D Biol Crystallogr. 2004;60(Pt 8):1355–1363. | ||
Wang H, Dommert F, Holm C. Optimizing working parameters of the smooth particle mesh Ewald algorithm in terms of accuracy and efficiency. J Chem Phys. 2010;133(3):034117. | ||
Amiri S, Sansom MS, Biggin PC. Molecular dynamics studies of AChBP with nicotine and carbamylcholine: the role of water in the binding pocket. Protein Eng Des Sel. 2007;20(7):353–359. | ||
Ashraf Z, Alamgeer, Rasool R, et al. Synthesis, bioevaluation and molecular dynamic simulation studies of dexibuprofen–antioxidant mutual prodrugs. Int J Mol Sci. 2016;17(12):2151. | ||
Chen Z, Cai D, Mou D, et al. Design, synthesis and biological evaluation of hydroxy- or methoxy-substituted 5-benzylidene (thio) barbiturates as novel tyrosinase inhibitors. Bioorg Med Chem. 2014;22(13):3279–3284. | ||
Veldman MB, Lin S. Zebrafish as a developmental model organism for pediatric research. Pediatr Res. 2008;64(5):470–476. | ||
Kadam RU, Roy N. Recent trends in drug-likeness prediction: a comprehensive review of in silico methods. Indian J Pharm Sci. 2007;69:609–615. | ||
Bakht MA, Yar MS, Abdel-Hamid SG, Al-Qasoumi SI, Samad A. Molecular properties prediction, synthesis and antimicrobial activity of some newer oxadiazole derivatives. Eur J Med Chem. 2010;45(12):5862–5869. | ||
Tian S, Wang J, Li Y, Li D, Xu L, Hou T. The application of in silico drug-likeness predictions in pharmaceutical research. Adv Drug Del Rev. 2015;86:2–10. | ||
Chen WC, Tseng TS, Hsiao NW, et al. Discovery of highly potent tyrosinase inhibitor, T1, with significant anti-melanogenesis ability by zebrafish in vivo assay and computational molecular modeling. Sci Rep. 2015;5:7995. |
 © 2017 The Author(s). This work is published and licensed by Dove Medical Press Limited. The full terms of this license are available at https://www.dovepress.com/terms.php and incorporate the Creative Commons Attribution - Non Commercial (unported, v3.0) License.
By accessing the work you hereby accept the Terms. Non-commercial uses of the work are permitted without any further permission from Dove Medical Press Limited, provided the work is properly attributed. For permission for commercial use of this work, please see paragraphs 4.2 and 5 of our Terms.
© 2017 The Author(s). This work is published and licensed by Dove Medical Press Limited. The full terms of this license are available at https://www.dovepress.com/terms.php and incorporate the Creative Commons Attribution - Non Commercial (unported, v3.0) License.
By accessing the work you hereby accept the Terms. Non-commercial uses of the work are permitted without any further permission from Dove Medical Press Limited, provided the work is properly attributed. For permission for commercial use of this work, please see paragraphs 4.2 and 5 of our Terms.