")
Back to Journals » International Journal of Nanomedicine » Volume 14
Design, Evaluation And Antimicrobial Activity Of Egyptian Propolis-Loaded Nanoparticles: Intrinsic Role As A Novel And Naturally Based Root Canal Nanosealer
Authors Abdel Raheem IA , Abdul Razek A, Elgendy AA , Saleh NM , Shaaban MI, Abd El-Hady FK
Received 15 June 2019
Accepted for publication 12 September 2019
Published 21 October 2019 Volume 2019:14 Pages 8379—8398
DOI https://doi.org/10.2147/IJN.S219577
Checked for plagiarism Yes
Review by Single anonymous peer review
Peer reviewer comments 2
Editor who approved publication: Dr Thomas Webster
Islam Ali Abdel Raheem,1 Amro Abdul Razek,1 Abeer Abdelaziz Elgendy,1 Noha Mohamed Saleh,2 Mona Ibrahem Shaaban,3 Faten K Abd El-Hady4
1Department of Endodontics, Faculty of Dentistry, Mansoura University, Mansoura, Egypt; 2Department of Pharmaceutics, Faculty of Pharmacy, Mansoura University, Mansoura, Egypt; 3Department of Microbiology and Immunology, Faculty of Pharmacy, Mansoura University, Mansoura, Egypt; 4Chemistry of Natural and Microbial Products Department, National Research Centre, Giza, Egypt
Correspondence: Noha Mohamed Saleh
Department of Pharmaceutics, Faculty of Pharmacy, Mansoura University, Gomhoreyah Street, Mansoura 35516, Egypt
Tel/fax +2 050 2247496
Email [email protected]
Background: Propolis is a unique natural adhesive product collected by honeybees. It contains a diversity of bioactive compounds with reported functional properties such as antioxidants, antibacterial, antifungal, anti-inflammatory, antiviral and anticancer activity. Dental caries is a worldwide problem that caused by microbial growth usually progress from tooth enamel to the underlying pulpal tissues and root canal. This situation could be controlled by a sequence of steps to remove microorganisms and fill root canal with a suitable long-lasting root canal sealer. Unfortunately, leachable and degradation products of the currently used sealers compromised their antimicrobial activity by inflammatory modulation associated with irritation and toxicity of periapical tissues.
Materials and methods: Hence, propolis was selected to be designed as a natural root canal sealer due to its amazing functional properties. Moreover, its handling properties were enhanced and potentiated by its incorporation in polymeric nanoparticles (NPs). Frist, propolis was collected, extracted and analyzed for its bioactive compounds. After that, propolis-loaded NPs of PLGA (ProE-loaded NPs) were developed and fully characterized regarding physicochemical properties, in vitro release and in vitro cytotoxicity. Then, root canal sealers were fabricated and assayed for their antimicrobial activity. Both cytotoxicity and antimicrobial activity were compared to those of a model sealer; AH Plus®.
Results: The results revealed that spherical nanoscopic NPs with narrow size distribution were obtained. ProE-loaded NPs exhibited accepted entrapment efficiency (>80) and prolonged release. In vitro cytotoxicity study confirmed the safety of ProE-loaded NPs. Also, the developed sealers showed antimicrobial activity versus bacterial strains of Enterococcus faecalis and Streptococcus mutans and antifungal activity against Candida albicans.
Conclusion: ProE-loaded NPs could be incorporated in and represented as a root canal sealer with prolonged release and enhanced cytocompatibility as well as antimicrobial activities.
Keywords: propolis, sealer, polymeric nanoparticles, PLGA, in vitro cytotoxicity, antimicrobial activity
Introduction
The oral cavity contains a wide diversity of microorganisms that propagate to form biofilms and cause diseases, such as periodontitis and caries. Dental caries can progress from tooth enamel to the deep dentin and finally attack the underlying pulpal tissues and root canal leading to pulpitis and apical pathosis. Root canal treatment or endodontics is a sequence of steps to the infected dental pulp by removing infection and protection from future microbial attack.1 The removal of such pathogens followed by filling of the root canal with a suitable sealer became the main target of nonsurgical root canal treatment. Actually, the delivery of antimicrobial agents to the root canal and dentinal tubules is a challenging task due to the complexity of the root canal anatomy and the inability of currently used sealers to achieve complete cleaning. Even after root canal preparation, microorganisms may persist in dentinal tubules and prevent successful outcomes in a proportion of cases.2 Therefore, it is essential to prolong the delivery of the antimicrobial agents beyond that of the currently available ones.3
Unfortunately, some of the most currently used root canal sealers induce inflammatory modulation in the apical tissues such as degeneration of matrix protein. Moreover, the incidence of periapical irritation and toxicity were reported to occur with some sealers containing paraformaldehyde.4 A root canal sealer with antimicrobial activity, biocompatibility, accepted sealing ability, enhanced accessibility, limited cytotoxicity and prolonged efficacy might better increase the probabilities for fruitful endodontic treatment outcomes. However, no material satisfies all the requirements for a perfect root canal sealer.5
As it is known, the nature can provide us with talented sources for detection of drugs such as propolis. Propolis is the generic name of a natural strongly adhesive resinous product collected from plants by honeybees. It is an amazing complex mixture with diversified bioactive compounds that have antibacterial, anti-inflammatory, antifungal, antiviral, antioxidant, analgesic, immunostimulating, anticancer and cytostatic activity in addition to its effectiveness in tissue regeneration.6,7 The chemical composition of propolis is governed by the type of plant pollen, bee species, the collection season, the geographic zone and origin from which it comes.8
Since ancient eras, propolis has been used by humans to meet the needs of health, cosmetics and food preservation, and it is still used as a therapy in modern medicine and dental sciences.9,10 The treatment of dental plaque and gingivitis in humans was reported to be achieved by a propolis mouthwash with no experienced side effects during 90 days of treatment.11 Also, propolis was fabricated in the form of nanofibers,12 mouthwash,13 chips,14 semisolid systems6 and varnishes15 against oral pathogen bacteria. Hence, propolis was selected in our study to be used as a root canal sealer. At present, the application of nanotechnology in endodontics is restricted to a few studies that evaluated the antimicrobial activity against endodontic pathogens.16 Nanoparticles (NPs) as one of the novel strategies that has a major in the past few years owing to their pioneering and functional properties.17 Practical application of NPs in endodontics had been predominantly focused on the combination of nanocomposites, such as zinc oxide, and endodontic sealers. Also, NPs were used as a medication, additive within sealers/restorative materials and in solutions for irrigation.18 Up to our knowledge, root canal sealer based on a natural bioactive antimicrobial agent has not been designed up to now. Therefore, integrating the benefits of propolis as a natural bioactive material with the innovative profits of nanotechnology was thought to generate novel delivery systems that might meet the requirements of worthy sealers. Poly(lactic-co-glycolic acid) (PLGA) is frequently used in nanomedicine due to its biodegradability by natural pathways, biocompatibility and its capacity to deliver lipophilic, amphiphilic or hydrophilic drugs.3,19 Hence, propolis-loaded NPs of PLGA (ProE-loaded NPs) were developed and fully characterized regarding physicochemical properties, in vitro release and in vitro cytotoxicity. Then, root canal sealers were fabricated and assayed for their antimicrobial activity.
In the light of the above-stated details, it was a valuable goal to design, prepare and evaluate propolis and propolis-loaded polymeric NPs as innovative and naturally based root canal sealers with enhanced and extended antimicrobial action associated with biocompatibility and ease of applicability.
Methodology
Materials
Egyptian propolis (Dakhahlia Province, Egypt), PLGA (LA:GA=50:50) (Purasorb PDLGA®5010, 50/50 DL-lactide/glycolide copolymer, molecular weight 153,000, Purac Biomaterials, Holland), Polyvinyl alcohol (PVA, molecular weight 14 kDa, BDH, USA), Trehalose dihydrate extrapure (Sisco Research Laboratories Pvt. Ltd., India), Polyoxyethylene (20) sorbitan monolaurate (Tween 20) (LOBA Chemie Pvt. Ltd., India), WI-38 cell line (Human lung fibroblasts, Vacsera, Giza, Egypt), AH Plus® (Dentsply De Trey GmbH, Konstanz, Germany), Carbopol 940 and hydroxypropyl methyl cellulose K4M (HPMC) (Colorcon, UK.), Triethanolamine (TEA) (Nice Chemicals Pvt. Ltd., Kerala, India), Enterococcus faecalis (E. faecalis) American Type Cell Culture Collection (ATCC) 19434, Streptococcus mutans (S. mutans) ATCC25175 were obtained from Microbiological Resources Centre (Ain Shams University, Cairo MIRCEN, Egypt) and Candida albicans (C. albicans) Sc5314 was kindly provided by Dr. Mohammed El-Mowafy (Department of Microbiology and Immunology, Faculty of Pharmacy, Mansoura University, Egypt).
Preparation Of Egyptian Propolis Extract (ProE)
Samples of Egyptian propolis were collected from Dakhahlia province (Delta, Egypt) in April 2016 and stored at –20°C. After freezing, propolis sample was fragmented into small parts to facilitate the removal of any debris. The frozen propolis was powdered using an electric mill. Immediately, 30 g of the powdered propolis was transferred into an amber glass-stoppered jar and macerated in 70 mL of ethanol (70%) at room temperature. The vessel was stored in dark with daily twice shaking for about 15 days. Then, the mixture was centrifuged at 5000 rpm for 10 mins and the supernatant was collected. The obtained supernatant was filtered through Whatman No. 1 filter paper. The resulting extract was evaporated in vacuum oven at 40°C and reduced pressure at 500 mbar Hg. The dried propolis extract (ProE) was stored at –20°C until further investigation.
Gas chromatography/Mass Spectrometry Of ProE (GC/MS)
Sample Preparation
ProE was derivatized for chromatography by silylation. A total of 1.5 mg of ProE was mixed with 20 μL pyridine and 30 μL of N, O-bis-(trimethylsilyl)trifluoroacetamide (BSTFA). Then, the mixture was kept at 80°C for 30 mins and the silylated ProE was analyzed by GC/MS.20
Chromatographic Procedure
A mass spectrometer (Finnigan MAT SSQ 7000) was coupled with a Varian 3400 gas chromatograph. DB-1 column, 30 m x 0.32 mm (internal diameter), was used with helium as carrier gas (He pressure, 20 Mpa/cm2), injector temperature of 310°C and GC temperature program, 85–310°C at 3°C/min (10-min initial hold). The mass spectra were noted in electron ionization (EI) mode at 70 eV. The repetition rate of scan was 0.5 s over a mass range of 39–650 atomic mass units (amu).
Compounds Identification
The identification was performed using computer search user-generated reference libraries, incorporating mass spectra. Peaks were inspected by single-ion chromatographic reconstruction to approve their homogeneity. Sometimes, when identical spectra have not been originated, only the structural type of the corresponding constituent was suggested on the basis of its mass spectral fragmentation. Also, reference compounds were co-chromatographed whenever possible to authorize GC retention times.
Preparation Of ProE-Loaded NPs
Different ProE-loaded PLGA NPs (NP1, NP2 and NP5) were prepared by nanoprecipitation. Briefly, PLGA and ProE were dissolved in 10 mL acetone to give the organic phase. ProE at concentration of 0.5%, two different concentrations of PLGA (1% and 0.6%) and PVA (2% and 5%) were used as shown in Table 1. After that, 7 mL of the organic mixture was added dropwise into 40 mL of aqueous PVA solution under magnetic stirring at a flow rate of 0.55 mL/min by a syringe attached to a 24-gauge needle. The mixture was sonicated at 100% amplitude with a pulse on 10 sand pulse off 5 s for 10 mins in an ice bath (Sonics Vibra cell, Sonic & Materials, Inc., USA). The obtained NPs dispersion was stirred overnight at a moderate stirring rate to allow complete evaporation of acetone. The NPs dispersion was then filtered through Whatman No. 1 filter paper to remove any agglomerates from the system. The obtained NPs were separated by centrifugation at 10,000 rpm for 1 hr (Benchtop Centrifuge, Sigma Laborzentrifugen, Germany). The final NP pellet was resuspended in deionized water (DIW) containing trehalose at a concentration of 5% w/v to serve as a cryoprotectant. After freezing overnight, NPs were lyophilized at −80°C (Freeze dryer, SIM FD8-8T, SIM International, USA). The final lyophilized product of NPs was collected and stored at 4°C for further evaluation. Plain NPs (NPP) were prepared as the procedure mentioned earlier except the addition of ProE.
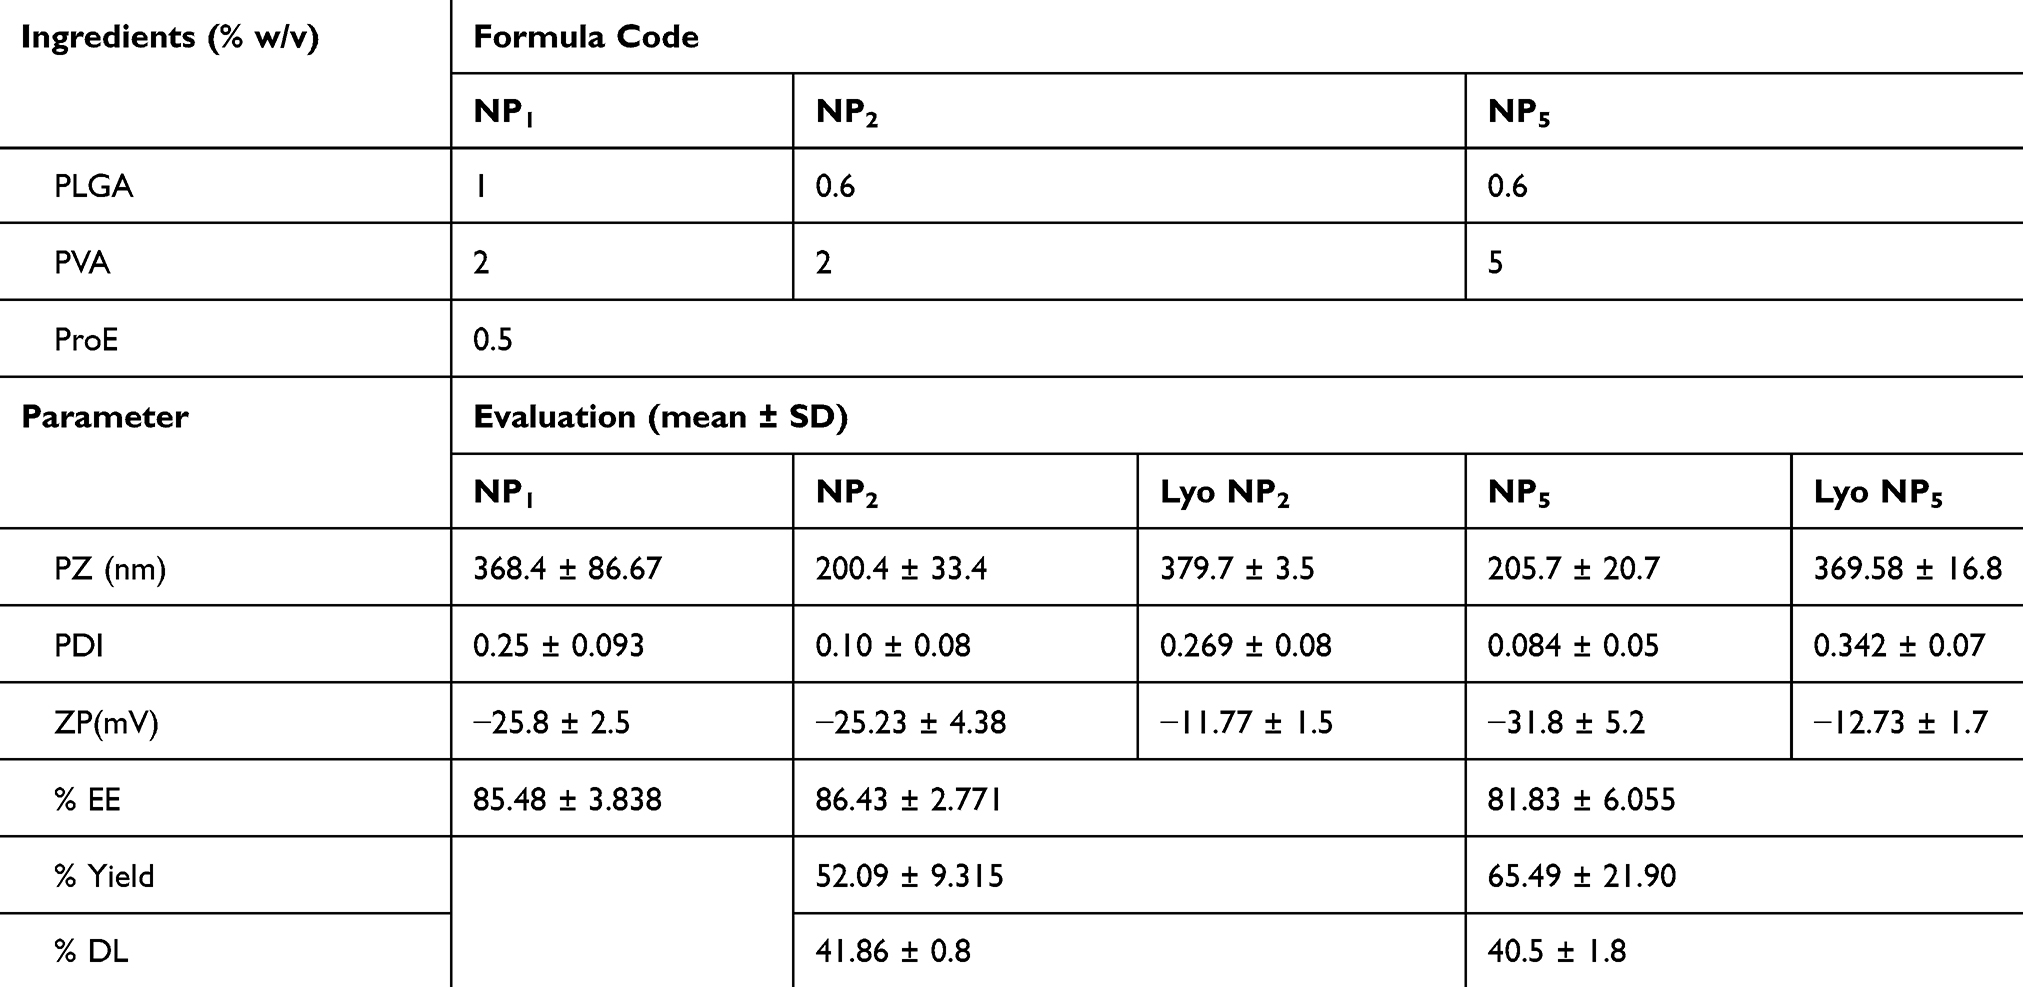 |
Table 1 Ingredients And Physicochemical Characteristics Of The Prepared NPs |
Characterization Of ProE-Loaded NPs
Determination Of Particle Size, Polydispersity Index And Zeta Potential
Particle sizes (PZ), polydispersity index (PDI) and zeta potential (ζ-potential) of ProE-loaded NPs were measured (Zetasizer Nanoseries, Malvern Instruments Limited, UK). Prior to analysis, NP samples were diluted with DIW to obtain a suitable concentration. PZ and PDI were measured by photon correlation spectroscopy (PCS) relying upon the theory of dynamic light scattering (DLS) at a scattering angle of 90° and a temperature of 25°C. The experiments were repeated three times and the results were calculated as mean ± SD.
Entrapment Efficiency, Drug Loading Capacity And Percent Yield
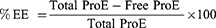
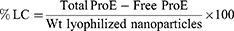
ProE entrapment was determined indirectly using non-entrapped or free ProE which remained in the supernatants after centrifugation. Free ProE was measured spectrophotometrically at 323 nm (UV-VIS Spectro double beam, Labomed Inc., USA). Pre-studied spectrum of ProE revealed that the optimum absorption peak was at 323 nm. Hence, wavelength of 323 nm was used to construct a calibration curve that was found to obey Beer–Lambert’s Law. NPP preparations were used as parallel controls to eliminate any impact of background. The loading capacity (%LC), entrapment efficiency (%EE) and percent yield (%Yield) of the ProE-loaded NPs were calculated according to the following equations:21

Morphological Characteristics
Shape and topography of the prepared NPs were observed by scanning electron microscopy (SEM) (JEOL JSM 6510 lv, JEOL Ltd, Tokyo, Japan). High-performance digital imaging transmission electron microscopy (TEM) (JEOL JEM-2100, JEOL Ltd, Tokyo, Japan) was used for further evaluation of NPs morphology. To illuminate the effect of trehalose, both cryoprotected and non-cryoprotected lyophilizate samples were prepared and photographed by SEM. Cryoprotected samples were NPs that lyophilized after cryoprotection by addition of trehalose as stated in the section “Preparation of Pro-E-loaded NPs”. On the other hand, NPs that lyophilized directly without addition of trehalose were described as non-cryoprotected ones. Samples were placed on a double-sided adhesive carbon tape over aluminum stubs to get a uniform layer of particles. Then, samples were made electrically conductive by coating with a thin layer (10 nm) of gold using a sputter gold coater (Sputter Carbon/Gold Coater, SPI SUPPLIES, USA). The prepared samples were subsequently examined and photographed at various magnifications with direct data capture of the images.
For TEM, samples of both freshly prepared NPs and cryoprotected lyophilizates of NP2 and NP5 were examined. A droplet of the NP dispersion was appropriately diluted, placed on 400 mesh copper grids, air-dried and examined.
Fourier Transform-Infrared (FT-IR) Spectroscopy
FTIR spectra of pure ProE, PLGA, PVA, NP2, NP5 and trehalose were determined using FT-IR spectrophotometer (Thermo Fisher Scientific, Inc., Waltham, MA, USA). Disk of each sample with potassium bromide was prepared and individually scanned over a wavenumber range of 500–4000 cm−1.
Thermal Analysis Of NPs
Samples (4 mg each) of pure ProE, PLGA, PVA, NP2, NP5 and trehalose were thermally characterized by Differential Scanning Calorimetry (DSC) (Pyris 6 DSC, Perkin Elmer Inc., Waltham, MA, USA). Samples were kept at 20°C for 1 min and then heated from 20°C to 400°C at a rate of 10 °C/min.
In Vitro Release Of ProE And Its Kinetics
Release of ProE from ProE-loaded NPs (NP2 and NP5) and free ProE was studied using modified vertical Franz diffusion cell.22 Each receptor half-cell was filled with suitable volume of release medium (Vm = 50 mL) of phosphate buffer pH 7.4 (PB7.4). Tween 20 (0.5% v/v) was added to release medium to ensure sink conditions.10 Donor and receptor compartments were separated by a semipermeable cellulose membrane (Spectra/Por® Dialysis Membrane, MWCO 12–14 KDa, Spectrum Laboratories, Inc., CA, USA) that was equilibrated with PB7.4 prior to the experiment. Adequate amounts of the lyophilized NPs and Free ProE (equivalent to 20 mg of ProE) were suspended in 2 mL of PB7.4 each. The resultant suspensions were transferred to the donor compartments which were covered with a wax foil (Parafilm® M, Bemis Company Inc., Oshkosh, WI, USA) to prevent evaporation of water. The diffusion cells with area 7.07 cm2 each were positioned in a shaking incubator (GFL, Gesellschaft fur Labortechnik GmbH, Burgwedel, Germany), kept at 37°C±0.2°C and agitated at 100 rpm throughout the experiment. Samples of release media (Vs = 2 mL each) were withdrawn at predetermined time intervals and substituted with an equal volume of fresh release medium. The samples were filtered using 0.45 µm millipore filter and analyzed spectrophotometrically at 323 nm. Triplicates of each experiment were achieved and the cumulative concentration of ProE released at each time interval was calculated according to the following equation.
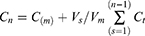
where Vs is sample volume, Vm is release medium volume, Cm is the practically measured concentration of sample nth sample, Cn is the expectable concentration of the nth sample if the n-1 sample had not been detached from the medium, Ct is the total of all measured concentrations at n-1 samples and n-1 is the total number of all samples withdrawn prior to the sample being measured.
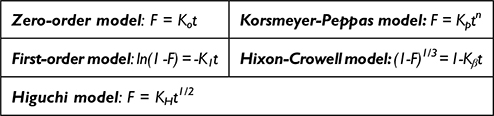
The release data were analyzed with the following mathematical models: zero-order kinetic; first-order kinetic, Hixon-Crowel model (H-C), Higuchi equation23 and Korsmeyer-Peppas equation (K-P).24
 |
|
where F denotes the fraction of ProE released in time t, Ko is the zero-order release constant, K1 is the first-order release constant, KH is the Higuchi dissolution constant, Kβ is the release constant, Kp is the K-P constant and n is the diffusion exponent. The predominant model is the one with the highest correlation coefficient (r2).25 According to the obtained results, NP2 was selected for subsequent investigations.
In Vitro Cytotoxicity Of ProE-Loaded NPs
In vitro cytotoxicity of pure ProE, NP2, NPP and the model sealer was estimated by MTT [3-(4,5-dimethylthiazol-2-yl)-2,5-diphenyl tetrazolium bromide] colorimetric assay using WI-38 cell line (human lung fibroblast). At first, cell lines were cultured in 75 cm2 cell culture flasks using RPMI medium supplemented with 10% fetal bovine serum (FBS) as culture medium. The cells (104–106 cells/well) were cultured in a 96-well microtiter plate and incubated in 5% CO2 at 37°C (CO2 incubator, Jouan, France) for 24 hrs until complete cell attachment.
ProE was weighed aseptically and dissolved at a suitable concentration in a mixture (1:4) of DMSO and sterile phosphate buffer of pH 7.4 (SPB7.4) to obtain ProE stock solution. The two components of the model sealer; paste A and paste B were mixed according to the manufacturer’s instructions under aseptic conditions, dried in vacuum oven and ground to fine particles. Freshly prepared stock dispersions of NP2, NPP and the model sealer were prepared aseptically using SPB7.4. From the prepared stocks, serial dilutions at concentrations of 0, 20, 40, 60, 80 and 100 µg/mL were aseptically constructed. After that, the cells were treated with the prepared concentrations except for a control set of untreated cells and all were incubated for 48 hrs. By the end of incubation period, media were discarded and the plates were washed with SPB7.4 three times. MTT (5 mg/mL) was dissolved in SPB7.4 and filtered through 0.22 μm syringe filters. Plates were inoculated with 20 µL/well of the previously prepared MTT solution and incubated at 37°C for 4 hrs to allow the formation of formazan as dark crystals in the bottom of the wells. Then, excess MTT solution was drained and plates were rinsed with SPB7.4 three times. To dissolve the intracellular blue formazan complex, DMSO (50 µL/well) was added and the plates were shaken on a plate shaker (Stuart, England) for 30 mins. Immediately, optical densities of the treated cells (OD) were determined at 570 using an ELISA plate reader (Multiwall microplate reader, Dynatec medical products, England). The OD of untreated cells was considered as 100% viability. IC50 (µg/mL), ie (50% inhibition concentration) was calculated for the tested compounds using the GraphPad Prism 6.0 (GraphPad Software, Inc., San Diego, CA, USA). The experiment was completed in triplicate and the percent of cell viability was calculated according to the following equation.
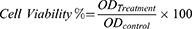
where ODTreatment is the mean optical density of wells treated with the tested sample and ODControl is the mean optical density of untreated cells.
Evaluation Of Antimicrobial Activity
Preparation Of Sealers And Microorganisms
ProE, NP2 and the model sealer were prepared as root canal sealers to evaluate their antimicrobial activity. ProE was used without further treatment and assigned as PE sealer. NP2-based sealer entitled as PE nanosealer was fabricated by mixing a ProE-equivalent amount of NP2 with a preformulated in-situ gelling system. Carpobol 940 and HPMC K4M at a concentration of 0.6% and 0.4%, respectively, were used to prepare the gelling system that its pH was adjusted by TEA as stated by Paradkar and Vaghela;26 whereas, the model sealer was prepared according to the manufacturer’s instructions. Sealers were freshly prepared under aseptic conditions just prior to well coating step. Bacterial strains were cultivated in tryptone soya broth (TSB) and grown at 37°C for 18 hrs. C. albicans Sc5314 was propagated on yeast peptone dextrose media (1% yeast, 2% peptone and 2% dextrose) at 37°C for 18 hrs.
Direct Contact Test (DCT)
For each microorganism, a sterile 96-well microtiter plate was divided into two groups; group A wells and group B wells as shown for bacterial strains (Figure 1A) and C. albicans (Figure 1B). Group A represented direct contact wells in which the microorganism would be in direct contact with the tested sealer. While wells of group B signified the transfer wells that would be inoculated later with corresponding aliquots of group A. For coating of group A wells, the plate was held in a vertical position and the lower walls of wells were coated with equal amounts of the corresponding sealer using a cavity liner applicator. The plates were kept in the same position and incubated at 37°C for 2 hours till complete dryness and setting of the tested sealer. Then, a 10 µL/well of diluted bacterial suspension (contained 1 × 10⁶ CFU/mL) was carefully transferred. For each well of group A, 245 µL TSB was added to cover the level of the sealer and come in direct contact with it. At that time, the plate was incubated again at 37°C for 2 hr to allow propagation of the microorganism. To the group B wells that contained 215 μL/well fresh TSB, 15 µL/well of media was transferred from group A wells to the corresponding ones of group B at the end of incubation time. Subsequently, the prepared plates were re-incubated at 37°C and the optical density of all wells was determined at 600 nm (OD600) after 0, 1, 2, 3, 4, 5, 6, 7, 8, 9, 10, 11, 12 and 24 hrs of incubation. Then, the microbial growth was correlated with OD600 of the wells at these various time points. Therefore, monitoring microbial growth of A wells could indicate the antimicrobial effect of the tested sealer themselves upon direct contact with microorganisms. Also, the effect of the diffused materials in the medium of A wells could be designated upon incubation. On the other hand, B wells could detect only the antimicrobial activity of the substances that released from the tested sealers. In the same plate, suspensions of the tested microorganism placed on the wall of uncoated wells were used to serve as a positive control, whereas wells coated with the sealers but without the microorganism were considered as the negative one. The antimicrobial effect of the tested sealers was obtained in comparison with the control samples. The experiment was performed in triplicates under aseptic conditions to ensure reproducibility.27
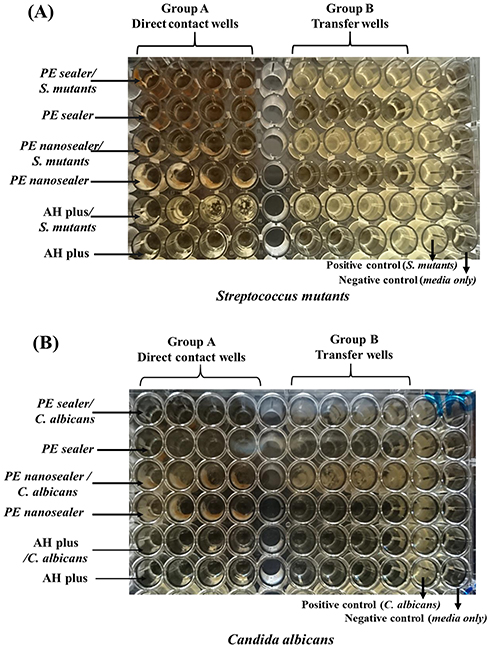 |
Figure 1 Direct contact test of PE sealer, PE nanosealer and AH plus on (A) Streptococcus mutans and (B) Candida albicans with positive microbial growth and negative control; media only. |
Statistical Analysis
The obtained results were statistically analyzed by Student t-test at a significance level of P < 0.05 using Graphpad prism software (version 6.00; Graphpad software, San Diego, USA).
Results And Discussion
GC/MS Analysis
The chemical composition of propolis is affected by the geographical location, harvesting season, botanical origin28–30 and bee species.31 All over the world, more than 300 chemical compounds belonging to the flavonoids, terpenes and phenolics have been identified in propolis.32 Poplar propolis can be found in the temperate regions of North America, Europe, China, non-tropical regions of Asia and New Zealand. In this type of propolis, flavones, flavanones, cinnamic acids and their esters are the typical components. In tropical region, especially Brazilian green propolis, the dominating chemical components are caffeoylquinic acids, prenylated phenylpropanoids and diterpenes.33,34 For propolis of the Pacific region, geranyl flavanones are the characteristic compounds which are also found in propolis from the African region.35 Generally, Egyptian propolis sample is more or less closely related to that of the temperate regions as it is characterized by the presence of flavonoids, phenolic acids and their esters.
In our study, propolis was collected from Dakahlia province, every province is characterized by the presence of predominant trees or shrubs. About 47 compounds including aliphatic, phenolic acids and their esters, flavonoids, sugars and other compounds were identified in ProE. The results obtained are summarized in Table 2 and GC/MS profile of ProE (Figure 2). ProE was characterized by the presence of seven phenolic acids; m-hydroxy-benzoic acid, p-hydroxy-benzoic acid, m-hydroxymandelic acid, 3,4-dimethoxy-hydrocinnamic acid, ferulic acid (FA), cis- and trans-caffeic acids were identified. Trans-caffeic acid represented the highest concentration (4.35%) among other phenolic acids. Also, eight phenolic acid esters were identified, from which six caffeic acid esters were found. Pentanyl caffeate (7.4%) and 2-methyl-2-butenyl-trans-caffeate (7.9%) were the major characteristic esters, besides the presence of other phenolic esters like 3-methyl-3-butenyl-cis-caffeate, 2-methyl-2-butenyl-cis-caffeate, 3-methyl-3-butenyl-trans-caffeate, 3-methyl-3-butenyl-trans-caffeate and tetradecatetraenyl caffeate. Phenyl-cis-p-coumarate and dimethylallyl coumarate were also present (Table 2). Additionally, seven aliphatic acids; 2-hydroxyl-propanoic and octadecenoic acids were present in high concentration, while propanedioic, diglycolic, pentadecenoic, hexadecanoic and octadecanoic acids were present in moderate amounts (Table 2). Some aliphatic acid esters; hexadecanoic acid and 10-octadecenoic acid, methyl esters besides octadecanoic acid-2,3-hydroxy-propyl ester were identified. Moreover, seven flavonoids including pinostrobin, galangin, dihydroxy flavone, 5,7- dihydroxy and 3,5,7- trihydroxy-4ʹ-butanylflavones besides 5,7,4ʹ-trihydroxy-3-butanoyloxyflavone were recognized (Table 2).
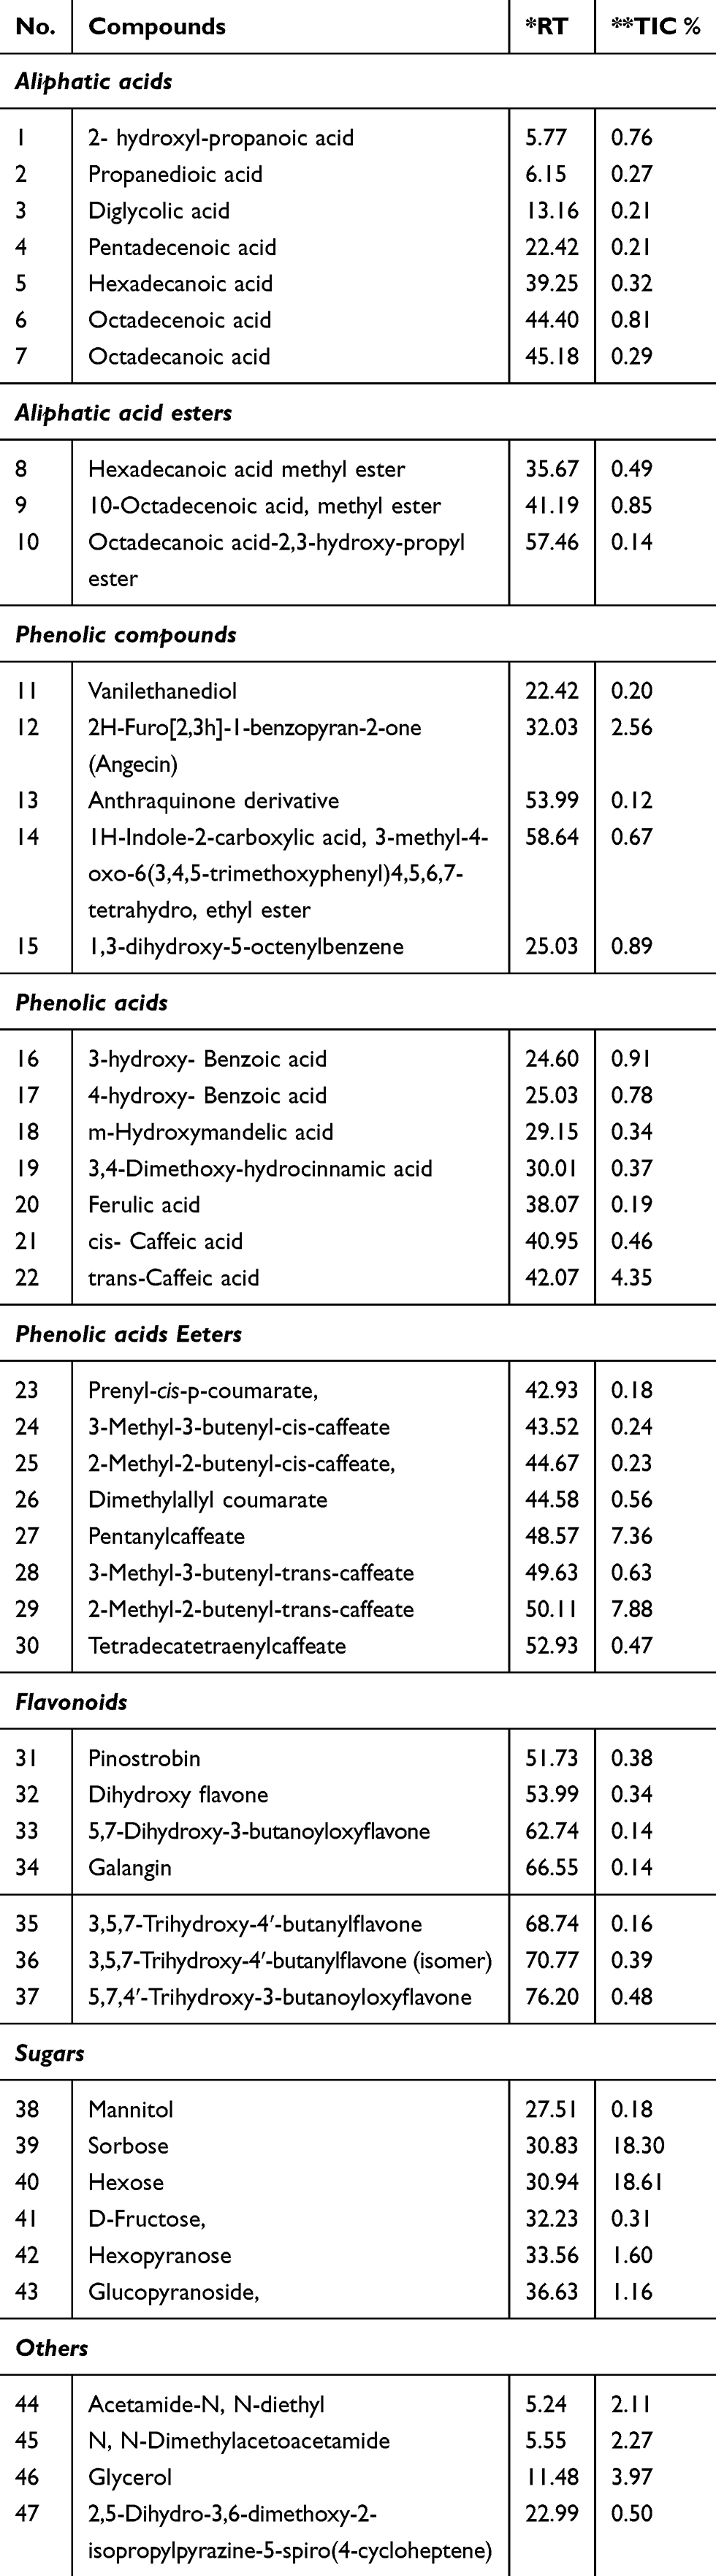 |
Table 2 Chemical Composition Assessed By GC/MS Analysis Of Pure ProE |
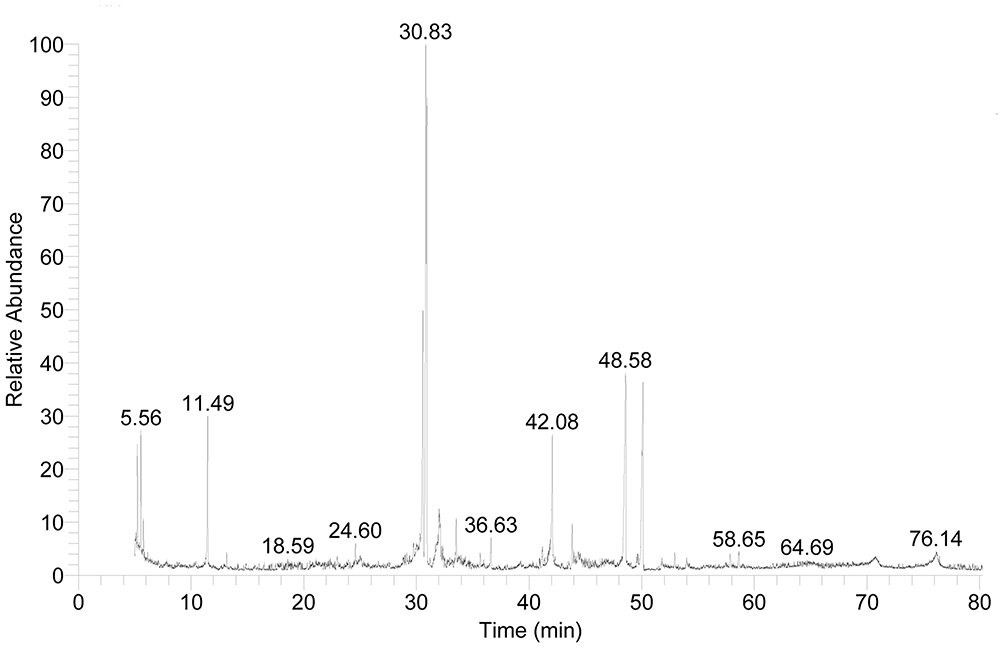 |
Figure 2 GC-MS of ProE. |
It was reported that caffeic acid, quercetin, naringenin and caffeic acid phenethyl ester (CAPE) have some anti-inflammatory effect. These compounds could reduce the level of prostaglandins and leukotriene synthesis by macrophages and show inhibitory effects on myeloperoxidase activity, NADPH-oxidase, ornithine decarboxylase and tyrosine-protein-kinase. Ramos and Miranda stated that the identified compounds such as salicylic acid, apigenin, FA and galangin have anti-inflammatory activity.36,37 The anti-inflammatory effect of FA was inferior to that of Oldenlandia diffusa decoction, based on a comparison of IL-1β TNF-α levels.38 The anti-inflammatory effect of four dihydroxy flavone derivatives; 3,7-dihydroxy flavone, 5,6-dihydroxy flavone, 3,3ʹ- dihydroxy flavone and 6,3ʹ-dihydroxy flavone was reported. The anti-inflammatory activity of dihydroxy flavones may be through the interaction with cyclooxygenases, cytokines and reactive oxygen species.39 Additionally, caffeic acid, octyl caffeate and CAPE derivatives are potent antioxidants by inhibiting liposaccharide-inducible nitric oxide synthases (LPS-induced iNOS) expression in RAW 264.7.28–30
Characterization Of ProE-Loaded NPs
Determination Of PZ, PDI, ZP, EE%, DL% And Yield%
Table 1 shows the PZ, PDI, ζ-potential, EE%, DL% and Yield% of the prepared NPs. The mean PZ of the prepared NPs before lyophilization was 368.4 nm, 200.4 nm and 205.7 nm for NP1, NP2 and NP5, respectively. This is significant to obtain NPs with proper size that could reach the smallest dentinal tubules. It is reported that the size which meets this condition ranged from 500 nm to 1 µm.40 The PDI values ranged between 0.084 and 0.25, demonstrating the low heterogeneity of NPs. The ζ-potential analysis showed that all NPs presented a negative surface charge, which is a characteristic feature of PLGA due to its acidic nature.41 During preparation, it was observed that bulk of PLGA of NP1 separated as coarse agglomerates. This finding could be attributed to higher PLGA concentration which led to an increase of both PZ and PDI of NP1 (Table 1). Moreover, increasing the viscosity of the dispersed phase of NP1 (i.e., PLGA organic solution) might hinder the rapid dispersion of PLGA solution into the aqueous phase. Subsequently, it was resulting in larger droplets followed by formation of larger NPs (NP1) after diffusion and evaporation of acetone. Besides, PVA was probably insufficient in case of NP1 to cover the surface of droplets completely, which caused the coalescence of droplets during the evaporation of acetone and aggregation of NP1.42,43 Hence, the subsequent preparation was directed towards decreasing PLGA concentration (NP2) and increasing PVA concentration (NP5). Although it was reported in the works of literature that increasing the concentration of PVA was usually associated with a decrease of PZ or PDI,42,43 the PZ, PDI and ζ-potential of NP5 were not significantly affected by the increase of PVA concentration (unpaired t-test, P > 0.05). It could be related to that once the optimum packing of PVA and the minimum droplet size were reached, the higher concentrations of PVA would not play any further role with regard to PZ.44
In an attempt to enhance stability of the prepared NPs, they were lyophilized to removal of water and prevent hydrolysis of the NPs in aqueous suspension.45 Prior to lyophilization, NP2 and NP5 were centrifuged to remove excess PVA and free ProE and their cryoprotected freeze-dried samples were analyzed for their PZ, ζ-potential and PDI. Although freeze-drying resulted in higher PZ than that before drying, mean PZ of NPs was still lower than 500 nm and PDI values were not more than 0.34. Additionally, it was observed that the ζ-potential of NP2 reduced from −25.23 mV to −11.77 mV after lyophilization. On the same way, the ζ-potential of NP5 reduced from −31.8 mV to −12.73 mV. Similar behavior was also observed in the literature.46
The noticeable decrease in the negative charge after lyophilization could be attributed to rearrangement of PVA at NP surface.47 Moreover, the cryoprotection behavior could contribute to the reduction of ζ-potential by masking the surface of NPs by trehalose that attached to their surface by hydrogen bonding. Comparing PZ and PDI of cryoprotected lyophilizates of NP2 and NP5, it was found that increasing PVA concentration was not significantly affected PZ, PDI or ζ-potential (unpaired t-test, P > 0.05).
Built upon above findings, the subsequent preparation and evaluation focused on NP2 and NP5 in terms of % EE, % DL and % Yield (Table 1). It was found that the % EE was more than 80% (86.43% and 81.83%) with % DL of 41.86% and 40.5% for NP2 and NP5, respectively. The reasonable % EE can be accredited to the poor solubility of ProE in water, so it was favorably segregated in the organic phase and only a minor quantity of ProE was missed in the aqueous phase. The usage of acetone, a vastly diffusible and volatile solvent, also had an optimistic effect on ProE encapsulation. Upon injection of organic phase into the aqueous one, acetone was removed quickly leaving the poorly water-soluble ProE encapsulated within NPs away from the surrounding aqueous medium.48 The values of %Yield were 52.09% and 65.49% for NP2 and NP5, respectively. From our findings, it could be established that increase of PVA concentration caused insignificant change of % EE (unpaired t-test, P > 0.05). This finding was in consistent with that of PZ where the optimum packing of PVA was reached, and hence, the higher concentration of PVA would not play any further role.
Morphological Characteristics
Figure 3 shows SEM micrographs comparing different batches of NPs (A) NP2, (B) cryoprotected NP2, (C) NP5 and (D) cryoprotected NP5. The influence of lyophilization on NP1 and NP5 without cryoprotection could be observed in Figure 3A and C where large number of aggregates and fused NPs with continuous film of PVA could be observed. On the other hand, the effects of cryoprotection were clearly noticeable in Figure 3B and D where NPs were uniform, homogenous in shape and with smooth regular surfaces without aggregates. This might predict the potential long-term stability of the cryoprotected NPs.
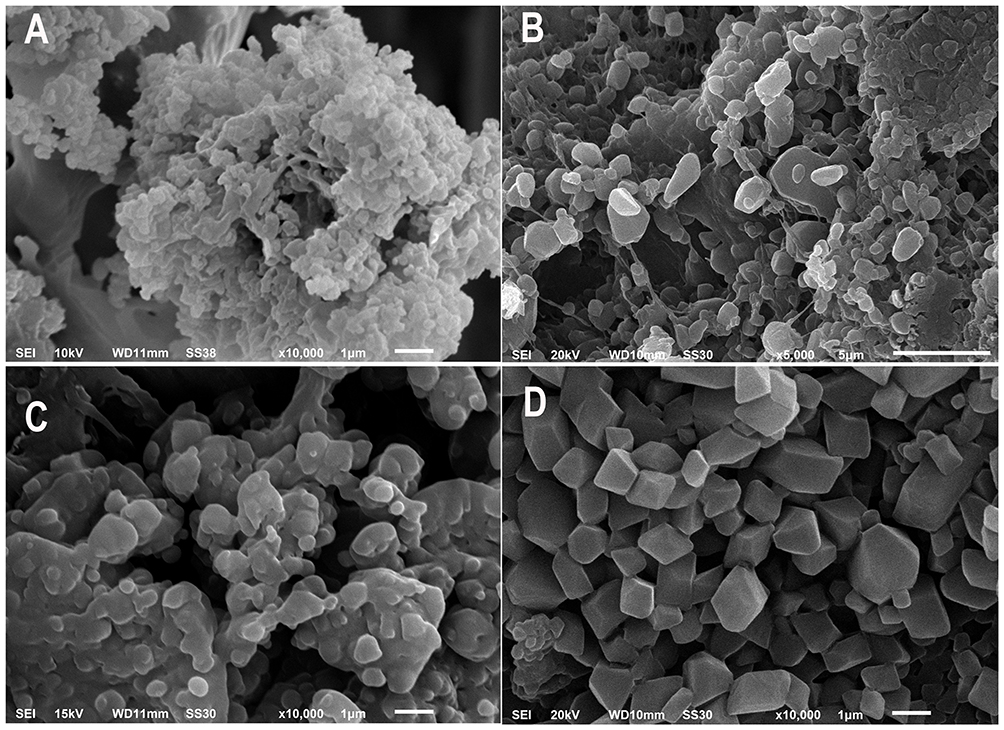 |
Figure 3 SEM micrographs comparing different batches of NPs; (A) NP2, (B) Cryoprotected NP2, (C) NP5 and (D) Cryoprotected NP5. |
Aggregation of non-cryoprotected NPs may be generated by many stresses of lyophilization that could destabilize colloidal suspension especially, the stress of freezing and dehydration. Hence, trehalose at concentration of 5% was used as a cryoprotectant for the subsequent preparation of NPs.42,44,49 Trehalose is considered as one of the most compatible cryoprotectant due to its amorphous nature that causes minimal damage. Moreover, trehalose has low hygroscopicity and high flexibility without internal hydrogen bonds, thereby avoiding interparticle hydrogen bonding, and higher glass transition temperature.50
TEM micrographs of (A) NP2, (C) NP5 and their cryoprotected analogs (B and D, respectively) are illustrated in Figure 4. Freshly prepared NP2 and NP5 (Figure 4A and C, respectively) confirmed homogenous, aggregation-free and perfectly spherical shape with smooth surface and in the size range of 200 nm. This geometry could enhance better cellular uptake than rod-shaped NPs, frequently owing the curvature of NPs affect the contact area with receptors of cell membrane.51 Furthermore, the particles exhibited a solid dense core of ProE surrounded by a polymeric coat of PLGA in the form of core-shell structure. The effects of cryoprotection were obviously noticeable upon redispersion and inspection of cryoprotected NP2 and NP5 (Figure 4B and D). Cryoprotected NPs retained their homogenous and non-aggregated spherical profile of corresponding fresh samples and the lyophilizated cakes were easily redispersible. Our findings suggested that lyophilization in the presence of trehalose (5%) had no negative influence on NP characteristics.
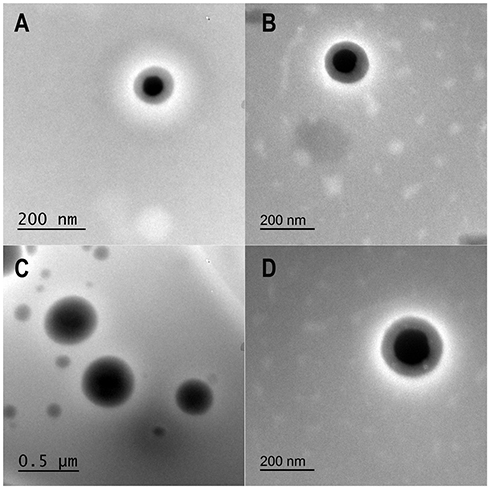 |
Figure 4 TEM micrographs comparing different batches of NPs; (A) NP2, (B) Cryoprotected NP2, (C) NP5 and (D) Cryoprotected NP5. |
FT-IR Spectroscopy
Figure 5 presents FT-IR spectra of pure ProE (A), PLGA (B), PVA (C), NP2 (D), NP5 (E) and trehalose (F). As FT-IR analysis is one of the significant approaches for the rapid and effective identification of encapsulated drug molecules, it was used to approve the formation of ProE-loaded NPs.52 Pure ProE spectrum shows typical O-H stretching of phenolic compounds at 3420 cm−1 (hydroxyl group of phenolic compounds). Also, peaks at 2926 and 2856 cm−1 are characteristic of C–H bonding vibrations of aliphatic groups (CH2, CH3). Characteristic bands at 1708, 1628, 1517 and 1442 cm−1 were attributed to the C=C of aromatic ring. The peak at 1056 cm−1 was attributed to the stretching of the aromatic ether C-O bond of flavonoids. A slight shift of specific peaks of pure ProE could be observed when compared to its spectra reported in the literature which could be related to the different origin of propolis.53,54
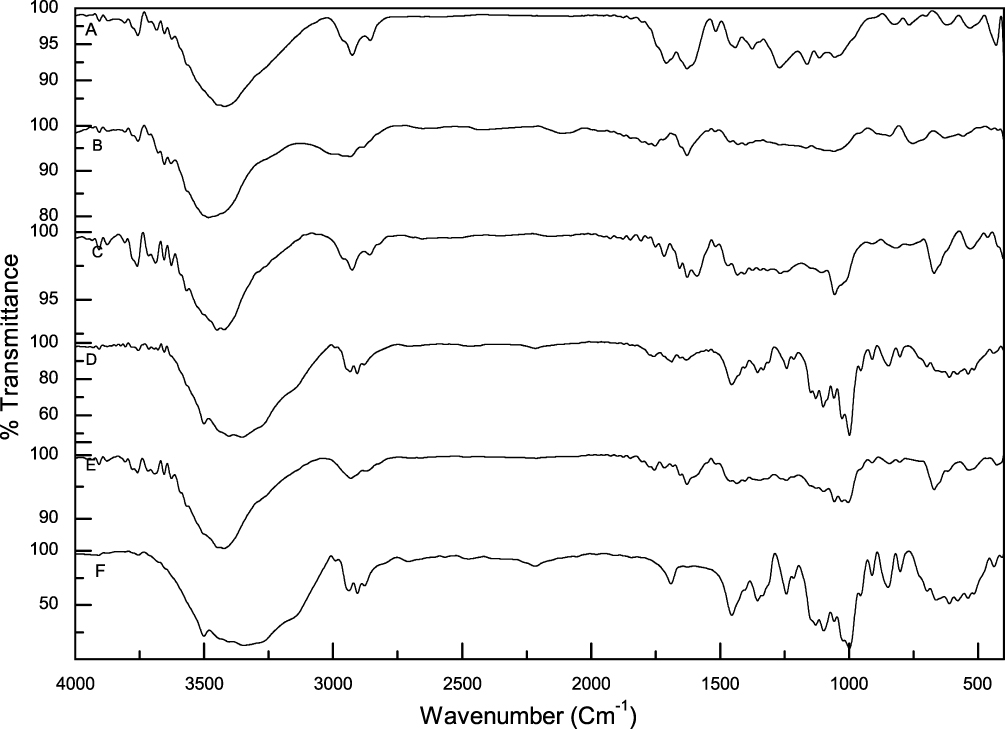 |
Figure 5 FT-IR spectra of pure ProE (A), PLGA (B), PVA (C), NP2 (D), NP5 (E) and trehalose (F). |
The FT-IR spectrum of PLGA shows absorption peaks between 2850 cm−1 and 3000 cm−1 that are assigned to stretching vibrations of C-H, CH2 and CH3. The bands recognized for the C=O, C-H stretching in methyl groups and stretching of C-O-C were noted at 1753, 1462 and 1059 cm−1, respectively. Matching FTIR spectra of pure ProE, PLGA, NP2 and NP5 revealed the existence of the typical bands of both ProE and PLGA in the NP spectra (Figure 5D and E) with slight or nearly no shifts. This proposed physical encapsulation of ProE in the matrix of NPs without chemical interaction concerning the functional groups of ProE and PLGA. Though, there was a reduction in the intensity of absorption peaks which may be owing to the formation of hydrogen bonding between the phenolic OH groups of ProE and hydroxyl groups of PLGA.55 To eliminate interference or confusion of background, the spectra of PVA and trehalose were also studied. The characteristic adsorption peaks from 2800 to 3500 cm−1 and from 900 to 1700 cm−1 in Figure 5C represent -OH and -CO- vibrations in PVA, respectively.56 Figure 5F exhibits stretch vibration of the two crystal water molecules in the dihydrate sample of trehalose at 3500 cm−1 as well; the bending peak of the crystal water in appears at 1691 cm−1. Two peaks observed at 999 and 956 cm−1 may correspond to the two antisymmetric and symmetric vibrations of the glycosidic bond of trehalose.57
Thermal Analysis
Figure 6 shows DSC thermograms of pure ProE (A), PLGA (B), PVA (C), NP2 (D), NP5 (E) and trehalose (F). The DSC thermogram of ProE (Figure 6A) showed two endothermic peaks at 99°C and 116.7°C followed by a group of weak endothermic peaks up to 162°C. The two endothermic peaks correspond to water volatilization and starting fusion of low molecular weight compounds such as flavonoids and phenolic compounds. The group of weak endothermic peaks was attributed to the end of the melting transition. The thermogram of PLGA (Figure 6B) exhibited two peaks at about 50°C and 389.6°C representing glass transition of PLGA followed by its thermal degradation, respectively. It was reported that the glass transition of PLGA occurred at 48–55°C range, with a midpoint value at 52°C.58 Two endothermic peaks were observed in the PVA thermogram (Figure 6D) at 228.6°C, 303.5°C and 333.1°C. DSC thermograms of NP2 and NP5 contain endothermic peaks at about 77°C, 182°C and 320°C (Figure 6D and E) without additional peaks of ProE which signifying its encapsulation into the matrix of NPs. To eliminate interference or confusion of background, the thermograms of PVA and trehalose were also studied. Pure PVA has a melt peak temperature of 224.45°C while trehalose thermogram (Figure 6F) shows sharp endothermic peaks at 85.37°C, 106.43°C, 190°C, 268.7°C and 308.5°C.
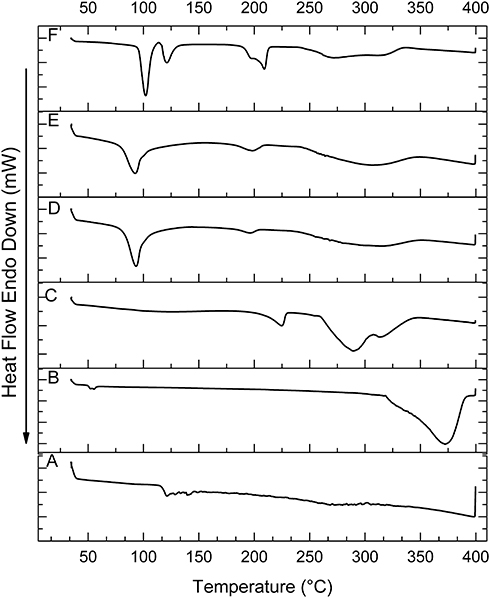 |
Figure 6 DSC thermograms of pure ProE (A), PLGA (B), PVA (C), NP2 (D), NP5 (E) and trehalose (F). |
In Vitro Release Of ProE And Its Kinetics
The in vitro release profiles of ProE from the prepared NPs and free ProE are shown in Figure 7. It could be observed that ProE release continued to reach percentages of 7.41% and 4.75% after 8 hrs followed by slower release rates to reach percentages of 9.61% and 5.84% up to 72 hr for NP2 and NP5, respectively. Generally, the percent of ProE released from NP5 was lower than that of NP2. On the other hand, the release of ProE from its pure form started and continued as a one phase all over the experiment time to reach about 24%. Unlike pure ProE, it was obvious that the release profiles of the prepared NPs exhibited two distinct phases. In phase I, release medium enhanced both the release of the drug molecules localized on the surface of the particle and initial erosion of the polymeric matrix.59 In phase II, subsequent dense polymeric layers eroded to allow diffusion of core-localized drug molecules leading to a much slower release.60 Lower percent of ProE released from NP5 could be attributed to higher concentration of PVA (5%). The hydroxyl groups of PVA adsorbed on the particle surface were thought to form a thicker film on the surface of NP5 via the stronger intra- or inter-molecular interaction. The thicker film possibly resulted in further delay of the diffusion of ProE out of the particles to the release medium.43
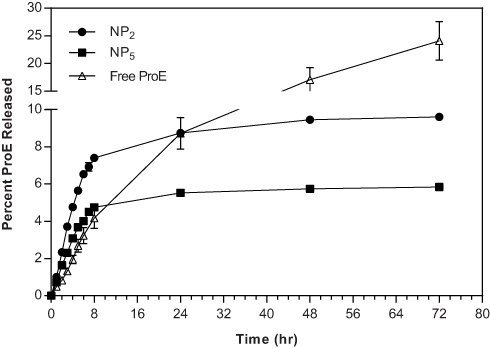 |
Figure 7 The in vitro release profiles of ProE from the prepared NPs and free ProE. |
To maximize the effectiveness of NPs as root canal sealer, ProE release from NPs needed to be slow enough to avoid substantial drug loss and thereby reducing toxicity in the long term. Thus, the kinetics of drug release from NPs should be an essential feature of their design and a property monitored for their quality.61 The drug release mechanism from NPs could occur by desorption, diffusion or degradation of the NPs.62 To define the release mechanism and the kinetic model that better fits the pattern of ProE release, the in vitro release data were investigated according to different mathematical models. A choice of a certain model was established on the highest r2. In accordance with the kinetic theory for spherical geometry model,63 when the coefficient n is equal to 0.43, release is governed by molecular diffusion of the drug according to potential gradient (Fickian diffusion). If n lies between 0.43 and 0.85, release has a non-Fickian behavior (Anomalous transport) that taking place via combined mechanisms of drug diffusion and polymer erosion. When n value equals 0.85, the mechanism corresponds zero-order kinetics (Case II transport) where the phenomenon of polymer dissolution predominates. Once n is greater than 0.85, the diffusion is organized by swelling and relaxation of polymer (Super Case II transport).25,64,65
The results of the kinetic analysis are presented in Table 3. It was observed that the release of ProE obeyed first rate kinetic. It means that ProE release from formulations followed the first Fick’s law and the release rate was directly proportional to the amounts of ProE retained in NPs offering sustained release. Hence, NPs provided controlled and continuous drug delivery, avoiding fluctuations in the rate of release. Further analysis of the release data by K-P equation showed that n values were more than 0.85. The geometry of NP2 and NP5 was considered spherical according to morphological evaluation (Figure 4). This indicated that the release mechanism was Super Case-II transport. Additionally, free ProE followed the Super Case-II transport with the value of n more than 0.89 that suggested dissolution of ProE (Table 3). This means that the release of ProE was governed mainly by erosion or degradation of PLGA for NP2 and NP5 and by dissolution mechanism of pure ProE.66 In the light of the obtained results, NP2 was designated to be subjected for more extensive subsequent evaluation.
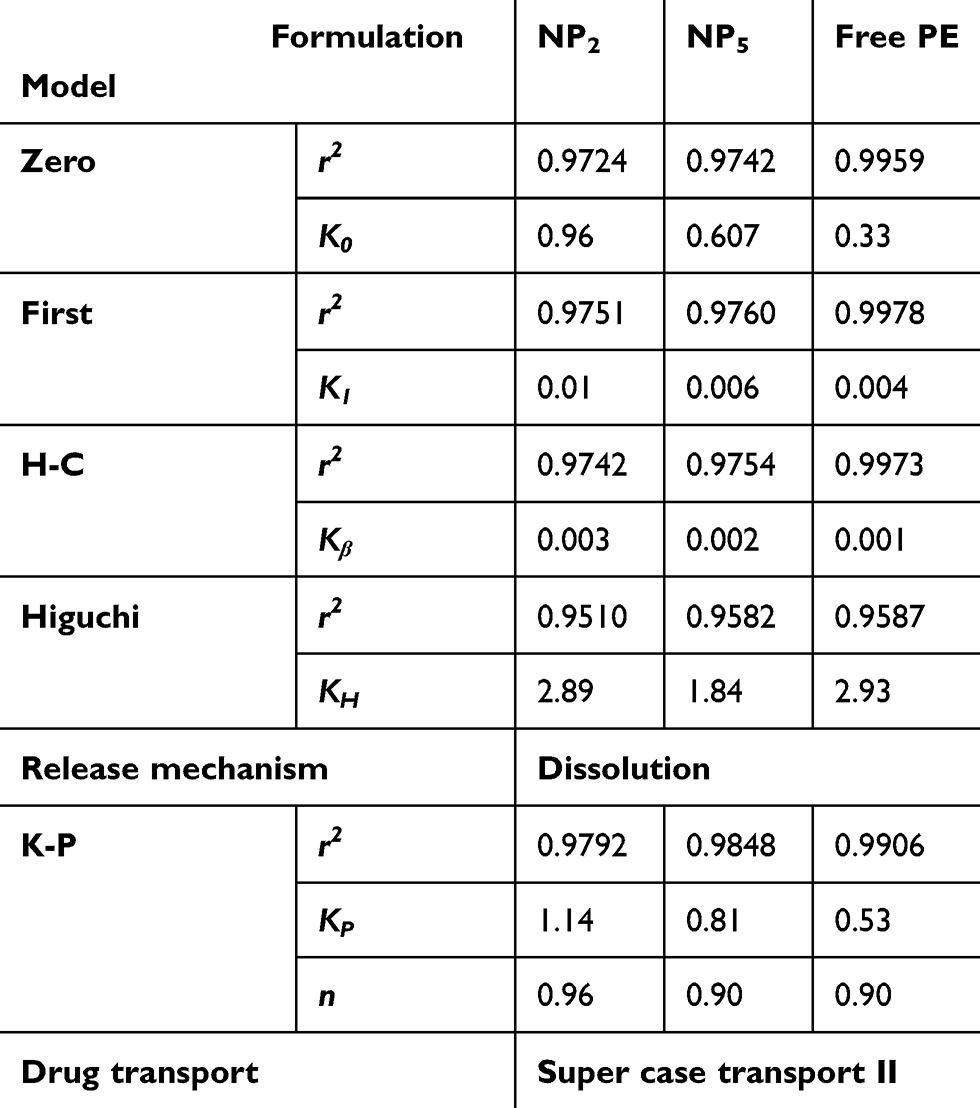 |
Table 3 Mathematical Modeling And Release Kinetics Of ProE From The Prepared NPs |
In Vitro Cytotoxicity Of ProE-Loaded NPs
Definitely, root fillers or sealers are placed in close contact with the periapical tissues for prolonged periods of time. Consequently, leachable substances or degradation products from sealers might get access to the adjacent tissues (periodontal ligaments, alveolar bone). Reasonably, the biological characters of such materials are noteworthy to be evaluated as cytotoxic effect can damage the surrounding periapical tissues. Some studies on the sealing properties of endodontic materials have verified the occurrence of microleakage from the root canal after filling of it.67
For evaluation of cytotoxicity, MTT assay was used as it is a quantitative, sensitive and reliable colorimetric technique that measures viability of cells. The cytotoxicity was investigated using WI-38 cell line which is normal human fibroblasts. Fibroblasts are major constituents of pulp connective tissue.4 According to literature, propolis has potential cytotoxic activity on different cancer cell lines.53,54 Therefore, it was necessary to verify its possible cytotoxicity in a normal cell line (WI-38). The reported IC50 values of propolis were found to vary widely for different cell lines which could be attributed to the dependence of propolis constituents on its geographical origin, bee species, plant pollen, etc. Comparative study of Al-Hiyasat et al stated that AH Plus® was the most biocompatible sealer and it showed low cytotoxicity among other tested ones.67 Hence, our developed sealers were compared to this currently approved sealer as a model one. We must keep in our mind that the selected model sealer belongs to resin-based sealer in which bisphenol A diglycidyl ether, which has been identified as a mutagenic-leached component.68,69 Also, minute amounts of formaldehyde, amine and other epoxy resin components were reported to leak from it to the nearby tissues.70 PLGA is a generally accepted polymer with low cytotoxicity, good biocompatibility and biodegradability. It already has been used in parenterals because its biodegradation products are nontoxic, noncarcinogenic and nonteratogenic.71,72 Consequently, NPP was considered as the safety control group.
Cell lines were treated with a set of concentrations (0, 20, 40, 60, 80 and 100 µg/mL) of ProE, NPP, NP2 and the model sealer and then the cell viability was assessed after 48 hrs. The results are illustrated in Figure 8 and they showed that the cell viability decreased in a dose-dependent manner upon treatment with the tested compounds and cell viability was slightly reduced at higher concentrations. The IC50 values of ProE, NPP, NP2 and the model sealer were determined to be 154.1, 95.97, 85.55 and 100.2 µg/mL, respectively. Results also displayed that there was no significant difference in the cytotoxicity between the tested materials at the prepared concentration range. No notable difference was observed between IC50 values of NPP and NP2 (unpaired t-test, P > 0.05) and this confirmed the relative safety of NP2. In the same manner, NP2 and the model sealer showed comparable cellular viability (unpaired t-test, P >0.05). Combination of physical and chemical characteristics of NPs comprising size, shape and surface charge together with their interactions in biological systems might affect NP behavior and determine their toxicity.73 Referring to the results, NP2 might be considered as an alternative naturally derived root canal nanosealer. Although in vitro method for evaluating the cytotoxicity of endodontic sealers is reported to provide reliable and reproducible findings, a period of 48 hrs might be insufficient to take a comprehensive observation of biocompatibility.69 Hence, the response over a long period of time using in vivo tests to study the effects of leachable substances is basically demanded. For this reason, our forthcoming study is designed to involve in vivo evaluation of tissue reaction to the developed nanosealer.
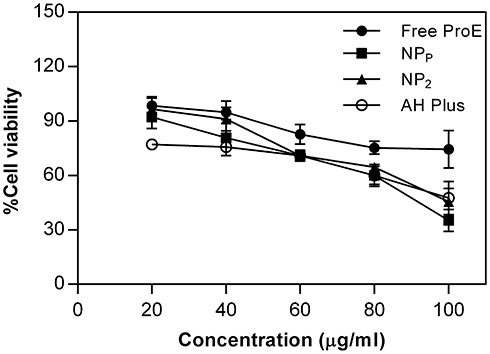 |
Figure 8 The in vitro cytotoxicity estimated as percent cell viability after 48 hr. |
Evaluation Of Antimicrobial Activity
The antimicrobial activity of the tested sealers is shown in Figure 9. The antibacterial effects of PE sealer, PE nanosealer and the model sealer were tested on bacterial strains E. faecalis and S. mutans. Also, their antifungal effects were evaluated against C. albicans by means of the direct contact test with monitoring microbial growth over time. The positive control represented the bacterial growth in the absence of tested materials, while the negative control was the fresh growth medium (Figure 1). E. faecalis, S. mutans and C. albicans have all been detected in infected root canals and reported to survive in endodontic treatment, and also, they may reinfect an already treated root canal.74–76 The main reasons for the failure of root canal treatment are the bacterial persistence with adherence to the dentine and biofilm formation,77 which can be 1000-fold more resistant to disinfection. So, maintaining the root canal sterile is extremely challenging. Hence, the antimicrobial properties of the sealers are very important to prevent reinfection.78 The DCT test has been designated to evaluate the antimicrobial effectiveness of the root canal sealers in contact with viable microbes.79,80 Bacterial growth was determined in the DCT by monitoring the increase in the OD600 as an indication of the bacterial growth.
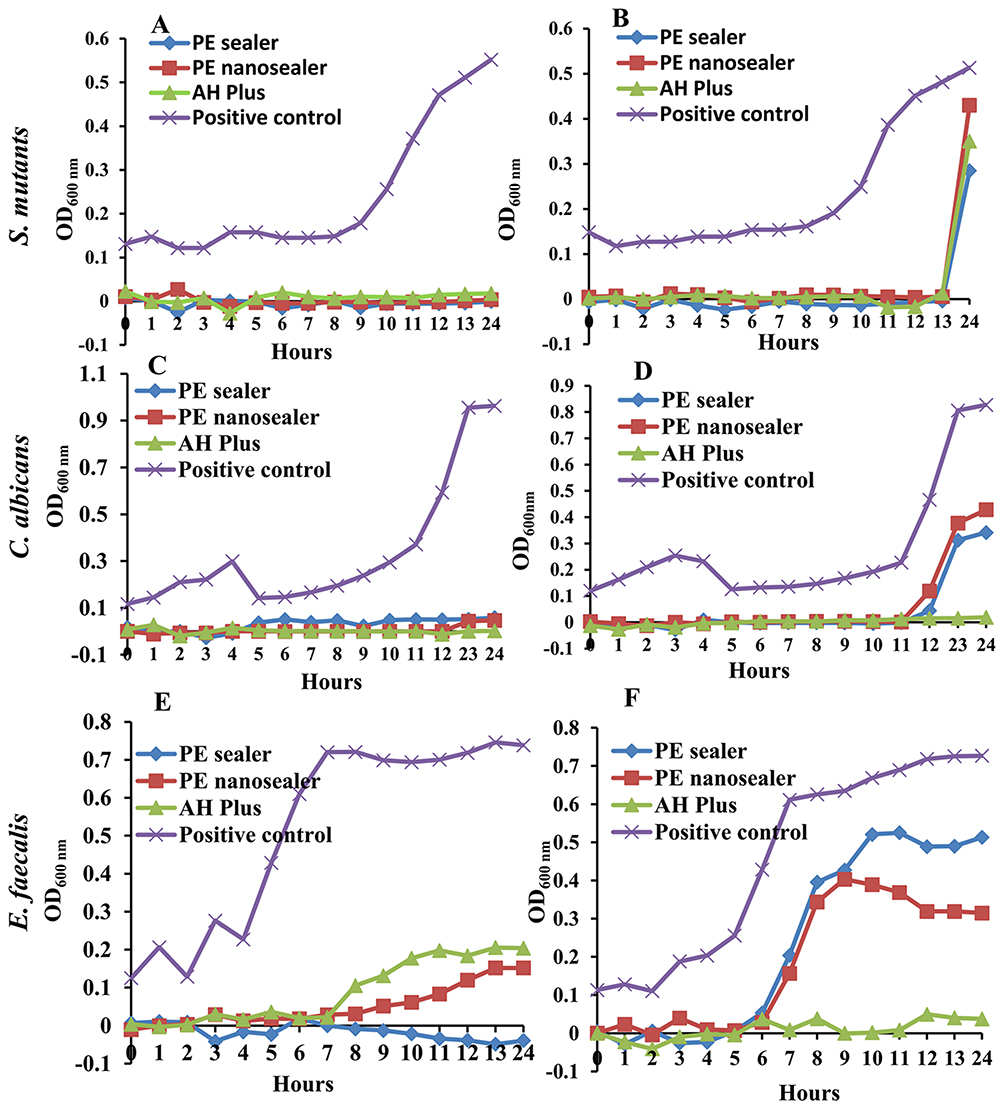 |
Figure 9 Turbidimetric reading of the direct contact test (DCT) of PE sealer, PE nanosealer and AH Plus® (A and B) Microbial growth of Streptococcus mutans in presence and absence of tested sealers, respectively (C and D) Microbial growth of Candida albicans in presence and absence of tested sealers, respectively (E and F) Microbial growth of Enterococcus faecalis in presence and absence in presence and absence of tested sealers, respectively. |
Herein, the growth of E. faecalis in direct contact with PE sealer, PE nanosealer and the model sealer was significantly reduced OD600 of positive control from 0.73 to OD600 of 0.00, 0.15 and 0.2 for wells coated with PE sealer, PE nanosealer and the model sealer, respectively (Figure 9E). However, the growth of the Enterococcus positive control started directly after transfer to fresh medium reaching OD600 of 0.62 within 7 hrs. Additionally, E. faecalis transferred from PE sealer and PE nanosealer-coated wells began to duplicate after 6 hrs in the fresh media reaching maximum OD600 of 0.5 and 0.4, respectively, within 10 hrs. On other instance, the cells cultivated from the model sealer-sealed wells completely killed the microorganism (OD600; 0.03) as indicated in Figure 9F.
At the same instance, it was found that PE sealer and PE nanosealer completely inhibited the growth of S. mutans and C. albicans over 24 hrs when both sealers were in direct contact with the microbial cells as compared to the corresponding positive control ones indicating bactericidal activity. Similar activity has been reported with the commercially used model sealer (Figure 9A and C). This elucidated that the inhibition of the microbial growth was comparable to that of the model sealer. After the transfer to the corresponding wells with fresh medium, the growth of the positive control was found to be constant for the first 9 hrs (OD600; 0.14–0.19), and then cells entered an exponential phase with rapid growth rate. However, it was found that S. mutans transferred from A wells of PE sealer, PE nanosealer and the model sealer kept on minimum OD600 (0.01–0.0001) for 13 hrs followed by a delayed bacterial growth at 24 hrs with OD600 of 0.3, 0.43 and 0.35, respectively (Figure 9B). Similarly, after the direct contact of PE sealer and PE nanosealer with C. albicans, the growth was constant for about 11 hrs. However, the growth of the corresponding positive control quickly increased to reach OD600 of 0.8. The growth of candida transferred from PE sealer or PE nanosealer wells revealed OD600 of 0.34 and 0.4, respectively (Figure 9D).
Many studies have investigated the antibacterial activity of endodontic sealers against infected root canals.81–83 The antibacterial effect of the model sealer could be related to the gradual release of formaldehyde after setting process over the first 12 hrs accompanied with suppression of the bacterial growth at the exponential stage.84 The present study clearly showed that PE sealer has bactericidal effect against C. albicans, S. mutans and E. faecalis once in contact with the sealers. However, just contact for 2 hours that followed by transfer might be not enough for complete microbial killing and reactivation of microbial growth has been assigned. The inhibitory activity of propolis obtained from different sources against various oral infective pathogens have been reported in previous studies.85–87 Propolis demonstrated various antibacterial mechanisms, including collapse of cell, damage of cellular membranes, inhibition of cell division and protein synthesis inhibition.88
Egyptian propolis contained aliphatic, phenolic acids and phenolic esters, and flavonoids compounds that were known with their antimicrobial effects.89–91 The study of Uzel et al demonstrated antibacterial and antifungal proficiencies of propolis gathered by bees from different sources which contained flavonoids as the main chemical component.91 Polyphenols of propolis form ionic and hydrogen bonds with microbial proteins, with manifested change in the three-dimensional form of proteins and alteration in their function.88 In addition, the antiadhesive properties of propolis against S. mutans were related to the inhibitory effect on glycosyltransferase enzyme with further elimination of microbial colonization and accumulation.85 On other instance, the level of microbial growth started to increase 7–13 hrs after transfer to fresh medium (B wells) from wells sealed with PE sealer or PE nanosealer (A wells) revealed the bacteriostatic and fungistatic potentials of natural flavonoids and phenols.92
Difficulties in weighing, handling, coating and application of ProE owing to its resinous nature were considered as main obstacles of its further use as a sealer. On the other hand, the fabrication of ProE-loaded NPs in the form of PE nanosealer enhanced its manipulation, application and coating of the wells in the DCT. Fortunately, PE nanosealer did not significantly affect the antibacterial properties of ProE, suggesting that the antibacterial activity was mediated by active substances during the setting of the materials. Hence, the incorporation of ProE into endodontic sealers could reduce significantly the growth of the infections root canal pathogens. The durable antimicrobial properties elicited with PE nanosealer could be valuable in the future manufacturing of a novel endodontic sealing material.
Conclusion
This study highlights the intrinsic worth of the developed naturally based sealer and nanosealer of ProE-loaded nanoparticles as promising endodontic materials. Prolonged release and enhanced cytocompatibility as well as antimicrobial activities were exhibited by our developed sealers. Consequently, forthcoming studies are highly warranted to establish their root canal sealing ability and in vivo biocompatibility to offer more insight on the potential commercial production as substitutes to the currently available sealers that show hazardous side effects.
Abbreviations
PLGA, poly(lactic-co-glycolic acid); NPs, nanoparticles; PVA, polyvinyl alcohol; TEA, triethanolamine; HPMC, hydroxypropyl methyl cellulose K4M; E. faecalis, Enterococcus faecalis; S. mutans, Streptococcus mutans; C. albicans, Candida albicans; ProE, Egyptian propolis extract; GC/MS, gas chromatography/mass spectrometry; BSTFA; N, O-bis-(trimethylsilyl)trifluoroacetamide; PZ, particle sizes; PDI, polydispersity index; ζ-potential, zeta potential; %LC, loading capacity; %EE, entrapment efficiency; %Yield, percent yield; TEM, transmission electron microscopy; SEM, scanning electron microscopy; DLS, dynamic light scattering; PCS, photon correlation spectroscopy; FT-IR, Fourier transform-infrared spectroscopy; DSC, differential scanning calorimetry; PB7.4, phosphate buffer pH 7.4; H-C, Hixon-Crowel model; K-P, Korsmeyer-Peppas equation; MTT, 3-(4,5-dimethylthiazol-2-yl)-2,5-diphenyl tetrazolium bromide; FBS, fetal bovine serum; SPB7.4, sterile phosphate buffer of pH 7.4; OD, optical densities of in vitro cytotoxicity at 570 nm; IC50, inhibitory concentration of 50% cells; TSB, tryptone soya broth; OD600, optical density of antimicrobial study at 600 nm; FA, ferulic acid; CAPE, caffeic acid phenethyl ester; LPS-induced iNOS, liposaccharide-inducible nitric oxide synthases.
Disclosure
The authors declare that they have no competing interests in this work.
References
1. Chung SH, Park Y-S. Local drug delivery in endodontics: a literature review. J Drug Deliv Sci Technol. 2017;39:334–340. doi:10.1016/j.jddst.2017.04.018
2. Modareszadeh MR, Chogle SA, Mickel AK, et al. Cytotoxicity of set polymer nanocomposite resin root-end filling materials: cytotoxicity of nanocomposite. Int Endod J. 2011;44(2):154–161. doi:10.1111/j.1365-2591.2010.01825.x
3. Quiram G, Montagner F, Palmer K, Stefan M, Washington K, Rodrigues D. Novel chlorhexidine-loaded polymeric nanoparticles for root canal treatment. J Funct Biomater. 2018;9(2):29. doi:10.3390/jfb9020029
4. Silva EJNL, Accorsi-Mendonça T, Almeida JFA, Ferraz CCR, Gomes BPFA, Zaia AA. Evaluation of cytotoxicity and up-regulation of gelatinases in human fibroblast cells by four root canal sealers: sealers cytotoxic and up-regulation of gelatinases. Int Endod J. 2012;45(1):49–56. doi:10.1111/j.1365-2591.2011.01946.x
5. Cavalcanti AL, Limeira FIR, Sales EALS, Oliveira AAG, Lima DMB, Castro RD. In vitro antimicrobial activity of root canal sealers and calcium hydroxide paste. Contemp Clin Dent. 2010;1(3):164–167. doi:10.4103/0976-237X.72784
6. Bruschi ML, Jones DS, Panzeri H, Gremião MPD, de Freitas O, Lara EHG. Semisolid systems containing propolis for the treatment of periodontal disease: in vitro release kinetics, syringeability, rheological, textural, and mucoadhesive properties. J Pharm Sci. 2007;96(8):2074–2089. doi:10.1002/jps.20843
7. Bruschi ML, Rosseto HC, de Francisco LM, de Toledo LD, Raphaela RD. Chapter 20 - nanostructured propolis as therapeutic systems with antimicrobial activity. In: Grumezescu AM editor. Nano- and Microscale Drug Delivery Systems. Elsevier; 2017:377–391. doi:10.1016/B978-0-323-52727-9.00020-0
8. Salas AL, Alberto MR, Zampini IC, et al. Biological activities of polyphenols-enriched propolis from argentina arid regions. Phytomedicine. 2016;23(1):27–31. doi:10.1016/j.phymed.2016.09.007
9. Umthong S, Phuwapraisirisan P, Puthong S, Chanchao C. In vitro antiproliferative activity of partially purified trigona laeviceps propolis from Thailand on human cancer cell lines. BMC Complement Altern Med. 2011;11:1. doi:10.1186/1472-6882-11-37
10. Marquele-Oliveira F, Fonseca YM, de Freitas O, Fonseca MJV. Development of topical functionalized formulations added with propolis extract: stability, cutaneous absorption and in vivo studies. Int J Pharm. 2007;342(1–2):40–48. doi:10.1016/j.ijpharm.2007.04.026
11. Pereira EMR, Da Silva JLDC, Silva FF, et al. Clinical evidence of the efficacy of a mouthwash containing propolis for the control of plaque and gingivitis: a phase II study. Evid Based Complement Alternat Med. 2011;2011:1–7. doi:10.1155/2011/750249
12. Wang J, Vermerris W. Antimicrobial nanomaterials derived from natural products—a review. Materials. 2016;9(4):255. doi:10.3390/ma9040255
13. Santiago KB, Conti BJ, Cardoso EDO, Golim MDA, Sforcin JM. Immunomodulatory/anti-inflammatory effects of a propolis-containing mouthwash on human monocytes. Pathog Dis. 2016;74(8). doi:10.1093/femspd/ftw081
14. Balata GF, Abdelhady MIS, Mahmoud GM, Matar MA, Abd El-Latif AN. Formulation of saudi propolis into biodegradable chitosan chips for vital pulpotomy. Curr Drug Deliv. 2018;15(1). doi:10.2174/1567201814666170125121735
15. Franca JR, De Luca MP, Ribeiro TG, et al. Propolis - based chitosan varnish: drug delivery, controlled release and antimicrobial activity against oral pathogen bacteria. BMC Complement Altern Med. 2014;14:478. doi:10.1186/1472-6882-14-478
16. Ibrahim AIO, Moodley DS, Petrik L, Patel N. Use of antibacterial nanoparticles in endodontics. SADJ. 2017;72(3):105–112.
17. Samiei M, Farjami A, Dizaj SM, Lotfipour F. Nanoparticles for antimicrobial purposes in endodontics: a systematic review of in vitro studies. Mater Sci Eng C. 2016;58:1269–1278. doi:10.1016/j.msec.2015.08.070
18. Shrestha A, Kishen A. Antibacterial nanoparticles in endodontics: a review. J Endod. 2016;42(10):1417–1426. doi:10.1016/j.joen.2016.05.021
19. Kennedy PJ, Perreira I, Ferreira D, et al. Impact of surfactants on the target recognition of Fab-conjugated PLGA nanoparticles. Eur J Pharm Biopharm. 2018;127:366–370. doi:10.1016/j.ejpb.2018.03.005
20. Christov R, Bankova V, Hegazi A, El Hady FA, Popov S. Chemical composition of Egyptian propolis. Z Für Naturforschung C. 1998;53(3–4):197–200. doi:10.1515/znc-1998-3-409
21. Sahle FF, Gerecke C, Kleuser B, Bodmeier R. Formulation and comparative in vitro evaluation of various dexamethasone-loaded pH-sensitive polymeric nanoparticles intended for dermal applications. Int J Pharm. 2017;516(1–2):21–31. doi:10.1016/j.ijpharm.2016.11.029
22. Silva MM, Calado R, Marto J, Bettencourt A, Almeida AJ, Gonçalves L. Chitosan nanoparticles as a mucoadhesive drug delivery system for ocular administration. Mar Drugs. 2017;15(12):370. doi:10.3390/md15120370
23. Higuchi T. Rate of release of medicaments from ointment bases containing drugs in suspension. J Pharm Sci. 1961;50(10):874–875. doi:10.1002/jps.2600501018
24. Peppas NA. Analysis of fickian and non-fickian drug release from polymers. Pharm Acta Helv. 1984;60(4):110–111.
25. Costa P, Lobo JMS. Modeling and comparison of dissolution profiles. Eur J Pharm Sci. 2001;13(2):123–133. doi:10.1016/S0928-0987(01)00095-1
26. Paradkar M, Vaghela S. Thiocolchicoside niosomal gel formulation for the pain management of rheumatoid arthritis through topical drug delivery. Drug Deliv Lett. 2018;8(2):159–168. doi:10.2174/2210303108666180216151234
27. Sampath PB, Hegde MN, Hegde P. Assessment of antibacterial properties of newer dentin bonding agents: an in vitro study. Contemp Clin Dent. 2011;2(3):165. doi:10.4103/0976-237X.86444
28. Salatino AC, Fernandes-Silva C, Abbud Righi AF, Salatino ML. Propolis research and the chemistry of plant products. Nat Prod Rep. 2011;28(5):925–936. doi:10.1039/C0NP00072H
29. Toreti VC, Sato HH, Pastore GM, Park YK. Recent progress of propolis for its biological and chemical compositions and its botanical origin. Evid Based Complement Alternat Med. 2013;2013:1–13. doi:10.1155/2013/697390
30. Bankova V. Recent trends and important developments in propolis research. Evid Based Complement Alternat Med. 2005;2(1):29–32. doi:10.1093/ecam/neh059
31. Silici S, Kutluca S. Chemical composition and antibacterial activity of propolis collected by three different races of honeybees in the same region. J Ethnopharmacol. 2005;99(1):69–73. doi:10.1016/j.jep.2005.01.046
32. Bankova VS, de Castro SL, Marcucci MC. Propolis: recent advances in chemistry and plant origin. Apidologie. 2000;31(1):3–15. doi:10.1051/apido:2000102
33. Groot D, Propolis: CA. A review of properties, applications, chemical composition, contact allergy, and other adverse effects. Dermatitis. 2013;24(6):263. doi:10.1097/DER.0000000000000011
34. Bankova V. Chemical diversity of propolis and the problem of standardization. J Ethnopharmacol. 2005;100(1):114–117. doi:10.1016/j.jep.2005.05.004
35. Fernandes-Silva CC, Freitas JC, Salatino A, Salatino MLF. Cytotoxic activity of six samples of brazilian propolis on sea urchin (Lytechinus variegatus) eggs. Evid Based Complement Alternat Med. 2013;2013:1–4. doi:10.1155/2013/619361
36. Ramos AFN, Miranda JD. Propolis: a review of its anti-inflammatory and healing actions. J Venom Anim Toxins Trop Dis. 2007;13(4):697–710. doi:10.1590/S1678-91992007000400002
37. Abbasi AJ, Mohammadi F, Bayat M, et al. Applications of propolis in dentistry: a review. Ethiop J Health Sci. 2018;28(4):8.
38. Zhu H, Liang Q-H, Xiong X-G, et al. Anti-inflammatory effects of the bioactive compound ferulic acid contained in oldenlandia diffusa on collagen-induced arthritis in rats. Evid Based Complement Alternat Med. 2014;2014. doi:10.1155/2014/105186
39. Vidyalakshmi K, Kamalakannan P, Viswanathan S, Ramaswamy S. Anti-inflammatory effect of certain dihydroxy flavones and the mechanisms involved. Anti-Inflamm Anti-Allergy Agents Med Chem. 2012;11(3):253–261. doi:10.2174/1871523011202030253
40. Komabayashi T, Nonomura G, Watanabe LG, Marshall GW
41. Danhier F, Ansorena E, Silva JM, Coco R, Le Breton A, Préat V. PLGA-based nanoparticles: an overview of biomedical applications. J Controlled Release. 2012;161(2):505–522. doi:10.1016/j.jconrel.2012.01.043
42. Ibrahim MM, Abd-Elgawad A-EH, Soliman OA-E, Jablonski MM. Nanoparticle-based topical ophthalmic formulations for sustained celecoxib release. J Pharm Sci. 2013;102(3):1036–1053. doi:10.1002/jps.23417
43. Song X, Zhao Y, Wu W, et al. PLGA nanoparticles simultaneously loaded with vincristine sulfate and verapamil hydrochloride: systematic study of particle size and drug entrapment efficiency. Int J Pharm. 2008;350(1–2):320–329. doi:10.1016/j.ijpharm.2007.08.034
44. Haddadi A, Jahan ST. Investigation and optimization of formulation parameters on preparation of targeted anti-CD205 tailored PLGA nanoparticles. Int J Nanomedicine. 2015;7371. doi:10.2147/IJN.S90866
45. Parra A, Mallandrich M, Clares B, et al. Design and elaboration of freeze-dried PLGA nanoparticles for the transcorneal permeation of carprofen: ocular anti-inflammatory applications. Colloids Surf B Biointerfaces. 2015;136:935–943. doi:10.1016/j.colsurfb.2015.10.026
46. Chasteigner SD, Cavé G, Fessi H, Devissaguet J-P, Puisieux F. Freeze-drying of itraconazole-loaded nanosphere suspensions: a feasibility study. Drug Dev Res. 1996;38(2):116–124. doi:10.1002/(SICI)1098-2299(199606)38:2<116::AID-DDR6>3.0.CO;2-M
47. Fonte P, Reis S, Sarmento B. Facts and evidences on the lyophilization of polymeric nanoparticles for drug delivery. J Controlled Release. 2016;225:75–86. doi:10.1016/j.jconrel.2016.01.034
48. Ibrahim MM, Abd-Elgawad A-EH, Soliman OA-E, Jablonski MM. Natural bioadhesive biodegradable nanoparticles-based topical ophthalmic formulations for sustained celecoxib release: in vitro study. J Pharm Technol Drug Res. 2013;2(1):7. doi:10.7243/2050-120X-2-7
49. Jain S, Rathi VV, Jain AK, Das M, Godugu C. Folate-decorated PLGA nanoparticles as a rationally designed vehicle for the oral delivery of insulin. Nanomed. 2012;7(9):1311–1337. doi:10.2217/nnm.12.31
50. Abdelwahed W, Degobert G, Stainmesse S, Fessi H. Freeze-drying of nanoparticles: formulation, process and storage considerations. Adv Drug Deliv Rev. 2006;58(15):1688–1713. doi:10.1016/j.addr.2006.09.017
51. Chithrani BD, Chan WCW. Elucidating the mechanism of cellular uptake and removal of protein-coated gold nanoparticles of different sizes and shapes. Nano Lett. 2007;7(6):1542–1550. doi:10.1021/nl070363y
52. Kumari A, Yadav SK, Pakade YB, Singh B, Yadav SC. Development of biodegradable nanoparticles for delivery of quercetin. Colloids Surf B Biointerfaces. 2010;80(2):184–192. doi:10.1016/j.colsurfb.2010.06.002
53. Elbaz NM, Khalil IA, Abd-Rabou AA, El-Sherbiny IM. Chitosan-based nano-in-microparticle carriers for enhanced oral delivery and anticancer activity of propolis. Int J Biol Macromol. 2016;92:254–269. doi:10.1016/j.ijbiomac.2016.07.024
54. do Nascimento TG, da Silva PF, Azevedo LF, et al. Polymeric Nanoparticles of Brazilian Red Propolis Extract: Preparation, Characterization, Antioxidant and Leishmanicidal Activity. Nanoscale Res Lett. 2016;11(1). doi:10.1186/s11671-016-1517-3
55. Jansen-Alves C, Fernandes KF, Crizel-Cardozo MM, Krumreich FD, Borges CD, Zambiazi RC. Microencapsulation of propolis in protein matrix using spray drying for application in food systems. Food Bioprocess Technol. 2018;11(7):1422–1436. doi:10.1007/s11947-018-2115-4
56. Sudhamani SR, Prasad MS, Udaya Sankar K. DSC and FTIR studies on Gellan and Polyvinyl alcohol (PVA) blend films. Food Hydrocoll. 2003;17(3):245–250. doi:10.1016/S0268-005X(02)00057-7
57. Akao K, Okubo Y, Asakawa N, Inoue Y, Sakurai M. Infrared spectroscopic study on the properties of the anhydrous form II of trehalose. Implications for the functional mechanism of trehalose as a biostabilizer. Carbohydr Res. 2001;334(3):233–241. doi:10.1016/S0008-6215(01)00182-3
58. Bragagni M, Gil-Alegre ME, Mura P, Cirri M, Ghelardini C, Di Cesare Mannelli L. Improving the therapeutic efficacy of prilocaine by PLGA microparticles: preparation, characterization and in vivo evaluation. Int J Pharm. 2018;547(1–2):24–30. doi:10.1016/j.ijpharm.2018.05.054
59. Sharma S, Parmar A, Kori S, Sandhir R. PLGA-based nanoparticles: a new paradigm in biomedical applications. TrAC Trends Anal Chem. 2016;80:30–40. doi:10.1016/j.trac.2015.06.014
60. Castro PM, Baptista P, Madureira AR, Sarmento B, Pintado ME. Combination of PLGA nanoparticles with mucoadhesive guar-gum films for buccal delivery of antihypertensive peptide. Int J Pharm. 2018;547(1–2):593–601. doi:10.1016/j.ijpharm.2018.05.051
61. Modi S, Anderson BD. Determination of drug release kinetics from nanoparticles: overcoming pitfalls of the dynamic dialysis method. Mol Pharm. 2013;10(8):3076–3089. doi:10.1021/mp400154a
62. Sorasitthiyanukarn FN, Rojsitthisak P, Rojsitthisak P. Kinetic Study of Chitosan-Alginate Biopolymeric Nanoparticles for the Controlled Release of Curcumin Diethyl Disuccinate. J Met Mater Miner. 2017;27(2):17–22. doi:10.14456/jmmm.2017.xx.
63. Ritger PL, Peppas NA. A simple equation for description of solute release II. Fickian and anomalous release from swellable devices. J Controlled Release. 1987;5(1):37–42. doi:10.1016/0168-3659(87)90035-6
64. Herculano ED, de Paula HCB, de Figueiredo EAT, Dias FGB, Pereira VDA. Physicochemical and antimicrobial properties of nanoencapsulated Eucalyptus staigeriana essential oil. LWT. 2015;61(2):484–491. doi:10.1016/j.lwt.2014.12.001
65. Günday Türeli N, Torge A, Juntke J, et al. Ciprofloxacin-loaded PLGA nanoparticles against cystic fibrosis P. aeruginosa lung infections. Eur J Pharm Biopharm. 2017;117:363–371. doi:10.1016/j.ejpb.2017.04.032
66. Korsmeyer RW, Gurny R, Doelker E, Buri P, Peppas NA. Mechanisms of solute release from porous hydrophilic polymers. Int J Pharm. 1983;15(1):25–35. doi:10.1016/0378-5173(83)90064-9
67. Al-Hiyasat AS, Tayyar M, Darmani H. Cytotoxicity evaluation of various resin based root canal sealers. Int Endod J. 2010;43(2):148–153. doi:10.1111/j.1365-2591.2009.01669.x
68. Heil J, Reifferscheid G, Waldmann P, Leyhausen G, Geurtsen W. Genotoxicity of dental materials. Mutat Res Toxicol. 1996;368(3–4):181–194. doi:10.1016/S0165-1218(96)90060-9
69. Colak KM, Keles A, Bayrak OF, Koseoglu M, Sahin F. Study of cytotoxicity of six root canal sealing dental materials. Mater Res Innov. 2009;13(4):415–420. doi:10.1179/143289109X12494867167161
70. Cohen BI, Pagnillo MK, Musikant BL, Deutsch AS. Formaldehyde evaluation from endodontic materials. Oral Health. 1998;88(12):37–39.
71. Li J, Feng L, Fan L, et al. Targeting the brain with PEG-PLGA nanoparticles modified with phage-displayed peptides. Biomaterials. 2011;32(21):4943–4950. doi:10.1016/j.biomaterials.2011.03.031
72. Rowe RC, Sheskey PJ, Owen SC; American Pharmacists Association, eds. Handbook of Pharmaceutical Excipients: Edited by Raymond C. Rowe, Paul J. Sheskey, Siân C. Owen.
73. Abbaszadegan A, Nabavizadeh M, Gholami A, et al. Positively charged imidazolium-based ionic liquid-protected silver nanoparticles: a promising disinfectant in root canal treatment. Int Endod J. 2015;48(8):790–800. doi:10.1111/iej.12377
74. Kayaoglu G, Ørstavik D. Virulence factors of Enterococcus faecalis: relationship to endodontic disease. Crit Rev Oral Biol Med. 2004;15(5):308–320. doi:10.1177/154411130401500506
75. Kumar J, Sharma R, Sharma M, Prabhavathi V, Paul J, Chowdary CD. Presence of candida albicans in root canals of teeth with apical periodontitis and evaluation of their possible role in failure of endodontic treatment. J Int Oral Health JIOH. 2015;7(2):42.
76. Kouchi Y, Ninomiya J, Yasuda H, Fukui K, Moriyama T, Okamoto H. Location of streptococcus mutans in the dentinal tubules of open infected root canals. J Dent Res. 1980;59(12):2038–2046. doi:10.1177/0022034580059S213
77. Zhang C, Du J, Peng Z. Correlation between enterococcus faecalis and persistent intraradicular infection compared with primary intraradicular infection: a systematic review. J Endod. 2015;41(8):1207–1213. doi:10.1016/j.joen.2015.04.008
78. Brezhnev A, Neelakantan P, Tanaka R, Brezhnev S, Fokas G, Matinlinna JP. Antibacterial additives in epoxy resin-based root canal sealers: a focused review. Dent J. 2019;7(3):72. doi:10.3390/dj7030072
79. Heyder M, Kranz S, Völpel A, et al. Antibacterial effect of different root canal sealers on three bacterial species. Dent Mater. 2013;29(5):542–549. doi:10.1016/j.dental.2013.02.007
80. Anumula L, Kumar S, Kumar VS, et al. An assessment of antibacterial activity of four endodontic sealers on Enterococcus faecalis by a direct contact test: an in vitro study. ISRN Dent. 2012;2012:1–5. doi:10.5402/2012/989781
81. Leonardo MR, Da Silva LAB, Tanomaru Filho M, Bonifácio KC, Ito IY. In vitro evaluation of antimicrobial activity of sealers and pastes used in endodontics. J Endod. 2000;26(7):391–394. doi:10.1097/00004770-200007000-00003
82. Lovato KF, Sedgley CM. Antibacterial activity of endosequence root repair material and proroot MTA against clinical isolates of enterococcus faecalis. J Endod. 2011;37(11):1542–1546. doi:10.1016/j.joen.2011.06.022
83. Kesler Shvero D, Abramovitz I, Zaltsman N, Perez Davidi M, Weiss EI, Beyth N. Towards antibacterial endodontic sealers using quaternary ammonium nanoparticles. Int Endod J. 2013;46(8):747–754. doi:10.1111/iej.2013.46.issue-8
84. Slutzky-Goldberg I, Slutzky H, Solomonov M, Moshonov J, Weiss EI, Matalon S. Antibacterial properties of four endodontic sealers. J Endod. 2008;34(6):735–738. doi:10.1016/j.joen.2008.03.012
85. Park YK, Koo MH, Abreu JA, Ikegaki M, Cury JA, Rosalen PL. Antimicrobial activity of propolis on oral microorganisms. Curr Microbiol. 1998;36(1):24–28. doi:10.1007/s002849900274
86. Koo H, Gomes B, Rosalen PL, Ambrosano GMB, Park YK, Cury JA. In vitro antimicrobial activity of propolis and arnica montana against oral pathogens. Arch Oral Biol. 2000;45(2):141–148. doi:10.1016/s0003-9969(00)00077-7
87. Elsheshtawy NM, Aly EH, Kabil NS, Badran AS. In vitro antimicrobial effect of egyptian propolis pastes on microorganisms in necrotic primary molars: a comparative study. Egypt J Med Microbiol. 2016;38(79):1–6.
88. Takaisi-Kikuni NB, Schilcher H. Electron microscopic and microcalorimetric investigations of the possible mechanism of the antibacterial action of a defined propolis provenance. Planta Med. 1994;60(03):222–227. doi:10.1055/s-2006-959463
89. Kosalec I, Pepeljnjak S, Bakmaz M, Vladimir-Knežević S. Flavonoid analysis and antimicrobial activity of commercially available propolis products. Acta Pharm. 2005;55(4):423–430.
90. Erlianda D, Rizal MF, Budiardjo SB. Antibacterial effect of flavonoids from propolis produced by trigona on atpase activity of streptococcus mutans. Int J Appl Pharm. 2018;9:6. doi:10.22159/ijap.2017.v9s2.02
91. Uzel A, Önçağ Ö, Çoğulu D, Gençay Ö. Chemical compositions and antimicrobial activities of four different anatolian propolis samples. Microbiol Res. 2005;160(2):189–195. doi:10.1016/j.micres.2005.01.002
92. Wang S, Yao J, Zhou B, et al. Bacteriostatic effect of quercetin as an antibiotic alternative in vivo and its antibacterial mechanism in vitro. J Food Prot. 2017;81(1):68–78. doi:10.4315/0362-028X.JFP-17-214
 © 2019 The Author(s). This work is published and licensed by Dove Medical Press Limited. The full terms of this license are available at https://www.dovepress.com/terms.php and incorporate the Creative Commons Attribution - Non Commercial (unported, v3.0) License.
By accessing the work you hereby accept the Terms. Non-commercial uses of the work are permitted without any further permission from Dove Medical Press Limited, provided the work is properly attributed. For permission for commercial use of this work, please see paragraphs 4.2 and 5 of our Terms.
© 2019 The Author(s). This work is published and licensed by Dove Medical Press Limited. The full terms of this license are available at https://www.dovepress.com/terms.php and incorporate the Creative Commons Attribution - Non Commercial (unported, v3.0) License.
By accessing the work you hereby accept the Terms. Non-commercial uses of the work are permitted without any further permission from Dove Medical Press Limited, provided the work is properly attributed. For permission for commercial use of this work, please see paragraphs 4.2 and 5 of our Terms.