")
Back to Journals » Drug Design, Development and Therapy » Volume 10
Design and evaluation of novel interferon lambda analogs with enhanced antiviral activity and improved drug attributes
Authors Yu D, Zhao M, Dong L, Zhao L, Zou M, Sun H, Zhang M, Liu H, Zou Z
Received 27 July 2015
Accepted for publication 25 November 2015
Published 6 January 2016 Volume 2016:10 Pages 163—182
DOI https://doi.org/10.2147/DDDT.S91455
Checked for plagiarism Yes
Review by Single anonymous peer review
Peer reviewer comments 2
Editor who approved publication: Prof. Dr. Wei Duan
Debin Yu,1 Mingzhi Zhao,2 Liwei Dong,1 Lu Zhao,1 Mingwei Zou,3 Hetong Sun,4 Mengying Zhang,4 Hongyu Liu,4 Zhihua Zou1
1National Engineering Laboratory for AIDS Vaccine, Key Laboratory for Molecular Enzymology and Engineering of the Ministry of Education, School of Life Sciences, Jilin University, Changchun, 2State Key Laboratory of Proteomics, National Engineering Research Center for Protein Drugs, Beijing Proteome Research Center, Beijing Institute of Radiation Medicine, Beijing, People’s Republic of China; 3Department of Psychology, College of Liberal Arts and Social Sciences, University of Houston, Houston, TX, USA; 4Prosit Sole Biotechnology, Co., Ltd., Beijing, People’s Republic of China
Abstract: Type III interferons (IFNs) (also called IFN-λ: IFN-λ1, IFN-λ2, IFN-λ3, and IFN-λ4) are critical players in the defense against viral infection of mucosal epithelial cells, where the activity of type I IFNs is weak, and unlike type I IFNs that are associated with severe and diverse side effects, type III IFNs cause minimal side effects due to the highly restricted expression of their receptors, and thus appear to be promising agents for the treatment and prevention of respiratory and gastrointestinal viral infection. However, the antiviral potency of natural type III IFNs is weak compared to type I and, although IFN-λ3 possesses the highest bioactivity among the type III IFNs, IFN-λ1, instead of IFN-λ3, is being developed as a therapeutic drug due to the difficulty to express IFN-λ3 in the prokaryotic expression system. Here, to develop optimal IFN-λ molecules with improved drug attributes, we designed a series of IFN-λ analogs by replacing critical amino acids of IFN-λ1 with the IFN-λ3 counterparts, and vice versa. Four of the designed analogs were successfully expressed in Escherichia coli with high yield and were easily purified from inclusion bodies. Interestingly, all four analogs showed potent activity in inducing the expression of the antiviral genes MxA and OAS and two of them, analog-6 and -7, displayed an unexpected high potency that is higher than that of type I IFN (IFN-α2a) in activating the IFN-stimulated response element (ISRE)-luciferase reporter. Importantly, both analog-6 and -7 effectively inhibited replication of hepatitis C virus in Huh-7.5.1 cells, with an IC50 that is comparable to that of IFN-α2a; and consistent with the roles of IFN-λ in mucosal epithelia, both analogs potently inhibited replication of H3N2 influenza A virus in A549 cells. Together, these studies identified two IFN-λ analogs as candidates to be developed as novel antiviral biologics.
Keywords: type III interferon, IFN-λ, IL-29, IL-28B, analog, antiviral
Introduction
Interferons (IFNs) are class II α-helical cytokines with antiviral, antiproliferative, and immunomodulatory activities, and hence are critical players in innate and adaptive immunity against viruses and cancer.1–3 To date, three classes of IFNs have been recognized: types I, II, and III.4,5 Type I IFN comprises IFN-α (13 subtypes), IFN-β, IFN-κ, IFN-ω, and IFN-ε;6 type II comprises IFN-γ;7 and type III comprises IFN-λ1, IFN-λ2, IFN-λ3, and IFN-λ4, with the former three initially designated as interleukin (IL)-29, IL-28A, and IL-28B by the Human Genome Organization.8–10 Type III IFNs and IL-10-related cytokines share a receptor subunit and are functionally related, thus they are grouped together to form the IL-10 cytokine subfamily, which together with type I and type II IFNs form the larger family of class II α-helical cytokines. All class II cytokines are characterized by an α-helical fold consisting of six helices labeled A to F. The structural core is a compact four-helix bundle composed of helices A, C, D, and F. Class II cytokines initiate their activities by binding to heterodimeric class II cytokine receptors, which signal through the Janus kinase-signal transducer and activator of transcription (JAK-STAT) signaling pathway.11–14
Type I IFNs were the first cytokines discovered more than 50 years ago as the factors underlying viral interference.5 They are produced by infected cells and a subset of immune cells in response to a variety of bacterial and viral infections and induce an antiviral state in the infected cells and their neighbors. In addition, they also inhibit cell proliferation and act on the innate and adaptive immune systems to orchestrate immune responses. All 17 type I IFNs bind to the same IFN-α receptor complex consisting of IFNAR1 and IFNAR2, which are expressed in virtually all cell types. Activation of the IFN-α receptor leads to the expression of hundreds of IFN-stimulated genes, which inhibit viral transcription, translation, and assembly, and thus immediately reduce viral loads.5 Type II IFN comprises the single member IFN-γ, which is only produced by activated T- and NK cells.7 IFN-γ binds to the IFN-γ receptor complex consisting of IFNGR1 and IFNGR2 to regulate cell-mediated immunity.5,15 Type I and II IFNs are currently approved for the treatment of chronic hepatitis B and C, hairy cell leukemia, chronic myeloid leukemia, Kaposi’s sarcoma, and melanoma (IFN-α2); multiple sclerosis (IFN-β); and chronic granulomatous disease and malignant osteopetrosis (IFN-γ).6,16,17 However, because their receptors are widely expressed and various effects are elicited in different types of cell, clinical applications of type I and II IFNs are significantly limited by the adverse side effects associated with them.6,17
Type III IFNs were identified approximately 12 years ago,8,9 which are produced by infected cells and some immune cells, such as plasmacytoid dendritic cells.18,19 All type III IFNs bind to the same receptor complex consisting of IFN-LR1 and IL-10R2. IFN-LR1 is unique to IFN-λ and is expressed exclusively in epithelial cells including hepatocytes and some macrophages and plasmacytoid dendritic cells,20–22 while the IL-10R2 subunit is shared by members of the IL-10 subfamily and is widely expressed.11 Activation of IFN-LR1/IL-10R2 leads to expression of hundreds of IFN-stimulated genes that are highly overlapping with those activated by type I IFNs. Thus, despite binding to different receptors, type I and III IFNs induce a very similar antiviral state in target cells.23–25 However, type III IFNs act specifically on epithelial cells and hepatocytes,25–28 and clinical trials have shown that IFN-λ1 is associated with minimal side effects.29–31 Moreover, recent studies have established type III IFNs as the essential antiviral players at mucosal surfaces.32–34 Mice lacking IFN-λ receptor are highly sensitive to viral infection of mucosal epithelia, whereas those lacking the IFN-α receptor have normal sensitivity to these viruses.32,35 Patients with chronic mucosal infection and asthma have abnormally low IFN-λ,36,37 and exogenous IFN-λ, but not IFN-α, can cure the persistent or recurrent viral infection.35,38 Given the important roles of type III IFNs in mucosal epithelia and their good safety profile, it is important to develop them as antiviral drugs as soon as possible. However, the potency of type III IFNs is weak compared to type I IFNs;39 and although IFN-λ3 has the highest potency among the type III IFNs,39 only IFN-λ1 is currently being developed as a drug against hepatitis B and C viruses, likely because it is difficult to produce IFN-λ3.
Numerous examples have shown that subtle changes in the amino acid sequence of an IFN could result in profound alterations in receptor subunit affinity, potency, and target cell specificity.40,41 Thus, this study was undertaken to develop IFN-λ analogs with improved antiviral potency, expression efficiency, and other drug attributes. Here, we designed a series of IFN-λ analogs by replacing a few key amino acids of IFN-λ1 by their counterparts of IFN-λ3 and vice versa. We generated the analogs by swapping fragments of IFN-λ1 and -λ3 at regions where they have identical amino acid sequences; therefore, all designed analogs bear no unnatural amino acid sequence and should display minimal immunogenicity. These studies identified two novel IFN-λ analogs with greatly improved antiviral potency, as well as expression efficiency and product stability.
Materials and methods
Materials
Human IFN-α2a was purchased from PeproTech (Rocky Hill, NJ, USA; Cat. #: 300-02A) and PEG-IFN-α2a (PEGASYS) from Hoffman-La Roche Ltd. (Basel, Switzerland). Wild-type IFN-λ1 and IFN-λ analogs were expressed and prepared in-house. The prokaryotic expression vector pET11a, together with the competent cell BL21 (DE3), was purchased from EMD Millipore (Billerica, MA, USA). HepG2, HEK293, and A549 cell lines were purchased from ATCC (Manassas, VA, USA). Huh-7.5.1 cells were kindly provided by F Chisari (Scripps Research Institute, La Jolla, CA, USA). Sources of other materials and reagents are described in the relevant sections. No ethics statement was required from the Institutional Review Board of Jilin University for the use of these cell lines.
Construction of prokaryotic expression vectors
The coding sequences of wild-type human IFN-λ1 and IFN-λ3 were codon-optimized for expression in Escherichia coli and synthesized by Taihe Biotechnology Co. Ltd. (Beijing, People’s Republic of China). The sequence of IFN-λ1 was identical to that reported by Doyle et al25 and Ramos31 where the last cysteine was mutated to serine with no impact on its bioactivity (hence called IL-29S). Coding sequences of IFN-λ analogs (Figure 1) were generated by overlapping polymerase chain reaction (PCR) using the codon-optimized wild-type IFN-λ1 and IFN-λ3 as the templates. Primers used are listed in Table 1. All coding sequences were subcloned between the NdeI-BamHI sites of the prokaryotic expression vector pET11a and were verified by sequencing.
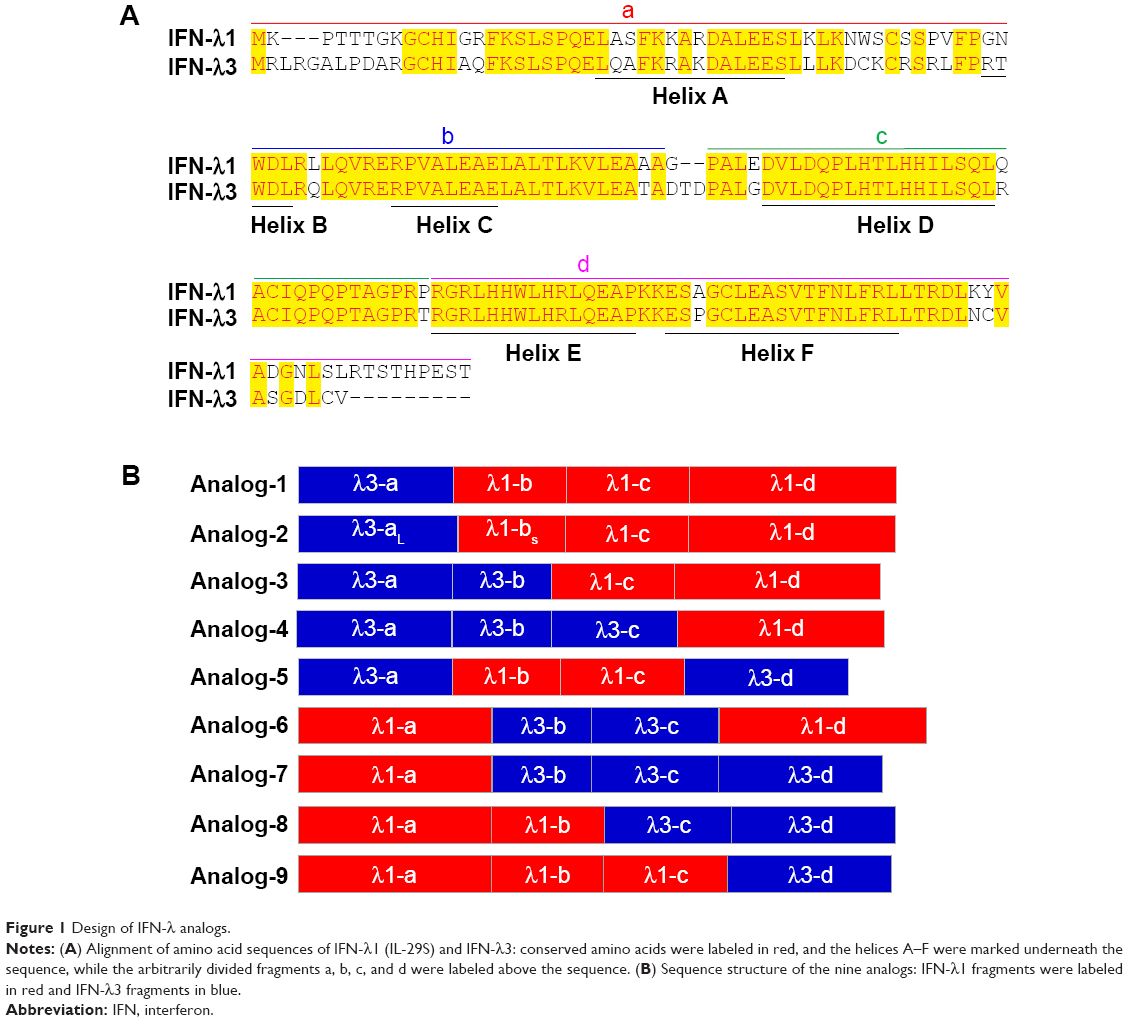 | Figure 1 Design of IFN-λ analogs. |
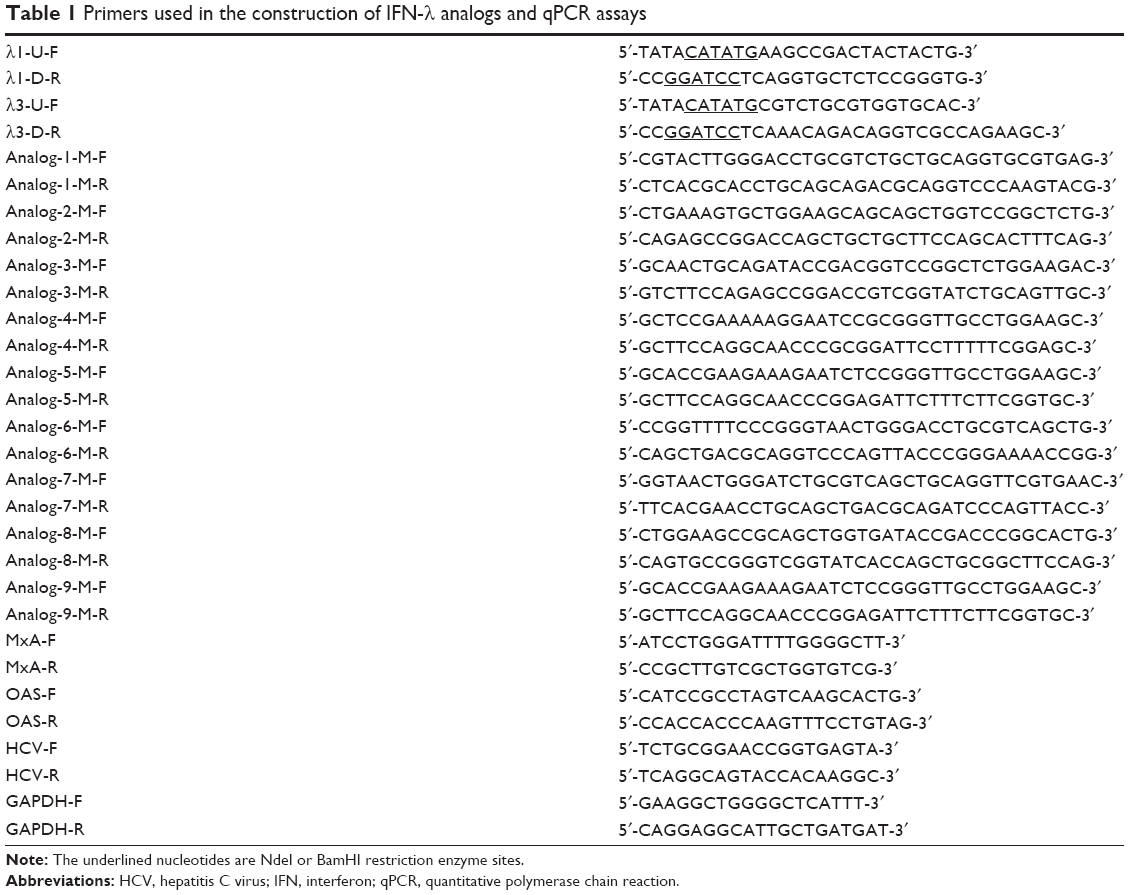 | Table 1 Primers used in the construction of IFN-λ analogs and qPCR assays |
Screening of IFN-λ analogs
For the purpose of screening expressible IFN-λ analogs, BL21 (DE3) competent cells were transformed with a recombinant plasmid vector, and individual single colonies were analyzed for the presence of plasmid by colony PCR, using NEB’s Taq 2X Master Mix (Cat. #: M0270L). Positive colonies were then grown at 37°C in 3 mL of Luria-Bertani broth until OD600 reached 0.8 (3–5 hours). An amount of 1 mL of the culture was transferred to 4°C and the remaining 2 mL was cultured in the presence of 1 mM isopropyl-β-d-thiogalactopyranoside (IPTG) (Sigma, St Louis, MO, USA) for another 3 hours. Bacteria pellets were resuspended in reducing loading buffer (60 mM Tris-HCl, pH 6.8; 25% glycerol; 14.4 mM β-mercaptoethanol, 2% sodium dodecyl sulfate [SDS]) and denatured at 95°C for 5 minutes. Proteins were separated on 12% SDS-polyacrylamide gel and examined by Coomassie blue staining.
Expression and purification of recombinant proteins
Expression and purification of recombinant IFN-λ1 and IFN-λ analog proteins followed the procedures described by Doyle et al.25 Transformed cells were grown in 2 L glass flasks with 200 mL of Luria-Bertani media at 37°C until OD600 reached 0.8. The culture was then induced with 1 mM IPTG for 3 hours at 37°C. Bacteria pellets were resuspended in 150 mM NaCl, 20 mM Tris-HCl, pH 7.5 and homogenized with a high-pressure homogenizer (APV 1000, SPX, Delavan, WI, USA). Inclusion bodies were recovered by centrifugation at 12,000× g for 10 minutes. After washing with 20 mM Tris-HCl, 2 M urea, pH 8.0, inclusion bodies were dissolved in 6 M guanidine-HCl, 20 mM DTT, 50 mM Tris, pH 8.0 at room temperature for 3–4 hours with stirring. The aqueous phase was clarified by centrifugation at 15,000× g for 30 minutes. The supernatant was diluted in ten volumes of refolding buffer (10 mM NaCl, 0.4 mM KCl, 2 mM CaCl2, 2 mM MgCl2, 0.05% [w/v] PEG3350, 0.75 M arginine, 1 mM DTT, 0.1 mM cystine, 50 mM Tris, pH 7.8) and incubated at 16°C for 14 hours with stirring. Acetic acid was used to adjust the pH to 5.5, and the solution was mixed with two volumes of 20 mM sodium acetate (NaAc), pH 5.5. After centrifugation at 12,000× g for 20 minutes, the clarified sample was applied to a SP BB column (GE Healthcare, Marlborough, MA, USA) that was pre-equilibrated in 20 mM NaAc, pH 5.5 (buffer A). After washing the column with 30% buffer A and 70% elution buffer (20 mM NaAc, 1 M NaCl, pH 5.5), the refolded protein was eluted using 30%–100% elution buffer in fractions of 10 column volume (CV). The fractions containing the target protein were pooled and diluted with one-third volume of 3 M (NH4)2SO4 and then loaded onto a Phenyl FF (HS) column (GE Healthcare) pre-equilibrated with 50 mM NaAC, 1.5 M (NH4)2SO4, pH 5.5. After washing with 5 CV of equilibration buffer, the protein was eluted with 0%–100% elution buffer (50 mM NaAC, pH 5.5) in fractions of 5 CV. The final polishing step was achieved on SP HP column (GE Healthcare) using the same buffer system as the SP BB step except the elution was done in fractions of 20 CV with 30%–80% elution buffer. All the purification steps were done at room temperature on an AKTA purifier (GE Healthcare).
PEG modification and characterization of protein preparations
Activated PEG (SUNBRIGHT ME-200AL) was purchased from NOF Corporation (Tokyo, Japan). Purified proteins were PEGylated on the first methionine in the buffer system of 20 mM NaCNBH3 (Sigma), 50 mM NaAC, pH 5.5. Substrate protein was mixed with activated PEG in 1:2 ratios (mass). The reaction was incubated overnight at room temperature on a mixing roller. Excess PEG and nonspecifically modified products were removed by the SP HP column. The purification process was the same as described earlier for the SP HP step except that the washing step was 25% buffer B and the elution step was 25%–75% buffer B in fractions of 15 CV.
Purified protein preparations were evaluated by nonreducing SDS-polyacrylamide gel in undenatured conditions. The purity of the purified proteins was analyzed using SB-CN-high-performance liquid chromatography (HPLC) columns (Agilent Technologies, Santa Clara, CA, USA). The HPLC method was performed using buffer A (0.2% trifluoroacetic acid in water) and buffer B (0.2% trifluoroacetic acid, 40% ethanol and 60% isopropanol). The flow rate was 1 mL/min and the column temperature was 50°C. The whole HPLC duration was 15 minutes, and the initial concentration of buffer B was 35%. After sample injection, the gradient was held for 2 minutes and then increased to 70% in 6 minutes. During 8–9 minutes, buffer B was maintained at 95%, and from 9 to 15 minutes, the column was re-equilibrated for next sample. The analysis was achieved on the Acqurity UPLC (Waters, Milford, MA, USA). Molecular mass was measured by liquid chromatography and electrospray ionization quadrupole time-of-flight mass spectrometry (LC/Q-TOF/MS [Waters]), and protein concentrations were determined by absorbance at 280 nm using molar absorption coefficient (ε) that was calculated using an online tool.42
Quantitative real-time RT-PCR analysis
Total RNA was isolated from cultured cells using Trizol (Thermo Fisher Scientific, Waltham, MA, USA). Reverse transcription was performed using the PrimeScript RT Kit (Takara, Kyoto, Japan). Quantitative real-time RT-PCR (qRT-PCR) was performed using the SYBR Premix Ex Taq II kit (Takara, RR820W) on the StepOnePlus Real-Time PCR system (Thermo Fisher Scientific, Waltham, MA, USA). The sequence of the primers is listed in Table 1. Expression of target genes was normalized to the housekeeping gene GAPDH in the same sample, and the data were quantified using the 2−ΔΔC(t) method. Results were expressed as fold of changes relative to untreated controls. Three independent experiments were performed.
ISRE-luciferase reporter assay
To establish a stable HEK293 cell line harboring an IFN-stimulated response element (ISRE)-luciferase gene cassette, the pGL4.45-luc2P/ISRE/Hygro plasmid (Promega Corporation, Fitchburg, WI, USA) was transfected into HEK293 cells by lipofectamine 2000 (Life Technologies) following the manufacturer’s instructions. Transfected cells were cultured with 250 μg/mL hygromycin. Positive clones were selected by comparing the intensity of luminance after treatment by IFN-α2a or IFN-λ1. The clone Luc3 demonstrated the highest response to both IFN-α2a and IFN-λ1, and was chosen for further study. Luc3 cells were plated in white-clear flat-bottom 96-well plate (Corning, NY, USA) at 1×10⁴ cells/well, and treated with IFN-λ analogs or positive controls for 24 hours. Cell culture medium was removed and 20 μL of One-Glo reagent (Promega Corporation) was added to each well. Luminance was detected by a plate reader (Synergy2, Biotek, Winooski, VT, USA). Half maximal effective concentration (EC50) values were determined using nonlinear regression (curve fit) analysis with the GraphPad Prism software (GraphPad Software, Inc., La Jolla, CA, USA).
MTT assay
To examine the impact of the IFN proteins on the viability of the stable HEK293 and the Huh-7.5.1 cells, an MTT assay was performed before subsequent activity assays. Cells were seeded in 96-well plates at 1×10⁴ cells/well, followed by treatment with serial dilutions of proteins for 24 hours (HEK293) or 48 hours (Huh-7.5.1). Medium was replaced by 20 μL of CellTiter-Glo (Promega Corporation). The plates were incubated at room temperature for 10 minutes. Luminescence intensity was read by a plate reader (Synergy2, Biotek). The results were expressed as percentage of untreated controls.
Protein extraction and Western blot analysis
Cells were lysed in 500 μL of radioimmunoprecipitation assay (RIPA) buffer supplied with 1% phosphatase inhibitor cocktail and 1 mM phenylmethanesulfonyl fluoride (PMSF). The lysates were centrifuged at 13,000× g for 10 minutes, and supernatants were diluted 1:4 in SDS loading buffer (60 mM Tris-HCl, pH 6.8; 25% glycerol; 14.4 mM β-mercaptoethanol; 2% SDS). Samples were boiled for 5 minutes and separated on a 12% SDS-polyacrylamide gel. Proteins were electrotransferred onto polyvinylidene difluoride (PVDF) membranes (Immobilone; Millipore, Eschboon, Germany) on the Trans-Blot SD Semi-Dry Transfer Cell (Bio-Rad Laboratories Inc., Hercules, CA, USA). After blocking in 5% nonfat dried milk, the membranes were incubated overnight in antibodies against pSTAT1 (1:1,000) and STAT1 (1:1,000) (Cell Signaling Technology, Beverly, MA, USA). After washing with phosphate-buffered saline (PBS), the membranes were incubated with HRP-conjugated secondary antibody (1:1,000) (Jackson ImmunoResearch Laboratories, Inc., West Grove, PA, USA) for 2 hours. The blots were washed and immersed in enhanced chemiluminescence (ECL) Western blotting substrates (Life Technologies) for 5 minutes and visualized on ChemiDoc™ MP (Bio-Rad Laboratories Inc.).
Generation of infectious HCV and H3N2 viruses
Cell culture-derived, infectious type 2a hepatitis C viruses (HCV) (HCVcc) were generated by transfection of Huh-7.5.1 cells with JFH-1 viral RNA following the protocols described by Paulson with modifications.43 Briefly, HCV viral RNA was transcribed in vitro from the plasmid pJFH-1 using MEGAscript T7 Transcription kit (AM1333M, Life Technologies) and was then used to transfect Huh-7.5.1 cells using the TransIT-mRNA Transfection kit (Mirus Bio LLC, Madison WI, USA). Cells were split every 3 days. The cell culture media containing HCVcc were harvested and temporarily stored at 4°C after adding 10 mM 4-(2-hydroxyethyl)-1-piperazineethanesulfonic acid (HEPES). To long-term storage, the culture supernatants were centrifuged at 4,000× g for 5 minutes to remove cellular debris. An amount of 10 mM HEPES and a quarter volume of 40% PEG8000 (w/v) in PBS were added. After incubation overnight at 4°C, viruses were precipitated by centrifugation at 8,000× g for 15 minutes and resuspended in PBS or Dulbecco’s Modified Eagles Medium (DMEM) plus 10 mM HEPES. The viral preparations were stored at −80°C with 20% fetal bovine serum. To determine the viral titer, HCVs were serially diluted in complete DMEM in tenfold differences and used to infect 104/well Huh-7.5.1 cells in 96-well plates (Corning). The cells were kept at 37°C for 1 hour and then supplemented with fresh complete DMEM. Percentage of infected cells was determined 3 days postinfection by immunofluorescent staining of HCV core (described in the Anti-HCV and H3N2 assay section). The viral titer was expressed as focus forming units per milliliter of supernatant.
To generate H3N2 influenza A virus, MDCK cells at 80%–90% confluence were infected with H3N2 influenza A virus (A/H3N2) for 2 hours. The infected cells were cultured for another 72 hours and the media were harvested and stored at −80°C. To determine the viral titer, human lung adenocarcinoma A549 cells were infected with serially diluted viral solutions for 1 hour. Percentage of infected cells was determined 3 days postinfection by immunofluorescent staining with a monoclonal antibody against the influenza A virus nucleoprotein (anti-NP) (Abcam, ab20343, Cambridge, UK). The viral titer was expressed as tissue culture infectious dose (TCID50).
Anti-HCV and H3N2 assay
To test the effects of the IFN-λ analogs on HCV, Huh-7.5.1 cells were plated on eight-well chamber plates (Lab-tek, Rochester, NY, USA) at 2×10⁴ cells/well. From the next day, cells were cultured in a new medium containing 0.1× multiplicity of infection HCVcc for 24 hours, and then different concentrations of IFN proteins were added to treat the cells for 48 hours. Drug-treated cells were washed three times with PBS, fixed for 9 minutes with acetone/ethanol (1:1), permeabilized in PBS containing 0.2% Triton X-100 for 10 minutes, followed by blocking with 1% BSA in PBS for 1 hour, and incubation in anti-HCV core antibody (C7-50, Pierce Biotechnology, Rockford, IL, USA) overnight at 4°C. After rinsing in PBS, the cells were incubated with Alexa Fluor 488-conjugated secondary antibodies (Jackson ImmunoResearch Laboratories, Inc.) for 1 hour at room temperature. After washing with PBS, the slides were mounted in VectaShield mounting medium with DAPI (Vector Laboratories, Burlingame, CA, USA) and visualized using an Olympus fluorescence microscope. Numbers of HCV foci were manually counted, and averaged numbers of three wells were shown. To quantify HCV RNA by qRT-PCR, Huh-7.5.1 cells were seeded in 24-well plates at 2×10⁴ cells/well. Viral infection, drug treatment, and qRT-PCR analysis were performed as described earlier.
To test the effects of the IFN-λ analogs on H3N2 influenza A virus, A549 cells were treated with different concentrations of test protein for 24 hours, and then infected with 30× TCID50 H3N2 for 90 minutes. The infected cells were cultured for another 72 hours, fixed by ice-cold acetone, and immunostained by a monoclonal anti-NP (Abcam) and a secondary antimouse-HRP (Jackson ImmunoResearch Laboratories, Inc.) antibodies. All treatments were performed in triplicates. As controls, cells were either uninfected and untreated (background) or infected and untreated (negative control). Signals were developed with the 3,3′,5,5′-tetramethylbenzidine (TMB) substrate kit for HRP (Vector Laboratories) and readings at OD490 nm were measured by a plate reader (Synergy 2, Biotek). Half maximal inhibitory concentration (IC50) values were determined by nonlinear regression analysis using the GraphPad Prism software. Ethical approval was not required from the Institutional Review Board (IRB) or Ethics Committee of Jilin University for these studies.
Statistical analysis
Statistical analysis was performed using the GraphPad Prism software. Significance was calculated using one-way analysis of variance.
Results
Design and screening of IFN-λ analogs
In humans, the type III IFN family comprises three regular members, IFN-λ1 (IL-29), IFN-λ2 (IL-28A), and IFN-λ3 (IL-28B), and a rare fourth member, IFN-λ4, which is the result of a subtle nucleotide polymorphism in exon 1 of the otherwise pseudogenized IFN-λ4 gene.10 The expression of IFN-λ4 has only been detected in HCV-infected liver tissues of people that bear a functional IFN-λ4 gene.44 Thus, IFN-λ4 is not considered as a normal player in the type III IFN family. Among the three regular IFN-λ members, IFN-λ2 and -λ3 are highly homologous (with 96% amino acid identity), yet the specific activity of IFN-λ3 is 16-fold higher than IFN-λ2; the activity of IFN-λ3 is also twofold higher than IFN-λ1 (they share 81% amino acid identity),39 indicating that the IFN-λ3-unique amino acids are critical to its activity. Both IFN-λ2 and -λ3 are difficult to produce in a prokaryotic expression system. Thus, to develop IFN-λ analogs that have both higher antiviral potency and good expression efficiency, we used IFN-λ1 (easy to express) and IFN-λ3 (highest activity) as the prototypes. The central idea was to replace a few differential amino acids of IFN-λ1 by their counterparts of IFN-λ3 and vice versa. To achieve this, we arbitrarily divided IFN-λ1 and -λ3 into four fragments labeled as a, b, c, and d (Figure 1A). Each fragment contains one of the four helices that make up the compact four-helix bundle of class II α-helical cytokines (helices A, C, D, and F, respectively). Nine IFN-λ analogs were designed by swapping the four fragments between IFN-λ1 and -λ3 (Figure 1B). Because fragments b, c, and d of IFN-λ1 and -λ3 have identical amino acid sequences in the N-terminal (Figure 1A), the joining of two fragments that are from two different IFN-λ molecules did not create new amino acid sequences. Therefore, all designed analogs did not bear any unnatural amino acid sequence (Figures 1 and S1).
The coding sequence of all nine designed analogs was generated by overlapping PCR and cloned into the prokaryotic expression vector pET11a. Small-scale expression in BL21 (DE3) bacterial cells and SDS-PAGE gel analysis showed that analog-1, -2, -3, -4, -5, and the wild-type IFN-λ2 and -λ3 did not express, while analog-6, -7, -8, -9, and IFN-λ1 expressed well after IPTG induction (Figure 2A). It is interesting to see that all the constructs that start with an IFN-λ2/λ3 sequence did not express (Figure 1B), whereas those that start with an IFN-λ1 sequence all expressed well. A variety of strategies were tried to improve the expression of analog-1, -2, -3, -4, and -5 but failed; we therefore decided to focus our studies on analog-6, -7, -8, and -9.
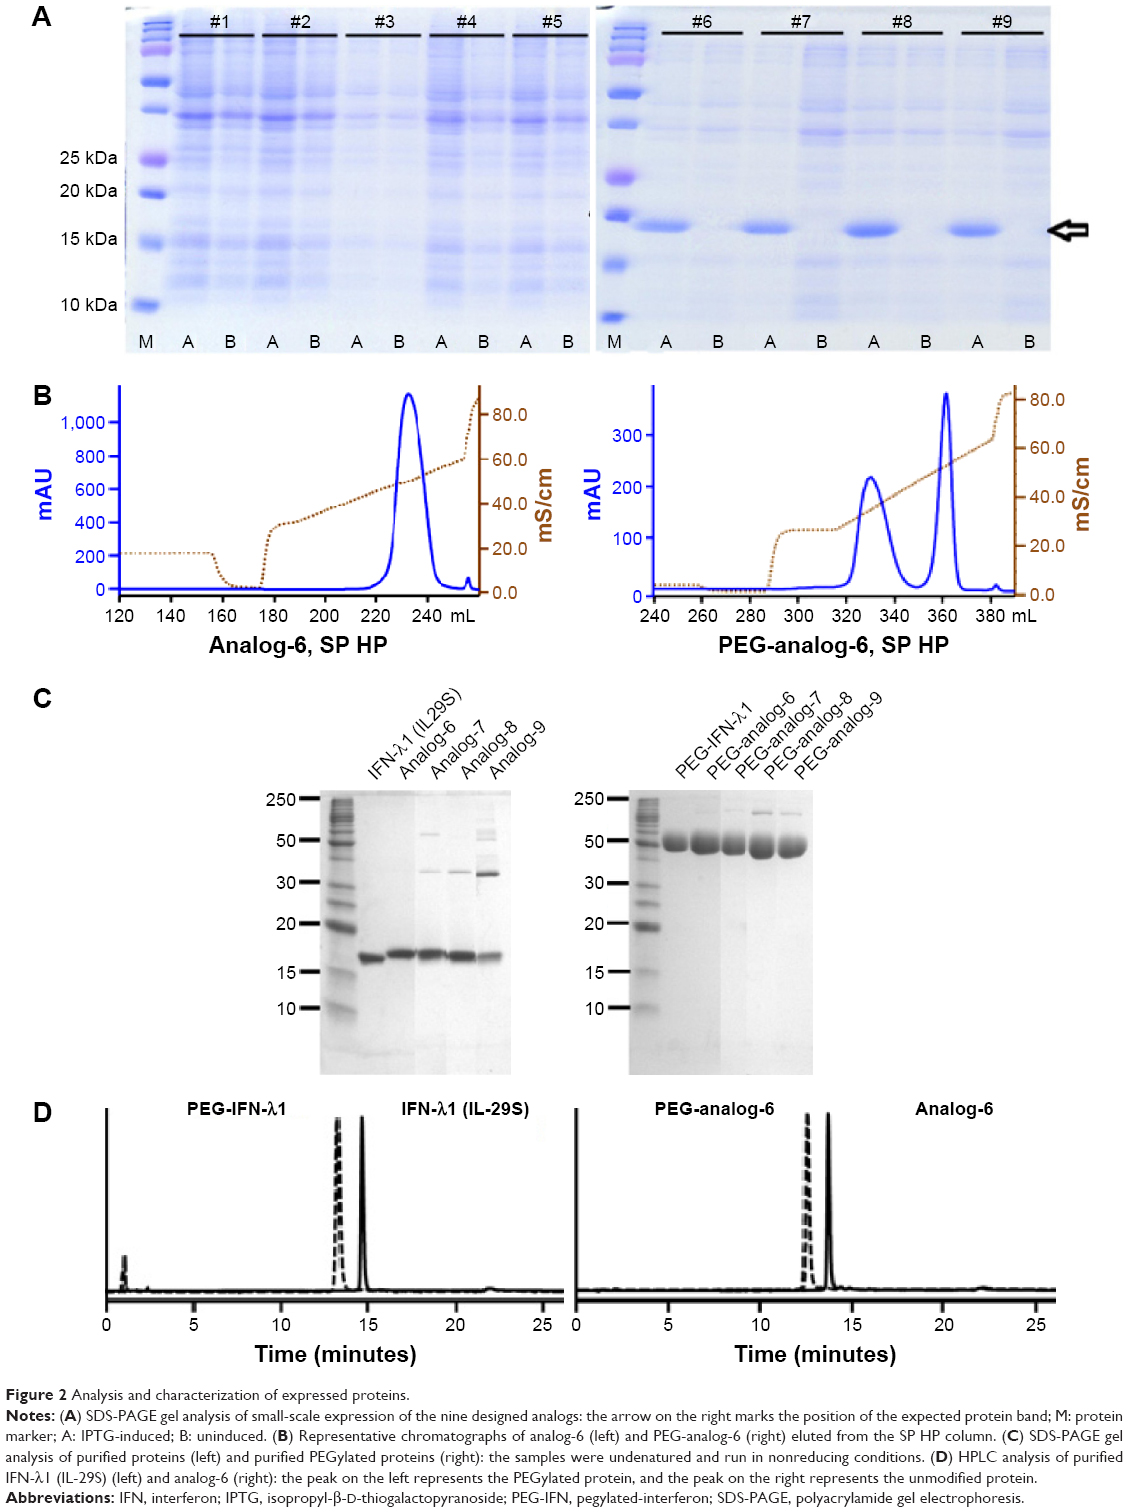 | Figure 2 Analysis and characterization of expressed proteins. |
Purification and characterization of IFN-λ analog proteins
The proteins of analog-6, -7, -8, -9, and IFN-λ1 were recovered from inclusion bodies and incubated in a refolding buffer to allow for proper refolding of the protein and formation of correct disulfide bonds. The refolded proteins were then purified by ion-exchange chromatography on SP BB, phenyl FF (HS), and SP HP columns. In order to compare the activity of the analogs with the PEGylated IFN-α and -λ products that are on the market or in clinical trials, we site-specifically modified the analogs by attaching a PEG moiety to the first methionine using the activated PEG Sunbright ME-200AL from NOF (NOF Corporation). PEGylated proteins were purified by ion-exchange chromatography on an SP HP column. Representative chromatographs of analog-6 eluted from the SP HP column (with or without PEGylation) are shown in Figure 2B.
Purified protein preparations were first analyzed by SDS-PAGE gel under undenatured, nonreducing conditions (Figure 2C) and were further analyzed by HPLC (Figure 2D) and LC/MS (Waters Q-TOF) (Table 2). IFN-λ1 and all four analogs showed a strong band corresponding to the expected size on SDS-PAGE, but the analog-7, -8, and -9 showed additional weak bands corresponding to the size of a dimer and trimer (Figure 2C). This is consistent with these analogs having an additional cysteine that may be involved in the formation of interstrands disulfide bonds (Table 2). HPLC analysis showed that IFN-λ1 and analog-6 were represented by a single, clean peak (Figure 2D), but analog-7, -8, and -9 were represented by a split peak (data not shown). Finally, IFN-λ1 and analog-6 showed the correct molecular mass by LC/Q-TOF/MS analysis, but analog-7, -8, and -9 showed two masses (Table 2), suggesting these proteins had been subjected to modification. The nature of the modification remains to be characterized. Based on these results, analog-6 was chosen as the key candidate in the following studies. The stability of analog-6 and -7 proteins was tested by incubating them at 4°C, 25°C, and 40°C for more than 1 month. The quality of the proteins was continuously monitored by measuring their molecular mass, purity, and concentration. Both protein preparations showed no change in all these parameters and hence were quite stable (Figure S2).
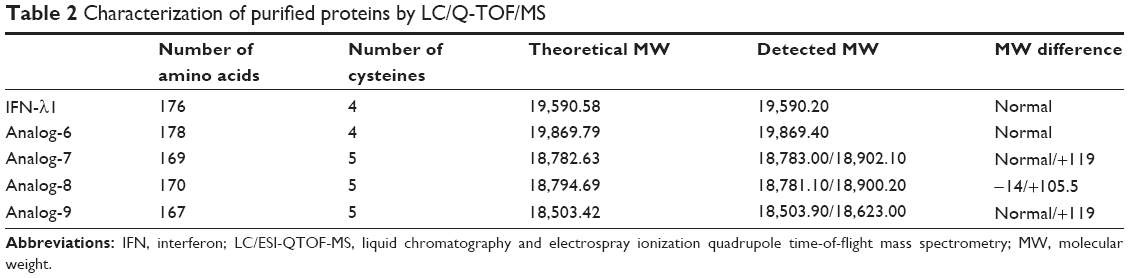 | Table 2 Characterization of purified proteins by LC/Q-TOF/MS |
Induction of MxA and OAS by IFN-λ analogs
To test the bioactivity of the analogs, HepG2 cells were treated with 0.1, 1, 10, or 100 ng/mL IFN-λ1 or analog proteins for 3, 12, or 24 hours. Induction of the antiviral gene MxA and OAS was analyzed by qRT-PCR. The results showed that, similar to IFN-λ1, all four analogs potently induced the expression of MxA and OAS (Figure 3A and B). The induction showed both good dose-dependency (Figure 3A) and time-dependency (Figure 3B). The induction activity was significantly reduced after the proteins were treated at 95°C for 5 minutes, and a similarly prepared unrelated protein (human growth hormone) showed no activity (Figure S3). Therefore, the expression of the antiviral MxA and OAS genes was specifically induced by the analogs.
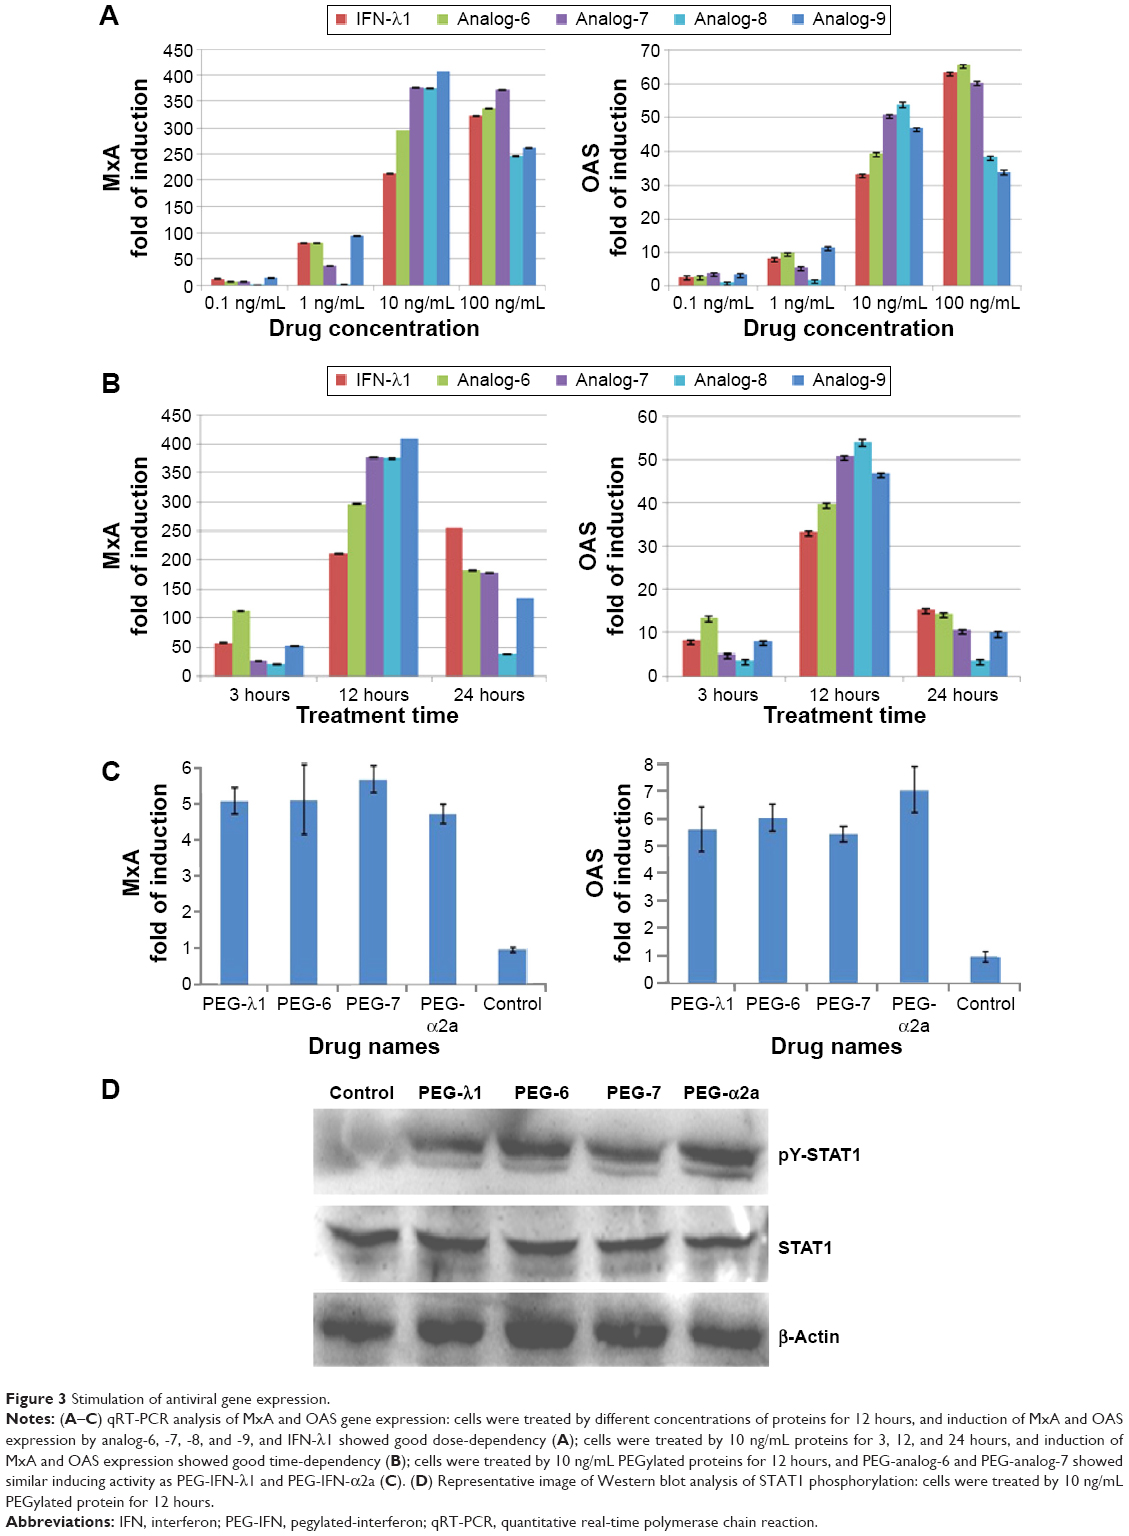 | Figure 3 Stimulation of antiviral gene expression. |
Next, we checked if the PEGylated analog proteins retained the MxA- and OAS-inducing activities such as the PEGylated IFN-λ1 and IFN-α2a. The results showed that the PEGylated analog-6 and -7 were at least equally active as PEG-IFN-λ1 and PEG-IFN-α2a (PEGASYS) in inducing the expression of MxA and OAS (Figure 3C). The activity of PEGylated analog-8 and -9 was significantly reduced (data not shown); therefore, we did not include these two analogs in subsequent studies.
Stimulation of STAT1 phosphorylation by IFN-λ analogs
Binding of both type I and III IFNs to their distinct receptors triggers phosphorylation of preassociated JAK1 and TYK2, which in turn phosphorylate specific intracellular tyrosine residues of the receptor. This leads to the recruitment and phosphorylation of STAT1 and STAT2. Phosphorylated STAT1 and STAT2 form a heterodimer, which recruit the IFN-regulatory factor 9 to form the IFN-stimulated gene factor 3.5 To check if the IFN-λ analogs also acted through the JAK-STAT signaling pathway to induce the expression of antiviral genes, we performed Western blot analysis to examine the level of phosphorylated STAT1 after treatment of HepG2 cells with PEGylated proteins. Figure 3D showed that similar to PEG-IFN-α2a and PEG-IFN-λ1, both PEG-analog-6 and PEG-analog-7 were able to significantly increase the level of phosphorylated STAT1, indicating that they also acted through the JAK-STAT signaling pathway.
Analog-6 was more potent than both IFN-λ1 and IFN-α2a
After confirming the activity of the IFN-λ analogs, we measured their antiviral potency and compared it with that of IFN-α2a and the natural IFN-λ1. Potency determination based on ISRE-driven luciferase activity is a robust, sensitive assay with high reproducibility, specificity, and linearity to IFN treatment.45 To minimize experimental variations associated with transient transfection and to get rid of the need for an internal control, we established a stable HEK293-ISRE-luciferase cell line that expresses the firefly luciferase gene luc2P under the control of five copies of ISRE. The homogeneous cells of the established stable cell line showed good linear and highly reproducible responses to IFN-α2a and IFN-λ1 treatment. And MTT assay showed that the IFN proteins did not affect the viability of the cells of the stable HEK293-ISRE-luciferase cell line (Figure S4A and B). Using this cell line, we first compared the activity of analog-6 and -7 with IFN-λ1 (Figure 4A). The EC50 values for analog-6, analog-7, and IFN-λ1 were 0.1294, 0.514, and 0.9569 ng/mL. Thus, analog-6 and -7 were more active than IFN-λ1.
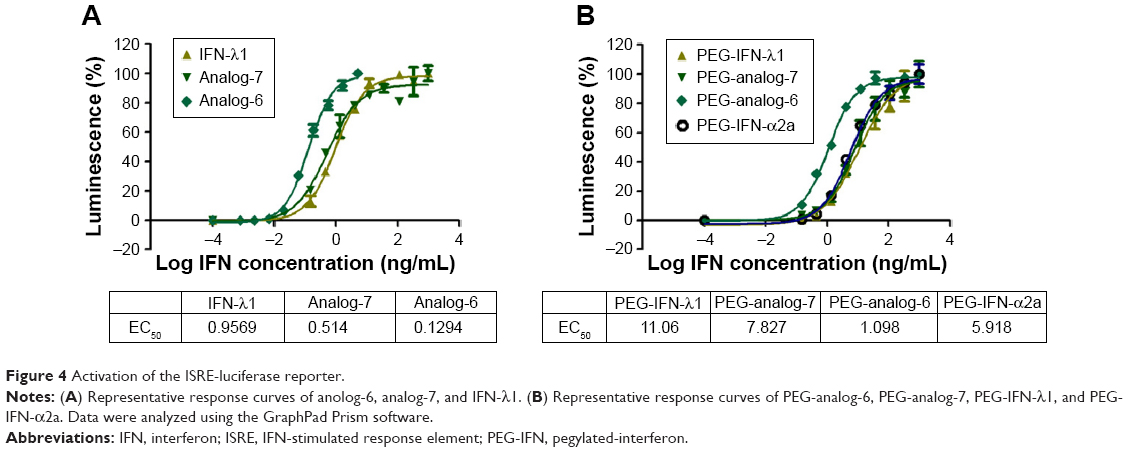 | Figure 4 Activation of the ISRE-luciferase reporter. |
Next, we compared the potency of PEGylated analog-6 and -7 with that of PEG-IFN-λ1 and PEG-IFN-α2a (PAGASYS) (Figure 4B). The EC50 values for PEG-analog-6, PEG-analog-7, PEG-IFN-λ1, and PEG-IFN-α2a were 1.098, 7.827, 11.06, and 5.918 ng/mL. Again, both analogs showed a better potency than IFN-λ1, and PEG-analog-6 was fivefold more potent than PEG-IFN-α2a (1.098 vs 5.918 ng/mL).
The IFN-λ analogs potently reduced HCV viral load in Huh-7.5.1 cells
Type III IFNs act specifically on epithelial cells as well as hepatocytes to defend them against infections by viruses including hepatitis B virus and HCV; as a result, IFN-λ1 is currently being developed as biologics to treat hepatitis B virus and HCV in several clinical trials.30,46 To directly test the antiviral activity of the analogs, cell culture-derived infectious genotype 2a HCV (HCVcc) viruses were used to infect fresh Huh-7.5.1 cells at 0.1× multiplicity of infection for 24 hours. The infected cells were then treated with 0.5, 5, or 50 ng/mL PEG-analog-6, PEG-analog-7, PEG-IFN-λ1, or PEG-IFN-α2a for 48 hours. The presence of HCV was revealed by immunefluorescent labeling of a HCV-specific core protein with an anti-HCV core antibody. As shown in Figure 5A, in the untreated wells (the “no drug” panels), there were numerous bright and large HCV foci (~40 foci/well). Both the number as well as the size of the HCV foci were significantly reduced in the drug-treated panels (Figure 5A), demonstrating that all four proteins dose-dependently inhibited the replication of HCV (Figure 5A and B). To exclude the possibility that the reduction of viral signals was due to reduced cell viability, we compared the viability of uninfected Huh-7.5.1 cells by an MTT assay, which showed that all four proteins had no impact on the viability of Huh-7.5.1 cells (Figure S4C).
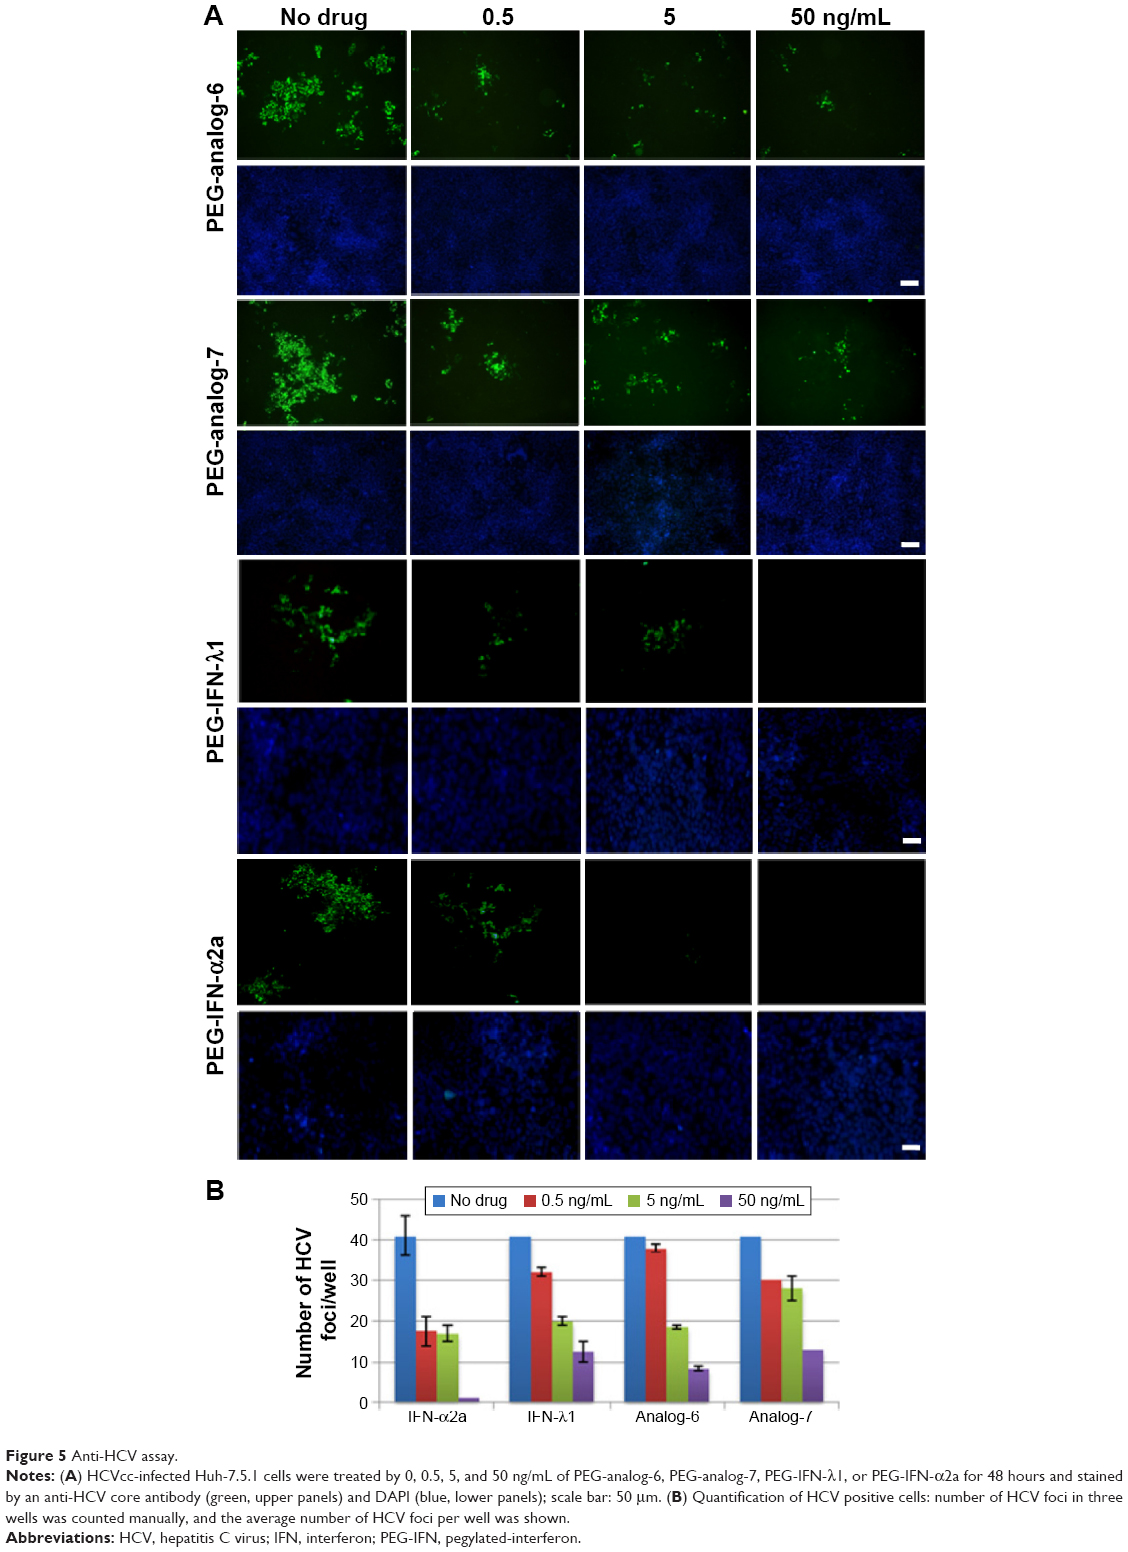 | Figure 5 Anti-HCV assay. |
To provide a quantitative measurement of the antiviral potency, we measured drug treatment-induced changes in HCV RNA levels by real-time RT-PCR using relative quantification and the 2−ΔΔC(t) method. The results were expressed as fold of changes in HCV RNA level relative to untreated controls, which showed that all four proteins dose-dependently reduced HCV RNA levels (Figure S5). To compare the IC50 values, these numbers were fitted into the GraphPad Prism software to generate inhibition curves by nonlinear regression analysis (Figure 6A). The IC50 values generated from these analyses were 0.2654, 0.2911, 0.9175, and 0.09681 ng/mL for PEG-analog-6, PEG-analog-7, PEG-IFN-λ1, and PEG-IFN-α2a, respectively (Figure 6A). In agreement with the luciferase assay results, PEG-analog-6 and PEG-analog-7 were more potent than PEG-IFN-λ1, and their anti-HCV activity was close to that of PEG-IFN-α2a.
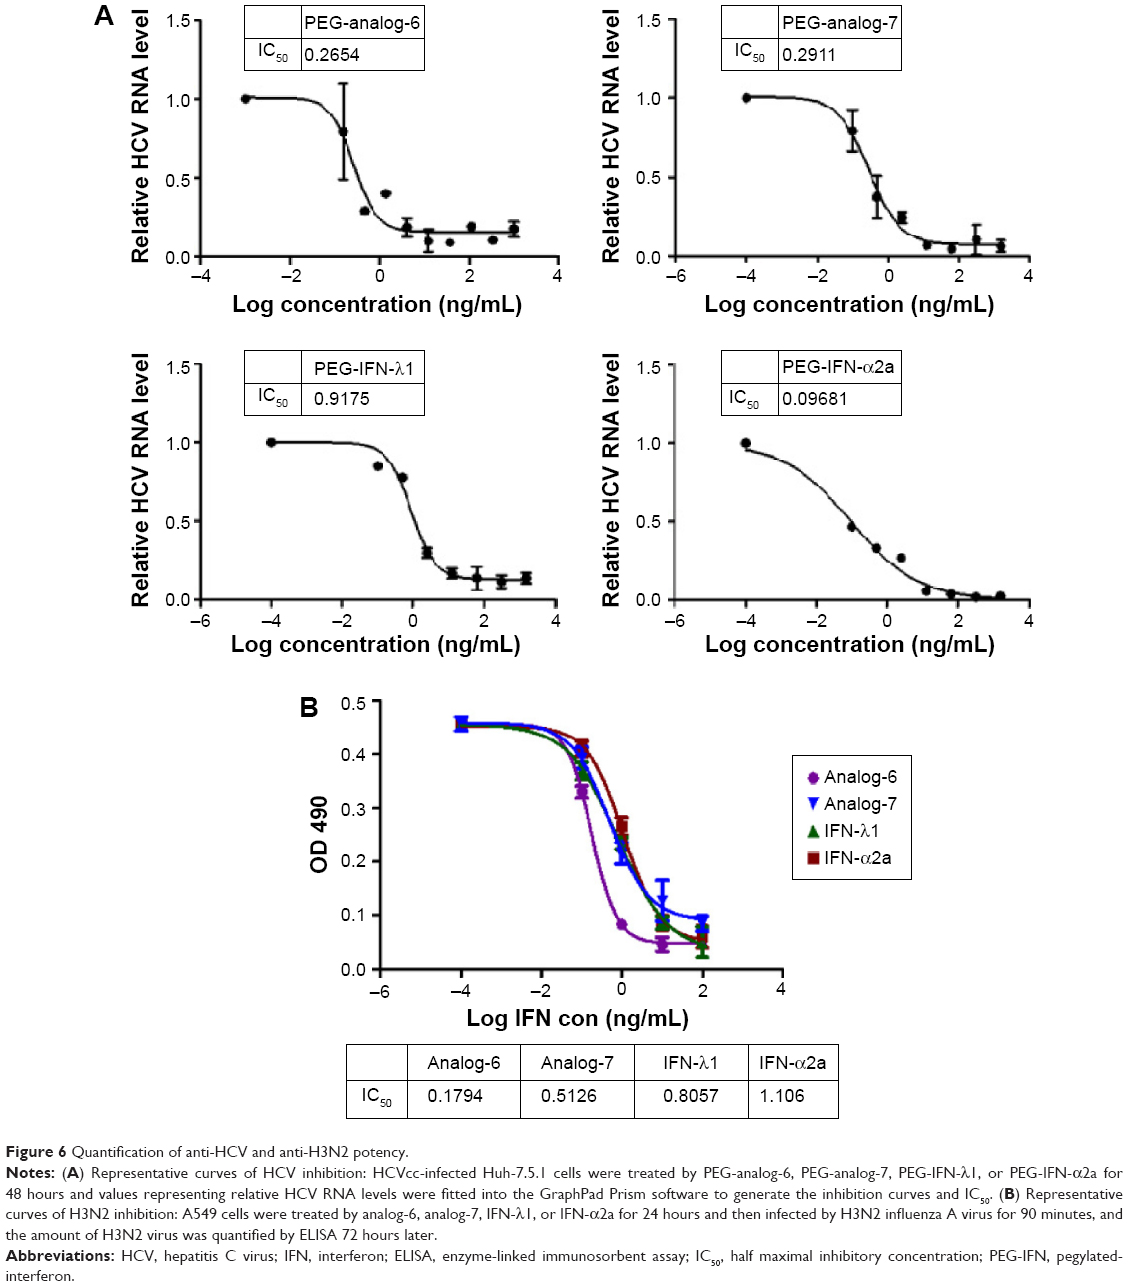 | Figure 6 Quantification of anti-HCV and anti-H3N2 potency. |
The IFN-λ analogs inhibited replication of H3N2 influenza A virus in A549 cells
To test the activity of the IFN-λ analogs against viral infection of mucosal epithelial cells, the ability of the analogs to inhibit replication of H3N2 influenza A viruses was examined in human alveolar epithelial adenocarcinoma A549 cells. After treatment by 0.1, 1, 10, or 100 ng/mL analog-6, analog-7, IFN-λ1, or IFN-α2a for 24 hours, A549 cells were infected with 30× TCID50 of H3N2 viruses for 90 minutes, and the amount of H3N2 virus was quantified 72 hours later by enzyme-linked immunosorbent assay (ELISA). The IC50 values revealed by these measurements were 0.1794, 0.5126, 0.8057, and 1.106 ng/mL for analog-6, analog-7, IFN-λ1, and IFN-α2a, respectively (Figure 6B). The results showed that, similar to their anti-HCV activity, both analogs displayed a potent bioactivity against influenza A viruses. Again, both analogs were more potent than PEG-IFN-λ1, and the activity of all three IFN-λ molecules was higher than that of PEG-IFN-α2a.
Discussion
Viral infection of mucosal surfaces causes the major types of infectious diseases today.47 Due to the low efficiency of vaccines and the lack of specific antiviral small molecule drugs, biologics like IFNs that induce broad-spectrum antiviral responses in target cells should become an important option in the treatment regimen. Type I and II IFNs have been prescribed in the last few decades for the treatment of infectious and autoimmune diseases and selected types of cancer.16 Although these IFNs have undisputable therapeutic benefits, they have also been linked to adverse side effects or lack of efficacy.17 Therefore, it is important to design next- generations of IFNs with better safety profile and higher specific bioactivity for distinct indications. Recent studies have established type III IFNs as the primary inducer of antiviral responses at mucosal surfaces, where the activity of type I IFNs is weak.26–28,32–35,48 Moreover, patients with persistent or recurrent respiratory viral infections were found to have lower than normal type III IFN levels.36 Thus, therapeutic application of exogenous type III, instead of type I IFNs, should be effective against mucosal viral infection.38,49 However, the antiviral potency of natural type III IFNs is in general much weaker than type I, and the most potent type III member, IFN-λ3, is difficult to produce in prokaryotic expression systems.
In the current study, we designed nine IFN-λ analogs based on IFN-λ1 and IFN-λ3. Analog-1, -2, -3, -4, and -5 have an N-terminal fragment from IFN-λ3, and like the natural IFN-λ3, they all failed to be expressed in the BL21 bacterial cells. Understanding of the underlying reasons may open new opportunities to find more protein analogs with distinct efficacy. Analog-6, -7, -8, and -9 have an N-terminal fragment from IFN-λ1, and like the natural IFN-λ1, they all could be easily expressed in BL21 bacterial cells with high yield. These four analogs potently induced the expression of the antiviral gene MxA and OAS, but the activity of PEGylated analog-8 and -9 decreased significantly. We therefore focused on analog-6 and -7. In the ISRE-luciferase assay, analog-6 and -7 showed significantly enhanced activity that was higher than both IFN-λ1 and IFN-α2a. PEGylated analog-6 and -7 powerfully inhibited replication of HCV and influenza A viruses, and the protein preparations were stable at 40°C for more than 1 month. Thus, these studies established analog-6 and -7 as promising candidates to be developed as new antiviral drugs. Given the better safety profile associated with type III IFNs and their specific effects in epithelial cells, these novel IFN-λ analogs could be used to replace IFN-α in the treatment and prevention of epithelial viral infections.
An intriguing feature shared by both type I and type III IFNs is that a single heterodimeric receptor is recognized by multiple subtypes to give rise to differential responses with respect to antiviral, antiproliferative, and immunomodulatory activity.5 For example, IFN-α and -β bind to the same receptor, but IFN-β is 50 times more potent in antiproliferation activity than IFN-α2, but only two times more potent in antiviral activity.41 Thus, subtle differences in the amino acid sequence of an IFN may result in profound alterations in receptor subunit affinity, potency, and target cell specificity.50 For example, replacing a single amino acid at three particular positions of the human IFN-α2 by the IFN-α1 counterpart modified its activity by up to 400-fold.40 Here, we provide another example from the type III family of IFNs. The activity of analog-6 was not only higher than IFN-λ1, but was even higher than IFN-α2a. The difference between analog-6 and IFN-λ1 is that fragments b and c of IFN-λ1 were replaced by that of IFN-λ3. Although these regions are not directly involved in receptor binding,12–14 the resulting subtle amino acid changes may influence the three-dimensional structure of other regions to enhance or weaken ligand–receptor affinity.
Combining the conserved amino acids among IFN-α subtypes generated the consensus IFN (IFN-con1), which showed a tenfold higher antiviral efficacy than natural IFN-α.51,52 Moreover, DNA shuffling was used to generate IFN-α hybrids with a 180-fold greater potency relative to natural IFN-α.53,54 Unfortunately, these engineered IFN-α molecules possess too strong immunogenicity such that it is difficult to develop them as biological drugs. Unlike IFN-con1 and the IFN-α hybrids generated by DNA shuffling that are associated with strong immunogenicity, the IFN-λ analogs we designed here did not create any new amino acid sequence; therefore, they should bear minimal immunogenicity. Such an approach could be used to find more IFN analogs with better drug attributes, such as greatly improved antiviral activity and significantly decreased antiproliferation activity for antiviral treatment. The desired therapeutic effects of native cytokines are often mitigated by toxicity or lack of efficacy, and thus protein engineering has become an increasingly feasible and powerful approach to generate biologics with significantly improved therapeutic index.41,55 Thus, the current approach holds great potential in developing biologics with low immunogenicity.
Acknowledgments
We would like to thank Francis V Chisari of Scripts Research Institute for the Huh-7.5.1 cell line; Jin Zhong of the Institut Pasteur of Shanghai – Chinese Academy of Sciences, Shanghai, People’s Republic of China for assisting us to get the Huh-7.5.1 cell line; Ruifeng Xu of the National Institute of Metrology, Beijing, People’s Republic of China, for help with LC/Q-TOF/MS; and Xiaoguang Zhang of the National Institute for Viral Disease Control and Prevention, Chinese Center for Disease Control and Prevention, for assistance with anti-H3N2 assay. This study was wholly funded by Prosit Sole Biotechnology Co., Ltd., Beijing, People’s Republic of China.
Disclosure
H Liu, H Sun and M Zhang are employees of and M Zhao and Z Zou are shareholders in Prosit Sole Biotechnology Co., Ltd. The other authors report no conflicts of interest in this work.
References
Hoffmann HH, Schneider WM, Rice CM. Interferons and viruses: an evolutionary arms race of molecular interactions. Trends Immunol. 2015;36(3):124–138. | ||
Zitvogel L, Galluzzi L, Kepp O, Smyth MJ, Kroemer G. Type I interferons in anticancer immunity. Nat Rev Immunol. 2015;15(7):405–414. | ||
Stiff A, Carson Iii W. Investigations of interferon-lambda for the treatment of cancer. J Innate Immun. 2015;7:243–250. | ||
de Weerd NA, Nguyen T. The interferons and their receptors – distribution and regulation. Immunol Cell Biol. 2012;90(5):483–491. | ||
Schneider WM, Chevillotte MD, Rice CM. Interferon-stimulated genes: a complex web of host defenses. Annu Rev Immunol. 2014;32:513–545. | ||
Gibbert K, Schlaak JF, Yang D, Dittmer U. IFN-alpha subtypes: distinct biological activities in anti-viral therapy. Br J Pharmacol. 2013;168(5):1048–1058. | ||
Schoenborn JR, Wilson CB. Regulation of interferon-gamma during innate and adaptive immune responses. Adv Immunol. 2007;96:41–101. | ||
Kotenko SV, Gallagher G, Baurin VV, et al. IFN-lambdas mediate antiviral protection through a distinct class II cytokine receptor complex. Nat Immunol. 2003;4(1):69–77. | ||
Sheppard P, Kindsvogel W, Xu W, et al. IL-28, IL-29 and their class II cytokine receptor IL-28R. Nat Immunol. 2003;4(1):63–68. | ||
Prokunina-Olsson L, Muchmore B, Tang W, et al. A variant upstream of IFNL3 (IL28B) creating a new interferon gene IFNL4 is associated with impaired clearance of hepatitis C virus. Nat Genet. 2013;45(2):164–171. | ||
Ouyang W, Rutz S, Crellin NK, Valdez PA, Hymowitz SG. Regulation and functions of the IL-10 family of cytokines in inflammation and disease. Annu Rev Immunol. 2011;29:71–109. | ||
Zdanov A. Structural analysis of cytokines comprising the IL-10 family. Cytokine Growth Factor Rev. 2010;21(5):325–330. | ||
Miknis ZJ, Magracheva E, Li W, Zdanov A, Kotenko SV, Wlodawer A. Crystal structure of human interferon-lambda1 in complex with its high-affinity receptor interferon-lambdaR1. J Mol Biol. 2010;404(4):650–664. | ||
Gad HH, Dellgren C, Hamming OJ, Vends S, Paludan SR, Hartmann R. Interferon-lambda is functionally an interferon but structurally related to the interleukin-10 family. J Biol Chem. 2009;284(31):20869–20875. | ||
Blouin CM, Lamaze C. Interferon gamma receptor: the beginning of the journey. Front Immunol. 2013;4:267. | ||
Lin FC, Young HA. Interferons: success in anti-viral immunotherapy. Cytokine Growth Factor Rev. 2014;25(4):369–376. | ||
George PM, Badiger R, Alazawi W, Foster GR, Mitchell JA. Pharmacology and therapeutic potential of interferons. Pharmacol Ther. 2012;135(1):44–53. | ||
Yin Z, Dai J, Deng J, et al. Type III IFNs are produced by and stimulate human plasmacytoid dendritic cells. J Immunol. 2012;189(6):2735–2745. | ||
Wolk K, Witte K, Witte E, et al. Maturing dendritic cells are an important source of IL-29 and IL-20 that may cooperatively increase the innate immunity of keratinocytes. J Leukoc Biol. 2008;83(5):1181–1193. | ||
Kotenko SV. IFN-lambdas. Curr Opin Immunol. 2011;23(5):583–590. | ||
Hermant P, Michiels T. Interferon-lambda in the context of viral infections: production, response and therapeutic implications. J Innate Immun. 2014;6(5):563–574. | ||
Egli A, Santer DM, O’Shea D, Tyrrell DL, Houghton M. The impact of the interferon-lambda family on the innate and adaptive immune response to viral infections. Emerg Microbes Infect. 2014;3(7):e51. | ||
Witte K, Witte E, Sabat R, Wolk K. IL-28A, IL-28B, and IL-29: promising cytokines with type I interferon-like properties. Cytokine Growth Factor Rev. 2010;21(4):237–251. | ||
Zhou Z, Hamming OJ, Ank N, Paludan SR, Nielsen AL, Hartmann R. Type III interferon (IFN) induces a type I IFN-like response in a restricted subset of cells through signaling pathways involving both the Jak-STAT pathway and the mitogen-activated protein kinases. J Virol. 2007;81(14):7749–7758. | ||
Doyle SE, Schreckhise H, Khuu-Duong K, et al. Interleukin-29 uses a type 1 interferon-like program to promote antiviral responses in human hepatocytes. Hepatology. 2006;44(4):896–906. | ||
Pott J, Mahlakoiv T, Mordstein M, et al. IFN-lambda determines the intestinal epithelial antiviral host defense. Proc Natl Acad Sci U S A. 2011;108(19):7944–7949. | ||
Mordstein M, Neugebauer E, Ditt V, et al. Lambda interferon renders epithelial cells of the respiratory and gastrointestinal tracts resistant to viral infections. J Virol. 2010;84(11):5670–5677. | ||
Sommereyns C, Paul S, Staeheli P, Michiels T. IFN-lambda (IFN-lambda) is expressed in a tissue-dependent fashion and primarily acts on epithelial cells in vivo. PLoS Pathog. 2008;4(3):e1000017. | ||
Muir AJ, Shiffman ML, Zaman A, et al. Phase 1b study of pegylated interferon lambda 1 with or without ribavirin in patients with chronic genotype 1 hepatitis C virus infection. Hepatology. 2010;52(3):822–832. | ||
Muir AJ, Arora S, Everson G, et al. A randomized phase 2b study of peginterferon lambda-1a for the treatment of chronic HCV infection. J Hepatol. 2014;61(6):1238–1246. | ||
Ramos EL. Preclinical and clinical development of pegylated interferon-lambda 1 in chronic hepatitis C. J Interferon Cytokine Res. 2010;30(8):591–595. | ||
Mahlakoiv T, Hernandez P, Gronke K, Diefenbach A, Staeheli P. Leukocyte-derived IFN-alpha/beta and epithelial IFN-lambda constitute a compartmentalized mucosal defense system that restricts enteric virus infections. PLoS Pathog. 2015;11(4):e1004782. | ||
Hernandez PP, Mahlakoiv T, Yang I, et al. Interferon-lambda and interleukin 22 act synergistically for the induction of interferon-stimulated genes and control of rotavirus infection. Nat Immunol. 2015;16(7):698–707. | ||
Gallagher G, Megjugorac NJ, Yu RY, et al. The lambda interferons: guardians of the immune-epithelial interface and the T-helper 2 response. J Interferon Cytokine Res. 2010;30(8):603–615. | ||
Nice TJ, Baldridge MT, McCune BT, et al. Interferon-lambda cures persistent murine norovirus infection in the absence of adaptive immunity. Science. 2015;347(6219):269–273. | ||
Contoli M, Message SD, Laza-Stanca V, et al. Role of deficient type III interferon-lambda production in asthma exacerbations. Nat Med. 2006;12(9):1023–1026. | ||
Koch S, Finotto S. Role of interferon-lambda in allergic asthma. J Innate Immun. 2015;7:224–230. | ||
Angel J, Franco MA, Greenberg HB, Bass D. Lack of a role for type I and type II interferons in the resolution of rotavirus-induced diarrhea and infection in mice. J Interferon Cytokine Res. 1999;19(6):655–659. | ||
Dellgren C, Gad HH, Hamming OJ, Melchjorsen J, Hartmann R. Human interferon-lambda3 is a potent member of the type III interferon family. Genes Immun. 2009;10(2):125–131. | ||
Weber H, Valenzuela D, Lujber G, Gubler M, Weissmann C. Single amino acid changes that render human IFN-alpha 2 biologically active on mouse cells. EMBO J. 1987;6(3):591–598. | ||
Spangler JB, Moraga I, Mendoza JL, Garcia KC. Insights into cytokine–receptor interactions from cytokine engineering. Annu Rev Immunol. 2015;33(1):139–167. | ||
Gasteiger E, Hoogland C, Gattiker A, et al. Protein Identification and Analysis Tools on the ExPASy Server. In: Walker JM, editor: The Proteomics Protocols Handbook, Humana Press (2005). Totowa, New Jersey: Humana Press; 2005:571–607. | ||
Paulson MS. Generation and quantitation of infectious hepatitis C virus derived from cell culture (HCVcc). In: Enna SJ, Williams M, editors. Current Protocols in Pharmacology. New York: John Wiley & Sons, Inc.; 2010:13B.14.11–13B.14.19. | ||
Amanzada A, Kopp W, Spengler U, Ramadori G, Mihm S. Interferon-lambda4 (IFNL4) transcript expression in human liver tissue samples. PLoS One. 2013;8(12):e84026. | ||
Larocque L, Bliu A, Xu R, et al. Bioactivity determination of native and variant forms of therapeutic interferons. J Biomed Biotechnol. 2011;2011:174615. | ||
Chan HL, Ahn SH, Chang TT, et al. O115 PEGInterferon lambda for the treatment of chronic hepatitis B (CHB): a phase 2B comparison with PEGinterferon alfa in patients with HBeAg-positive disease. J Hepatol. 2014;60(1):S48. | ||
Wong SS, Yuen KY. Antiviral therapy for respiratory tract infections. Respirology. 2008;13(7):950–971. | ||
Jewell NA, Cline T, Mertz SE, et al. Lambda interferon is the predominant interferon induced by influenza A virus infection in vivo. J Virol. 2010;84(21):11515–11522. | ||
Matzinger SR, Carroll TD, Fritts L, McChesney MB, Miller CJ. Exogenous IFN-alpha administration reduces influenza A virus replication in the lower respiratory tract of rhesus macaques. PLoS One. 2011;6(12):e29255. | ||
Levin D, Schneider WM, Hoffmann HH, et al. Multifaceted activities of type I interferon are revealed by a receptor antagonist. Sci Signal. 2014;7(327):ra50. | ||
Blatt LM, Davis JM, Klein SB, Taylor MW. The biologic activity and molecular characterization of a novel synthetic interferon-alpha species, consensus interferon. J Interferon Cytokine Res. 1996;16(7):489–499. | ||
Witthoft T. Review of consensus interferon in the treatment of chronic hepatitis C. Biologics. 2008;2(4):635–643. | ||
Chang CC, Chen TT, Cox BW, et al. Evolution of a cytokine using DNA family shuffling. Nat Biotechnol. 1999;17(8):793–797. | ||
Brideau-Andersen AD, Huang X, Sun SC, et al. Directed evolution of gene-shuffled IFN-alpha molecules with activity profiles tailored for treatment of chronic viral diseases. Proc Natl Acad Sci U S A. 2007;104(20):8269–8274. | ||
Kimchi-Sarfaty C, Schiller T, Hamasaki-Katagiri N, Khan MA, Yanover C, Sauna ZE. Building better drugs: developing and regulating engineered therapeutic proteins. Trends Pharmacol Sci. 2013;34(10):534–548. |
Supplementary materials
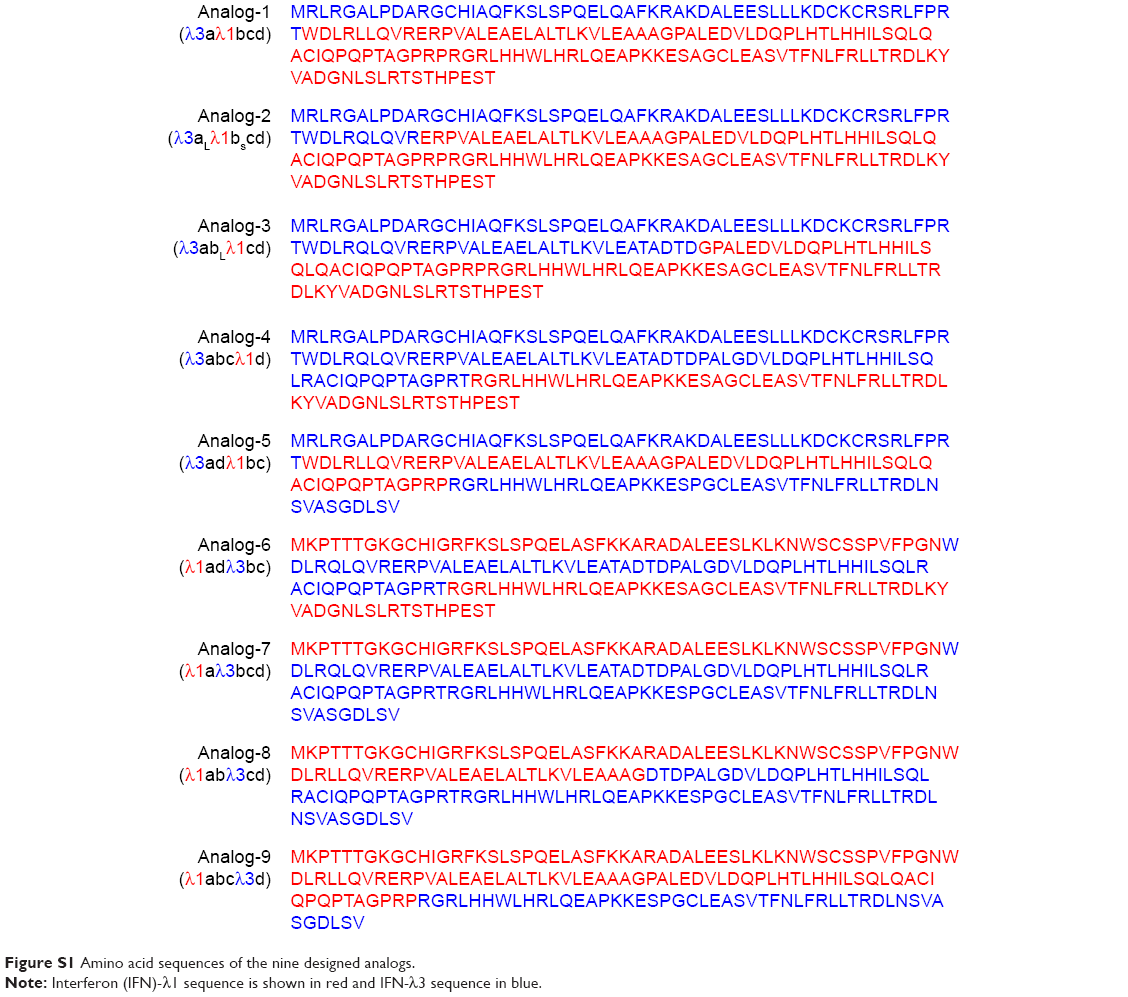 | Figure S1 Amino acid sequences of the nine designed analogs. |
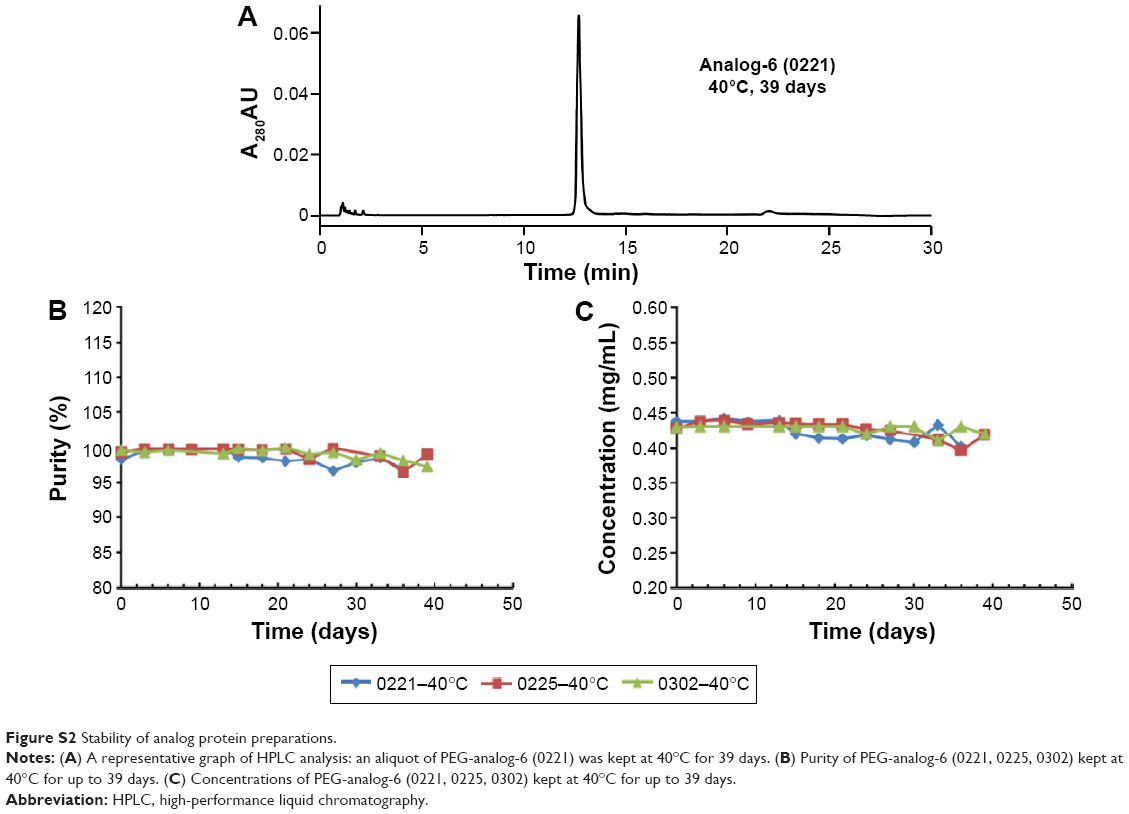 | Figure S2 Stability of analog protein preparations. |
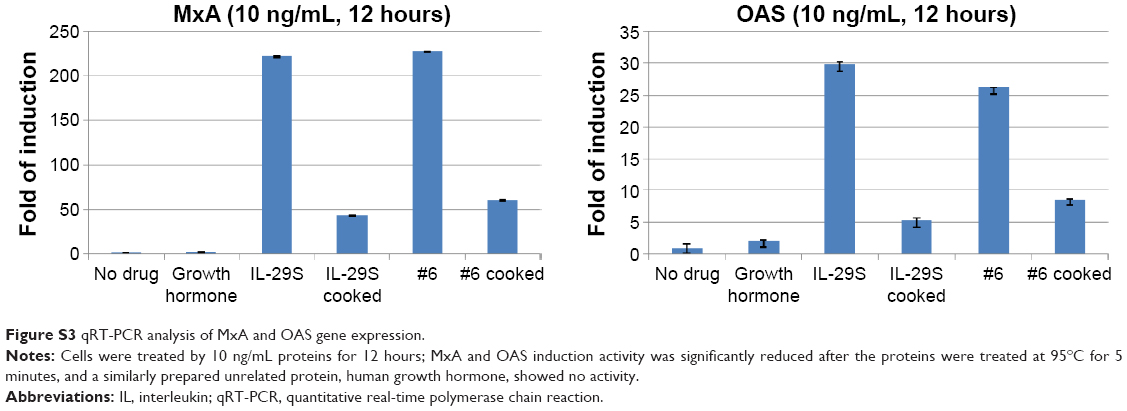 | Figure S3 qRT-PCR analysis of MxA and OAS gene expression. |
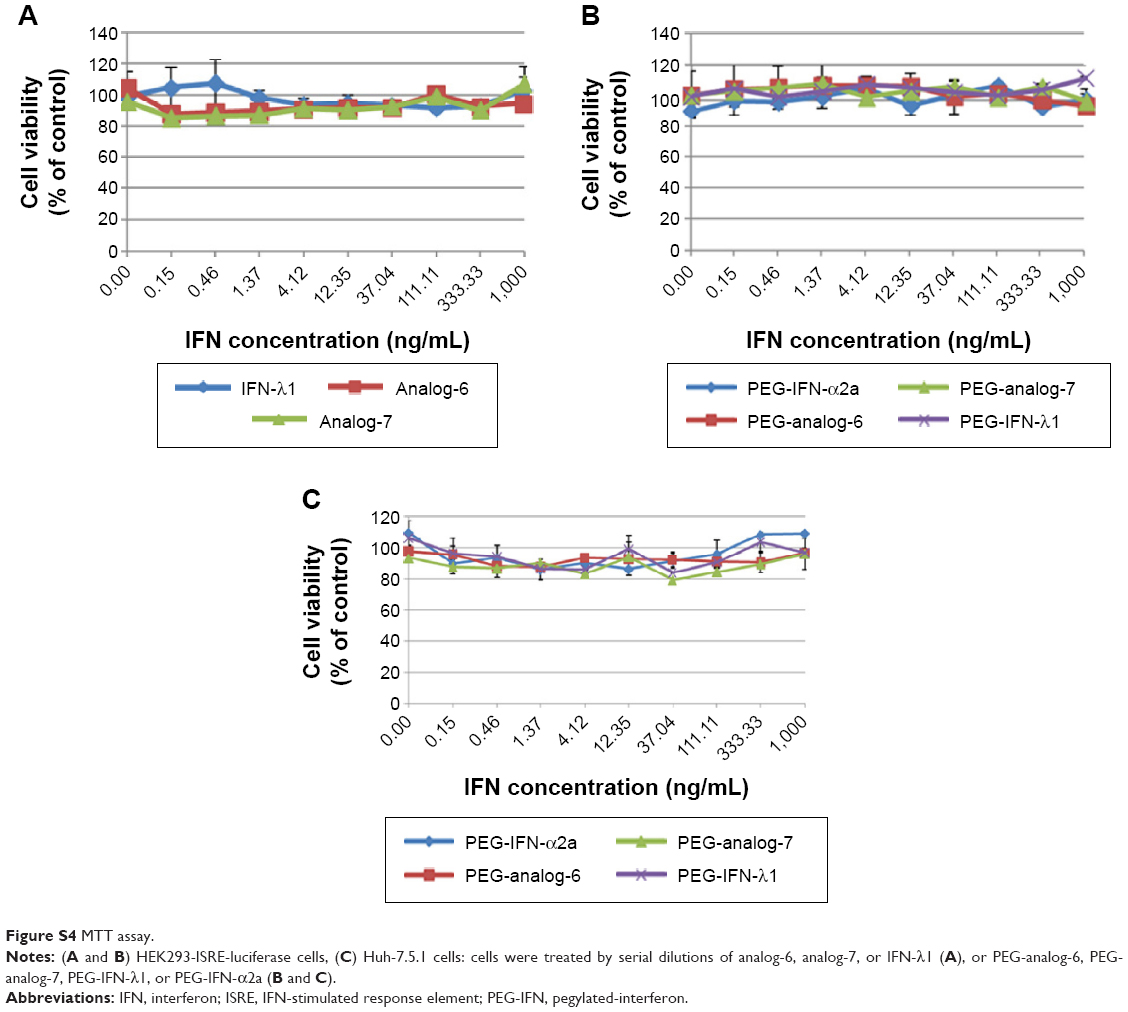 | Figure S4 MTT assay. |
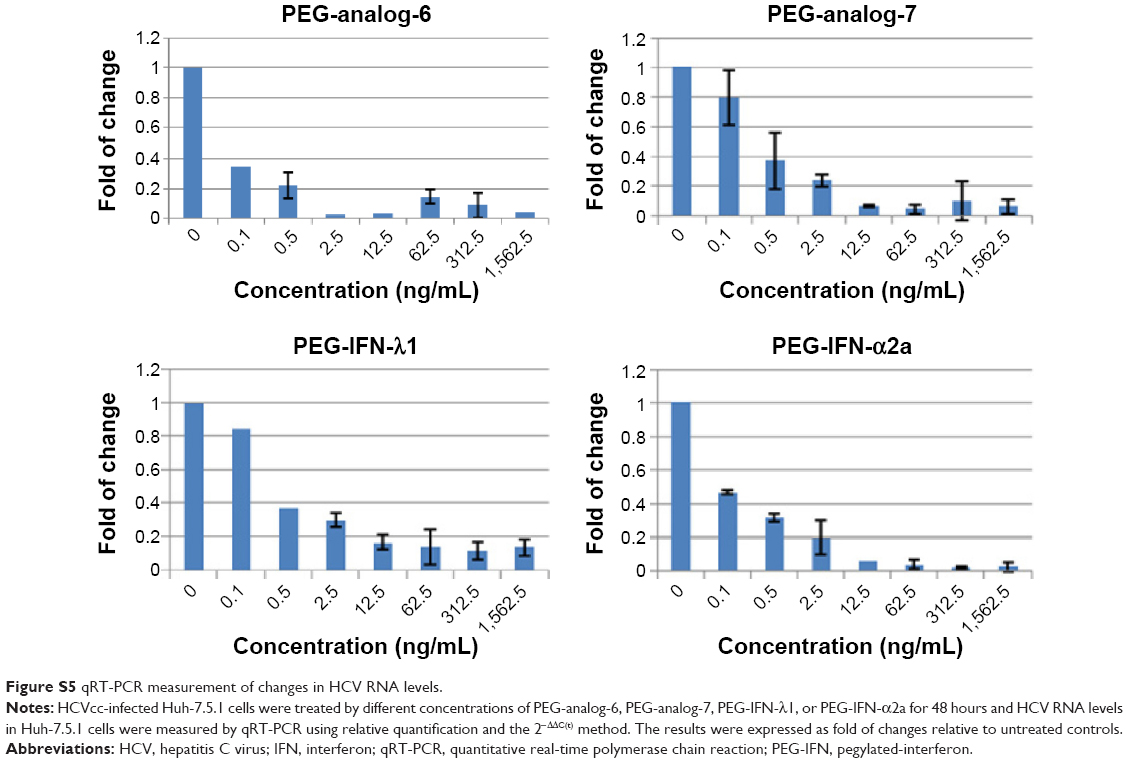 | Figure S5 qRT-PCR measurement of changes in HCV RNA levels. |
 © 2016 The Author(s). This work is published and licensed by Dove Medical Press Limited. The full terms of this license are available at https://www.dovepress.com/terms.php and incorporate the Creative Commons Attribution - Non Commercial (unported, v3.0) License.
By accessing the work you hereby accept the Terms. Non-commercial uses of the work are permitted without any further permission from Dove Medical Press Limited, provided the work is properly attributed. For permission for commercial use of this work, please see paragraphs 4.2 and 5 of our Terms.
© 2016 The Author(s). This work is published and licensed by Dove Medical Press Limited. The full terms of this license are available at https://www.dovepress.com/terms.php and incorporate the Creative Commons Attribution - Non Commercial (unported, v3.0) License.
By accessing the work you hereby accept the Terms. Non-commercial uses of the work are permitted without any further permission from Dove Medical Press Limited, provided the work is properly attributed. For permission for commercial use of this work, please see paragraphs 4.2 and 5 of our Terms.