")
Back to Journals » Drug Design, Development and Therapy » Volume 10
Depot injectable atorvastatin biodegradable in situ gel: development, optimization, in vitro, and in vivo evaluation
Authors Ahmed T , Alharby Y, El-Helw A, Ibrahim KMH , El-Say KM
Received 11 October 2015
Accepted for publication 27 November 2015
Published 20 January 2016 Volume 2016:10 Pages 405—415
DOI https://doi.org/10.2147/DDDT.S98078
Checked for plagiarism Yes
Review by Single anonymous peer review
Peer reviewer comments 3
Editor who approved publication: Prof. Dr. Wei Duan
Tarek A Ahmed,1,2 Yasser A Alharby,1 Abdel-Rahim M El-Helw,1 Khaled M Hosny,1,3 Khalid M El-Say1,2
1Department of Pharmaceutics and Industrial Pharmacy, Faculty of Pharmacy, King Abdulaziz University, Jeddah, Saudi Arabia; 2Department of Pharmaceutics and Industrial Pharmacy, Faculty of Pharmacy, Al-Azhar University, Cairo, Egypt; 3Department of Pharmaceutics and Industrial Pharmacy, Faculty of Pharmacy, Beni Suef University, Beni Suef, Egypt
Abstract: This study aimed to develop an optimized depot injectable atorvastatin (ATR) biodegradable in situ gel (ISG) system with minimum initial burst using a central composite design. The factors selected were poly (D, L-lactide-co-glycolide) (PLGA) concentration (X1), molecular weight of polyethylene glycol (PEG) (X2), and PEG concentration (X3). The independent variables were the initial burst of ATR after 2 (Y1) and 24 hours (Y2). The optimized formulation was investigated using scanning electron microscopy, Fourier transform infrared spectroscopy, and in vitro drug release in phosphate-buffered saline of pH 7.4 for 72 hours. The in vivo pharmacokinetic study of the optimized ATR-ISG and the corresponding PEG-free ATR-ISG were conducted by intramuscular injection of a single dose (2 mg/kg) of ATR in male New Zealand White rabbits. A double-blind, randomized, parallel design was used in comparison with those of the marketed ATR tablet. Statistical analysis revealed that PLGA concentration and the molecular weight of PEG have pronounced effects on both Y1 and Y2. The optimized formulation was composed of 36.10% PLGA, PEG 6000, and 15.69% PEG, and exhibited characteristic in vitro release pattern with minimal initial burst. Incorporation of PEG in the formulation causes a slight decrease in the glass transition temperature value of PLGA, leading to a slight change in Fourier transform infrared spectroscopy spectrum due to possible interaction. Moreover, scanning electron microscopy photomicrograph showed smooth surface with disappearance of the cracks which characterize the surface of PEG-free formulation. The pharmacokinetic data for the optimized depot injectable ATR-ISG showed a significant (P<0.05) decrease in maximum plasma concentration from 547.62 to 346.84 ng/mL, and increasing time to reach the maximum plasma concentration from 12 to 72 hours in comparison with the marketed tablet. The optimized ATR-ISG formulation has shown minimal initial drug burst which confirms the suitability of the ISG system in the prolongation of drug release in patients with chronic long-term therapy.
Keywords: atorvastatin, biodegradable polymers, central composite design, in situ gel
Introduction
Sustained release drug delivery systems provide several advantages over the regular formulations such as better patient comfort and compliance, prolonged drug delivery, decreased dosing frequency, and minimum side effects.1 In situ gel (ISG) system is a special class of polymeric sustained release systems that is manufactured as a liquid and solidifies after administration.2,3 It consists of a biocompatible biodegradable hydrophobic polymer that is dissolved in a water miscible/partially miscible, biocompatible solvent.3,4 The drug is dissolved or suspended in the polymeric matrix. Poly (D, L-lactide-co-glycolide) (PLGA) is one of the commonly used polymers utilized in this system. It possesses many useful properties among which are the biocompatibility, biodegradability, and the availability of PLGA-based marketed products, Atridox® and Eligard®.
One of the major disadvantages associated with the ISG system is the initial drug burst.5 It is characterized by an initial high drug release rate at the beginning of the administration process, an effect that results in a plasma elevated drug concentration that may exceed the maximum effective concentration and may cause tissue irritation. The main cause for this phenomenon is the fast distribution of the administered drug during the sol/gel (solidification) transformation process.6,7 Other factors that could contribute to this behavior are uneven distribution of the drug inside the polymeric matrix8 and the rapid diffusion of the drug adsorbed on the surface of the polymer.9 Some efforts have been made to overcome this problem. Among these are the use of hydrophobic solvents,10,11 choice of PLGA of higher lactide rather than glycolide ratio,12 use of higher polymer concentration and molecular weight,13,14 and incorporation of plasticizer or surfactant.14,15
Atorvastatin (ATR) is a synthetic widely used cholesterol-lowering agent, which belongs to the drug class known as statins. Its mechanism of action involves inhibition of the enzyme 3-hydroxy-3-methyl-glutaryl-coenzyme A (HMG-CoA) reductase which catalyzes the conversion of HMG-CoA to mevalonate in the process of cholesterol biosynthesis.16 It has been reported that only 12%–14% of the drug is bioavailable following 40 mg oral dose.17 The drug is subject to extensive first-pass metabolism in both the gut wall as well as in the liver cells.18 Its bioavailability is affected by parameters such as solubility, dissolution rate of the drug, gastrointestinal tract permeability, high intestinal clearance, and first-pass metabolism.
So, the aim of this study was to develop an optimized depot injectable long-term therapy of ATR formulation with a low initial drug burst using a biodegradable PLGA with different molecular weight polyethylene glycol (PEG) in different concentrations. Intramuscular administration of this formulation could be considered as an alternative for the commercially available drug oral daily tablets. This will avoid the drug peroral first pass effect, enhance the drug bioavailability, and is expected to achieve better patient comfort and compliance due to decreased drug dosing frequency.
Materials and methods
Materials
ATR calcium was kindly supplied as a gift sample from SAJA Pharmaceuticals Co., Ltd. (Jeddah, Kingdom of Saudi Arabia). N-methyl-2-pyrrolidone (NMP) was purchased from Acros organics (Thermo Fisher Scientific, Waltham, MA, USA). PEG 200, 400, 1000, 4000, and 6000 were procured from Fluka AG (Buchs, Switzerland). PLGA lactide:glycolide (50:50), molecular weight 30,000–60,000 Da with intrinsic viscosity 0.45 dL/g, was obtained from Sigma-Aldrich Co. (St Louis, MO, USA). All materials used were of analytical grade and were used without further modification.
Methods
Preliminary study
Preparation of PEG-free ISG formulations
Three ISG formulations using different PLGA concentrations of 20%, 30%, and 40% were prepared. Briefly, the specified amount of polymer was dissolved in NMP in scintillation glass vials and kept shaking in a thermostatically controlled water bath shaker (Model 1031; GLF Corp., Burgwedel, Germany) at room temperature until a homogeneous clear solution was obtained. ATR in a concentration of 10% was added to the resulting polymeric solution and the vials again were kept shaking until complete dissolving of the drug.
Preparation of ATR-ISG formulations
Utilization of central composite design
Three different independent variables, namely, PLGA concentration (X1), PEG molecular weight (X2), and PEG concentration (X3), were investigated for their effect on the initial drug release after 2 (Y1) and 24 hours (Y2). Central composite design was utilized in the development of ATR-ISG formulations with different levels of X1, X2, and X3 using Statgraphics Centurion XV version 15.2.05 software (StatPoint Technologies Inc., Warrenton, VA, USA). The design was implemented to get polynomial equations that relate the independent variables to the dependent responses. The design was performed to minimize the dependent responses (Y1 and Y2). Table 1 summarizes the independent variables with their levels and the dependent variables with their constraints to perform the central composite design.
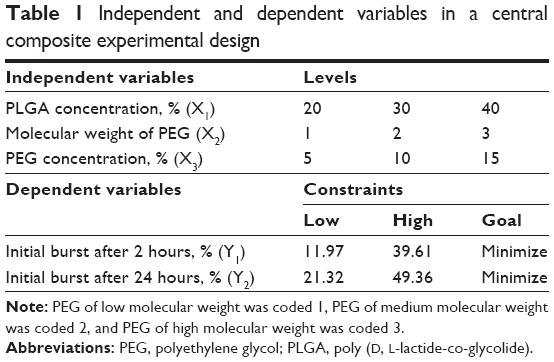 | Table 1 Independent and dependent variables in a central composite experimental design |
Preparation of ATR-ISG with PEG
Sixteen formulations were prepared by the same method described above. For low molecular weight PEG, 200 and 400, the specified amount was added after obtaining a clear polymeric solution while for high molecular weight PEG the vials were subjected to probe sonication using Sonic Vibramcell™ (Sonic & Materials Inc., Newtown, CT, USA) under ice cooling for 30 seconds to facilitate dissolving PEG. Each formula was subjected to in vitro release study utilizing the same conditions mentioned above. The resulting composition of ATR-ISG formulations with the observed and predicted responses of these formulations is listed in Table 2.
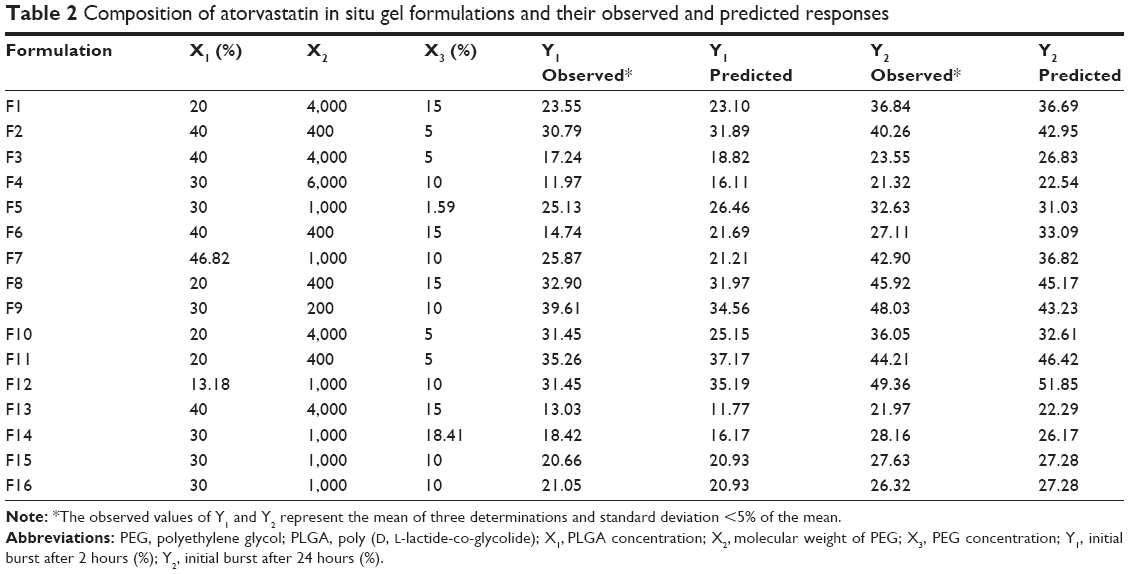 | Table 2 Composition of atorvastatin in situ gel formulations and their observed and predicted responses |
Evaluation of the prepared ATR-ISG formulations
Spectroscopic evaluation of ISG ingredients
Pure ATR, PLGA, PEG, their physical mixture, and the optimized formulation after it had been dried and crushed, which were used in the preparation of ATR-ISG, were studied for any possible interaction that may have occurred using Fourier transform infrared spectroscopy (FTIR).
Fourier transform infrared spectra were recorded on Perkin Elmer Spectrum One FTIR spectrometer (Shelton, CT, USA) using KBr discs with a 2 cm−1 resolution in the range of 4,000–400 cm−1 and the spectra are displayed in Figure 1.
 | Figure 1 Fourier transform infrared spectra of atorvastatin, PEG, PLGA, physical mixture, and the dried in situ gel formulation. |
In vitro release study
A quantity of the formulation equivalent to 10 mg ATR was injected into 900 mL phosphate-buffered saline (PBS) of pH 7.4 in a USP dissolution tester apparatus II, DT 700, Erweka GmbH (Heusenstamm, Germany) at 37°C and a rotation speed of 100× g. Aliquots of 2 mL were withdrawn at 0.5, 1, 2, 4, 6, 8, 10, 12, 24, 48, and 72 hours and replaced with an equivalent amount of fresh PBS to maintain a sink condition. The in vitro release study for the optimized formulation was extended for 10 days to get a complete picture about the release profile. The samples withdrawn were analyzed spectrophotometrically at 243 nm using Jenway 6715 UV-Visible spectrophotometer (Jenway, Stone, UK). A regression equation of a standard calibration curve was developed with the same medium to quantify the drug released. The experiment was carried out in triplicate and the release profiles of all formulations are presented in Figure 2. The release data of the optimized ATR-ISG formulation were analyzed using different kinetic models to designate the mechanism of drug release.19–23
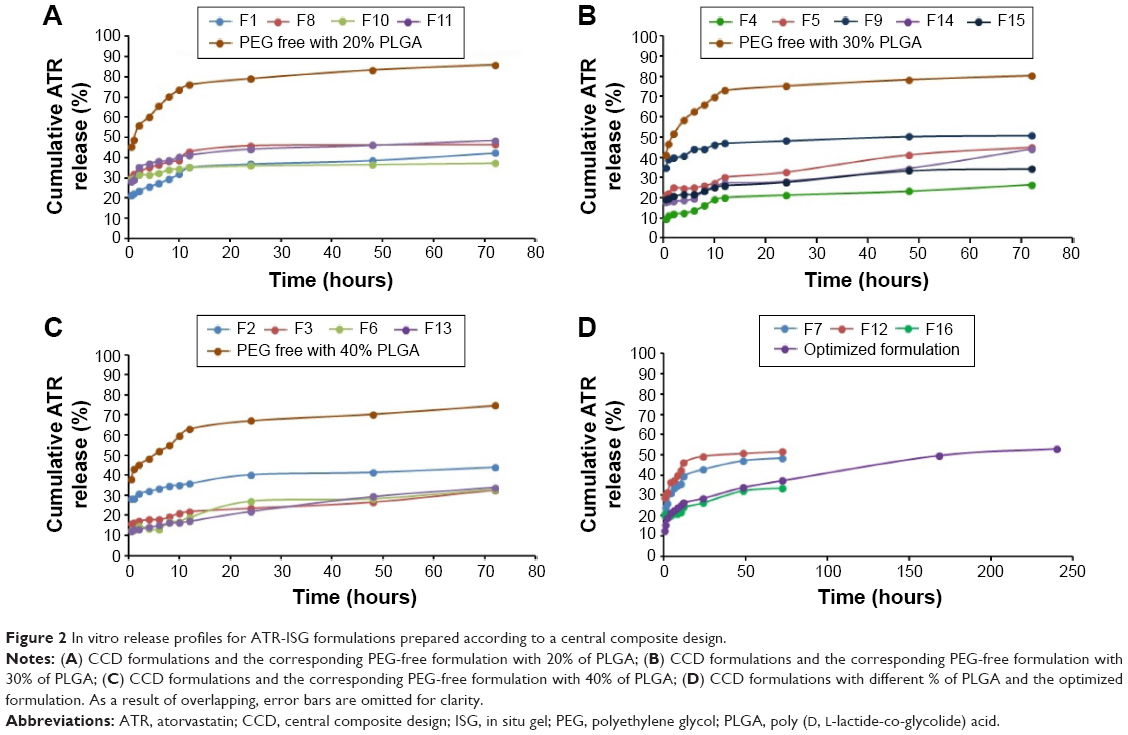 | Figure 2 In vitro release profiles for ATR-ISG formulations prepared according to a central composite design. |
Characterization of the optimized ATR-ISG formulation
The optimized ATR-ISG formulation was examined for clarity, color, and pH. Syringeability, which is the force required to push the prepared polymeric drug solution through the syringe needle, was also evaluated using universal syringe rig (Stable Micro Systems, Surrey, UK).24 These characteristics of the optimized formulation were compared to the corresponding PEG-free formulation.
Surface morphology evaluation
The surface characteristics of the optimized ATR-ISG formulation and the corresponding PEG-free ISG formulation were studied using scanning electron microscopy (SEM). Each formulation was injected separately into PBS of pH 7.4 and kept in the buffer at 37°C. After 24 hours the sample was collected, dried at room temperature, and subjected to characterization using SEM (Philips XL30; FEI, Hillsboro, OR, USA) and SEM photomicrographs were recorded.
In vivo and pharmacokinetic study
Male New Zealand White rabbits with an average weight of 2.5 kg were provided by King Fahd Medical Research Center (Jeddah, Saudi Arabia). Animals were maintained at a temperature between 18°C and 22°C and low relative humidity (less than 30%). The study was carried out in accordance with procedures approved by Research Ethics Committee at the Faculty of Medicine, King Abdulaziz University the local Institutional Review Board for Preclinical & Clinical Research who ensured the care and use of experimental animals conformed to the EU Directive 2010/63/EU on the protection of animals used for scientific purposes, and Guiding Principle in Care and Use of Animals (DHEW publication NIH 80-23), and the “Principles of Laboratory Animal Care” (NIH publication #85-23, revised in 1985). During the experiment, animals were given full access to normal standard diet and tap water ad libitum. The animals were housed two per cage in standard rabbit cages maintained at 22°C±3°C under a 12-hour light and 12-hour dark cycle and were acclimatized at least 1 week prior to the start of the experiment. Rabbits were divided into three groups of six animals per group and kept fasted for at least 24 hours prior to the experiments. The first group received the marketed ATR tablet (reference); the second group was injected intramuscularly with the optimized ATR-ISG formulation into the right gluteus maximus muscle; while the third group was injected intramuscularly with PEG-free ISG formulation into the same muscle. The dose of ATR administered to the animals was calculated according to Reagan-Shaw et al.25 Considering the human dose of 20 mg/day for a 70 kg adult, the dose for rabbits was 2 mg/kg/day. Blood samples (0.5 mL) were collected from the marginal ear vein at 0.5, 1, 2, 4, 8, 12, and 24 hours, and after 2, 3, 4, 5, 6, and 7 days. The collected samples were deproteinized with acetonitrile. The plasma drug concentration in each sample was calculated after analyzing the samples using ultra-performance liquid chromatography mass spectroscopy (UPLC MS/MS Acquity TQ 3100; Waters Corporation, Milford, MA, USA) equipped with ACE 5 C8 Column (50×2.1 mm, 5 μm). Quantification of the drug in the plasma was according to the method depicted by Gajula et al26 with slight modifications. An injection volume of 5 μL was introduced into the autosampler. The mobile phase used was a mixture of 0.2% acetic acid buffer, methanol, and acetonitrile (20:16:64, v/v/v) that was delivered at a flow rate of 1.0 mL/min into the mass spectrometer’s electrospray ionization chamber. Quantitation was achieved by MS/MS detection using an API-3200 (Applied Biosystems MDS Sciex, Concord, Canada) mass spectrometer, equipped with a turbo ion spray interface at 400°C. The ion spray voltage was set at 3,500 V. The common parameters were nebulizer N2 gas temperature: 350°C and drying N2 gas flow: 200 mL/min.
Pharmacokinetic analysis
Different pharmacokinetic parameters were estimated from the obtained drug plasma concentration values using Kinetica™ software (Version 4; Thermo Fisher Scientific). Maximum plasma concentration, time to reach the maximum plasma concentration (tmax), and mean residence time were determined. The measured drug plasma concentrations were also used to calculate the area under the plasma concentration–time curve from time zero to the last concentration time point (AUClast) and the area under the plasma concentration–time curve from time zero to infinity (AUCtotal). AUClast was calculated according to the trapezoidal rule while AUCtotal was calculated by the sum of AUClast and the last measured concentration divided by the elimination constant (Ct/ke). The obtained data were statistically analyzed using GraphPad Prism 6 (GraphPad Software, Inc., La Jolla, CA, USA) to verify the differences between the tested groups. Two-way analysis of variance followed by Tukey’s multicomparison test was used to assess the difference and a P-value <0.05 was considered to be statistically significant. In addition, the 95% confidence level is considered for testing. Each test animal was compared with the reference individually at the respective time point.
Results and discussion
To discover the optimal concentration of the used polymer (PLGA) and its effect on the initial burst of the drug from the formulation, three preliminary formulations with 20%, 30%, and 40% PLGA were prepared. The in vitro release of these formulations was studied for 72 hours and the release profile displayed a high initial burst release phase followed by an approximately steady state release phase (Figure 2A–C). The initial burst release stage is mainly due to the lag time between administration of the drug polymeric liquid state formulation and solidification to form the ISG system.6,14 Other possible mechanisms for this phenomenon are related to the fast release of the drug adsorbed at the surface and irregular distribution of the administered drug in the polymeric matrix.8,9 The second phase is a diffusion control release stage which is usually slower than the initial phase.27,28
PLGA is a widely used biodegradable biocompatible polymer that hydrolyzes in the body into lactic and glycolic acid.7 It is approved by the US Food and Drug Administration as a safe compound in therapeutic formulations.29 A polymer concentration in the range of 20%–40% was chosen as a fast release and high initial drug burst is obtained when polymer concentration less than 20% is used. Ahmed et al6 studied the effect of polymer concentration on haloperidol release from PLGA in situ implant and reported a similar finding. PLGA is available in different lactide to glycolide ratios, 50:50, 65:35, 75:25, and 85:15. Polymer rich in lactide results in a highly hydrophobic polymer which degrades slowly and absorbs less water.30 High molecular weight polymer results in a polymeric solution that is difficult to inject due to its higher viscosity, while low molecular weight polymer produces a polymeric solution with a high rate of water absorption and polymer erosion.31 So, PLGA 50:50 of molecular weight 30,000–60,000 Da with intrinsic viscosity of 0.45 dL/g in 0.1% in CHCl3 at 25°C was chosen as a good candidate for controlling the release of the drug in this study.
Tan et al15 have illustrated the effect of incorporation of PEG 400 into a PLGA-based ISG system. They reported a reduction in the initial burst release probably due to its plasticizing action. In another study, PEG 400 was used as a plasticizer to reduce aspirin initial burst from a PLGA-based ISG forming system.32 Ibrahim et al14 also reported a similar finding after incorporation of 10%–30% PEG 400 to meloxicam in situ implant formulations prepared with PLGA. The solubilizing effect of PEG could be another possible mechanism for this effect. PEG permits homogeneous distribution of the administered drug in the prepared PLGA matrix, the effect that decreases adsorption of the drug particles at the polymeric matrix. Biocompatible surfactant such as pluronics, tweens, spans, and chromophores have also been proven to influence the initial burst release from a PLGA-based ISG system.12,33 PEG could play the same role as these aforementioned surfactants. The plasticizing effect of PEG could be attributed to the decrease in the glass transition temperature of PLGA from 48°C to about 45.5°C for both PLGA–PEG 2000 and PLGA–PEG 4000 derivatives.34
Deadman et al35 defined the initial burst release as the percent of total drug released in the first 24 hours. Different researchers evaluated the drug initial burst by estimating the amount released at the first 24–48 hours.6,12,32,36,37 Other researchers determined the initial burst release at the first 2 hours.14
Spectroscopic evaluation of ISG ingredients
FTIR spectrum of pure ATR showed characteristic bands at 2,955.15, 1,313.56, 3,059.15, 1,564.97, 3,403.27, 1,656.97, 751.62 and 696.95, and 1,104.39 cm−1 for C–H-stretching, C–N-stretching, C–OH-stretching alcoholic group, C=O-stretching amidic group, N–H-stretching, C=C-bending, C–F-stretching, and OH-bending, respectively, as depicted in Figure 1. Mixing the drug with PEG in the form of physical mixture showed no considerable change in the spectrum of the pure drug while some changes in the characteristic peaks of the drug were noticed in the optimized formulation due to possible interaction of PEG with PLGA. This was obvious in the amidic group, C–OH-stretching alcoholic group, and C–H-stretching. Incorporation of PEG causes slight decrease in the glass transition temperature value of PLGA from 48°C to about 45.5°C as previously illustrated by Alimohammadi et al.34 Also, the plasticizing effect of PEG previously mentioned is based on the reduction of the attractive forces among the polymer chains. These effects could explain the decrease in the drug burst effect after incorporation of PEG in the formulation.
Response surface methodology for optimization of ATR-ISG formulation
A central composite design with three factors in three levels was implemented to study the influence of three different formulation parameters on ATR initial burst release after 2 (Y1) and after 24 hours (Y2), and evaluate the main effects, interaction effects, and quadratic effects of these factors on the dependent variables. The concentration of PLGA (X1), molecular weight of PEG (X2), and concentration of PEG (X3) were selected as the independent variables.
The in vitro release profiles for the prepared formulations in comparison with PEG-free formulations are depicted in Figure 2. The drug release profile from PLGA ISG system usually exhibits a triphasic pattern: an initial fast release stage lasting for minutes or hours, followed by a slow stage of drug release lasting for days or weeks, and finally a rapid phase of drug release.6 Compared with PEG-free formulations with different concentration of PLGA depicted in Figure 2A–C, all the 16 formulations proposed by the central composite design exhibited low initial ATR release burst which confirms the impact of PEG on controlling the initial burst of ATR from the ISG formulations.
Estimation of quantitative effects of the selected factors
To estimate the quantitative effects of the selected factors, statistical analysis of central composite statistical design batches was carried out by multiple regression analysis and two-way analysis of variance using Statgraphics software. Table 3 shows the estimated effects of the selected factors, F-ratios, and associated P-values for the two responses resulting from analysis of variance.
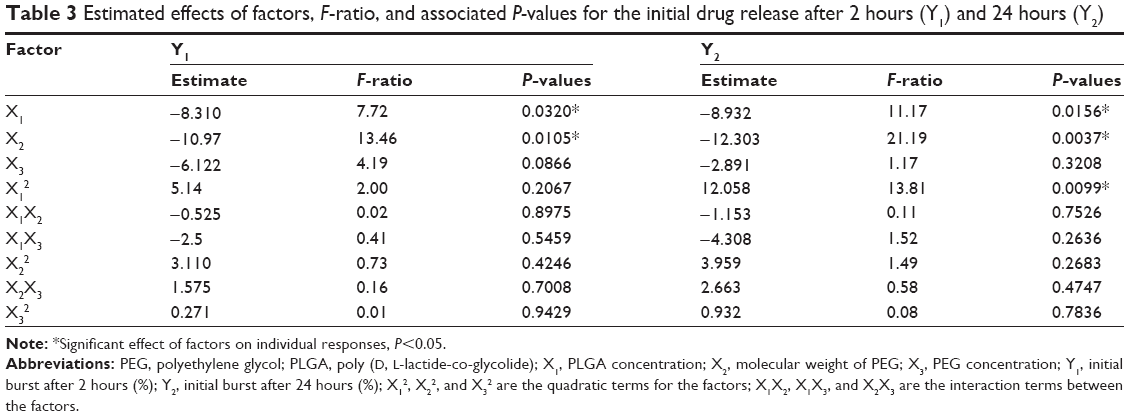 | Table 3 Estimated effects of factors, F-ratio, and associated P-values for the initial drug release after 2 hours (Y1) and 24 hours (Y2) |
Based on these results, X1 had a significant antagonistic effect on both Y1 and Y2 with P-values =0.032 and 0.0156, respectively. It was also found that X2 had a significant antagonistic effect on both responses (P=0.0105 for Y1 and P=0.0037 for Y2). On the other hand, X3 had no significant effect on both Y1 and Y2. In addition, Y2 was significantly affected by the synergistic effects of the quadratic term of X1 (P=0.0099). Finally, it was found that the interaction terms of X1X2, X1X3, and X2X3 and the quadratic term of X2 and X3 had no significant effect on the studied responses.
Statistical analysis and mathematical modeling of experimental data
Analysis of variance for the obtained results revealed that only the PLGA concentration (X1) and molecular weight of PEG (X2) had a significant pronounced effect (P-value <0.05) on the initial burst after 2 hours and after 24 hours. This effect was displayed in the standardized Pareto charts for Y1 and Y2 (Figure 3A and B).
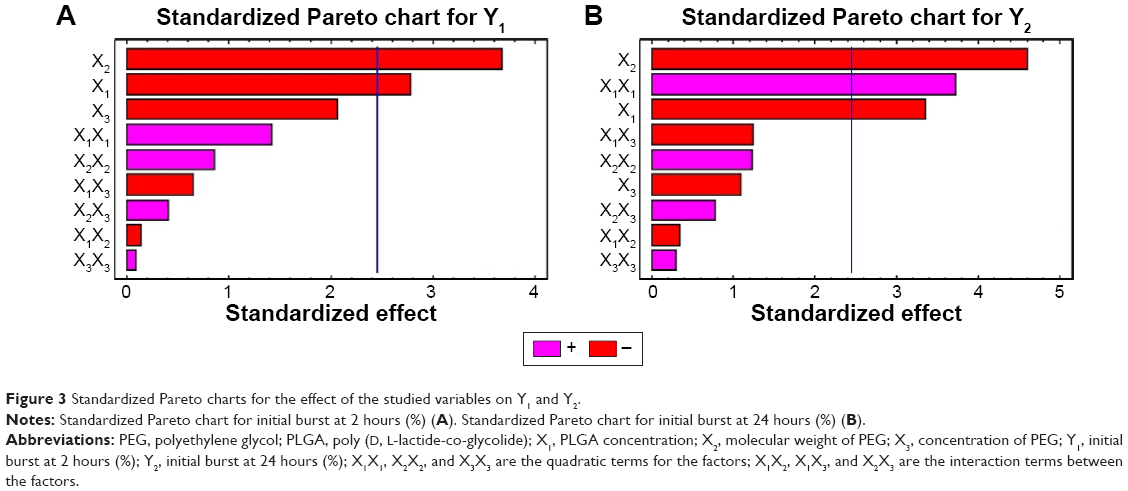 | Figure 3 Standardized Pareto charts for the effect of the studied variables on Y1 and Y2. |
On the analysis of the obtained values for the responses regarding initial burst after 2 hours (Y1) and initial burst after 24 hours (Y2), the mathematical model for each response was generated and is shown in Equations 1 and 2.
Y1 =74.456−1.655X1 −12.493X2 −0.286X3 +0.026X12−0.026X1X2 −0.025X1X3 +1.555X22 +0.158X2X3+0.005X32 | (1) |
Y2 =108.866−3.518X1 −15.002X2 +0.098X3 +0.06X12−0.058X1X2 −0.043X1X3 +1.979X22 +0.266X2X3+0.019X32 | (2) |
These equations imitate the quantitative influence of the formulation variables on Y1 and Y2 responses. By increasing the concentration of PLGA and using PEG with high molecular weight, the initial burst after 2 hours (Y1) and after 24 hours (Y2) was decreased as illustrated in the response surface plot in Figure 4.
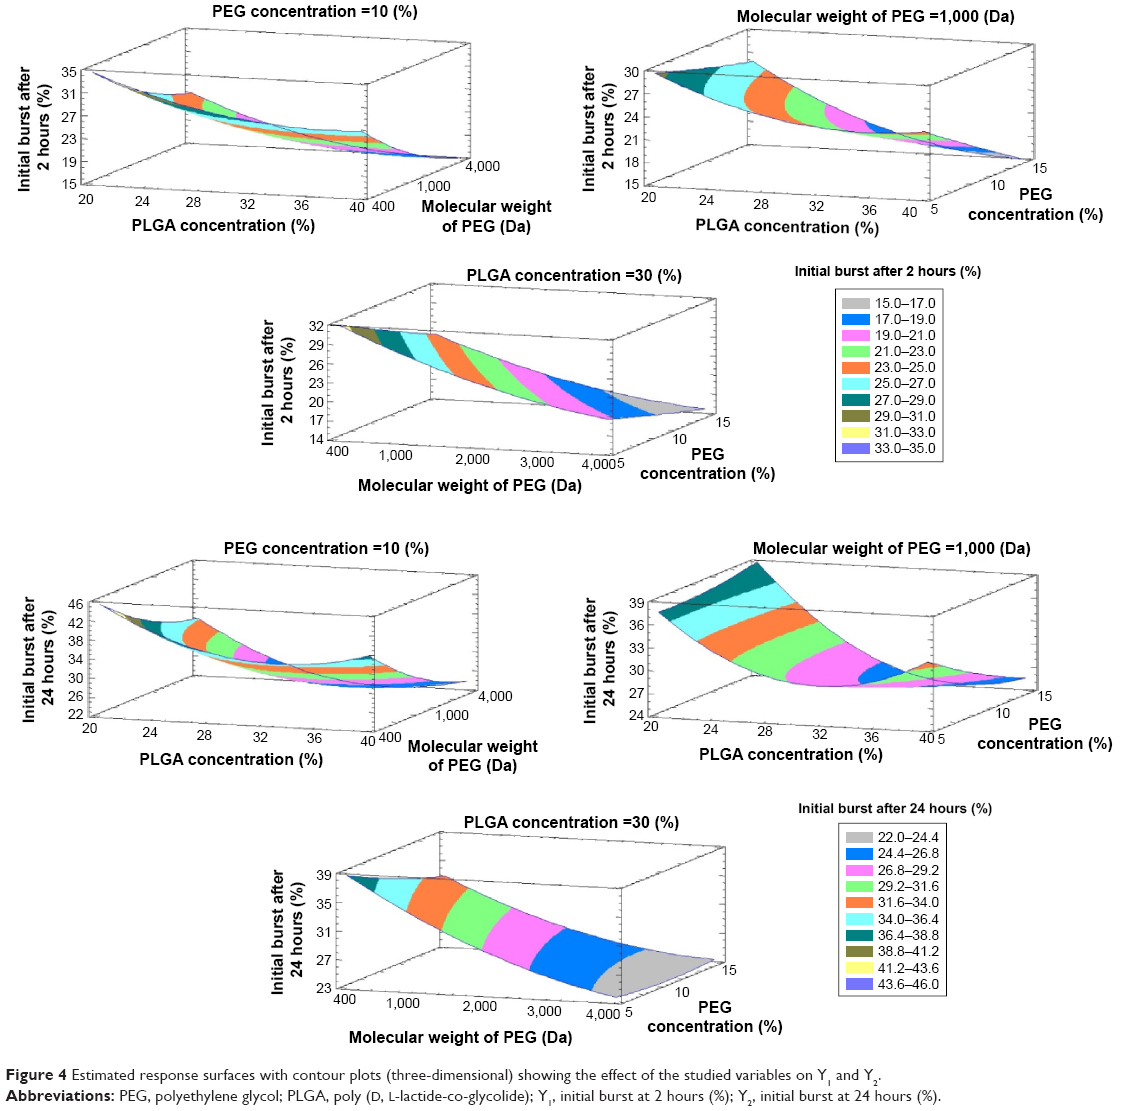 | Figure 4 Estimated response surfaces with contour plots (three-dimensional) showing the effect of the studied variables on Y1 and Y2. |
Optimization of the formulation variables
To develop an optimized ATR-ISG formulation with lower Y1 and Y2 values of 11.70% and 21.12% respectively, the multiple response optimization was performed using Statgraphics software. According to this optimization process, the predicted values of X1, X2, and X3 at maximum desirability of the responses that fulfill the requirement of optimized formulation were 36.10%, PEG 6000, and 15.69%, respectively. This optimized formulation was prepared and evaluated to verify the validity of the model. The predicted model values for Y1 and Y2 were 15.7% and 25.15%, respectively, while the observed values for Y1 and Y2 were 18.75% and 28.52%, respectively (Figure 2D), which seem to be very close to the predicted ones that indicate validity of the model.
Characterization of the optimized formulation
The PEG-free formulation was clear and of yellowish brown color. This color is mainly attributed to the color of PLGA polymer since the solvent used, NMP, is a colorless liquid. The pH was almost neutral and exhibited a value of 7.54 which is approximately the pH value of NMP of 7.7–8 as previously reported.24 Incorporation of PEG in the optimized formulation does not significantly affect the clarity, color, or even the pH. It was noticed that the viscosity of the prepared ISG formulation slightly increased after incorporation of the specified quantity of PEG. This was confirmed by measuring the syringeability which was slightly reduced and resulted in a slightly higher force required to push the syringe plunger. Syringeability of both formulations, optimized and PEG-free, was within the acceptable range as previously mentioned.24
SEM photomicrographs of the optimized ATR-ISG formulation and the corresponding PEG-free ISG formulation are illustrated in Figure 5. As is clear from the figure, PEG-free ISG formulation showed a cracked surface (Figure 5A) whereas the incorporation of PEG in the optimized formulation leads to disappearance of these cracks as indicated by the smooth surface (Figure 5B). This finding assumes successfulness of the technique and the benefit of incorporation of PEG in reducing the drug burst effect due to decrease in the glass transition temperature of PLGA with subsequent pronounced plasticizing action as previously illustrated.
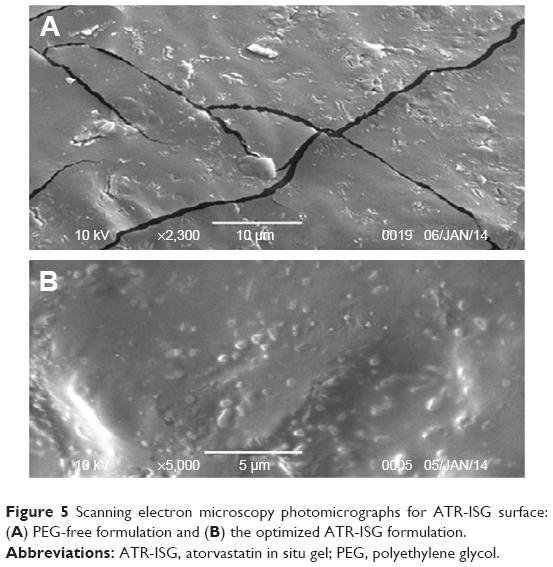 | Figure 5 Scanning electron microscopy photomicrographs for ATR-ISG surface: (A) PEG-free formulation and (B) the optimized ATR-ISG formulation. |
Kinetic analysis of in vitro release data
Kinetic analysis for the studied ISG formulations proposed by the central composite design and the optimized formulation revealed that all the studied ISG formulations were in concordance with the Higuchi diffusion model (data not shown). Previous studies indicate that Higuchi diffusion model is used to describe the drug dissolution and release from different types of modified release dosage forms such as transdermal and matrix type tablets.21,38,39 Such behavior may also be expected for the release kinetics of ATR ISG system during the release behavior of the drug from PLGA in phosphate-buffered saline (PBS) exhibited Fickian diffusion mechanism. The calculated n values were less than 0.5 indicating case I transport, Fickian diffusion mechanism.
In vivo and pharmacokinetic study in rabbits
The plasma concentration versus time curve is shown in Figure 6 and the pharmacokinetic parameters are listed in Table 4.
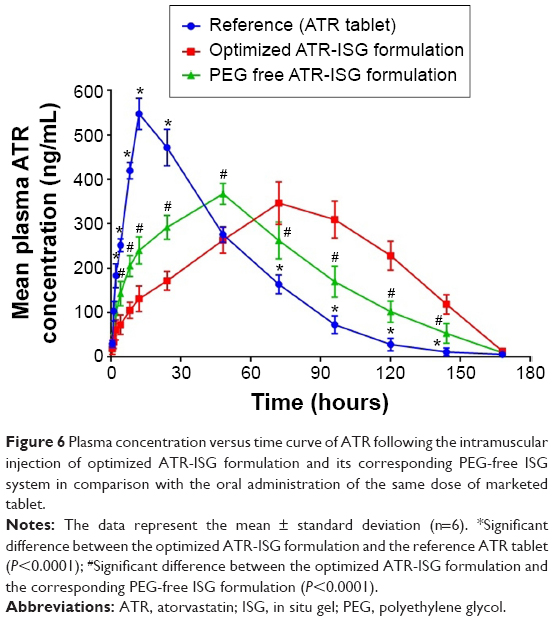 | Figure 6 Plasma concentration versus time curve of ATR following the intramuscular injection of optimized ATR-ISG formulation and its corresponding PEG-free ISG system in comparison with the oral administration of the same dose of marketed tablet. |
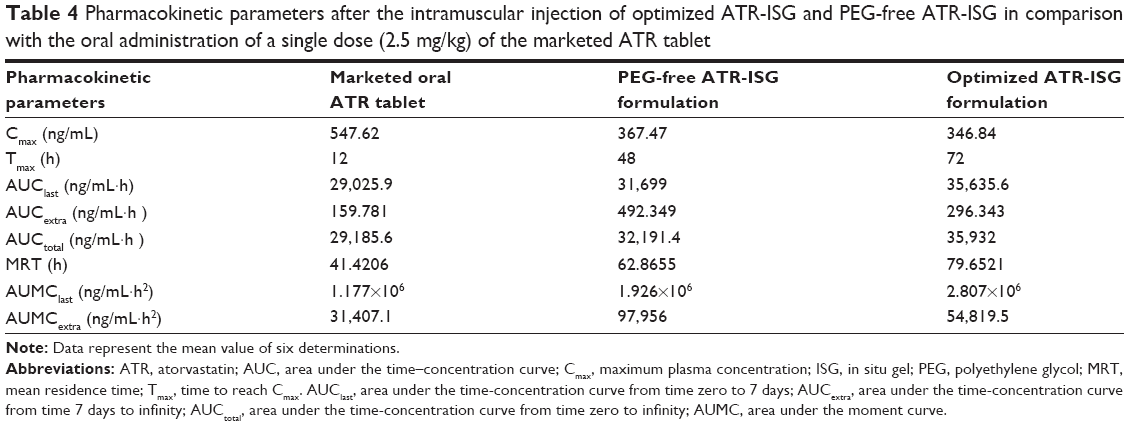 | Table 4 Pharmacokinetic parameters after the intramuscular injection of optimized ATR-ISG and PEG-free ATR-ISG in comparison with the oral administration of a single dose (2.5 mg/kg) of the marketed ATR tablet |
The maximum plasma concentration values reached 547.62, 367.47, and 346.84 ng/mL after oral administration of ATR tablet and intramuscular injection of both PEG-free ATR-ISG formulation and optimized ATR-ISG formulation, respectively. The tmax values were 12, 48, and 72 hours for oral ATR tablet, PEG-free ATR-ISG formulation, and the optimized ATR-ISG formulation, respectively, while the mean residence time values were 41.421, 62.866, and 79.652 hours for the same groups, respectively. The area under the time–concentration curve total for the optimized ATR-ISG formulation was found to be 35,932 ng/mL·hour, which was significantly (P<0.05) greater than that of the marketed ATR tablet (29,185.6 ng/mL·hour). These results are in good agreement with the observed values for tmax and mean residence time. From the pharmacokinetic data obtained, it was found that the optimized ATR-ISG formulation has lowered the initial burst, extended the tmax, increased the mean residence time of ATR in the plasma, and exhibited larger area under the curve. This marked difference is attributed to the incorporation of PEG in the optimized formulation and is in good agreement with the data obtained from the in vitro release study. The initial faster release from PEG-free ATR-ISG formulation was due to rapid dissipation of solvent, NMP, which contained the solubilized drug while the later phase of drug release was controlled by polymer erosion and degradation.
Conclusion
The central composite optimization design has been successfully implemented to develop an optimized depot injectable ATR-ISG formulation with low in vitro initial drug release. SEM and FTIR confirmed the impact of PEG incorporation in minimizing the initial burst of the drug from the system and prolongation of its effect. The pharmacokinetic parameters of the optimized ATR-ISG formulation were markedly different from that of the corresponding PEG-free one with significant reduction in the initial drug burst in comparison with the marketed tablet. ATR as an example of drugs that are used for the treatment of chronic diseases could be formulated as an ISG system using biodegradable PLGA polymer. The developed ISG formulation showed a promising release control, mean residence time prolongation, and improvement of the relative bioavailability, which are more favorable for long-term hypolipidemic drug therapy.
Disclosure
The authors report no conflicts of interest in this work.
References
Chenite A, Chaput C, Wang D, et al. Novel injectable neutral solutions of chitosan form biodegradable gels in situ. Biomaterials. 2000;21(21):2155–2161. | ||
Packhaeuser CB, Schnieders J, Oster CG, Kissel T. In situ forming parenteral drug delivery systems: an overview. Eur J Pharm Biopharm. 2004;58(2):445–455. | ||
Ahmed TA. Approaches to develop PLGA based in situ gelling system with low initial burst. Pak J Pharm Sci. 2015;28(2):657–665. | ||
Rodrigues S, Cordeiro C, Seijo B, Remuñán-López C, Grenha A. Hybrid nanosystems based on natural polymers as protein carriers for respiratory delivery: stability and toxicological evaluation. Carbohydr Polym. 2015;123:369–380. | ||
Kranz H, Brazeau GA, Napaporn J, Martin RL, Millard W, Bodmeier R. Myotoxicity studies of injectable biodegradable in-situ forming drug delivery systems. Int J Pharm. 2001;212(1):11–18. | ||
Ahmed TA, Ibrahim HM, Ibrahim F, et al. Development of biodegradable in situ implant and microparticle injectable formulations for sustained delivery of haloperidol. J Pharm Sci. 2012;101(10):3753–3762. | ||
Ahmed TA, Ibrahim HM, Samy AM, Kaseem A, Nutan MTH, Hussain MD. Biodegradable injectable in situ implants and microparticles for sustained release of Montelukast: in vitro release, pharmacokinetics, and stability. AAPS PharmSciTech. 2014;15(3): 772–780. | ||
Mallapragada SK, Peppas NA, Colombo P. Crystal dissolution-controlled release systems. II. Metronidazole release from semicrystalline poly(vinyl alcohol) systems. J Biomed Mater Res. 1997;36(1):125–130. | ||
Pekarek KJ, Jacob JS, Mathiowitz E. Double-walled polymer microspheres for controlled drug release. Nature. 1994;367(6460):258–260. | ||
Graham P, Brodbeck K, McHugh A. Phase inversion dynamics of PLGA solutions related to drug delivery. J Control Release. 1999;58(2):233–245. | ||
Xin C, Lihong W, Qiuyuan L, Hongzhuo L. Injectable long-term control-released in situ gels of hydrochloric thiothixene for the treatment of schizophrenia: preparation, in vitro and in vivo evaluation. Int J Pharm. 2014;469(1):23–30. | ||
Patel RB, Carlson AN, Solorio L, Exner AA. Characterization of formulation parameters affecting low molecular weight drug release from in situ forming drug delivery systems. J Biomed Mater Res A. 2010;94(2):476–484. | ||
Kempe S, Mäder K. In situ forming implants – an attractive formulation principle for parenteral depot formulations. J Control Release. 2012;161(2):668–679. | ||
Ibrahim HM, Ahmed TA, Hussain MD, et al. Development of meloxicam in situ implant formulation by quality by design principle. Drug Dev Ind Pharm. 2013;9045:1–8. | ||
Tan LP, Venkatraman SS, Sung PF, Wang XT. Effect of plasticization on heparin release from biodegradable matrices. Int J Pharm. 2004;283(1–2):89–96. | ||
Goldstein JL, Brown MS. Regulation of the mevalonate pathway. Nature. 1990;343(6257):425–430. | ||
Pekkanen J, Linn S, Heiss G, et al. Ten-year mortality from cardiovascular disease in relation to cholesterol level among men with and without preexisting cardiovascular disease. N Engl J Med. 1990;322(24):1700–1707. | ||
Lennernäs H. Clinical pharmacokinetics of atorvastatin. Clin Pharmacokinet. 2003;42(13):1141–1160. | ||
Wagner JG. Interpretation of percent dissolved-time plots derived from in vitro testing of conventional tablets and capsules. J Pharm Sci. 1969;58(10):1253–1257. | ||
Desai S, Singh P, Simonelli A, Higuchi W. Investigation of factors influencing release of solid drug dispersed in inert matrices III. Quantitative studies involving the polyethylene plastic matrix. J Pharm Sci. 1966;55(11):1230–1234. | ||
Higuchi T. Mechanism of sustained-action medication. Theoretical analysis of rate of release of solid drugs dispersed in solid matrices. J Pharm Sci. 1963;52(12):1145–1149. | ||
Korsmeyer R, Gurny R, Doelker E, Buri P, Peppas N. Mechanisms of potassium chloride release from compressed, hydrophilic, polymeric matrices: effect of entrapped air. J Pharm Sci. 1983;15(1):1189–1191. | ||
Ritger P, Peppas N. A simple equation for description of solute release. II. Fickian and anomalous release from swellable devices. J Control Release. 1987;5:37–42. | ||
Kurakula M, Ahmed TA. Co-delivery of atorvastatin nanocrystals in PLGA based in situ gel for anti-hyperlipidemic efficacy. Curr Drug Deliv. Epub 2015 Nov 8. | ||
Reagan-Shaw S, Nihal M, Ahmad N. Dose translation from animal to human studies revisited. FASEB J. 2008;22(3):659–661. | ||
Gajula R, Pilli NR, Ravi VB, et al. Simultaneous determination of atorvastatin and aspirin in human plasma by LC-MS/MS: its pharmacokinetic application. Sci Pharm. 2012;80(4):923–940. | ||
D’Souza SS, Faraj JA, DeLuca PP. A model-dependent approach to correlate accelerated with real-time release from biodegradable microspheres. AAPS PharmSciTech. 2005;6(4):E553–E564. | ||
Wang L, Venkatraman S, Kleiner L. Drug release from injectable depots: two different in vitro mechanisms. J Control Release. 2004;99(2):207–216. | ||
Shive M, Anderson J. Biodegradation and biocompatibility of PLA and PLGA microspheres. Adv Drug Deliv Rev. 1997;28(1):5–24. | ||
Jain RA. The manufacturing techniques of various drug loaded biodegradable poly(lactide-co-glycolide) (PLGA) devices. Biomaterials. 2000;21(23):2475–2490. | ||
Fredenberg S, Wahlgren M, Reslow M, Axelsson A. The mechanisms of drug release in poly(lactic-co-glycolic acid)-based drug delivery systems – a review. Int J Pharm. 2011;415(1–2):34–52. | ||
Tang Y, Singh J. Controlled delivery of aspirin: effect of aspirin on polymer degradation and in vitro release from PLGA based phase sensitive systems. Int J Pharm. 2008;357(1–2):119–125. | ||
Elias-Al-Mamun M, Khan HA, Dewan I, Jalil R-U. In vitro study on tamsulosin release kinetics from biodegradable PLGA in situ implants. Pak J Pharm Sci. 2009;22(4):360–367. | ||
Alimohammadi S, Salehi R, Amini N, Davaran S. Synthesis and physicochemical characterization of biodegradable PLGA-based magnetic nanoparticles containing amoxicilin. Bull Korean Chem Soc. 2012;33(10):3225–3232. | ||
Deadman CM, Kellaway IW, Yasin M, Dickinson PA, Murdan S. An investigation into the influence of drug lipophilicity on the in vivo absorption profiles from subcutaneous microspheres and in situ forming depots. J Control Release. 2007;122(1):79–85. | ||
Vintiloiu A, Lafleur M, Bastiat G, Leroux J-C. In situ-forming oleogel implant for rivastigmine delivery. Pharm Res. 2008;25(4):845–852. | ||
Luan X, Bodmeier R. Modification of the tri-phasic drug release pattern of leuprolide acetate-loaded poly(lactide-co-glycolide) microparticles. Eur J Pharm Biopharm. 2006;63(2):205–214. | ||
Grassi M, Grassi G. Mathematical modelling and controlled drug delivery: matrix systems. Curr Drug Deliv. 2005;2(1):97–116. | ||
Shoaib MH, Tazeen J, Merchant HA, Yousuf RI. Evaluation of drug release kinetics from ibuprofen matrix tablets using HPMC. Pak J Pharm Sci. 2006;19(2):119–124. |
 © 2016 The Author(s). This work is published and licensed by Dove Medical Press Limited. The full terms of this license are available at https://www.dovepress.com/terms.php and incorporate the Creative Commons Attribution - Non Commercial (unported, v3.0) License.
By accessing the work you hereby accept the Terms. Non-commercial uses of the work are permitted without any further permission from Dove Medical Press Limited, provided the work is properly attributed. For permission for commercial use of this work, please see paragraphs 4.2 and 5 of our Terms.
© 2016 The Author(s). This work is published and licensed by Dove Medical Press Limited. The full terms of this license are available at https://www.dovepress.com/terms.php and incorporate the Creative Commons Attribution - Non Commercial (unported, v3.0) License.
By accessing the work you hereby accept the Terms. Non-commercial uses of the work are permitted without any further permission from Dove Medical Press Limited, provided the work is properly attributed. For permission for commercial use of this work, please see paragraphs 4.2 and 5 of our Terms.