")
Back to Journals » Drug Design, Development and Therapy » Volume 12
Cyclooxygenase inhibitors potentiate receptor tyrosine kinase therapies in bladder cancer cells in vitro
Authors Bourn J , Cekanova M
Received 30 November 2017
Accepted for publication 8 March 2018
Published 13 June 2018 Volume 2018:12 Pages 1727—1742
DOI https://doi.org/10.2147/DDDT.S158518
Checked for plagiarism Yes
Review by Single anonymous peer review
Peer reviewer comments 2
Editor who approved publication: Professor Anastasios Lymperopoulos
Jennifer Bourn,1,2 Maria Cekanova1,2
1Department of Small Animal Clinical Sciences, College of Veterinary Medicine, The University of Tennessee, Knoxville, TN, USA; 2UT-ORNL Graduate School of Genome Science and Technology, The University of Tennessee, Knoxville, TN, USA
Purpose: Receptor tyrosine kinase inhibitors (RTKIs) are used as targeted therapies for patients diagnosed with cancer with highly expressed receptor tyrosine kinases (RTKs), including the platelet-derived growth factor receptor (PDGFR) and c-Kit receptor. Resistance to targeted therapies is partially due to the activation of alternative pro-survival signaling pathways, including cyclooxygenase (COX)-2. In this study, we validated the effects of two RTKIs, axitinib and AB1010, in combination with COX inhibitors on the V-akt murine thymoma oncogene homolog 1 (Akt) and COX-2 signaling pathways in bladder cancer cells.
Methods: The expression of several RTKs and their downstream signaling targets was analyzed by Western blot (WB) analysis in human and canine bladder transitional cell carcinoma (TCC) cell lines. The effects of RTKIs and COX inhibitors in bladder TCC cells were assessed by MTS for cell viability, by Caspase-3/7 and Annexin V assay for apoptosis, by WB analysis for detection of COX-2 and Akt signaling pathways, and by enzyme-linked immunosorbent assay for detection of prostaglandin E2 (PGE2) levels.
Results: All tested TCC cells expressed the c-Kit and PDGFRα receptors, except human 5637 cells that had low RTKs expression. In addition, all tested cells expressed COX-1, COX-2, Akt, extracellular signal regulated kinases 1/2, and nuclear factor kappa-light-chain-enhance of activated B cells proteins, except human UM-UC-3 cells, where no COX-2 expression was detected by WB analysis. Both RTKIs inhibited cell viability and increased apoptosis in a dose-dependent manner in tested bladder TCC cells, which positively correlated with their expression levels of the PDGFRα and c-Kit receptors. RTKIs increased the expression of COX-2 in h-5637 and K9TCC#1Lillie cells. Co-treatment of indomethacin inhibited AB1010-induced COX-2 expression leading to an additive effect in inhibition of cell viability and PGE2 production in tested TCC cells.
Conclusion: Co-treatment of RTKIs with indomethacin inhibited cell viability and AB1010-induced COX-2 expression resulting in decreased PGE2 production in tested TCC cells. Thus, COX inhibition may further potentiate RTKIs therapies in bladder cancer.
Keywords: transitional cell carcinoma, axitinib, masitinib, cyclooxygenase-2, prostaglandin E2, indomethacin
Introduction
Bladder cancer is the sixth most common cancer in USA and accounts for 4.6% of all new cancer cases.1 An estimated 79,000 new patients will be diagnosed with bladder cancer, and an estimated 17,000 deaths will occur as a result of the disease each year.1 Bladder cancer incidence is four times higher in men than in women. The most common type of bladder cancer is transitional cell carcinoma (TCC), which accounts for over 90% of all bladder cancer cases in USA.1
Early detection and development of novel targeted therapies with higher efficacy and fewer adverse events as compared to commonly used chemotherapy treatments are currently a primary focus in research for bladder cancer treatment.2 Receptor tyrosine kinase inhibitors (RTKIs) are used for patients diagnosed with bladder cancer that have high expression of receptor tyrosine kinases (RTKs), including the platelet-derived growth factor receptor (PDGFR), c-Kit receptor, epidermal growth factor receptor (EGFR),3,4 or vascular endothelial growth factor receptor (VEGFR).5 Currently used RTKIs for the treatment of bladder cancer are monoclonal antibodies, including cetuximab4,6 and bevacizumab,7,8 and small molecules, including gefitinib,9 sunitinib,10 and axitinib.11 Axitinib (also known as AG013736 or Inlyta®; Pfizer, New York, NY, USA) is a potent RTKI (VEGFR half-maximal inhibitory concentration [IC50] =0.1–0.3 nM, c-Kit IC50 =1.7 nM, and PDGFR IC50 =1.6 nM) therapy option for patients diagnosed with metastatic clear cell renal cell carcinoma (RCC).12 Axitinib significantly increases progression-free survival rates in patients with RCC when compared to those treated with sorafenib.13 AB1010 (known also as Masitinib®, Masivet®, Kinavet®; AB Science, Paris, France) is a novel RTKI that targets the c-Kit (IC50 =200 nM) and PDGFRα/β (IC50 =540–800 nM) receptors.14 Previous studies have demonstrated the effectiveness of AB1010 as a viable treatment option for canine mast cell tumors by reducing cell viability and degranulation of mast cells without cytotoxic effects.15,16 AB1010 can act as a chemo-sensitizer by increasing the sensitivity of canine bladder, breast, and osteosarcoma cancer cells to chemotherapy agents in vitro.17–19 Similar favorable results have also been demonstrated with AB1010 in combination with gemcitabine in human pancreatic cancer cells in vitro.20 Preliminary results from a preclinical trial with AB1010 for patients diagnosed with imatinib-resistant gastrointestinal stromal tumors (GISTs) indicate that AB1010 is well tolerated and increases overall patient survival.21
Cyclooxygenase (COX)-2 is highly expressed in bladder cancer and is one of the key proteins responsible for angiogenesis22,23 and tumorigenesis.24,25 Increased prostaglandins production positively correlates with COX-2 expression levels and progression of cancer.26–29 Nonsteroidal anti-inflammatory drugs (NSAIDs), inhibitors for COX enzymes, are commonly used for the prevention and treatment of cancers.30–34 One of the common side effects of long-term NSAIDs usage is gastrointestinal toxicity.35,36 The development of COX-2 selective inhibitors (COXIBs), such as celecoxib,37,38 effectively reduces the side effects in patients.39–43 Several studies have shown that RTKIs increase COX-2 expression, which can possibly lead to therapy resistance.39,44,45 The cross-talk between the RTK and the COX-2 signaling pathways plays a key role in tumorigenesis.46,47
In this study, we evaluated the efficacy of axitinib and AB1010 (RTKIs) in co-treatment with indomethacin (NSAID) in bladder TCC cells in vitro. We have validated the antiproliferative and proapoptotic effects of axitinib and AB1010 alone and in combination with indomethacin through regulation of COX-2 activity in bladder TCC cells in vitro.
Materials and methods
Reagents and antibodies
AB1010 (Masitinib®) was obtained from AB Science; axitinib was purchased from Sigma-Aldrich (St Louis, MO, USA) and indomethacin was obtained from the laboratory of Dr Lawrence Marnett (Vanderbilt University, Nashville, TN, USA). The antibodies for COX-2 (C-20), COX-1 (H-62), PDGFRα (C-20), phosphorylated PDGFRα (p-PDGFRα) (Tyr720), phosphorylated extracellular signal regulated kinases 1/2 (p-ERK1/2) (E-4), phosphorylated V-akt murine thymoma oncogene homolog 1 (p-Akt) (Ser473), c-Kit (961-976), p-c-Kit (Tyr721), Akt1/2/3 (H136), ERK1/2 (K-23), caspase-3 (H-277), actin, and donkey anti-goat secondary antibodies were purchased from Santa Cruz Biotechnology Inc (Dallas, TX, USA); antibody for p65 (nuclear factor kappa-light-chain-enhance of activated B cells [NF-κB]) was purchased from BD Biosciences (San Jose, CA, USA); poly (ADP-ribose) polymerase (PARP) (recognize total and cleaved PARP [cPARP]), cleaved caspase-3 (cCaspase-3) (D175), secondary anti-rabbit and anti-mouse antibodies were obtained from Cell Signaling Technology (Danvers, MA, USA). All other chemicals and reagents were purchased from Thermo Fisher Scientific (Waltham, MA, USA), unless otherwise specified.
Cell lines
Human bladder TCC cell lines h-UM-UC-3, h-T24, and h-5637 were purchased from American Type Culture Collection (ATCC, Manassas, VA, USA). Cell lines were authenticated via short tandem repeat DNA profiling by Genetica DNA Laboratories (Burlington, NC, USA). h-T24 cells were grown in McCoy’s media (GE Healthcare Bio-Sciences, Pittsburgh, PA, USA), h-UM-UC-3 cells were grown in minimum essential media (GE Healthcare Bio-Sciences), and h-5637 cells were grown in RPMI-1640 media (GE Healthcare Bio-Sciences) supplemented with 10% fetal bovine serum, 100 IU penicillin, and 100 μg/mL streptomycin. Canine TCC (K9TCC) cell lines, K9TCC#1Lillie and K9TCC#5Lilly, were established and characterized in the laboratory of Dr Cekanova as described previously in detail.40,48,49 K9TCC#1Lillie and K9TCC#5Lilly were grown in complete RPMI-1640 media supplemented with 10% fetal bovine serum, 100 IU penicillin, and 100 μg/mL streptomycin. Cells were grown at 37°C and 5% CO2.
Proliferation (MTS) assay
Cells were plated in 96-well plates at a concentration of 5×10³ cells/well in complete media. After 24 hours incubation, cells were treated with AB1010, axitinib, indomethacin, or celecoxib (data not shown) in dose-dependent manner alone or in combinations (as specifically shown in the “Results” section) in complete media for an additional 48 hours. Vehicle, dimethyl sulfoxide (DMSO), was used as a control. After treatment, cell viability was measured using MTS CellTiter 96® Aqueous One Solution Cell Proliferation Assay (Promega Corporation, Fitchburg, WI, USA) according to the manufacturer’s protocol. Briefly, 20 μL of the MTS reagent was added to each well and incubated with cells at 37°C for 1 hour. Absorbance was measured at 490 nM using an FLx800 plate reader (Bio-Tek Instruments, Winooski, VT, USA). The data were shown as mean ± SE of four replicates of three independent experiments and normalized to the DMSO controls.
Annexin V-fluorescein isothiocyanate (FITC) detection of apoptosis by flow cytometry
h-5637 and K9TCC#1Lillie cells were plated in 6-cm tissue culture dishes at a density of 1×10⁶ cells/dish in complete media. After 24 hours of cell seeding, the cells were treated with DMSO (vehicle), axitinib (5 μM), and AB1010 (5 μM). After 24-hour treatment, both the media and attached cells were collected for analysis. Cells were stained with Annexin V-FITC and propidium iodide according to the TACS® Annexin V kit protocol (Trevigen, Inc, Gaithersburg, MD, USA). The apoptotic cells were identified using a MACSQuant 10 Flow Analyzer (Miltenyi Biotec Inc, Bergisch Gladbach, Germany).
Caspase-3/7 assay
Cells were plated in 10-cm tissue culture dishes at a density of 2×10⁶ cells/dish in complete media. Twenty-four hours after seeding, cells were treated with AB1010 or axitinib (1, 5, 10 μM) for an additional 24 hours in media without serum. After treatment, cell lysates were harvested using RIPA buffer supplemented with protease and phosphatase inhibitors cocktail (1 mM PMSF; 1 μg/mL aprotinin; 1 μg/mL leupeptin; 0.1 mM Na3VO4; 10 mM NaF). Protein concentrations were measured using Pierce® bicinchoninic acid (BCA) protein assay (Thermo Fisher Scientific). Twenty-five micrograms of proteins were used for the detection of caspases 3/7 activities following the Caspase Glo® 3/7 Substrate manufacturer’s protocol (Promega Corporation). After 1-hour incubation with reagents, the luminescence signals were measured using an FLx800 plate reader (Bio-Tek Instruments). The data were shown as mean ± SE of two replicates of three independent experiments and normalized to the DMSO-treated controls.
Western blotting
Human and canine TCC cells were plated in 10-cm tissue culture dishes at a density of 2×10⁶ cells/dish in complete media and allowed to attach for 24 hours. The cells were then treated with or without serum, with drugs in a dose-dependent manner alone, or in combinations for 24 hours as mentioned in figure legends. After treatments, the cells were lysed in ice-cold RIPA buffer supplemented with protease and phosphatase inhibitors cocktail and kept at −80°C until Western blot (WB) analyses were performed. Protein concentrations were measured using the BCA protein assay. Equal amounts of proteins were loaded onto sodium dodecyl sulfate polyacrylamide gel electrophoresis gels and transferred to a nitrocellulose membrane. After blocking, the membranes were incubated with primary antibodies overnight at 4°C. Next day, the membranes were incubated with horseradish peroxidase-conjugated secondary antibodies (1:3,000 dilution) for 45 minutes at room temperature, and immunoreactive bands were visualized using the chemiluminescence system using enhanced chemiluminescence reagents. The images were captured using the BioSpectrum® 815 Imaging System (UVP, Upland, CA, USA).
Prostaglandin E2 (PGE2) enzyme-linked immunosorbent (ELISA) assay
h-5637 and K9TCC#1Lillie cells were plated in 10-cm tissue culture dishes at a density of 2×10⁶ cells/dish in complete media for 24 hours followed by treatment with 5 μM AB1010 and 50 μM indomethacin alone or in combination for an additional 24 hours in serum-free media. After treatment, the media were collected and dead cells and debris were removed by spinning down the media in pre-chilled tubes. Collected media were stored at −80°C until the PGE2 analysis was performed. One hundred microliters of media were used for PGE2 analysis following the manufacturer’s protocol for the PGE2 EIA kit (Enzo Life Sciences, Plymouth Meeting, PA, USA). PGE2 concentration was measured at an optical density of 405 nm with correction between 570 and 590 nm using an FLx800 plate reader (Bio-Tek Instruments). A standard curve was generated by using the Gen5™ 4 parameter logistic curve fitting software (Bio-Tek Instruments, Winooski, VT, USA) based on the PGE2 standards and the treated sample concentrations were calculated accordingly. The data are shown as mean ± SE of three replicates of three independent experiments and normalized to the control groups (DMSO, vehicle-treated groups).
Statistical analysis
Statistical analyses were conducted using the Student’s t-test to establish significant differences among treatment groups. Results were considered statistically significant at *p<0.05, **p<0.01, and ***p<0.001 to control, DMSO group. Student’s t-tests were performed to compare co-treatment AB1010 + indomethacin to AB1010 treatment groups and results were considered statistically significant at #p<0.05. Student’s t-tests were performed to also compare co-treatment AB1010 + indomethacin to indomethacin treatment groups and results were considered statistically significant at ‡p<0.05, ‡‡p<0.01, and ‡‡‡p<0.001.
Results
Expression profile of RTK and COX signaling pathway proteins in tested TCC cells
The expression profiles of RTKs, COXs, and their downstream targeted proteins were tested in h-UM-UC-3, h-T24, and h-5637 and canine (K9TCC#1Lillie and K9TCC#5Lilly) TCC cells by WB analysis as shown in Figure 1. While h-UM-UC-3 cells expressed relatively high levels of c-Kit and PDGFRα receptors, h-T24 cells had only low and h-5637 had no detectable protein levels of PDGFRα and c-Kit receptors. K9TCC cell lines, K9TCC#5Lilly and K9TCC#1Lillie, had relatively higher expression of PDGFRα and c-Kit receptors as compared to the levels detected in h-TCC cell lines. All tested TCC cells had high levels of p-ERK1/2 protein. In addition, h-5637 cells had the lowest levels of p-ERK1/2 expression, but the highest expression of p-Akt protein as compared to the other h-TCC cells. Both tested canine TCC cell lines had higher p-ERK1/2 expression, but no detectable p-Akt expression, when compared to h-TCC cell lines. h-UM-UC-3 and T24 cells had very low detectable COX-2 expression, whereas h-5673, K9TCC#1Lillie, and K9TCC#5Lilly cells had high COX-2 protein expression. All five tested TCC cell lines had high expression levels of COX-1 and NF-κB proteins.
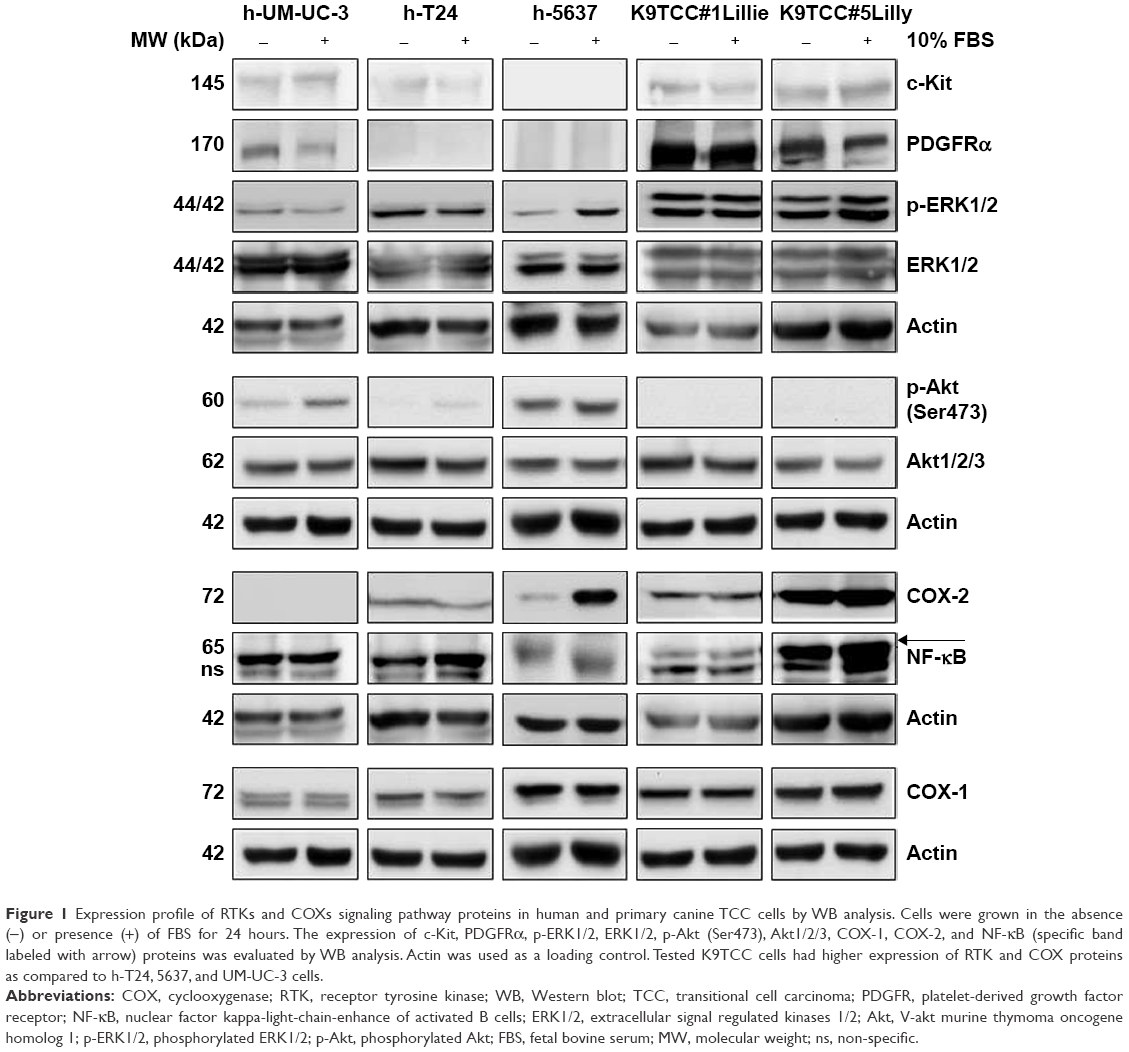 | Figure 1 Expression profile of RTKs and COXs signaling pathway proteins in human and primary canine TCC cells by WB analysis. Cells were grown in the absence (−) or presence (+) of FBS for 24 hours. The expression of c-Kit, PDGFRα, p-ERK1/2, ERK1/2, p-Akt (Ser473), Akt1/2/3, COX-1, COX-2, and NF-κB (specific band labeled with arrow) proteins was evaluated by WB analysis. Actin was used as a loading control. Tested K9TCC cells had higher expression of RTK and COX proteins as compared to h-T24, 5637, and UM-UC-3 cells. |
Axitinib and AB1010 inhibited cell proliferation and induced apoptosis in TCC cells
Both the tested RTKIs, axitinib and AB1010, significantly reduced cell viability in a dose-dependent manner in all tested human and canine TCC cell lines as is shown in Figure 2. To further analyze the possible mechanism of axitinib and AB1010 in tested cells, we selected h-5637 and K9TCC#1Lillie cells with the lowest and with the highest basal expression levels of PDGFRα and c-Kit receptors, respectively. The inhibition of cell viability in TCC cells by AB1010 treatment positively correlated with the expression levels of PDGFRα and c-Kit receptors in tested cells. AB1010 inhibited phosphorylation of c-Kit receptor in a dose-dependent manner causing the inhibition of cell viability in K9TCC#1Lillie cells (Figure S1). No expression of p-PDGFRα was detected in either tested cell line after RTKIs treatment. Total PDGFRα protein expression was detected in K9TCC#1Lillie, but not in h-5637 cells (Figure S1).
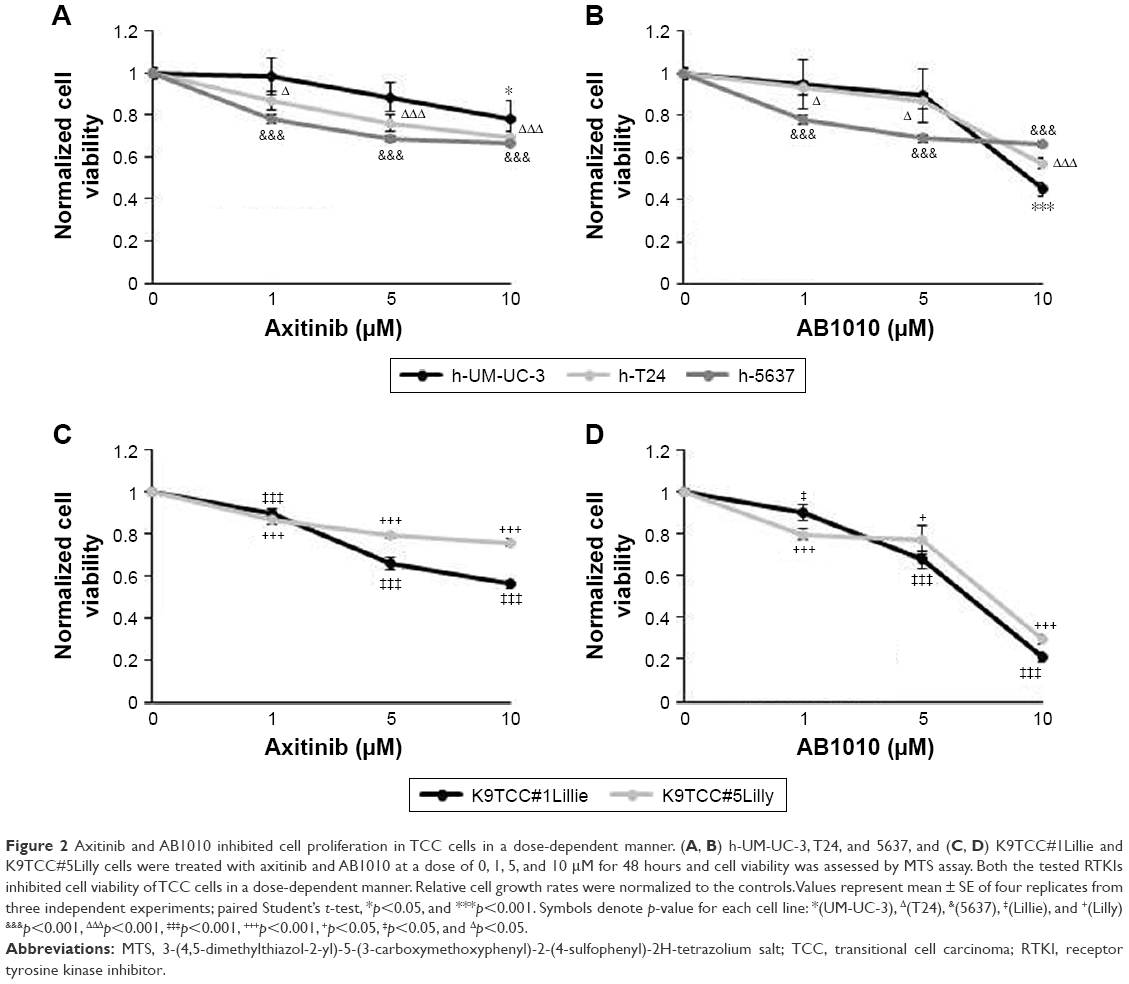 | Figure 2 Axitinib and AB1010 inhibited cell proliferation in TCC cells in a dose-dependent manner. (A, B) h-UM-UC-3, T24, and 5637, and (C, D) K9TCC#1Lillie and K9TCC#5Lilly cells were treated with axitinib and AB1010 at a dose of 0, 1, 5, and 10 μM for 48 hours and cell viability was assessed by MTS assay. Both the tested RTKIs inhibited cell viability of TCC cells in a dose-dependent manner. Relative cell growth rates were normalized to the controls. Values represent mean ± SE of four replicates from three independent experiments; paired Student’s t-test, *p<0.05, and ***p<0.001. Symbols denote p-value for each cell line: *(UM-UC-3), Δ(T24), &(5637), ‡(Lillie), and +(Lilly) &p<0.001, ΔΔΔp<0.001, ‡‡‡p<0.001, +++p<0.001, +p<0.05, ‡p<0.05, and Δp<0.05. |
The effects of axitinib and AB1010 on cell apoptosis were evaluated using Annexin V-FITC staining by flow cytometry analysis and the caspase-3/7 activities assay. Doxorubicin (1 μM) treatment was used as a positive control for the detection of apoptosis (data not shown). After 24 hours treatment, both 5 μM axitinib and 5 μM AB1010 significantly increased apoptosis in h-5637 cells with a 3- and 1.5-fold increase, respectively, when compared to the control (DMSO) as is shown in Figure 3A. Axitinib treatment in h-5637 cells increased the number of apoptotic cells by 2-fold as compared to AB1010 treatment. In K9TCC#1Lillie cells, both 5 μM axitinib and 5 μM AB1010 significantly increased apoptosis by 1.8-fold when compared to the control (DMSO) group as shown in Figure 3B. Axitinib, but not AB1010, significantly increased caspase-3/7 activity in h-5637 cells after 24-hour treatment as shown in Figure 4A. Neither axitinib nor AB1010 statistically significantly increased the caspase-3/7 activity in K9TCC#1Lillie cells, as shown in Figure 4A. The apoptosis induced by axitinib was also confirmed by upregulation of cCaspase-3 and cPARP in tested h-5637 cells tested by WB analysis (Figure 4B and C). There were no detectable levels of cCaspase-3 expression in h-5637 cells by AB1010 treatment (Figure 4B and C). Axitinib (10 μM) and AB1010 (10 μM) treatments increased cCaspase-3 expression when compared to the control in the K9TCC#1Lillie cells by 3- and 18-fold, respectively (Figure 4B and C). Axitinib and AB1010 treatments increased cPARP expression by ~4- and 2-fold, respectively, when compared to control in h-5637 cells as shown by densitometry analysis of WB data in Figure 4B and C. However, cleavage of PARP was not detected after treatment with AB1010 or axitinib in K9TCC#1Lillie cells (Figure 4B).
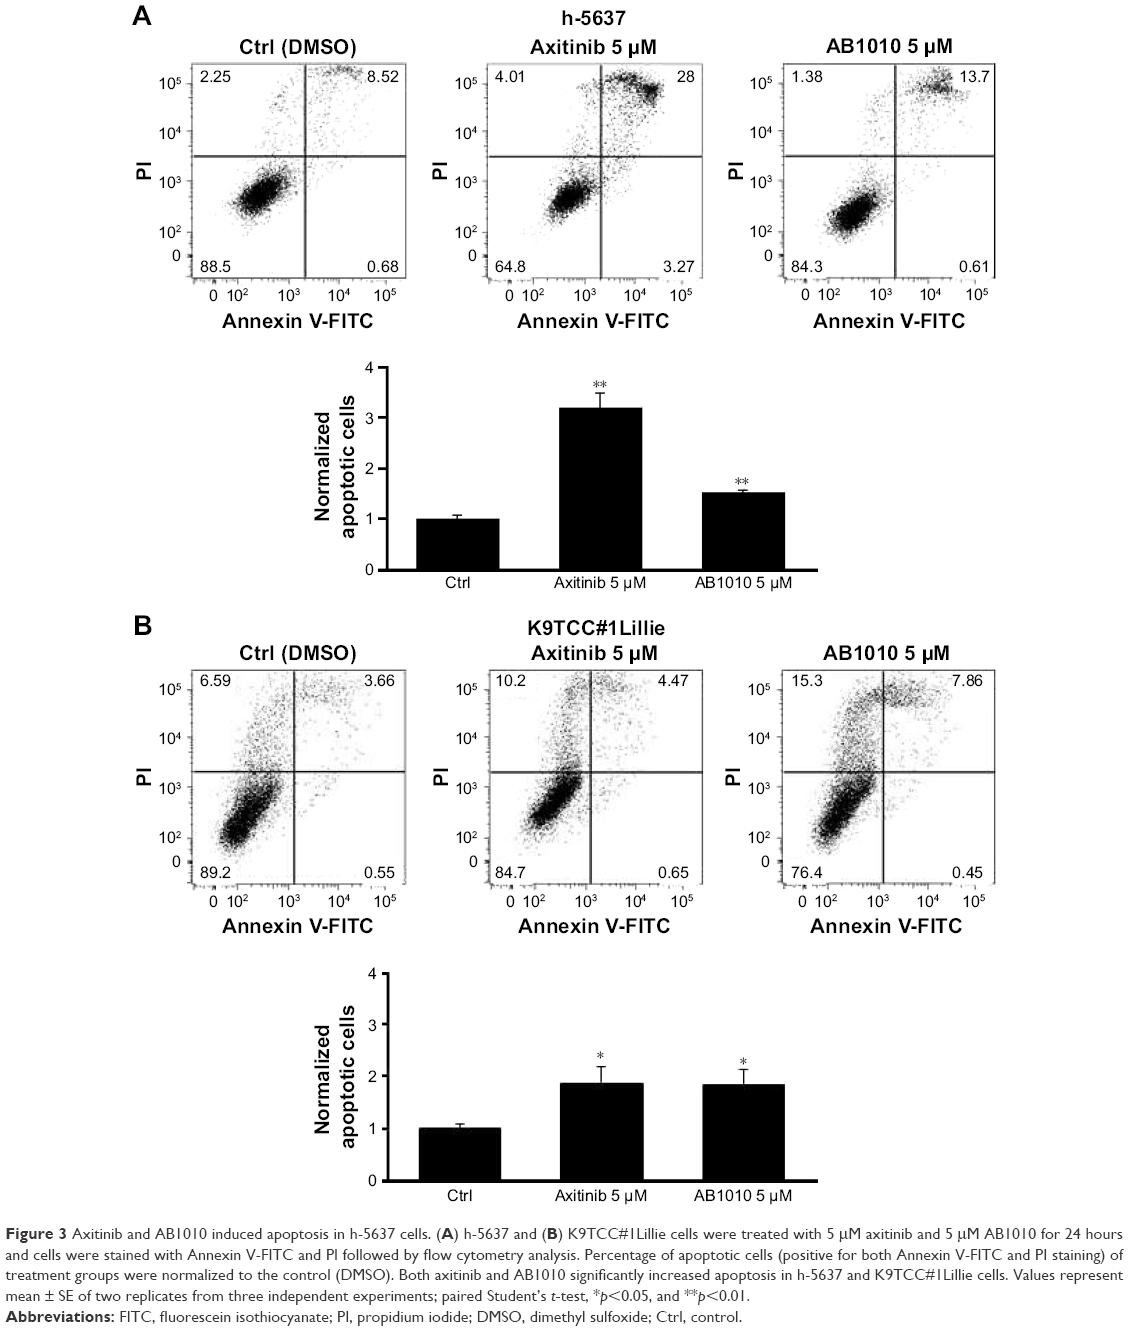 | Figure 3 Axitinib and AB1010 induced apoptosis in h-5637 cells. (A) h-5637 and (B) K9TCC#1Lillie cells were treated with 5 μM axitinib and 5 μM AB1010 for 24 hours and cells were stained with Annexin V-FITC and PI followed by flow cytometry analysis. Percentage of apoptotic cells (positive for both Annexin V-FITC and PI staining) of treatment groups were normalized to the control (DMSO). Both axitinib and AB1010 significantly increased apoptosis in h-5637 and K9TCC#1Lillie cells. Values represent mean ± SE of two replicates from three independent experiments; paired Student’s t-test, *p<0.05, and **p<0.01. |
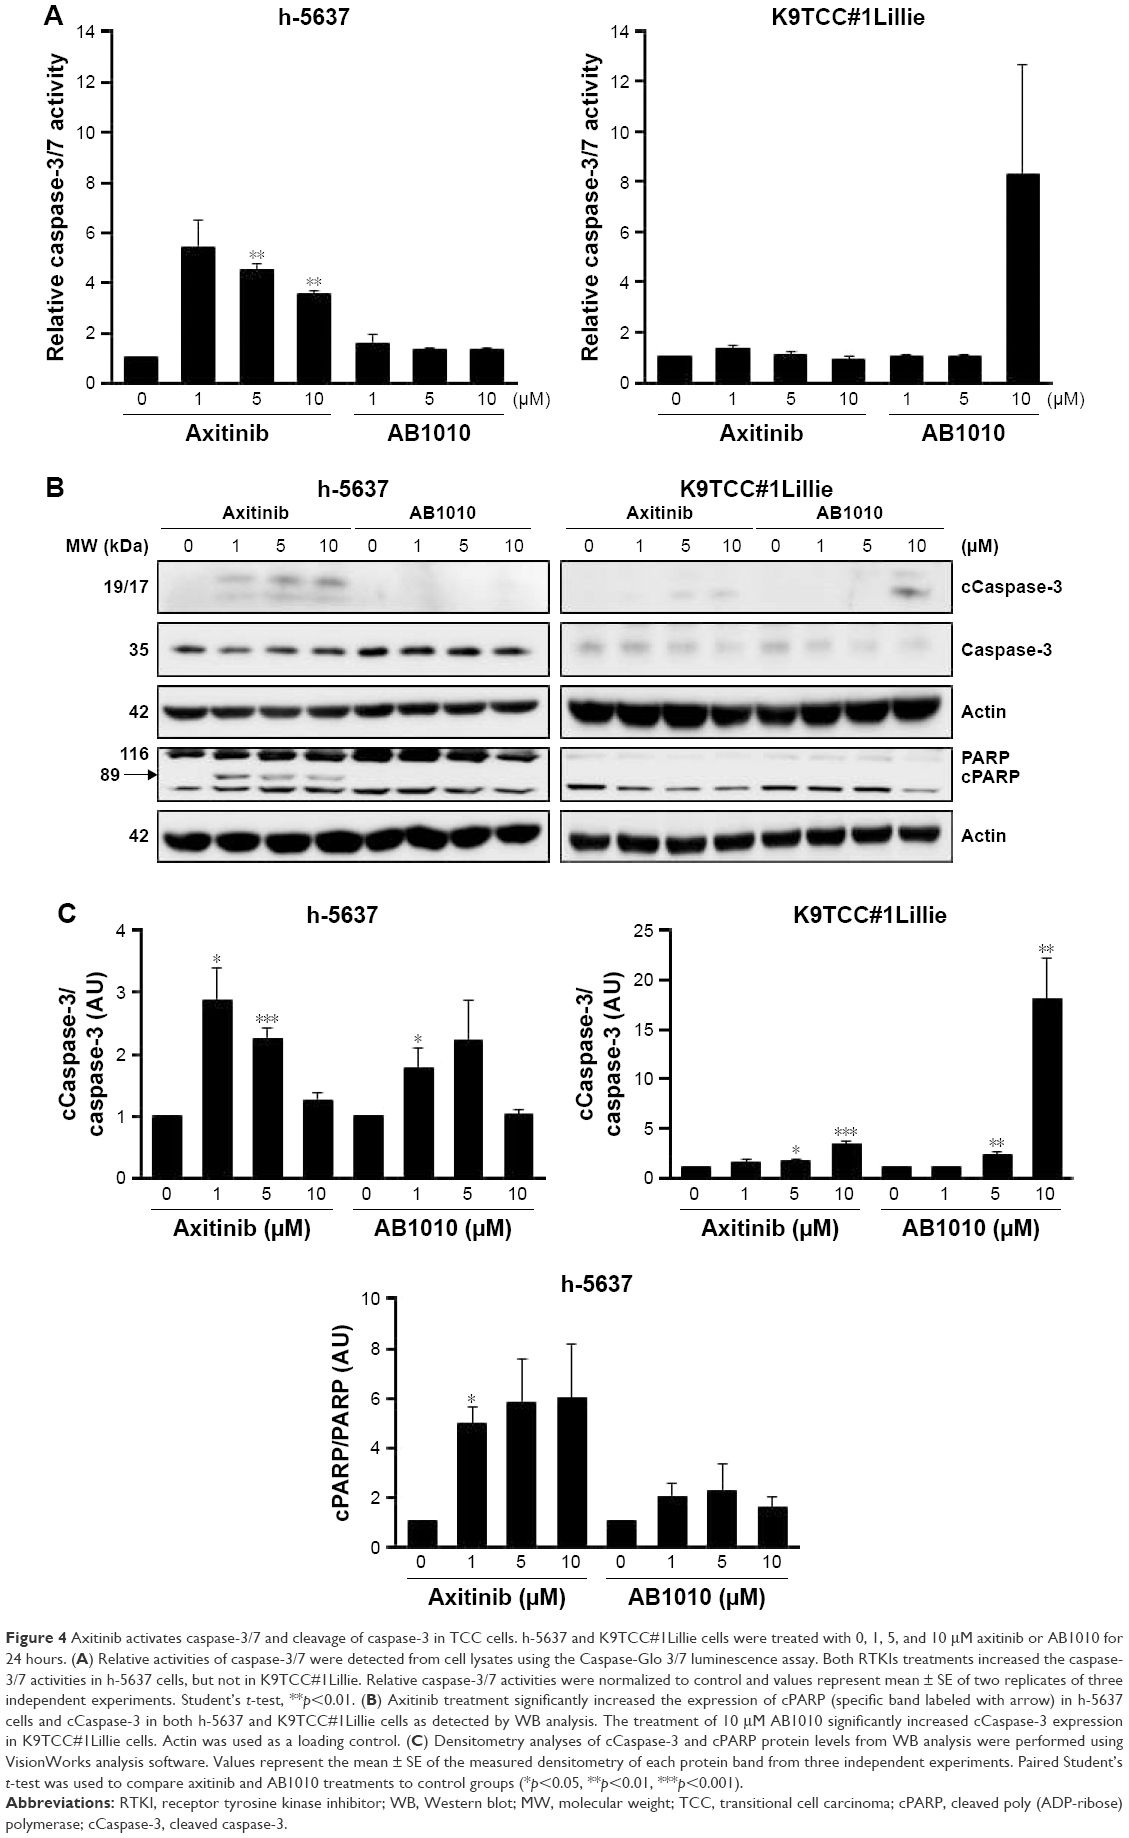 | Figure 4 Axitinib activates caspase-3/7 and cleavage of caspase-3 in TCC cells. h-5637 and K9TCC#1Lillie cells were treated with 0, 1, 5, and 10 μM axitinib or AB1010 for 24 hours. (A) Relative activities of caspase-3/7 were detected from cell lysates using the Caspase-Glo 3/7 luminescence assay. Both RTKIs treatments increased the caspase-3/7 activities in h-5637 cells, but not in K9TCC#1Lillie. Relative caspase-3/7 activities were normalized to control and values represent mean ± SE of two replicates of three independent experiments. Student’s t-test, **p<0.01. (B) Axitinib treatment significantly increased the expression of cPARP (specific band labeled with arrow) in h-5637 cells and cCaspase-3 in both h-5637 and K9TCC#1Lillie cells as detected by WB analysis. The treatment of 10 μM AB1010 significantly increased cCaspase-3 expression in K9TCC#1Lillie cells. Actin was used as a loading control. (C) Densitometry analyses of cCaspase-3 and cPARP protein levels from WB analysis were performed using VisionWorks analysis software. Values represent the mean ± SE of the measured densitometry of each protein band from three independent experiments. Paired Student’s t-test was used to compare axitinib and AB1010 treatments to control groups (*p<0.05, **p<0.01, ***p<0.001). |
Axitinib and AB1010 increased COX-2 expression in TCC cells
Both RTKIs, axitinib and AB1010, increased expression of COX-2 in h-5637 and K9TCC#1Lillie cells in a dose-dependent manner (Figure 5A). Based on the densitometry analysis of COX-2 protein expression in h-5637 cells, a 2-fold increase in COX-2 expression was detected by both axitinib and AB1010 treatments when compared to the control. AB1010 treatment increased COX-2 protein expression in the K9TCC#1Lillie cells by 4-fold when compared to the control as shown in Figure 5B. RTKI treatments had no effects on NF-κB expression in h-5637 cells (Figure 5A). However, AB1010 treatment increased NF-κB expression in a dose-dependent manner in the K9TCC#1Lillie cells. Axitinib and AB1010 significantly reduced the phosphorylation of Akt in h-5637 cells in a dose-dependent manner as shown in Figure 5A. In contrast, axitinib, but not AB1010, increased the phosphorylation of Akt in K9TCC#1Lillie cells (Figure 5A and B). Neither axitinib nor AB1010 treatments had effects on the phosphorylation of ERK1/2 in h-5637 or K9TCC#1Lillie cells (data not shown).
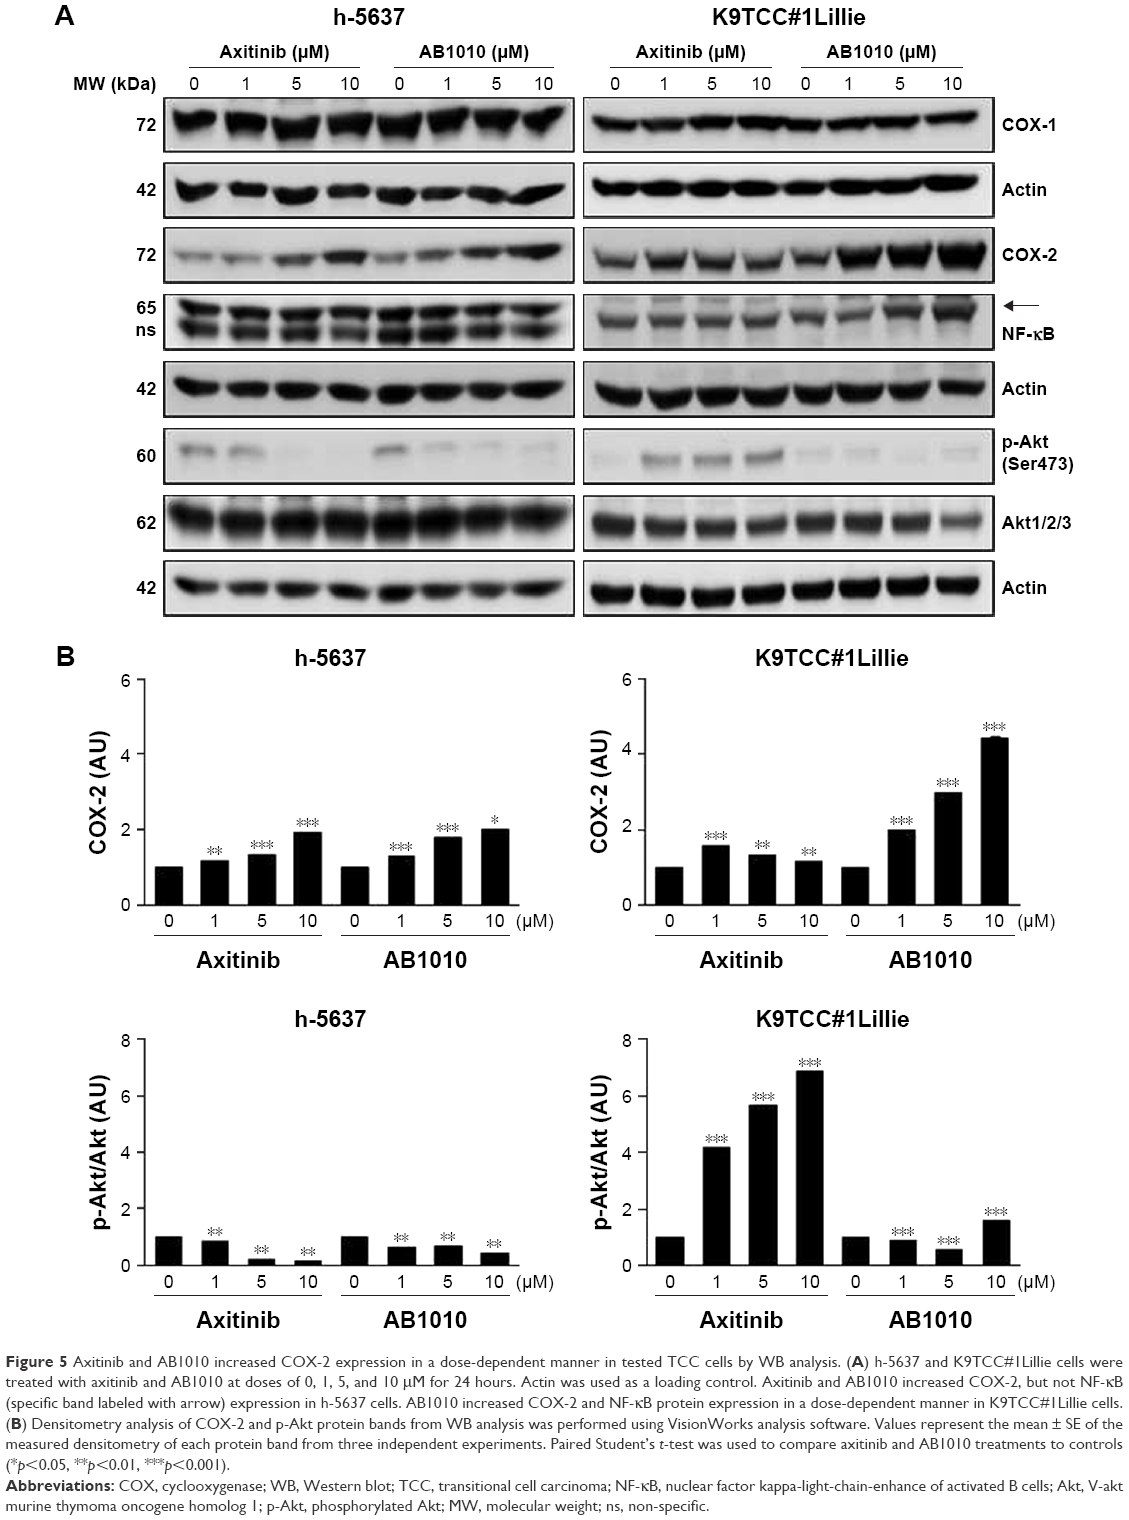 | Figure 5 Axitinib and AB1010 increased COX-2 expression in a dose-dependent manner in tested TCC cells by WB analysis. (A) h-5637 and K9TCC#1Lillie cells were treated with axitinib and AB1010 at doses of 0, 1, 5, and 10 μM for 24 hours. Actin was used as a loading control. Axitinib and AB1010 increased COX-2, but not NF-κB (specific band labeled with arrow) expression in h-5637 cells. AB1010 increased COX-2 and NF-κB protein expression in a dose-dependent manner in K9TCC#1Lillie cells. (B) Densitometry analysis of COX-2 and p-Akt protein bands from WB analysis was performed using VisionWorks analysis software. Values represent the mean ± SE of the measured densitometry of each protein band from three independent experiments. Paired Student’s t-test was used to compare axitinib and AB1010 treatments to controls (*p<0.05, **p<0.01, ***p<0.001). |
NSAIDs inhibited AB1010-induced COX-2 expression in TCC cells in vitro
To test our hypothesis that inhibition of AB1010-induced COX-2 expression might lead to more effective inhibition of cell viability of bladder cancer cells by RTKIs, TCC cells were co-treated with RTKIs and indomethacin (nonselective NSAID). Co-treatment of 5 μM AB1010 with 5, 10, 50, or 100 μM indomethacin was more effective in inhibiting cell viability of K9TCC#1Lillie as compared to either treatment alone as is shown in Figures 6A and S2. Co-treatment of AB1010 and indomethacin was more effective in the inhibition of cell viability of K9TCC#1Lillie cells as compared to h-5637 cells (Figure 6A) due to higher expression of the target receptors, c-Kit and PDGFR in K9TCC#1Lillie cells (Figure 1). In addition, indomethacin inhibited AB1010-induced COX-2 expression in K9TCC#1Lillie cells as shown in Figure 6B and C. Co-treatment of AB1010 with indomethacin did not affect the expression of NF-κB in either tested TCC cells (Figure 6B), reduced Akt expression levels in K9TCC#1Lillie cells (Figure 6B), and increased the cPARP expression in h-5637 cells, however, no cPARP levels were detected in K9TCC#1Lillie cells (Figure 6B and C).
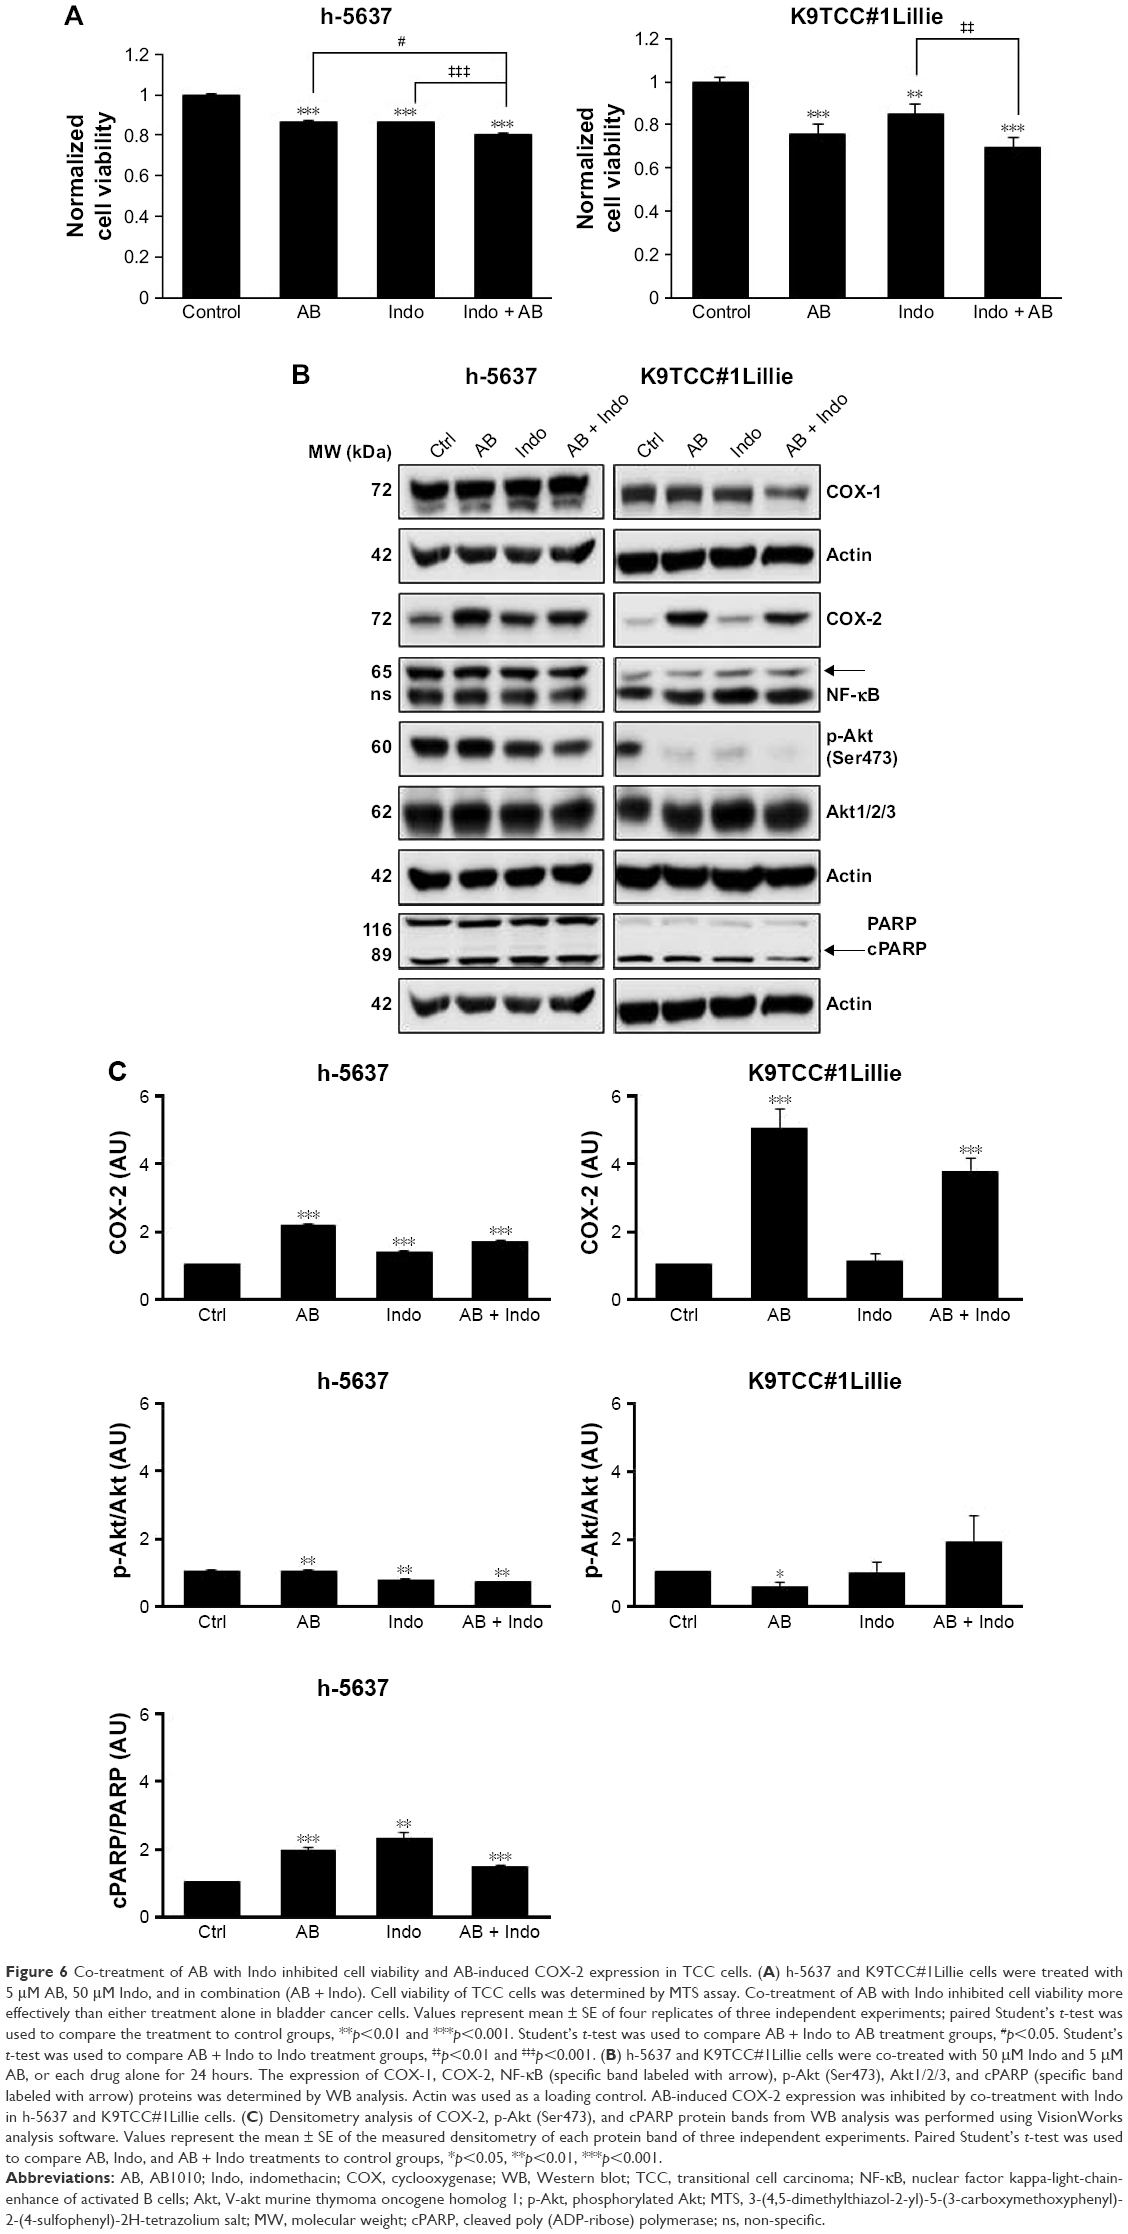 | Figure 6 Co-treatment of AB with Indo inhibited cell viability and AB-induced COX-2 expression in TCC cells. (A) h-5637 and K9TCC#1Lillie cells were treated with 5 μM AB, 50 μM Indo, and in combination (AB + Indo). Cell viability of TCC cells was determined by MTS assay. Co-treatment of AB with Indo inhibited cell viability more effectively than either treatment alone in bladder cancer cells. Values represent mean ± SE of four replicates of three independent experiments; paired Student’s t-test was used to compare the treatment to control groups, **p<0.01 and ***p<0.001. Student’s t-test was used to compare AB + Indo to AB treatment groups, #p<0.05. Student’s t-test was used to compare AB + Indo to Indo treatment groups, ‡‡p<0.01 and ‡‡‡p<0.001. (B) h-5637 and K9TCC#1Lillie cells were co-treated with 50 μM Indo and 5 μM AB, or each drug alone for 24 hours. The expression of COX-1, COX-2, NF-κB (specific band labeled with arrow), p-Akt (Ser473), Akt1/2/3, and cPARP (specific band labeled with arrow) proteins was determined by WB analysis. Actin was used as a loading control. AB-induced COX-2 expression was inhibited by co-treatment with Indo in h-5637 and K9TCC#1Lillie cells. (C) Densitometry analysis of COX-2, p-Akt (Ser473), and cPARP protein bands from WB analysis was performed using VisionWorks analysis software. Values represent the mean ± SE of the measured densitometry of each protein band of three independent experiments. Paired Student’s t-test was used to compare AB, Indo, and AB + Indo treatments to control groups, *p<0.05, **p<0.01, ***p<.001. |
NSAIDs inhibited AB1010-induced PGE2 production in K9TCC#1Lillie cells in vitro
To evaluate the effects of AB1010 and indomethacin co-treatment on COX-2 activity in h-5637 and K9TCC#1Lillie cells, released levels of PGE2 in media were measured by ELISA assay as shown in Figure 7A and B. Indomethacin alone and in combination with AB1010 significantly inhibited PGE2 production in h-5637 cells. No significant change in PGE2 production was detected after AB1010 treatment in h-5637 cells (Figure 7A). AB1010 treatment significantly increased PGE2 levels by 2-fold in K9TCC#1Lillie cells. In addition, indomethacin inhibited AB1010-induced PGE2 production in K9TCC#1Lillie cells by 5-fold (Figure 7B).
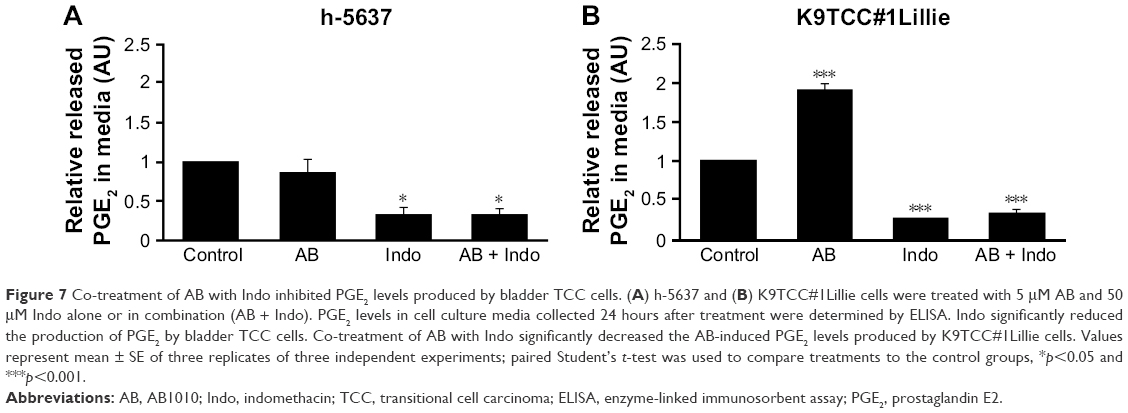 | Figure 7 Co-treatment of AB with Indo inhibited PGE2 levels produced by bladder TCC cells. (A) h-5637 and (B) K9TCC#1Lillie cells were treated with 5 μM AB and 50 μM Indo alone or in combination (AB + Indo). PGE2 levels in cell culture media collected 24 hours after treatment were determined by ELISA. Indo significantly reduced the production of PGE2 by bladder TCC cells. Co-treatment of AB with Indo significantly decreased the AB-induced PGE2 levels produced by K9TCC#1Lillie cells. Values represent mean ± SE of three replicates of three independent experiments; paired Student’s t-test was used to compare treatments to the control groups, *p<0.05 and ***p<0.001. |
Discussion
Bladder TCC comprises 90% of all bladder cancer cases in USA. Selection of treatment for patients diagnosed with bladder TCC depends on the grade (low or high) and invasiveness of the tumor. Surgery and conventional chemotherapy are used for low-grade TCC cases, but patients with advanced TCC rely on nonconventional treatment options, such as radical surgery, novel therapeutics, and combination therapies.1 Axitinib is a US Food and Drug Administration-approved second-line RTKI therapy for patients with metastatic RCC.13 In Europe, AB1010 is used for patients diagnosed with GIST and significantly improves prognostic outcomes.21 In this study, we have confirmed that AB1010 as compared to axitinib more efficiently inhibited cell viability of K9TCC#1Lillie cells through inhibition of the c-Kit receptor and Akt signaling pathways. In addition, RTKIs increased apoptosis in both tested TCC cells. However, RTKIs treatment caused increased expression of COX-2 in tested TCC cells. Co-treatment of RTKIs with indomethacin inhibited cell viability and AB1010-induced COX-2 expression resulting in decreased PGE2 production in tested TCC cells.
Overexpression of multiple RTKs (PDGFRα/β, c-Kit, and VEGFR) and COX-2 is a common characteristic of bladder cancer.3–5,24,25 Basal expression profile of these RTKs indicates that tested h-TCC cells had lower expression of the RTKs (c-Kit and PDGFRα) when compared to the tested K9TCC cells (Figure 1). Our results are consistent with a previously published study50 where low or no levels of mRNA or proteins of c-Kit were detected in h-5637 and T24 cells. Only UM-UC-3 cells have high levels of PDGFRα mRNA, but no expression of c-Kit mRNA as detected by RT-PCR analysis.50 The activation of the phosphatidylinositol-3-kinase/Akt pathway and loss of phosphatase and tensin homolog deleted on chromosome 10 correlate with tumor progression and poor patient prognosis.51,52 The expression of phosphorylated Akt was not detected in either of the tested canine TCC cells. h-T24 and UM-UC-3 cells have little to no detectable levels of COX-2 expression, respectively, when compared to K9TCC#1Lillie and K9TCC#5Lilly cells (Figure 1). Our results concur with previously published studies53,54 where no protein levels of COX-2 are detected in UM-UC-3 cells.
While AB1010 decreased cell viability and inhibited phosphorylation of c-Kit, increased levels of COX-2 and NF-κB expressions were detected in h-5637 and K9TCC#1Lillie cells (Figure 5A). Increased COX-2 expression has been demonstrated in vitro and in vivo using several primary K9TCC cell lines, but the mechanisms by which AB1010 increases COX-2 expression are still not well understood.39 We hypothesize that the increased COX-2 levels by RTKI could possibly lead to drug resistance in COX-2 expressing tumors. To prove our hypothesis, we evaluated the effects of co-treatment of AB1010 with indomethacin (NSAID) in h-5637 and K9TCC#1Lillie cells. Indeed, the co-treatment of AB1010 with indomethacin significantly reduced cell viability and COX-2 expression in h-5637 and K9TCC#1Lillie cells. Similar results have been demonstrated in patients with advanced pancreatic cancer, who received combination therapy with AB1010 and gemcitabine compared to either treatment alone.18
NSAIDs are commonly used for the treatment of inflammation as well as cancer.30,55 We evaluated the effects of celecoxib (a COX-2 selective inhibitor; data not shown) and indomethacin (nonselective NSAID) on cell viability of bladder TCC cells. Our results indicated that co-treatment of AB1010 with indomethacin significantly inhibited cell viability in h-5637 and K9TCC#1Lillie cells (Figure 6A). Co-treatment of AB1010 with indomethacin decreased the phosphorylation of Akt (Ser473) in both TCC cells, and decreased COX-1 and COX-2 protein expression levels in K9TCC#1Lillie cells (Figure 6B and C). Decreased levels of AB1010-induced COX-2 were detected after co-treatment with indomethacin in both TCC cells. Increased prostaglandins production positively correlates with COX-2 expression levels and progression of cancer.26–29 To validate whether AB1010 and indomethacin affect the activity of COX-2 in the tested cells, we measured the levels of PGE2 released into media 24 hours after treatment of cells. AB1010 increased significantly the levels of COX-2 and production of PGE2 in K9TCC#1Lillie cells as shown in Figure 7. Indomethacin inhibited the production of PGE2 in both tested cells and in addition, in co-treatment with AB1010, inhibited AB1010-induced COX-2 activity resulting in the inhibition of PGE2 production in canine TCC cells. Currently, co-treatments of conventional chemotherapy agents with molecular targeted agents have been successfully applied for patients with drug-resistant cancers, including breast, lung, and colon cancer.56–58 COX-2/PGE2 signaling pathway exerts pro-oncogenic effects through the activation of receptor tyrosine kinases in colorectal cancer59 and non-small-cell lung cancer60 that supports our finding that co-treatment of RTKIs and NSAIDs might indicate better results for bladder cancer. Further experiments in vivo need to be conducted to confirm our findings of the beneficial role of NSAIDs in co-treatment with RTKIs in bladder TCC cells in vitro.
Conclusion
Drug resistance is one of the many challenges in the treatment of bladder cancer. Thus, co-treatment of RTKIs with COX inhibitors might indicate better clinical outcomes for patients diagnosed with bladder cancer.
Acknowledgments
We thank the National Institute of Health (R15-CA182850-01A1, PI: Cekanova), The University of Tennessee the Center of Excellence in Livestock Diseases and Human Health grants (R181721-216; PI: Cekanova), The University of Tennessee, The Physicians’ Medical Education and Research Foundation (R181721-314; PI: Cekanova) and Department of Small Animal Clinical Sciences (E180120; PI: Cekanova) for supporting this research.
Author contributions
JB made substantial contributions to the acquisition and analysis of data for in vitro assays; performed the statistical analysis; was involved in writing the manuscript; has given a final approval of the version to be published and agreed to be accountable for all aspects of the work in ensuring that questions related to the accuracy or integrity of any part of the work are appropriately investigated and resolved. MC made substantial contributions to the conception and design of experiments, analysis, and interpretation of data; has been involved in writing the manuscript and revising it critically for important intellectual content; has given a final approval of the version to be published; and agreed to be accountable for all aspects of the work in ensuring that questions related to the accuracy or integrity of any part of the work are appropriately investigated and resolved.
Disclosure
The authors report no conflicts of interest in this work.
References
National Cancer Institute. Cancer of the urinary bladder. 2016. Available from: http://seer.cancer.gov/statfacts/html/urinb.html. Accessed June 23, 2017. | ||
Seront E, Machiels JP. Molecular biology and targeted therapies for urothelial carcinoma. Cancer Treat Rev. 2015;41(4):341–353. | ||
Cancer Genome Atlas Research Network. Comprehensive molecular characterization of urothelial bladder carcinoma. Nature. 2014;507(7492):315–322. | ||
Wong YN, Litwin S, Vaughn D, et al. Phase II trial of cetuximab with or without paclitaxel in patients with advanced urothelial tract carcinoma. J Clin Oncol. 2012;30(28):3545–3551. | ||
Crew JP. Vascular endothelial growth factor: an important angiogenic mediator in bladder cancer. Eur Urol. 1999;35(1):2–8. | ||
Hussain M, Daignault S, Agarwal N, et al. A randomized phase 2 trial of gemcitabine/cisplatin with or without cetuximab in patients with advanced urothelial carcinoma. Cancer. 2014;120(17):2684–2693. | ||
Balar AV, Apolo AB, Ostrovnaya I, et al. Phase II study of gemcitabine, carboplatin, and bevacizumab in patients with advanced unresectable or metastatic urothelial cancer. J Clin Oncol. 2013;31(6):724–730. | ||
Hahn NM, Stadler WM, Zon RT, et al. Phase II trial of cisplatin, gemcitabine, and bevacizumab as first-line therapy for metastatic urothelial carcinoma: Hoosier Oncology Group GU 04-75. J Clin Oncol. 2011;29(12):1525–1530. | ||
Petrylak DP, Tangen CM, Van Veldhuizen PJ Jr, et al. Results of the Southwest Oncology Group phase II evaluation (study S0031) of ZD1839 for advanced transitional cell carcinoma of the urothelium. BJU Int. 2010;105(3):317–321. | ||
Gallagher DJ, Milowsky MI, Gerst SR, et al. Phase II study of sunitinib in patients with metastatic urothelial cancer. J Clin Oncol. 2010;28(8):1373–1379. | ||
Hutson TE, Lesovoy V, Al-Shukri S, et al. Axitinib versus sorafenib as first-line therapy in patients with metastatic renal-cell carcinoma: a randomised open-label phase 3 trial. Lancet Oncol. 2013;14(13):1287–1294. | ||
Rugo HS, Herbst RS, Liu G, et al. Phase I trial of the oral antiangiogenesis agent AG-013736 in patients with advanced solid tumors: pharmacokinetic and clinical results. J Clin Oncol. 2005;23(24):5474–5483. | ||
Rini BI, Escudier B, Tomczak P, et al. Comparative effectiveness of axitinib versus sorafenib in advanced renal cell carcinoma (AXIS): a randomised phase 3 trial. Lancet. 2011;378(9807):1931–1939. | ||
Dubreuil P, Letard S, Ciufolini M, et al. Masitinib (AB1010), a potent and selective tyrosine kinase inhibitor targeting KIT. PLoS One. 2009;4(9):e7258. | ||
Hahn KA, Legendre AM, Shaw NG, et al. Evaluation of 12- and 24-month survival rates after treatment with masitinib in dogs with nonresectable mast cell tumors. Am J Vet Res. 2010;71(11):1354–1361. | ||
Hahn KA, Ogilvie G, Rusk T, et al. Masitinib is safe and effective for the treatment of canine mast cell tumors. J Vet Intern Med. 2008;22(6):1301–1309. | ||
Humbert M, Casteran N, Letard S, et al. Masitinib combined with standard gemcitabine chemotherapy: in vitro and in vivo studies in human pancreatic tumour cell lines and ectopic mouse model. PLoS One. 2010;5(3):e9430. | ||
Mitry E, Hammel P, Deplanque G, et al. Safety and activity of masitinib in combination with gemcitabine in patients with advanced pancreatic cancer. Cancer Chemother Pharmacol. 2010;66(2):395–403. | ||
Thamm DH, Rose B, Kow K, et al. Masitinib as a chemosensitizer of canine tumor cell lines: a proof of concept study. Vet J. 2012;191(1):131–134. | ||
Deplanque G, Demarchi M, Hebbar M, et al. A randomized, placebo-controlled phase III trial of masitinib plus gemcitabine in the treatment of advanced pancreatic cancer. Ann Oncol. 2015;26(6):1194–1200. | ||
Adenis A, Blay JY, Bui-Nguyen B, et al. Masitinib in advanced gastrointestinal stromal tumor (GIST) after failure of imatinib: a randomized controlled open-label trial. Ann Oncol. 2014;25(9):1762–1769. | ||
Leahy KM, Ornberg RL, Wang Y, Zweifel BS, Koki AT, Masferrer JL. Cyclooxygenase-2 inhibition by celecoxib reduces proliferation and induces apoptosis in angiogenic endothelial cells in vivo. Cancer Res. 2002;62(3):625–631. | ||
Gately S, Li WW. Multiple roles of COX-2 in tumor angiogenesis: a target for antiangiogenic therapy. Semin Oncol. 2004;31(2 Suppl 7):2–11. | ||
Gakis G. The role of inflammation in bladder cancer. Adv Exp Med Biol. 2014;816:183–196. | ||
Qayyum T, McArdle P, Hilmy M, et al. A prospective study of the role of inflammation in bladder cancer. Curr Urol. 2013;6(4):189–193. | ||
Wheeler MA, Hausladen DA, Yoon JH, Weiss RM. Prostaglandin E2 production and cyclooxygenase-2 induction in human urinary tract infections and bladder cancer. J Urol. 2002;168(4 Pt 1):1568–1573. | ||
Yamada H, Kuroda E, Matsumoto S, Matsumoto T, Yamada T, Yamashita U. Prostaglandin E2 down-regulates viable Bacille Calmette-Guerin-induced macrophage cytotoxicity against murine bladder cancer cell MBT-2 in vitro. Clin Exp Immunol. 2002;128(1):52–58. | ||
Bostrom PJ, Aaltonen V, Soderstrom KO, Uotila P, Laato M. Expression of cyclooxygenase-1 and -2 in urinary bladder carcinomas in vivo and in vitro and prostaglandin E2 synthesis in cultured bladder cancer cells. Pathology. 2001;33(4):469–474. | ||
Wang Z, Chen Y, Zheng R, et al. In vitro effects of prostaglandin E2 or indomethacin on the proliferation of lymphokine-activated killer cells and their cytotoxicity against bladder tumor cells in patients with bladder cancer. Prostaglandins. 1997;54(5):769–779. | ||
Crusz SM, Balkwill FR. Inflammation and cancer: advances and new agents. Nat Rev Clin Oncol. 2015;12(10):584–596. | ||
DeWitt DL. Cox-2-selective inhibitors: the new super aspirins. Mol Pharmacol. 1999;55(4):625–631. | ||
Marnett LJ, Kalgutkar AS. Cyclooxygenase 2 inhibitors: discovery, selectivity and the future. Trends Pharmacol Sci. 1999;20(11):465–469. | ||
DuBois R, Wallace MC. The emerging role and potential of COX-2 inhibitors. Clin Adv Hematol Oncol. 2003;1(2):97–98. | ||
Menter DG, Dubois RN. Prostaglandins in cancer cell adhesion, migration, and invasion. Int J Cell Biol. 2012;2012:723419. | ||
Silverstein FE, Faich G, Goldstein JL, et al. Gastrointestinal toxicity with celecoxib vs nonsteroidal anti-inflammatory drugs for osteoarthritis and rheumatoid arthritis: the CLASS study: a randomized controlled trial. Celecoxib Long-term Arthritis Safety Study. JAMA. 2000;284(10):1247–1255. | ||
Marnett LJ. The COXIB experience: a look in the rearview mirror. Annu Rev Pharmacol Toxicol. 2009;49:265–290. | ||
Vosooghi M, Amini M. The discovery and development of cyclooxygenase-2 inhibitors as potential anticancer therapies. Expert Opin Drug Discov. 2014;9(3):255–267. | ||
Rome LH, Lands WE. Structural requirements for time-dependent inhibition of prostaglandin biosynthesis by anti-inflammatory drugs. Proc Natl Acad Sci U S A. 1975;72(12):4863–4865. | ||
Rathore K, Alexander M, Cekanova M. Piroxicam inhibits Masitinib-induced cyclooxygenase 2 expression in oral squamous cell carcinoma cells in vitro. Transl Res. 2014;164(2):158–168. | ||
Rathore K, Cekanova M. Animal model of naturally occurring bladder cancer: characterization of four new canine transitional cell carcinoma cell lines. BMC Cancer. 2014;14:465. | ||
Buchanan FG, Holla V, Katkuri S, Matta P, DuBois RN. Targeting cyclooxygenase-2 and the epidermal growth factor receptor for the prevention and treatment of intestinal cancer. Cancer Res. 2007;67(19):9380–9388. | ||
Marnett LJ, DuBois RN. COX-2: a target for colon cancer prevention. Annu Rev Pharmacol Toxicol. 2002;42:55–80. | ||
Prusakiewicz JJ, Felts AS, Mackenzie BS, Marnett LJ. Molecular basis of the time-dependent inhibition of cyclooxygenases by indomethacin. Biochemistry. 2004;43(49):15439–15445. | ||
Wheeler DL, Dunn EF, Harari PM. Understanding resistance to EGFR inhibitors – impact on future treatment strategies. Nat Rev Clin Oncol. 2010;7(9):493–507. | ||
Rosenzweig SA. Acquired resistance to drugs targeting receptor tyrosine kinases. Biochem Pharmacol. 2012;83(8):1041–1048. | ||
Dannenberg AJ, Lippman SM, Mann JR, Subbaramaiah K, DuBois RN. Cyclooxygenase-2 and epidermal growth factor receptor: pharmacologic targets for chemoprevention. J Clin Oncol. 2005;23(2):254–266. | ||
Dannenberg AJ, Subbaramaiah K. Targeting cyclooxygenase-2 in human neoplasia: rationale and promise. Cancer Cell. 2003;4(6):431–436. | ||
Cekanova M, Rathore K. Animal models and therapeutic molecular targets of cancer: utility and limitations. Drug Des Devel Ther. 2014;8:1911–1921. | ||
Cekanova M, Uddin MJ, Bartges JW, et al. Molecular imaging of cyclooxygenase-2 in canine transitional cell carcinomas in vitro and in vivo. Cancer Prev Res (Phila). 2013;6(5):466–476. | ||
Knievel J, Schulz WA, Greife A, et al. Multiple mechanisms mediate resistance to sorafenib in urothelial cancer. Int J Mol Sci. 2014;15(11):20500–20517. | ||
Sun CH, Chang YH, Pan CC. Activation of the PI3K/Akt/mTOR pathway correlates with tumour progression and reduced survival in patients with urothelial carcinoma of the urinary bladder. Histopathology. 2011;58(7):1054–1063. | ||
Lee H, Choi SK, Ro JY. Overexpression of DJ-1 and HSP90α, and loss of PTEN associated with invasive urothelial carcinoma of urinary bladder: possible prognostic markers. Oncol Lett. 2012;3(3):507–512. | ||
Dhawan D, Jeffreys AB, Zheng R, Stewart JC, Knapp DW. Cyclooxygenase-2 dependent and independent antitumor effects induced by celecoxib in urinary bladder cancer cells. Mol Cancer Ther. 2008;7(4):897–904. | ||
Gee J, Lee IL, Jendiroba D, Fischer SM, Grossman HB, Sabichi AL. Selective cyclooxygenase-2 inhibitors inhibit growth and induce apoptosis of bladder cancer. Oncol Rep. 2006;15(2):471–477. | ||
Black WC, Brideau C, Chan CC, et al. 3,4-Diaryl-5-hydroxyfuranones: highly selective inhibitors of cyclooxygenase-2 with aqueous solubility. Bioorg Med Chem Lett. 2003;13(6):1195–1198. | ||
Miller K, Wang M, Gralow J, et al. Paclitaxel plus bevacizumab versus paclitaxel alone for metastatic breast cancer. N Engl J Med. 2007;357(26):2666–2676. | ||
Sandler A, Gray R, Perry MC, et al. Paclitaxel-carboplatin alone or with bevacizumab for non-small-cell lung cancer. N Engl J Med. 2006;355(24):2542–2550. | ||
Hurwitz H, Fehrenbacher L, Novotny W, et al. Bevacizumab plus irinotecan, fluorouracil, and leucovorin for metastatic colorectal cancer. N Engl J Med. 2004;350(23):2335–2342. | ||
Shao J, Evers BM, Sheng H. Prostaglandin E2 synergistically enhances receptor tyrosine kinase-dependent signaling system in colon cancer cells. J Biol Chem. 2004;279(14):14287–14293. | ||
Gadgeel SM, Ruckdeschel JC, Heath EI, Heilbrun LK, Venkatramanamoorthy R, Wozniak A. Phase II study of gefitinib, an epidermal growth factor receptor tyrosine kinase inhibitor (EGFR-TKI), and celecoxib, a cyclooxygenase-2 (COX-2) inhibitor, in patients with platinum refractory non-small cell lung cancer (NSCLC). J Thorac Oncol. 2007;2(4):299–305. |
Supplementary materials
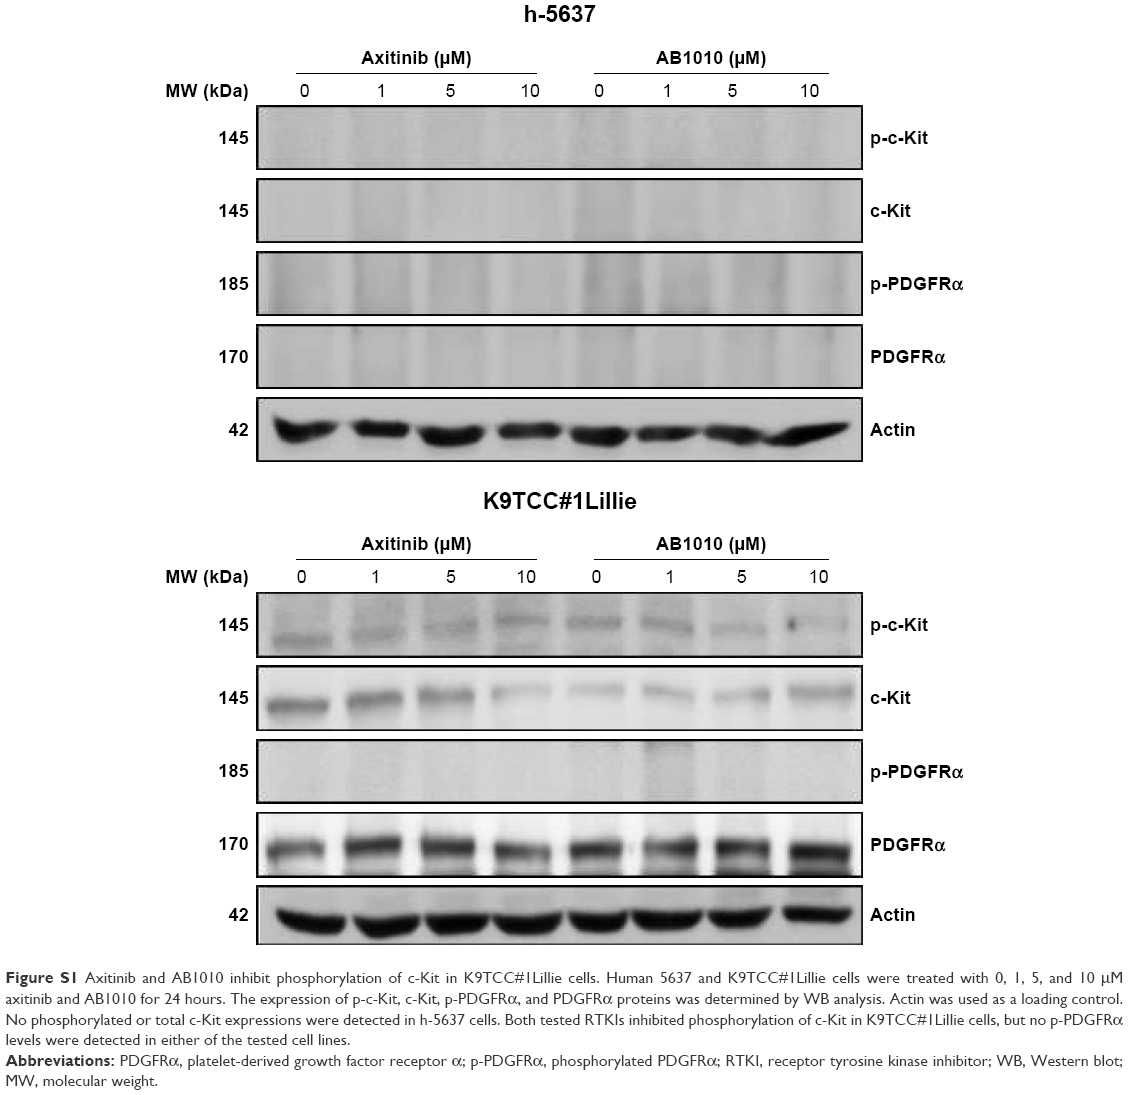 | Figure S1 Axitinib and AB1010 inhibit phosphorylation of c-Kit in K9TCC#1Lillie cells. Human 5637 and K9TCC#1Lillie cells were treated with 0, 1, 5, and 10 μM axitinib and AB1010 for 24 hours. The expression of p-c-Kit, c-Kit, p-PDGFRα, and PDGFRα proteins was determined by WB analysis. Actin was used as a loading control. No phosphorylated or total c-Kit expressions were detected in h-5637 cells. Both tested RTKIs inhibited phosphorylation of c-Kit in K9TCC#1Lillie cells, but no p-PDGFRα levels were detected in either of the tested cell lines. |
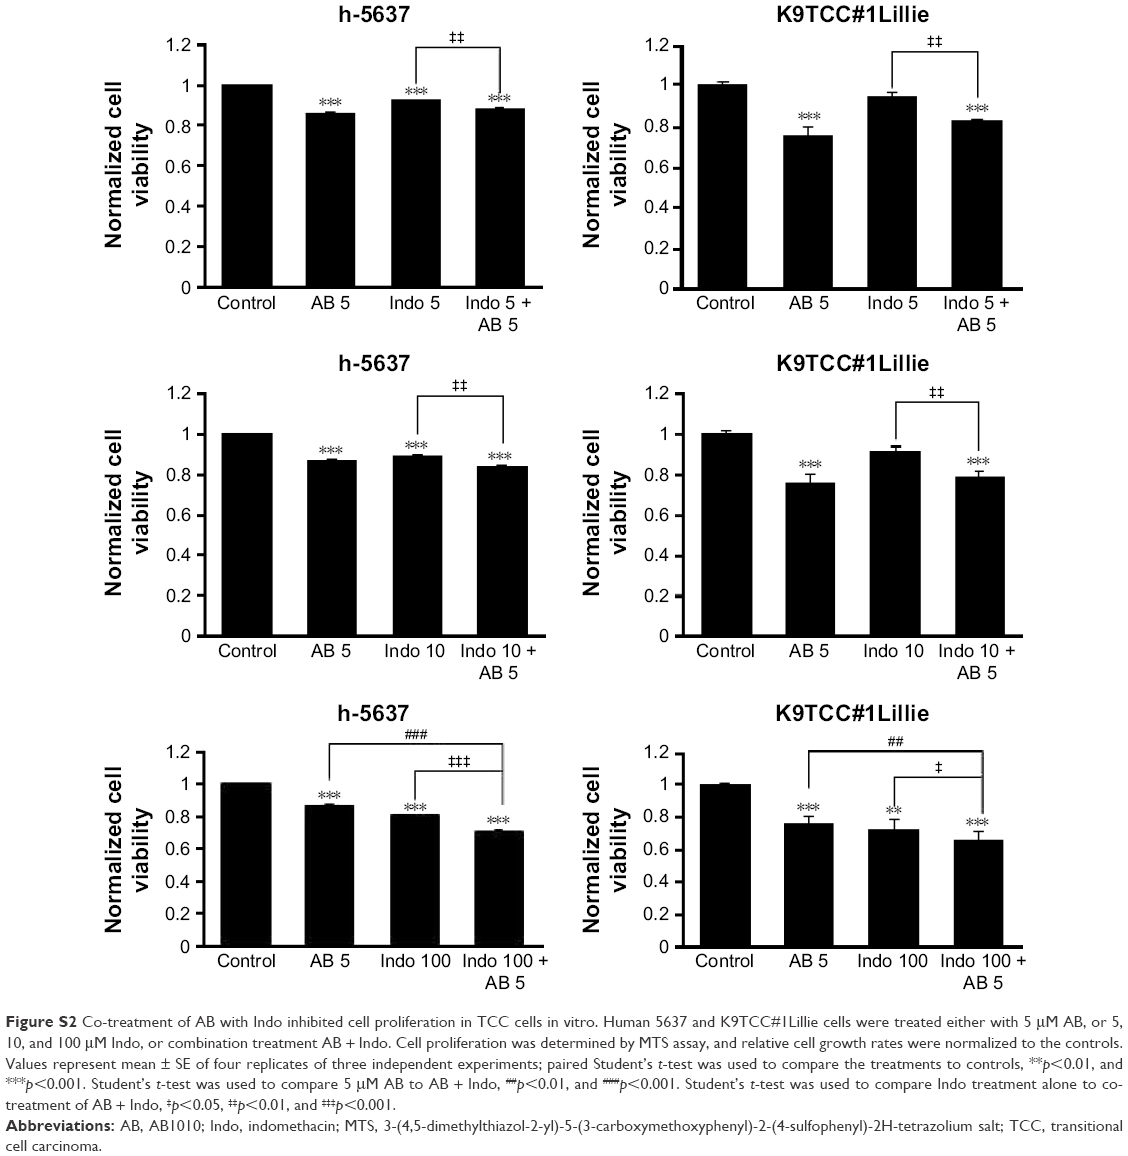 | Figure S2 Co-treatment of AB with Indo inhibited cell proliferation in TCC cells in vitro. Human 5637 and K9TCC#1Lillie cells were treated either with 5 μM AB, or 5, 10, and 100 μM Indo, or combination treatment AB + Indo. Cell proliferation was determined by MTS assay, and relative cell growth rates were normalized to the controls. Values represent mean ± SE of four replicates of three independent experiments; paired Student’s t-test was used to compare the treatments to controls, **p<0.01, and ***p<0.001. Student’s t-test was used to compare 5 μM AB to AB + Indo, ##p<0.01, and ###p<0.001. Student’s t-test was used to compare Indo treatment alone to co-treatment of AB + Indo, ‡p<0.05, ‡‡p<0.01, and ‡‡‡p<0.001. |
 © 2018 The Author(s). This work is published and licensed by Dove Medical Press Limited. The full terms of this license are available at https://www.dovepress.com/terms.php and incorporate the Creative Commons Attribution - Non Commercial (unported, v3.0) License.
By accessing the work you hereby accept the Terms. Non-commercial uses of the work are permitted without any further permission from Dove Medical Press Limited, provided the work is properly attributed. For permission for commercial use of this work, please see paragraphs 4.2 and 5 of our Terms.
© 2018 The Author(s). This work is published and licensed by Dove Medical Press Limited. The full terms of this license are available at https://www.dovepress.com/terms.php and incorporate the Creative Commons Attribution - Non Commercial (unported, v3.0) License.
By accessing the work you hereby accept the Terms. Non-commercial uses of the work are permitted without any further permission from Dove Medical Press Limited, provided the work is properly attributed. For permission for commercial use of this work, please see paragraphs 4.2 and 5 of our Terms.