")
Back to Journals » Clinical Interventions in Aging » Volume 12
Correlations between satisfaction with life and selected personal resources among students of Universities of the Third Age
Authors Zielińska-Więczkowska H
Received 11 May 2017
Accepted for publication 11 July 2017
Published 31 August 2017 Volume 2017:12 Pages 1391—1399
DOI https://doi.org/10.2147/CIA.S141576
Checked for plagiarism Yes
Review by Single anonymous peer review
Peer reviewer comments 3
Editor who approved publication: Dr Richard Walker
Halina Zielińska-Więczkowska
Department of Pedagogy and Nursing Didactics, Nicolaus Copernicus University Collegium Medicum in Bydgoszcz, Bydgoszcz, Poland
Purpose: The aim of the study was to identify personal resources, including health-related resources, sense of self-efficacy, attitude to life (optimism/pessimism) and self-assessment, and to determine their relationship with satisfaction with life in members of the Universities of the Third Age (U3As) in Poland. The impact of sociodemographic factors was analyzed.
Materials and methods: The study included 320 participants of U3As; their mean age was 67.5 years and the vast majority of them were women (92.5%). The study was a screening test based on a diagnostic survey using validated scales, Satisfaction with Life Scale (SWLS), Life Orientation Test (LOT-R) and Generalized Self-Efficacy Scale (GSES), and a survey of own design.
Results: Men showed significantly higher mean SWLS scores than women. SWLS scores were found to correlate significantly with LOT-R (r=0.411; P<0.001) and GSES scores (r=0.451; P<0.001). The respondents’ financial situation had a significant impact on their scores in all scales: SWLS (P<0.001), LOT-R (P<0.001) and GSES (P<0.001). Educational attainment of the respondents showed a significant correlation with SWLS (P=0.004) and GSES (P=0.011).
Conclusion: In the process of preparation for successful aging, particular emphasis should be placed on the continuous development of an individual, as it leads to the improvement of their socioeconomic status. Also, promoting positive personality traits and responsibility for one’s own life, including health, is of vital importance. The study is particularly important for the early identification of individuals at risk of unsuccessful aging.
Keywords: life satisfaction, self-rated health, self-efficacy, optimism/pessimism, sociodemographic factors, University of the Third Age (U3A)
Introduction
The progressive aging of the world’s population constitutes a significant challenge in the context of quality of life and positive aging of older adults. The clearly visible changes in demographics, mainly in the western societies, may affect the scope of health problems and satisfaction with life among the aged population, also in terms of the social support network.1 The social support network, viewed as a significant indicator of quality of life, is particularly well developed in Spain. Older adults in Spain report a high level of contentment with their social interaction.2 Feminization of old age is a common modern-day phenomenon. Aging as a universal phenomenon is increasingly frequently characterized by solitary residence and a visibly prolonged lifespan.3 Noticeably, Spain is one of the European countries with the smallest number of people living alone.2
Universities of the Third Age (U3As) play a significant role and have a highly beneficial effect on positive aging, multidimensional support for older adults and, consequently, their satisfaction with life. The first U3A was founded in 1973 in Toulouse, France, by Pierre Vellas. U3As serve an important role in preventive gerontology.4 The social activation of older adults with the help of U3As is aimed at delaying and mitigating the negative effects of the inevitable process of aging. These institutions fulfill a number of significant functions, such as educational, activating, integrating, compensational and recreational. They prevent social marginalization5 and provide older adults with the opportunity to age actively and to find self-fulfillment among other people.6
Continuing education, a valuable offer addressed to older adults, allows for a better understanding of the quickly unfolding civilization changes in the modern-day world, and thus helps to prevent civilizational maladjustment.7 Such an insight allows to utilize the numerous benefits of modern civilization and acts as a safeguard against the many dangers of contemporary life. Civilizational maladjustment may engender the feelings of emptiness and isolation, which are undoubtedly conducive to lowering the levels of satisfaction with life.8
Being open to new technologies and able to use the Internet provides older adults with possibilities and means to communicate and broaden their social circles. The Internet helps provide online support and improves one’s self-esteem and sense of self-efficacy. Internet literacy is, therefore, a feature of positive aging.9
As reported by researchers in the field, older adults express great satisfaction with their participation in U3A programs.5,10 Satisfaction with life is a multilayered term, which is interpreted as the general contentment with life, the feelings of happiness and welfare. The concept is very closely related to quality of life. It is an expression of the level of satisfying the needs which are important to an individual.11 Life satisfaction of older adults comprises their satisfaction with the current stage of life and satisfaction with personal achievements in life.12 A review of the available data has shown that the level of life satisfaction is determined by factors such as one’s self-assessment and feeling of self-esteem, dispositional optimism, social interactions, feeling of internal control and responsibility, involvement in work and methods of coping with stress.11 Studies by Zielińska-Więczkowska et al showed that the sense of coherence, another significant personal resource, was closely related to satisfaction with life.13 The level of life satisfaction also seems to be shaped by one’s health status, which deteriorates gradually with age, and thus with the progressive, though varying pace of senile involution.14 The health status of older adults, as can be deduced from some reports, is determined by one’s educational attainment and financial situation.14,15
Purpose
The aim of the study was to identify personal resources, including health-related resources, sense of self-efficacy, dispositional optimism and self-assessment, and to determine their relationship with satisfaction with life in members of U3As in Poland. The said resources were analyzed against the background of sociodemographic factors. The study aims to emphasize the significance of its findings in the early identification of individuals at risk of unsuccessful aging, which would allow to adopt appropriate countermeasures and forecast the level of demand for institutionalized care in the progressing process of aging of the world’s population. U3As are intended to act as an antidote used for reducing the consequences of unsuccessful aging.
Materials and methods
Participants and data collection
In total, 320 individuals were involved in the study, including 92.5% women and 7.5% men. The mean age of the participants was 67.5±6.0 years (range 50–87). The majority of the participants were either married (52.5%) or widowed (30.3%). Most (60%) of the respondents had secondary education and 33.4% had higher education. The vast majority of the study population consisted of retirees (87.7%). The majority of the respondents described their financial situation as average (55.8%) or good (40.6%). The majority of the U3A participants described their health situation and physical fitness as good (42.5%) or average (39.4%). The vast majority of the study population suffered from different medical conditions (85.6%), characteristic of their age. The most frequently listed disorders were osteoarthritis (50%) and arterial hypertension (27.5%). Over half of the respondents (57.7%) declared that they required the services of medical care institutions very rarely.
Over 90% of the respondents declared that they were self-satisfied or at least partly self-satisfied, and almost 90% declared that they were partly or fully satisfied with their appearance. Almost all of the respondents were satisfied with their interactions with others. Over 40% of the respondents considered their personality to be defined by strong traits.
The study included 320 participants recruited from three U3As in Bydgoszcz, Poland. The main inclusion criterion was participation in U3A courses. Exclusion criteria included submission of an empty questionnaire form or a partially filled out form without enough data to perform statistical calculations.
The study was a screening investigation based on a paper-based diagnostic survey using a questionnaire form to be completed anonymously. All the respondents gave their informed consent to participate in the study. The questionnaires were completed by the respondents during subsequent lectures organized by U3As. During the first of the series of lectures, U3A members were asked to participate in the study and were familiarized with its aim and scope. The questionnaire forms were laid out in a publicly accessible place before the lecture and deposited, upon completion by U3A members, in a specially prepared ballot box guaranteeing their anonymity. Survey questionnaires were filled out by 320 U3A members – a number that was planned to be included in the study as a representative group of the investigated population.
Measurements and procedure
The following research tools were used in the survey:
- A survey of the author’s design, consisting of three parts: 1) data determining the sociodemographic structure of the study population, 2) questions concerning the participants’ health situation and dependence on external care and 3) questions concerning the participants’ feeling of self-esteem.
- “The Satisfaction with Life Scale” (SWLS) by Ed Diener, Robert A Emmons, Randy J Larsen and Sharon Griffin, adapted by Zygfryd Juczyński. The standardized SWLS scale comprises five statements. The score is between 5 and 35 points, with higher score corresponding to higher satisfaction with life. The scores are expressed using the sten scale: 1–4 sten corresponds to low, 5–6 to medium and 7–10 to high satisfaction with life.16
- “Life Orientation Test” (LOT-R) by Michael F Scheier, Charles S Carver and Michael W Bridges, adapted by Ryszard Poprawa and Zygfryd Juczyński. The standardized LOT-R test comprises 10 statements and is used for measuring dispositional optimism. The score is between 0 and 24 points, with higher score corresponding to a more optimistic attitude. The raw score is converted to standardized sten scale units: 1–4 sten corresponds to low score, that is, predisposition to pessimism, and 7–10 sten corresponds to a high score, that is, predisposition to optimism.16
- A Polish version of the “Generalized Self-Efficacy Scale” (GSES) by Ralf Schwarzer, Michael Jerusalem and Zygfryd Juczyński. The standardized GSES scale comprises 10 questions and measures the strength of an individual’s general belief in their ability to cope with difficult situations. The score is between 10 and 40 points, with higher score corresponding to a higher level of self-efficacy. After conversion to standardized sten units, the results are interpreted as follows: 1–4 sten corresponds to low score, 5–6 to medium and 7–10 to high score.16
Ethical approval
The study was approved by the Bioethics Committee of the Nicolaus Copernicus University Collegium Medicum in Bydgoszcz, Poland.
Statistical analysis
The normal distribution of continuous variables (standardized values of psychologic scales and age of the respondents) was verified using the Shapiro–Wilk test. Statistical characteristics of continuous variables were presented as arithmetical means (M), SDs and medians (Me). Statistical characteristics of qualitative variables (responses to the questions in the author’s survey) were shown as numeric and percentage distributions. Student’s t-test and one-way analysis of variance with respective post hoc tests were used to compare continuous variables between groups. The strength and direction of linear correlations between pairs of continuous variables were analyzed using the Pearson’s coefficient of correlation (r). All calculations were carried out using Statistica 10 (StatSoft, Tulsa, OK, USA). The statistical significance of all the tests was set at P≤0.05.
Results
In total, 320 subjects were involved in the study, including 24 (7.5%) men and 295 (92.5%) women. The mean age of the participants was 67.5±6.0 years (range 50–87).
The results for scales used in the study were as follows: SWLS (M =21.80, SD =5.21, Me =20.00), LOT-R (M =15.59, SD =4.20, Me =16.00) and GSES (M =30.12, SD =5.14, Me =30.00).
The majority of the participants had average (5–6 sten) and low (1–4 sten) scores on the SWLS scale. The sten values for the LOT-R scale for 40% of the respondents corresponded to optimism (7–10 sten), slightly lesser number (32.2%) of respondents scored neutral (5–6 sten) and the rest (23.1%) were found to be pessimistic (1–4 sten). The majority of the participants scored high (7–10 sten) or average (5–6 sten) on the GSES scale.
The age of the respondents did not correlate significantly with SWLS (r=0.043; P=0.446), LOT-R (r=0.044; P=0.436) and GSES (r=−0.022; P=0.700) scores. The sex of the participants significantly affected only SWLS scores and did not influence either LOT-R (P=0.924) or GSES (P=0.185) scores. Men were found to have significantly higher mean SWLS scores than women (M =23.21 vs M =19.95, P=0.003).
Educational attainment of the respondents showed a significant correlation with SWLS (P=0.004) and GSES (P=0.011) scores and did not influence LOT-R (P=0.058) scores. Post hoc analysis showed that respondents with primary education had significantly lower SWLS scores than respondents with secondary (P=0.043), higher (P=0.017) or post-graduate (P=0.012) education. Moreover, the respondents with vocational education had significantly lower SWLS scores than those with higher (P=0.008) and post-graduate (P=0.045) education, similar to respondents with secondary education who also had significantly lower SWLS scores than those with higher education (P=0.026). Similar relationships were found when analyzing the effect of educational attainment on GSES scores.
A significant impact of the respondents’ financial situation on their scores in all scales, SWLS (P<0.001), LOT-R (P<0.001) and GSES (P<0.001), was found (Table 1). Post hoc analysis showed that respondents who considered their financial situation to be highly satisfying or satisfying had significantly higher SWLS scores than those who considered their financial situation to be average or bad (in all cases P<0.001). Furthermore, respondents who described their financial situation as average had significantly higher SWLS scores than those who described their financial situation as bad (P=0.001). A significant positive correlation between the respondents’ financial situation and LOT-R scores (P<0.001) was found, which means that reporting a more satisfying financial situation corresponded to an optimistic attitude. A similar correlation was identified when analyzing the effect of the respondents’ financial situation on GSES scores.
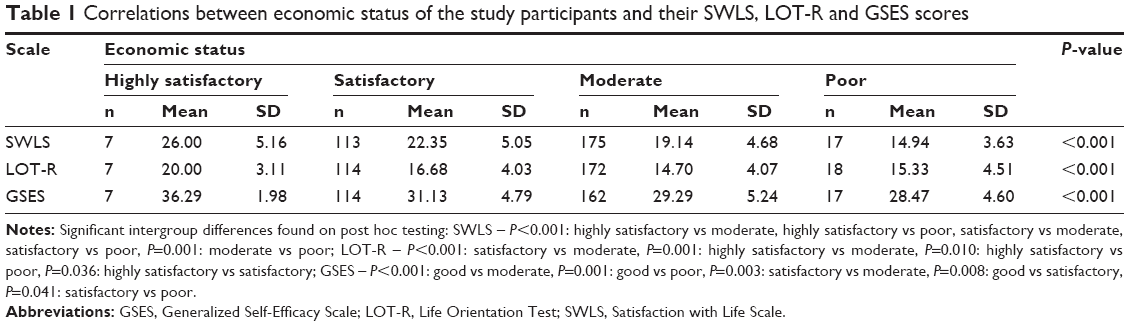 | Table 1 Correlations between economic status of the study participants and their SWLS, LOT-R and GSES scores |
The respondents’ marital status had no significant influence on SWLS (P=0.714), LOT-R (P=0.437) and GSES (P=0.558) scores. Similarly, questions about the respondents’ work-related activity, frequently a lack thereof, also did not show to have any effect on the scores.
Self-rated health of the respondents showed a significant correlation with SWLS, LOT-R and GSES scores (in each case P<0.001; Table 2). Moreover, a significant correlation between self-rated health and educational attainment of the respondents was found. Significantly more negative self-assessments were reported with respect to respondents with primary education (P<0.001), and significantly more very positive self-assessments were reported by those with higher education (P=0.015). Furthermore, self-rated health of the respondents significantly correlated with their financial situation: the worse the declared financial situation was, the significantly worse was the self-rated health, and conversely, the better the reported financial situation, the better the self-rated health. Self-rated health did not differ significantly between the sexes (P=0.809).
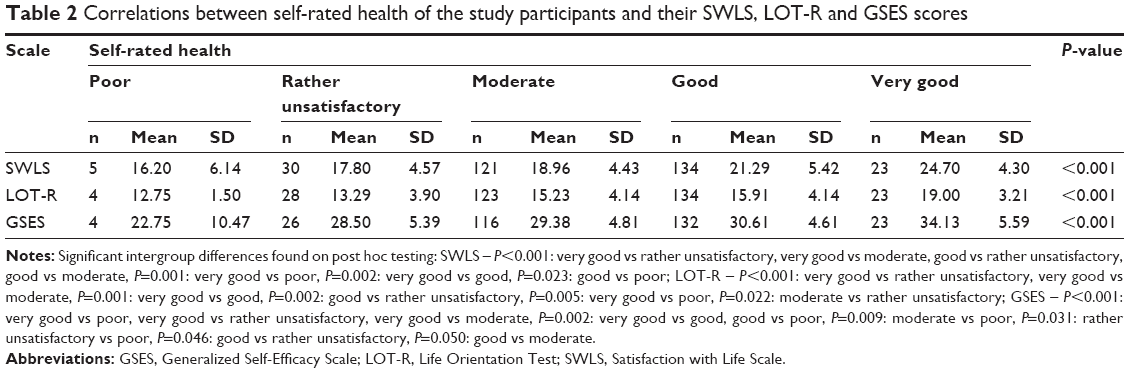 | Table 2 Correlations between self-rated health of the study participants and their SWLS, LOT-R and GSES scores |
Post hoc analysis showed that respondents who reported their health status as highly satisfying had significantly higher SWLS scores than those describing their health status as bad (P=0.001), not very satisfying (P<0.001), average (P<0.001) or good (P=0.002). Furthermore, respondents who reported that their health status was good had significantly higher SWLS scores than those who reported that their health status was bad (P=0.023), not very satisfying (P<0.001) or average (P<0.001). Post hoc analysis determined that respondents who considered themselves to be in full health had significantly higher SWLS scores than those who considered themselves rather healthy (P<0.001), rather unhealthy (P<0.001) or very unhealthy (P=0.005). Moreover, respondents who considered themselves rather healthy had significantly higher SWLS scores than those who considered themselves rather unhealthy (P=0.002). Respondents who reported to have at least one medical condition had significantly lower SWLS scores than those who did not report any medical conditions (P<0.001). Similarly, a more satisfying health status corresponded to significantly higher LOT-R and GSES scores.
A significant correlation between the declared occurrence/absence of health problems and SWLS, LOT-R and GSES scores (P<0.001) was found. A reported occurrence of a medical condition corresponded to significantly lower scores on the aforementioned scales. Post hoc analysis showed that respondents who reported to be suffering from a medical condition had significantly lower SWLS scores than those who did not report any health problems (P<0.001). A reported medical condition also corresponded to lower LOT-R and GSES scores.
Furthermore, a significant correlation between the respondents’ self-rated physical fitness and SWLS, LOT-R and GSES scores (P<0.001) was found (Table 3). Post hoc analysis indicated that respondents who described their physical fitness as very good had significantly higher SWLS scores than those who described their physical fitness as rather unsatisfying (P<0.001), average (P<0.001) or good (P=0.013). Also, respondents who reported their physical fitness to be good had significantly higher SWLS scores than those who reported their physical fitness to be rather unsatisfying (P=0.021) or average (P<0.001). Higher level of self-rated physical fitness also corresponded to significantly higher LOT-R and GSES scores.
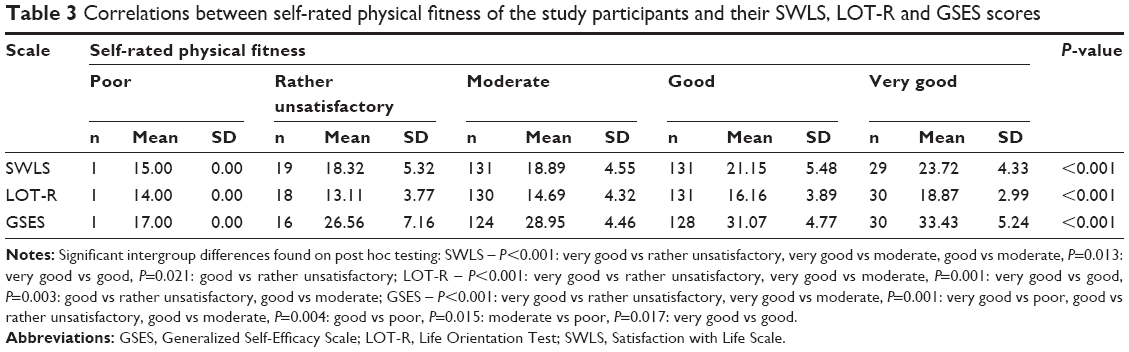 | Table 3 Correlations between self-rated physical fitness of the study participants and their SWLS, LOT-R and GSES scores |
Respondents who required the services of medical care institutions very rarely had significantly higher SWLS, LOT-R and GSES scores than those who required the services of such institutions more frequently (P=0.001).
A significant correlation was found between answers to all questions concerning the feelings of self-esteem and SWLS, LOT-R and GSES scores (in each case P<0.001). Respondents who reported to be satisfied with themselves, their appearance and their relationship with others had higher scores in all three scales: SWLS, LOT-R and GSES (P<0.001). Respondents who declared that their personality was characterized by strong traits also had significantly higher scores in all the analyzed scales (SWLS, LOT-R and GSES). On the other hand, respondents who experienced feelings of helplessness had significantly lower scores in all scales: SWLS, LOT-R and GSES (P<0.001).
SWLS scores were found to correlate significantly with LOT-R (r=0.411; P<0.001) and GSES scores (r=0.451; P<0.001).
Discussion
This study has shown that life satisfaction of U3A participants is significantly influenced by their self-rated health and personal resources, including dispositional optimism, feelings of self-esteem and self-efficacy, financial situation and educational attainment. Satisfaction with life is not dependent on age or marital status. The results of another large study (N=7,000) on satisfaction with life among older adults, which was conducted in Poland as part of the “Social Diagnosis 2011” project, are mostly consistent with the findings of this study; however, the said study did not analyze personal resources.17 In general, results of large studies show that older men are more satisfied with their life than older women, which is also consistent with the present findings.3,17 According to Halicka and Pędich, higher educational attainment corresponds to a higher level of satisfaction with the current stage of life of residents of larger cities, especially men.12 Other studies show that women are more concerned about aging. A relationship between such concerns and educational attainment was observed.18 The concerns of older adults often revolve around preserving good health.5,19
Self-assessment of health status, including physical fitness, is very frequently worse in older women than in older men.3 However, this study did not show any sex-specific differences in this respect. Self-rated health was shown to be associated with the educational attainment and financial situation of the respondents of this study. Previous studies by Abramowska-Kmon17 and Fernandez-Ballesteros2 revealed a relationship between the financial security and life satisfaction of an aging individual. Those results are consistent with the present findings. The level of income affects the self-assessment of one’s health status, which, as shown in this study, is closely associated with the life satisfaction of older adults participating in continuing education via U3A institutions.15 It is noteworthy that financial situation was associated with an optimistic attitude of the participants, higher levels of self-efficacy and self-esteem, which in turn had a significant influence on the level of satisfaction with life.
Educational attainment of U3A participants was shown to be associated with the levels of life satisfaction and self-efficacy; however, no relation was found between the level of education and dispositional optimism. Answers to all questions on feelings of self-esteem correlated with the levels of life satisfaction, dispositional optimism and self-efficacy.
It is worth mentioning that a better health status, including better physical fitness and independence in everyday functioning, corresponds to a higher level of satisfaction with life, as corroborated by both the present findings and the results of previous studies.20 Therefore, it is well worthwhile to promote activity among U3A participants with the help of health-related programs. As the study revealed, almost half of the U3A participants were rather satisfied with their health status and physical fitness, despite the fact that over 80% of them reported having different health problems. The study showed that reporting health problems corresponded to lower levels of satisfaction with life, which is consistent with the results of previous studies.21,22 Absence of chronic disorders correlates positively with successful aging. However, researchers seek to discover why some people suffering from chronic disorders and limitations related to daily life activities also perceive their aging process as successful.23 Some studies show interesting findings, whereby some people suffering from a serious disease (such as cancer) are actually satisfied with their life and health. Self-rated health is affected by the number of reported health problems and the corresponding need for services provided by medical care institutions, which is corroborated by the results of the conducted studies.14 The statistical analysis carried out in this study demonstrated that respondents who were less dependent on medical care institutions showed significantly higher levels of satisfaction with life.
This study revealed that the majority of U3A participants reported positive self-assessment and were happy with themselves and their appearance. This can be largely explained by the fact that mere participation in U3A classes promotes the development of a positive self-image. Membership in U3As and related integrative and social events motivates participants to take care of their appearance. Satisfaction with one’s self-appearance is likely to have a positive influence on satisfaction with life. A Brazilian study on the quality of life of U3A participants showed that subjectively perceived younger appearance was associated with higher levels of quality of life.20 A study conducted in 2010 on U3A participants (N=255) showed that over 60% of the subjects felt younger than their actual age.5 The discrepancy between subjective age perception and the actual age can significantly affect stereotypes connected with old age.24 It is an important aspect in the context of satisfaction with life among older adults.
A significant psychologic variable in terms of satisfaction with life, as demonstrated by existing studies, is dispositional optimism. Optimism helps improve one’s motivation to achieve set goals, fosters the belief in oneself, and contributes to developing active strategies for coping with stress. Optimism, according to Czerw, is conditioned by one’s family background. Czerw indicates that there exists a relationship between the optimism of parents and their children. Optimists are more likely to take on challenges and to be liked by others. According to Czerw, optimistic attitude to life decreases with age.25 This can be related to deficits common in old age, such as the loss of health, beauty, vitality, significant others or occupational activity, worsening of one’s financial situation or accepting the inevitable prospect of death. All these factors prevent an individual from nurturing an optimistic attitude.
This study did not show any significant differences in optimism depending on age, which clearly corresponds with findings of other authors.26 Additionally, both men and women have the same tendency to be optimistic, which corresponds to the results of the aforementioned large study (N=320).25 Zych also stressed the significance of optimism for positive aging.4
A London study conducted among older adults reported that dispositional optimism was related to self-rated health.27 In this study, dispositional optimism did not show any significant correlation with educational attainment.
Educational attainment correlated significantly with the sense of self-efficacy demonstrated by the participants of U3As, which is not consistent with the data published by Juczyński. It should be mentioned, however, that Juczyński conducted his study on a younger group of participants (33–55 years). The level of self-efficacy presented by the group of U3A participants investigated in this study can be considered highly satisfactory. High levels of self-efficacy promote achieving goals and, importantly, spur individuals into action. In this study, similar to Juczyński’s results, the level of self-efficacy did not correlate with the age and sex of the respondents.16
The importance of personal resources and self-efficacy for successful aging and satisfaction with life has also been stressed by other researchers.28
Marital status proved to be a statistically insignificant variable, as it did not have a significant impact on satisfaction with life, dispositional optimism and self-efficacy.
Kostka and Jachimowicz also demonstrated that personal resources, including dispositional optimism, determined by means of the LOT-R scale, and self-efficacy (GSES), are significant independent correlates of the quality of life in older persons of different backgrounds and varying degrees of disability and institutionalization.29 Therefore, these resources should be developed and constantly strengthened in the course of the educational process.
Some studies have found that even though the level of satisfaction with life among U3A participants lowers with age, a reverse tendency is observed in the social context, that is, the level of satisfaction with life slightly increases.30 This shows the highly beneficial effect of such institutions on the social functioning of their participants, and thus testifies to the need to promote their establishment. Moreover, U3As have been created in an endeavor to contradict the stereotype of infirmed old age and to reduce marginalization which is entirely negative in the context of satisfaction with life.8 Furthermore, this study has clearly shown that participating in U3A courses promotes establishing broader and more satisfying relationships.
According to Kurpas et al, the risk group for lower quality of life includes older women with lower income and with more chronic diseases, which is consistent with the present findings.22
A Spanish study showed that satisfaction with life among older adults was significantly affected by parameters such as support, health status, independence and income.2
The majority of U3A participants are still women, which is consistent with the reports of other authors.8,15 Women seem to be more interested in this form of education. This can be partly explained by the fact that women have longer mean life expectancy than men.
To summarize, providing an individual with support in pursuing lifelong education, starting as early as possible, should contribute to developing their sense of satisfaction with life in old age, as in this day and age, it can last two or even three decades. Continuous self-development in all stages of life should result in a gratifying level of satisfaction with life in old age. Thus, in the time of progressive aging of modern societies, more resources should be allocated to education toward successful old age. More and more people in late adulthood are able to function at a satisfactory level, which seems to be optimistic.31 Attending U3A serves as an antidote against dependence in old age and against gerontophobia.
Limitations of the study
The main limitation of the study was the fact that, because of its anonymous character, the only source of information on the respondents’ health status was the self-assessment carried out by the participants of the study. Hence, the data might be incomplete.
Implications
Gaining insight into and a better understanding of the complex determinants of satisfaction with life, including those of psychologic nature, will allow for a more holistic methodology and orientation of education toward healthy and successful old age, which should be implemented from an early age. Identifying factors which shape satisfaction with life should be helpful in setting the direction of preventive gerontology and in preparing the aging population of the world for a healthy old age.
Conclusion
A higher level of satisfaction with life among participants of U3As is significantly determined by sex (men show higher levels), satisfactory health status, lower dependency on medical care institutions, good financial situation, higher educational attainment, positive self-assessment, good relations with others, dispositional optimism and self-efficacy. Continuing self-development should be fostered from a young age by improving the level of education, promoting an attitude of responsibility for own life and health and strengthening important personal resources. A better understanding of personal resources will be helpful in identifying those individuals who are at risk of unsuccessful aging already in early stages of life. Courses organized by U3As contribute to the development of one’s personality. Participation in continuing education translates into a higher level of satisfaction with life in late adulthood. This shows that U3As, as one of the forms of continuing education, play a particularly significant role in the life of an aging individual.
It is, therefore, highly recommended that screening tests be promoted in this area, which would constitute a part of education on successful aging – in the gradually increasing global population of older adults.
Acknowledgments
This study was conducted as a part of statutory research carried out in the Department of Pedagogy and Nursing Didactics, Nicolaus Copernicus University Collegium Medicum in Bydgoszcz (subsidy number: 976/2014–2017).
Disclosure
The author reports no conflicts of interest in this work.
References
Mota-Pinto A, Rodrigues V, Botelho A, et al. A socio-demographic study of aging in the Portuguese population: the EPEPP study. Arch Gerontol Geriatr. 2011;52(3):304–308. | ||
Fernandez-Ballesteros R. Social support and quality of life among older people in Spain. J Soc Issues. 2002;58(4):645–659. | ||
Mossakowska A, Więcek A, Błędowski B. Medyczne, psychologiczne, socjologiczne i ekonomiczne aspekty starzenia się ludzi w Polsce. [Medical, psychological, sociological, and economical aspects of aging in Poland]. Poznań, Poland: Termedia; 2012. Polish. | ||
Zych A. Jak rozpoznać, zrozumieć i zaakceptować starość. [How to Know, Understand and Accept Aging]. 1st ed. Łask, Poland: Progres; 2012. Polish. | ||
Zielińska-Więczkowska H, Muszalik M, Kędziora-Kornatowska K. The analysis of aging and elderly age quality in empirical research: data based on University of the Third Age (U3A) students. Arch Gerontol Geriatr. 2012;55(1):195–199. | ||
Günder EE. Third age perspectives on lifelong learning: third age university. Procedia-Social Behav Sci. 2014;116:1165–1169. | ||
Kościńska E. Wybrane formy opieki i pomocy dla osób starszych. [Selected Forms of Care and Assistance for Seniors]. 1st ed. Bydgoszcz, Poland: Wydawnictwo Uniwersytetu Kazimierza Wielkiego; 2013. Polish. | ||
Malec M. Edukacyjne, kulturowe i społeczne konteksty starości. [Educational, Cultural and Social Context of Aging]. 1st ed. Wrocław, Poland: Wydawnictwo Oświatowe; 2011. Polish. | ||
Ericson J, Johnson GM. Internet use and psychological wellness during late adulthood. Can J Aging. 2011;30(2):197–209. | ||
Hebestreit H. The role of the University of the Third Age in meeting needs of adult learners in Victoria, Australia. Austr J Adult Learning. 2008;48:547–565. | ||
Ogińska-Bulik N, Juczyński Z. Osobowość, stres a zdrowie. [Personality, Stress and Health]. 1st ed. Warsaw, Poland: Difin; 2008. Polish. | ||
Halicka M, Pędich W. Satisfaction with life among the elderly. In: Synak B, editors. Polska starość [Polish Aging]. Gdańsk: Wydawnictwo Uniwersytetu Gdańskiego; 2002:219–230. Polish. | ||
Zielińska-Więczkowska H, Ciemnoczołowski W, Kędziora-Kornatowska K, Muszalik M. The sense of coherence (SOC) as an determinant of life satisfaction, based on own research, and exemplified by the students of University of the Third Age (U3A). Arch Gerontol Geriatr. 2012;54(1):238–241. | ||
Grodzicki T, Kocemba J, Skalska A. Geriatria z elementami gerontologii ogólnej. [Geriatrics with Elements of General Gerontology]. 1st ed. Gdańsk, Poland: Via Medica; 2006. Polish. | ||
Maniecka-Bryła I, Gajewska O, Burzyńska M, Bryła M. Factors associated with self-rated health (SRH) of a University of the Third Age (U3A) class participants. Arch Gerontol Geriatr. 2013;57(2):156–161. | ||
Juczyński Z. Narzędzia pomiaru w promocji i psychologii zdrowia. [Instruments for Measurement in Health Promotion and Health Psychology]. 2nd ed. Warsaw, Poland: Pracownia Testów Psychologicznych; 2012. Polish. | ||
Abramowska-Kmon A. Life satisfaction of the elderly in Poland in the light on the Social Diagnosis 2011. Acta Universitatis Lodziensis Folia Oeconomis. 2012;291:197–208. Polish. | ||
Neikrug SM. Worrying about a frightening old age. Aging Ment Health. 2003;7(5):326–333. | ||
Carvalho-Loures M, Celeno-Porto C, Alves-Barbosa M, Freire-Filha LG. Women’s quality of life: university of the Third Age, Goiás, Brazil. Rev Salud Pública. 2010;12(3):391–401. | ||
Aleksandre TS, Cordeiro RC, Ramos LR. Factors associated to quality of life of active in elderly. Rev Saúde Pública. 2009;43(4):613–621. | ||
Bourque P, Pushkar D, Bonneville L, Béland F. Contextual effects on life satisfaction of older men and women. Can J Aging. 2005;24(1):31–44. | ||
Kurpas D, Mroczek B, Bielska D. The correlation between quality of life, acceptance of illness and health behaviors of advanced age patients. Arch Gerontol Geriatr. 2013;56(3):448–456. | ||
Strawbridge WJ, Wallhagen MI, Cohen RD. Successful aging and well-being self-rated compared with Rowe and Kahn. The Gerontologist. 2002;42(6):727–733. | ||
Elibach RP, Mock SE, Courtney EA. Having a “senior moment”: Induced aging phenomenology, subjective age, and susceptibility to ageist stereotypes. J Exp Soc Psychol. 2010;46(4):643–649. | ||
Czerw A. Optymizm Perspektywa psychologiczna. [Optimism a Psychological Perspective]. 1st ed. Gdańsk, Poland: Gdańskie Wydawnictwo Psychologiczne; 2010. Polish. | ||
Carver CS, Scheier MF, Segerstrom SC. Optimism. Clin Psychol Review. 2010;30(7):879–889. | ||
Steptoe A, Wright C, Kunz-Ebrecht SR, et al. Dispositional optimism and health behavior in community-dwelling older people: associations with healthy aging. Br J Health Psychol. 2006;11(Pt 1):71–84. | ||
Bowling A, Iliffe S. Psychological approach to successful aging predicts future quality of life in older adults. Health Qual Life Outcomes. 2011;9:13. | ||
Kostka K, Jachimowicz V. Relationship of quality of life to dispositional optimism, health locus of control and self – efficacy in older subjects living in different environments. Qual Life Res. 2010;19(3):351–361. | ||
Sonati JG, Modeneze DM, Vilarta R, Maciel ES, Boccaletto EM, da Silva CC. Body composition and quality of life (QoL) of the elderly offered by the “University Third Age” (UTA) in Brazil. Arch Gerontol Geriatr. 2010;52(1):e31–e35. | ||
Phelan E, Larson E. “Successful aging” – Where next? J Am Geriatr Soc. 2002;50(7):1306–1308. |
 © 2017 The Author(s). This work is published and licensed by Dove Medical Press Limited. The full terms of this license are available at https://www.dovepress.com/terms.php and incorporate the Creative Commons Attribution - Non Commercial (unported, v3.0) License.
By accessing the work you hereby accept the Terms. Non-commercial uses of the work are permitted without any further permission from Dove Medical Press Limited, provided the work is properly attributed. For permission for commercial use of this work, please see paragraphs 4.2 and 5 of our Terms.
© 2017 The Author(s). This work is published and licensed by Dove Medical Press Limited. The full terms of this license are available at https://www.dovepress.com/terms.php and incorporate the Creative Commons Attribution - Non Commercial (unported, v3.0) License.
By accessing the work you hereby accept the Terms. Non-commercial uses of the work are permitted without any further permission from Dove Medical Press Limited, provided the work is properly attributed. For permission for commercial use of this work, please see paragraphs 4.2 and 5 of our Terms.