")
Back to Journals » Drug Design, Development and Therapy » Volume 10
Construction of p66Shc gene interfering lentivirus vectors and its affections on alveolar epithelial cells apoptosis induced by hyperoxia
Authors Zhang C, Dong W, Zhao S, Li Q, Kang L, Lei X, Guo L, Zhai X
Received 17 March 2015
Accepted for publication 17 April 2015
Published 16 August 2016 Volume 2016:10 Pages 2611—2622
DOI https://doi.org/10.2147/DDDT.S84820
Checked for plagiarism Yes
Review by Single anonymous peer review
Peer reviewer comments 3
Editor who approved publication: Prof. Dr. Wei Duan
Chan Zhang, Wen-Bin Dong, Shuai Zhao, Qing-Ping Li, Lan Kang, Xiao-Ping Lei, Lin Guo, Xue-Song Zhai
Department of Newborn Medicine, Affiliated Hospital of Luzhou Medical College, Luzhou, Sichuan, People’s Republic of China
Background: The aim of this study is to observe the inhibitive effects of p66Shc gene interfering lentivirus vectors on the expression of p66Shc, and to explore its effects on alveolar epithelial cells apoptosis induced by hyperoxia.
Methods: The gene sequences were cloned into the pLenR-GPH-shRNA lentiviral vector, which was selected by Genebank searches. The pLenR-GPH-shRNA and lentiviral vector packaging plasmid mix were cotransfected into 293T cells to package lentiviral particles. Culture virus supernatant was harvested, and then the virus titer was determined by serial dilution assay. A549 cells were transduced with the constructed lentiviral vectors, and real-time polymerase chain reaction (RT-PCR) and Western blot were used to evaluate p66Shc expression. This study is divided into a control group, a hyperoxia group, an A549-p66ShcshRNA hyperoxia group, and a negative lentivirus group. Cell apoptosis was detected by flow cytometry after 24 hours; the expression of X-linked inhibitor of apoptosis protein (XIAP) and caspase-9 were detected by immunohistochemistry assay. The production of reactive oxygen species and cellular mitochondria membrane potential (ΔΨm) were determined by fluorescence microscopy.
Results: We successfully established the p66Shc gene interfering lentivirus vectors, A549-p66ShcshRNA. The A549-p66ShcshRNA was transfected into alveolar epithelial cells, and the inhibitive effects on the expression of p66Shc were observed. Both RT-PCR and Western blot demonstrated downregulation of p66Shc expression in A549 cells. In the A549-p66ShcshRNA hyperoxia group, we found dampened oxidative stress. A549-p66ShcshRNA can cause p66Shc gene silencing, reduce mitochondrial reactive oxygen species generation, reduce membrane potential decrease, reduce the apoptosis of A549 cells, and reduce alveolar epithelial cell injury, while the lentiviral empty vector group had no such changes.
Conclusion: p66Shc gene interfering lentivirus vector can affect the alveolar epithelial cells apoptosis induced by hyperoxia.
Keywords: hyperoxia, alveolar epithelial cells, lentiviral vector, RNA interference, p66Shc, apoptosis
Introduction
Since the 1990s, along with the development of perinatal medicine, premature infants’ (especially in low-birth-weight infants) survival rates have improved significantly. In the course of treatment, the respiratory disorder required long-time, high-concentration and/or high-pressure oxygen inhalation, often resulting in pulmonary oxidative stress injury in the survivors and causing pulmonary failure in neonatal period and impaired lung development in infant period.
We acknowledge that most of the studies have investigated the effects of hyperoxia on death and mortality in adults. However, in recent years, there were also some reports indicating that hyperoxia also plays an important role in the death and mortality in neonates.1,2 Hyperoxia lung injury has become the most troublesome problem of the neonatal intensive-care unit (NICU) and the most common form of infantile chronic disease; it is a hot topic for research in international neonatal medical field.1,2 The exact mechanism of hyperoxia lung injury has not been fully elucidated. Animal studies show, the more the hyperoxia exposure time in neonatal rats, the more the lung cell apoptosis, as apoptosis is an important form of hyperoxia lung injury. Though the nature of pathways that lead hyperoxia to apoptosis of lung cells lacks systematic research, our previous study confirmed that oxidative stress pathway in which p66Shc participated occupied an important position in the pathogenesis of hyperoxia lung injury.3
p66Shc is a kind of proto-oncogene, coded protein, and which is also the important molecule in the life period of mammal. p66Shc is also is the juncture proteinum which has been used to research oxidative stress of cells for the past few years. The activated p66Shc is transferred into the mitochondrial respiratory chain enzyme Complex III to oxidize cytochrome C and to produce reactive oxygen species (ROS).4 Apoptotic signals activate PKCβ, which phosphorylates released p66 on S36. Phosphorylated p66 becomes a target for prolyl isomerase Pin1, which recognizes proline following phosphorylated serine residue. After isomerization PP2A dephosphorylates p66Shc, which is then transported into mitochondria. Released p66Shc acts as oxidoreductase and transfers electrons from reduced cytochrome C to oxygen.5,6
Therefore, blocking the expression of p66Shc gene reduces the cellular oxidative stress, which is expected to become an important means to reduce the lung injury induced by hyperoxia. In order to study p66Shc gene in vitro, we constructed a targeting shRNA lentiviral vector which expressed p66Shc, stably transfected it into human alveolar type II epithelial A549 cells, and inhibited the expression of p66Shc, to further investigate the apoptosis of cells mediated by p66Shc and whether the mechanism of the mitochondrial ROS production induced by hyperoxia is associated with p66Shc signal molecules.
Materials and methods
Construction of p66Shc shRNA lentivirus vector and screening
Construction was done according to the principle of RNA interference design sequence, using the siRNA design program, and designing multiple RNA interference target sequences which aim at the p66Shc gene sequence (NM-183001.4). Then, we selected the optimum kinetic parameters of three pairs of siRNA targets and one pair of siRNA with negative control by the design software. Their gene sequences were: p66Shc-Shc1: CCGCTTTGAAAGTGTCAGTCA; p66Shc-Shc2: TCAGCTACCACATGGACAATC; p66Shc-Shc3: CCGCTTTGAAAGTGTCAGTCA. These were composed into double-stranded DNA. At the same time, the pLenR-GPH vector (Western Biotechnology, Chongqing, People’s Republic of China) was sliced into linear with BamHI (Takara Bio Inc., Shiga, Japan) and EcoRI (Takara) enzyme, connected with double-stranded DNA after 1% agarose (Western Biotechnology) gel electrophoresis showing the positive bands, and was transformed into competent DH5α cells (Invitrogen, Waltham, MA, USA). After the positive clones sequence verification, lentiviral expression plasmids were generated by recombining pRsv-REV, pMDlg-pRRE, pMD2G, and pLenR-GPH (Invibio, New York, NY, USA). The pLenR-GPH plasmid can express green fluorescent protein (GFP). The siRNA was subsequently transfected into 293T cells (The Shanghai Research Institute of Chinese Academy of Sciences, Beijing, People’s Republic of China) according to the guidelines for Lipofectamine® 2000 (Invitrogen). Cells were incubated with transfection complexes for 24 hours. After incubation, cell supernatants and extracts were collected for further use. The transfection results were observed under a fluorescence microscope (Leica Microsystems, Wetzlar, Germany) 23 hours later, and the cells were collected a further 36 hours later. The ethics committee of Luzhou Medical College, Luzhou, People’s Republic of China, did not require that we apply for ethical approval for the use of these cell lines.
Construction of stably silencing p66Shc gene A549 cell line
We then concentrated the virus and infected it into A549 cells (Affiliated Hospital of Luzhou Medical College, Luzhou, People’s Republic of China). The expression of green fluorescent protein was sorted by flow cytometry (Beckman, Brea, CA, USA) after cell culture. The positive expression showed the success of the infection process. The fluorescence quantitative polymerase chain reaction (PCR) (Eppendorf, Hamburg, Germany) and the Western blot showed that the p66ShcRNA and the p66Shc protein in the infected A549 cells were decreased, and the p66Shc-Shc1 group decreased more significantly. The result showed that we have successfully established A549 cell line which stably silenced p66Shc, and hence we have selected the p66Shc-Shc1 group to enter the following experiment named p66Shc-A549.
Downregulation of p66Shc expression in A549 cells by RT-PCR
Total RNA was extracted by TRIzol reagent (Invitrogen) according to the manufacturer’s protocol. First-strand cDNA was generated using 1 μg total RNA. It was using a SYBR green I reagent kit (Takara). The change in mRNA levels was determined by the Fold change =2−ΔΔCt, ΔCt = Ct (target) – Ct (actin). p66Shc primer (Shanghai Chemical Reagent Co, Shanghai, People’s Republic of China) and actin primer (as internal control) were synthesized. The reaction conditions of PCR were as follows: pre-denaturation at 95°C for 15 seconds; denaturation at 95°C for 5 seconds; annealing at 60°C for 30 seconds; 35 cycles were completed. The mixture was denatured for 1 minute at the end of the PCR, and then cooled to 55°C, following which, the double strands of DNA were combined sufficiently. From 55°C to 95°C, the light absorption value was recorded for 4 seconds at every 0.5°C increment in temperature.
The experimental groups
The experimental cells (human lung adenocarcinoma cell line A549) was divided into four groups, including the control group, the hyperoxia group, the negative control group, and the A549-p66ShcshRNA group. The A549 cells transfected with the p66ShcshRNA lentiviral vector were considered the A549-p66ShcshRNA group. The cells with the negative control sequence were considered as the negative control group. The control group was maintained in RPMI 1640 medium (HyClone, Logan, UT, USA) supplemented with 10% fatal bovine serun (FBS) (HyClone), 100 U/mL of penicillin (Beyotime, Shanghai, People’s Republic of China), 100 μg/mL of streptomycin (Beyotime), and incubated at 37°C in a 5% CO2 environment. The remaining three groups were exposed to a mixture of O2 (950 mL/L) and CO2 (50 mL/L) for 10 minutes, then cultured in a closed environment. The cells were cultivated close together after 10 minutes hyperoxia induction and the cells were collected 24 hours after culture.
Observation of cell morphology
The cellular morphology was observed under an inverted microscope (Leica), at 12, 24, and 48 hours of treatment.
Detection of cellular apoptosis rate
Apoptosis rate in A549 cells was assessed by Annexin V-fluorescein isothiocyanate (FITC) and propidium iodide double staining (Molecular Probes®; Invitrogen). Flow cytometry was performed according to the vendor instructions. The cells were digested and washed, and approximately 1–5×10⁵ cells were collected. They were then added to a solution containing 500 μL binding buffer, 5 μL Annexin V-FITC, and 5 μL propidium iodide. The cells were incubated for 5–15 minutes at 37°C, protected from light. Flow cytometry was used for detection, measured at 488 nm excitation/530 nm emission.
Protein expression
The protein expression was evaluated by immunohistochemistry assay. Immunohistochemical studies were conducted by using the streptavidin peroxidase method. Dilution of the primary antisera was 1:150 for rabbit monoclonal antibody targeting X-linked inhibitor of apoptosis protein (XIAP)/caspase-9 (Abcam, Cambridge, MA, USA). Dilution for goat anti-rabbit IgG secondary antisera conjugated with peroxidase was 1:150. Then, the sections were developed by treatment with peroxidase substrate. Image-pro6.0 image analysis software was used to analyze the image. Later, the average optical density (AOD) was determined and was used for statistical analysis.
Detection of ROS
Confocal microscopy was used to detect the distribution of ROS (Molecular Probes®). The contents (50 μg) of one vial of MitoSOX™ mitochondrial superoxide indicator (Component A) were dissolved in 13 μL of dimethyl sulfoxide to make a 5 mM MitoSOX™ reagent stock solution. Then, the 5 mM MitoSOX™ reagent stock solution was diluted in Hank’s Balanced Salt Solution (HBSS) to make a 5 μM MitoSOX™ reagent working solution. One to two millilitres of 5 μM MitoSOX™ reagent working solution was added to cover cells adhering to coverslips. The cells were incubated for 10 minutes at 37°C, protected from light. The cells were washed gently three times with warm buffer. The cells were stained with counterstains as desired and mounted in warm buffer for imaging. ROS production was measured at 510 nm excitation/580 nm emission. Image-pro6.0 image analysis software was used to analyze the image to determine the AOD.
Detection of cellular mitochondria membrane potential (ΔΨm)
The ΔΨm was measured by staining the cells with fluorescent probes (JC-1). The 5 μg/mL JC-1 mitochondrial membrane potential sensor was added to the culture dish, then it was incubated at 37°C for 20 minutes, protected from light. Cells were then soaked in 1 mL of prewarmed incubation buffer. Confocal laser scanning microscopy was used for detection. Fluorescence was measured at 530 nm excitation/590 nm emission. Image-pro6.0 image analysis software was used to analyze the image. To determine the AOD value, the AOD method was used for statistical analysis.
Statistical analysis
Data were processed using SPSS version 19.0 statistical software (IBM, Armonk, NY, USA). Quantitative data were expressed as the mean ± standard deviation. One-way Analysis of Variance (ANOVA) was performed for comparisons between different groups, and then data were processed by the post hoc Scheffe’s test. Least squares difference Student’s t-tests were used for pair-wise comparisons. The difference was significant at alpha values of P<0.05.
Results
Identification of recombinant plasmid and packing of lentivirus
The recombinant plasmid was cut by restriction endonuclease KpnI (in 4,290 bp) and EcoRI (in 4,620 bp), then observed by agarose gel electrophoresis. The empty vector fragment sequence is 331 bp, and the recombinant vector fragment sequence is 392 (or 396) bp. Electrophoresis result showed that bands of positive clones were located between 250 bp and 500 bp (Figure 1A); the recombinant vector was successfully constructed.
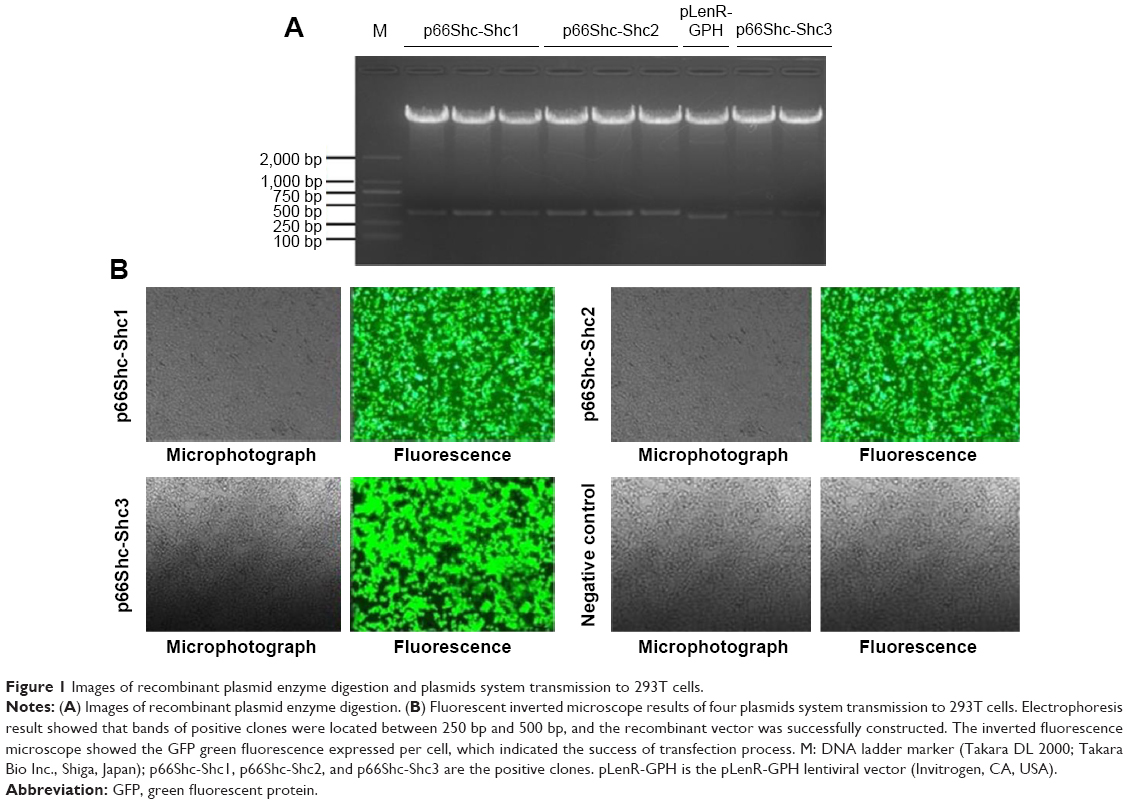 | Figure 1 Images of recombinant plasmid enzyme digestion and plasmids system transmission to 293T cells. |
Packing of lentivirus
DNA solutions of packaging system were prepared, transformed into the competent 293T cells, cultured for 24 hours, and then the supernatant of virus was collected by high-speed centrifuge. The expression of GFP green fluorescence was detected under inverted fluorescence microscope (Leica). The inverted fluorescence microscope showed the GFP green fluorescence expressed per cell (Figure 1B), which indicated the success of transfection process. For the negative control cells, no GFP green fluorescence was found even under the fluorescence microscope (Figure 1B).
Detection of interference efficiency
Virus was concentrated and infected into the A549 cells. The inverted fluorescence microscope showed the infection success. The interference efficiency was evaluated by using the fluorescence quantitative PCR and the western blot assay.
The Δ2-ΔCt methods were used to calculate the fluorescence quantitative PCR data. Values are means ± standard error (SE) (N=5 in each group). Compared with normal A549 cells (0.046±0.003) and A549 cells infected by empty vector (0.042±0.001), the p66Shc mRNA of A549 cells in p66Shc-Shc1 group (0.014±0.003), p66Shc-Shc2 group (0.030±0.001), and p66Shc-Shc3 group (0.023±0.002) were significantly decreased. The Shc1 group decreased most significantly (Figure 2A). Image-pro6.0 image analysis software was used to analyze the Western blot image. Then we determined the AOD and used the AOD for statistical analysis. Values are means ± SE (N=5 in each group). Compared with normal A549 cells (1.27±0.027) and A549 cells infected by empty vector (1.24±0.019), the p66Shc protein expression of A549 cells in p66Shc-Shc1group (0.39±0.013), p66Shc-Shc2 group (0.54±0.030), and p66Shc-Shc3 group (0.58±0.031) were significantly decreased. The Shc1 group decreased most obviously (Figure 2B). The result showed we have successfully established A549 cell line which stably silenced p66Shc, and we selected the p66Shc-Shc1 group to enter the following experiment named p66Shc-A549.
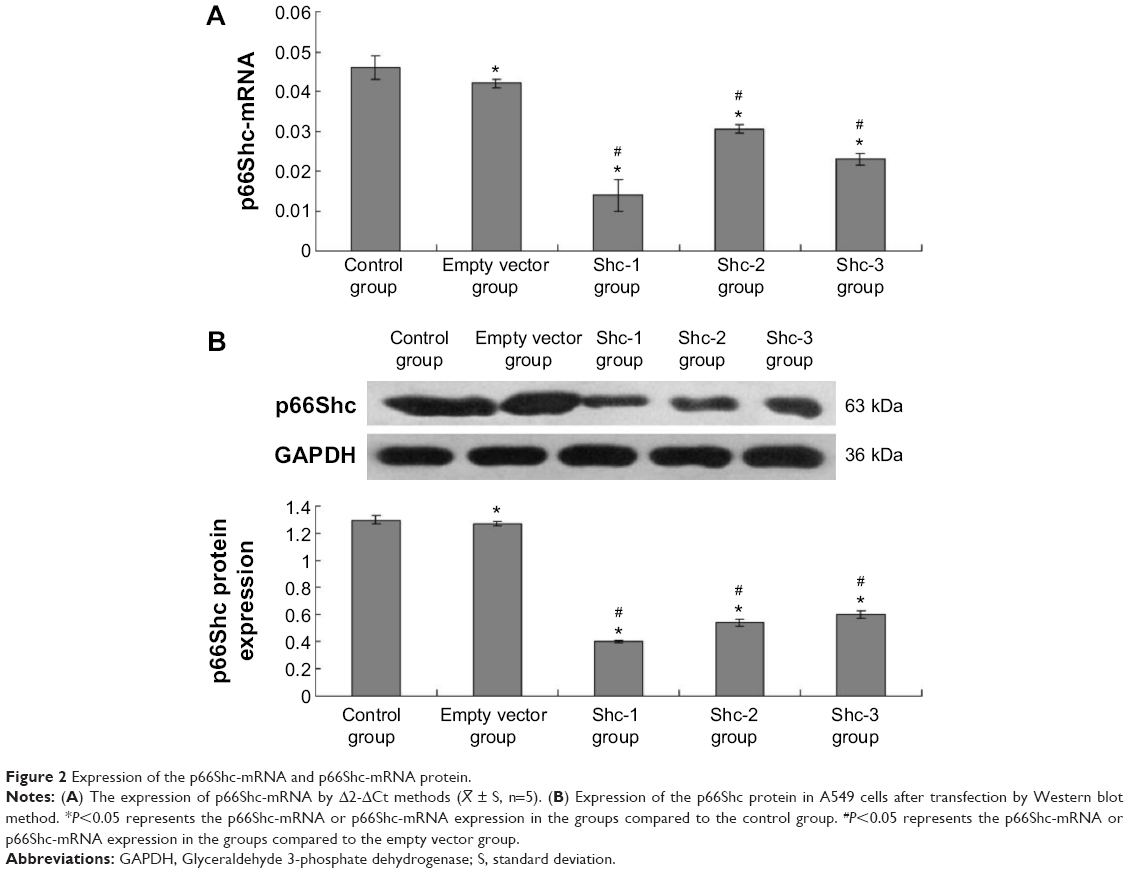 | Figure 2 Expression of the p66Shc-mRNA and p66Shc-mRNA protein. |
 ± S, n=5). (B) Expression of the p66Shc protein in A549 cells after transfection by Western blot method. *P<0.05 represents the p66Shc-mRNA or p66Shc-mRNA expression in the groups compared to the control group. #P<0.05 represents the p66Shc-mRNA or p66Shc-mRNA expression in the groups compared to the empty vector group.
Observation of cell morphology
The cellular morphology was observed under inverted microscope at 12, 24, and 48 hours of treatment. Compared to the control group, the cellular morphology of A549 in hyperoxia group and the negative control group changed to spherical shapes and space between cells increased, the living cell count decreased, and suspension cell increased. The living cell count in the A549-p66ShcshRNA group increased and suspension cell decreased compared with those in the hyperoxia group, but did not reach the levels of the control group (Figure 3).
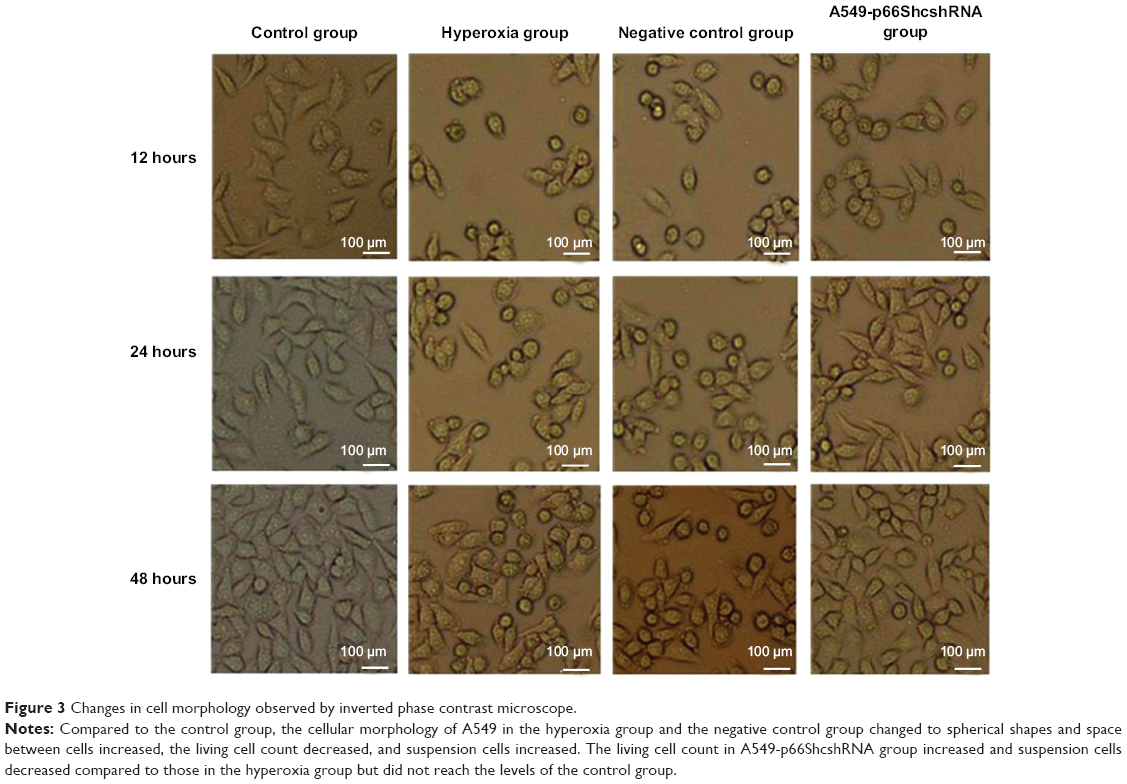 | Figure 3 Changes in cell morphology observed by inverted phase contrast microscope. |
Apoptosis in the alveolar epithelial cells
Apoptosis rate was assessed by flow cytometry (Figure S1, Figure 4A). Values are means ± SE (N=5 in each group). In control group (2.76%±1.08%), the apoptotic cells were low. In comparison to control, apoptotic cells were increased in the hyperoxia group (24.48%±2.25%) and the negative control group (25.8%±2.53%) (P<0.05). Compared with the hyperoxia group, apoptotic cells were decreased in the hyperoxia-exposed alveolar epithelial cells in the A549-p66ShcshRNA group (12.8%±1.92%) (P<0.05), but not restored at the level of the control group. This suggests that hyperoxia-exposed cells significantly increased apoptosis rate of the alveolar epithelial cells and that p66Shc lentiviral vector, a p66Shc-specific inhibitor, can reduce apoptosis rate of the alveolar epithelial cells in a state of oxidant stress.
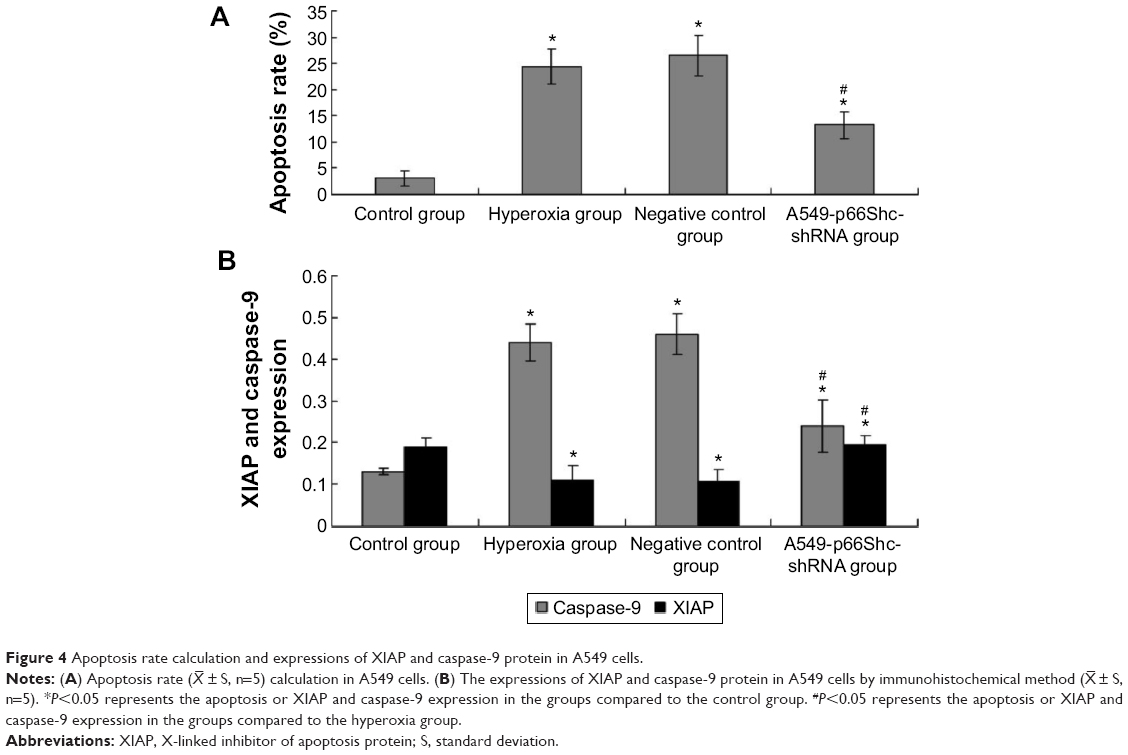 | Figure 4 Apoptosis rate calculation and expressions of XIAP and caspase-9 protein in A549 cells. |
 ± S, n=5). *P<0.05 represents the apoptosis or XIAP and caspase-9 expression in the groups compared to the control group. #P<0.05 represents the apoptosis or XIAP and caspase-9 expression in the groups compared to the hyperoxia group.
XIAP/caspase-9 expression
XIAP, caspase-9 expression was evaluated by immunohistochemical procedures (Figure S2, Figure 4B). The XIAP and caspase-9 localized mainly in the cytoplasm. Image-pro6.0 image analysis software was used to analyze the image. Then, the AOD was determined, and was used for statistical analysis. Values are means ± SE (N=5 in each group). In control group, expression of XIAP was quite high (0.185±0.012). Compared with the control group, the XIAP expression was significantly decreased in the hyperoxia-exposed alveolar epithelial cells after 24 hours in hyperoxia group (0.115±0.032) and the negative control group (0.117±0.024) (P<0.05). Compared with the hyperoxia group, XIAP expressions were increased in the hyperoxia-exposed alveolar epithelial cells after 24 hours in the A549-p66ShcshRNA group (0.136±0.011) (P<0.05), but not restored at the level of the control group. Compared with the control group, the caspase-9 expression was significantly increased in the hyperoxia-exposed alveolar epithelial cells after 24 hours in hyperoxia group (0.44±0.038) and the negative control group (0.46±0.042) (P<0.05). Compared with the hyperoxia group, caspase-9 expressions were significantly decreased in the hyperoxia-exposed alveolar epithelial cells after 24 hours in the A549-p66ShcshRNA group (0.24±0.054) (P<0.05), but not restored at the level of the control group. This suggests that hyperoxia-exposed cells significantly increase expression of caspase-9 and decrease expression of XIAP. Also, p66Shc-specific inhibitor p66Shc lentiviral vector can reduce the expression of caspase-9 and increase the expression of XIAP in a state of oxidant stress.
ROS production in mitochondria in the alveolar epithelial cells
ROS production was measured using the ROS-sensitive vital dye MitoSOX™ Red. Image-pro6.0 image analysis software was used to analyze the image. Then the AOD was determined, and was used for statistical analysis. Values are means ± standard error of mean (SEM) (N=5 in each group). In the control group, the alveolar epithelial cells produce little ROS (0.025±0.016). In comparison to control, alveolar epithelial cells produce more ROS in the hyperoxia group (0.042±0.021) and the negative control group (0.042±0.023). Compared with the hyperoxia group, alveolar epithelial cells were decreased in the hyperoxia-exposed alveolar epithelial cells in the A549-p66ShcshRNA group (0.034±0.011) (P<0.01), but not restored at the level of the control group (Figure 5A). Compared with the control group, the production of ROS in the mitochondria of A549 cells was significantly increased in the hyperoxia group and the negative control group (P<0.01). But, compared with the hyperoxia group the production of ROS in the mitochondria of A549 cells was obviously decreased in the A549-p66ShcshRNA group (P<0.05). This suggests that the hyperoxia-exposure significantly increased the intracellular ROS. Also, p66Shc lentiviral vector, a p66Shc-specific inhibitor, can reduce the intracellular ROS in a state of oxidant stress.
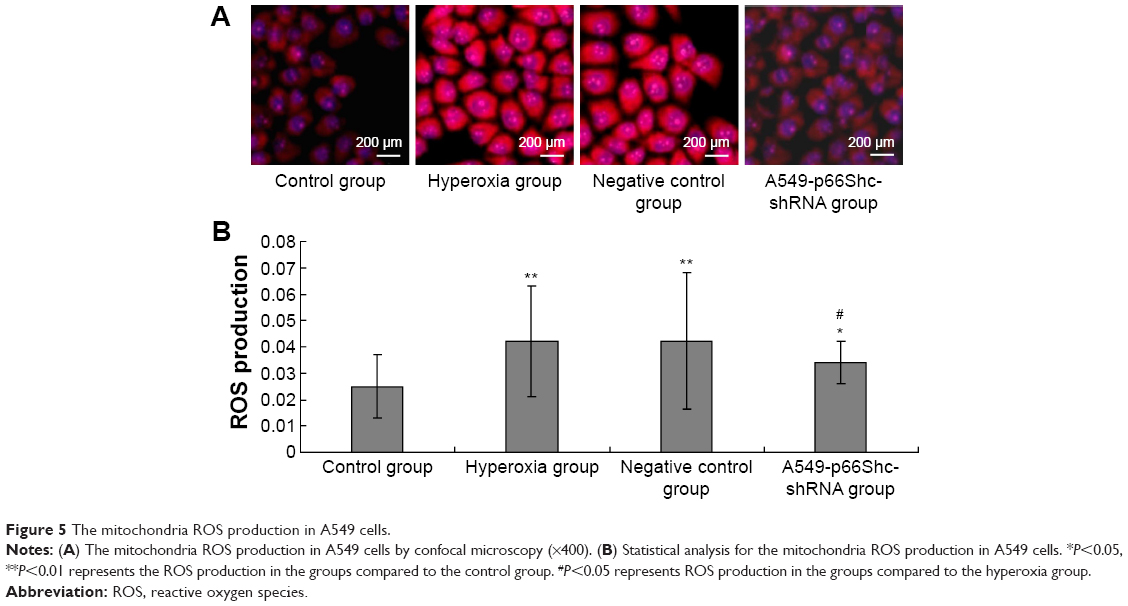 | Figure 5 The mitochondria ROS production in A549 cells. |
Detection of cellular ΔΨm
The ΔΨm was measured by staining the cells with fluorescent probes (JC-1). When the mitochondrial membrane potential decreases, it can produce green fluorescence in 530 nm emission wavelength. And when the mitochondrial membrane potential increases, it can produce red fluorescence in 590 nm emission wavelength. JC-1 red fluorescence (590 nm) and green fluorescence (530 nm) ratio (red/green) can be properly identified as the cell mitochondrial membrane potential height. The samples use confocal laser scanning microscopy for detection. Image-pro6.0 image analysis software was used to analyze the image. Next, the AOD was determined and was used for statistical analysis. Values are means ± SE (N=5 in each group). In the hyperoxia group, mitochondrial membrane potential decreased significantly (0.043±0.003), JC-1 red/green fluorescence ratio decreased, whereas in the negative control group (0.046±0.003) remained the same. Compared to the hyperoxia group, the mitochondrial membrane potential was slightly higher in A549-p66ShcshRNA group (0.065±0.004), JC-1 red/green fluorescence ratio increased, but did not reach the level of the control group (0.089±0.002) (Figure 6A).
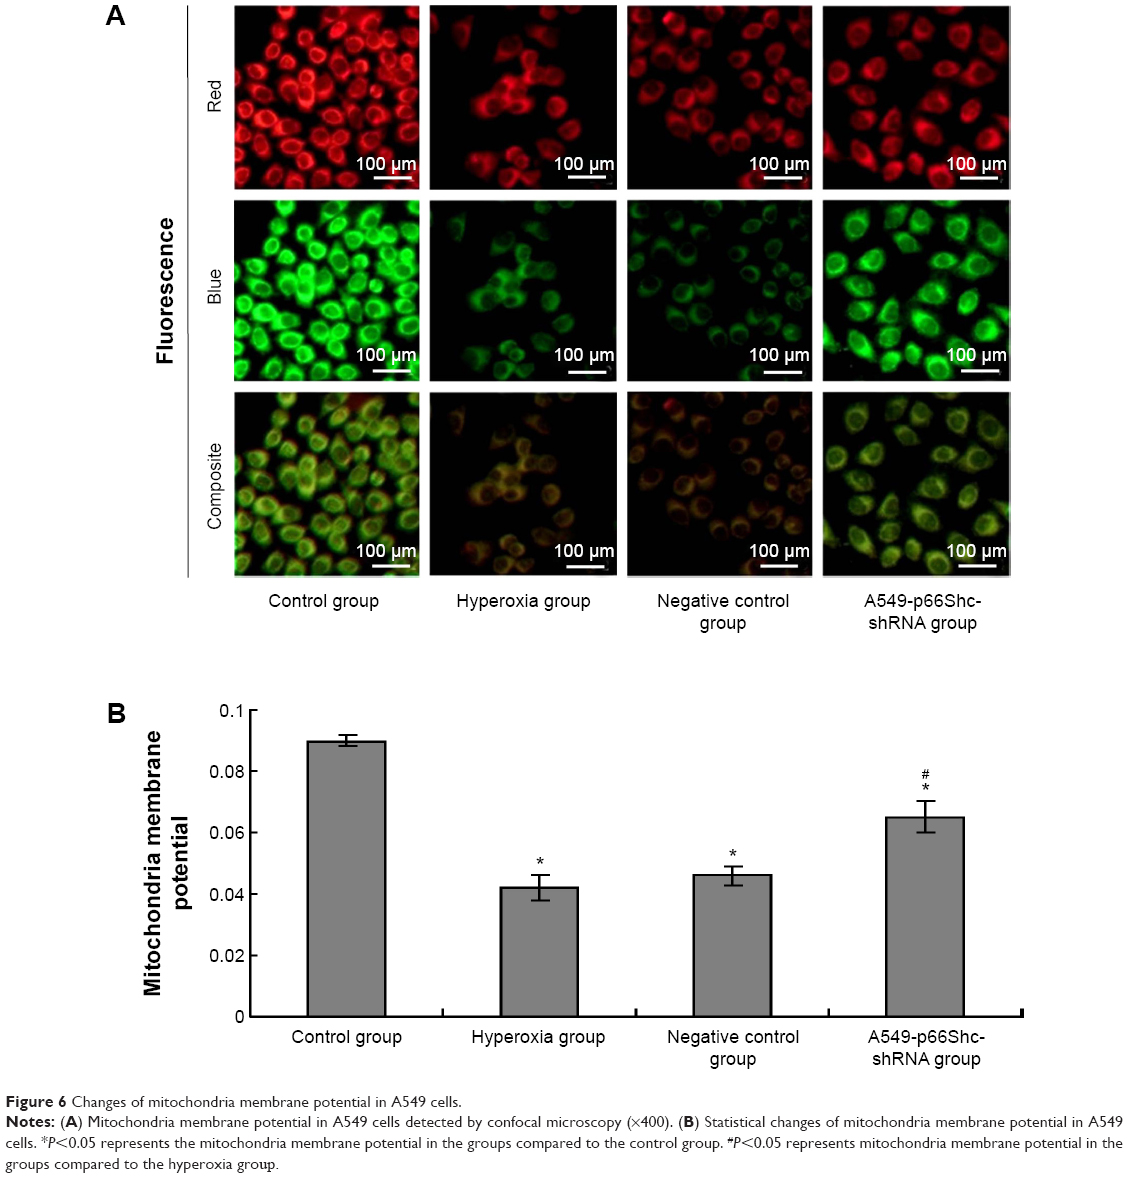 | Figure 6 Changes of mitochondria membrane potential in A549 cells. |
In hyperoxia group, mitochondrial membrane potential decreased significantly (0.043±0.003), JC-1 red/green fluorescence ratio decreased, whereas in the negative control group (0.046±0.003) remained the same, compared to the control group (P<0.05). Compared with hyperoxia group, the mitochondrial membrane potential was slightly higher in A549-p66ShcshRNA group (0.065±0.004) (Figure 6B, P<0.05), also JC-1 red/green fluorescence ratio was also increased, but did not reach the level of the control group (0.089±0.002).
Discussion
The identification of the mutations that lead to the prolongation of the lifespan of various model organisms shows that aging can be considered as a genetic program.7 One of these genes is p66Shc, the deletion of which results in a 30% increase in the lifespan. It is important to note that mice knocked out for p66Shc, in comparison with other mouse models with a prolonged lifespan, are fertile and exhibit a normal phenotype.8 These mice are resistant to oxidative stress and age-related pathologies such as atherosclerosis,9 endothelial disorders,10 AGE (advanced glycation end products)-dependent glomerulopathy related to diabetes mellitus,11,12 and ethanol-induced liver affection.13 Further study of this phenomenon shows that intracellular ROS production decreased, active oxygen dependence of electron channel open decreased, and cell apoptosis reduced. Our preliminary results indicated that the actual oxygen level in the cells exposed to hyperoxia also achieved to the level of 93% to 95% (data not shown), which was consistent with the general level of oxygen in neonatal intensive care unit (NICU).
The previous studies14,15 indicated that exposure of mice to hyperoxia in the early neonatal period disrupts normal lung development as evidenced by the morphometric changes of increased septal wall thickness and arrested alveologenesis. Some studies16,17 also showed that the induction of the host inflammatory response was enhanced with exposure to hyperoxia. Therefore, it is important to study the hyperoxia-induced injury. In following studies we would explore in depth the application of the p66Shc gene interfering lentivirus vectors in alveolar epithelial cells apoptosis induced by hyperoxia. Although the previous studies have also investigated the therapeutic approach in current understanding of the hyperopia-induced injury, the therapeutic effects were not effective. Our preliminary study proved the effectively therapeutic methods, and would add new knowledge for the hyperopia induced injury. The clinical experiments would also be performed in patients, and this method would be applied to the clinical for patients.
Actually, in this study, we have performed the other experiments at all of the 12, 24 and 48 hours in the preliminary experiments. However, we found that all of the results were optimal or better at 24 hours. Therefore, we selected 24 hours as the optimal time point to perform our study.
p66Shc-mediated oxidative stress is assumed to be the key factor in these experimental models of apoptosis. p66Shc post-translational modifications play an important role in oxidative stress. The specific mechanism is that high-concentration oxygen leads to the activation of PKCβ, which then induces Ser36-phosphorylation of p66Shc.18 The p66Shc phosphorylation could be recognized by Pin1, and translocation into the mitochondria. On the role of protein phosphatase 2A (protein Phos phatase2A, PP2A) which could reduce phosphorylation, and translocate into the mitochondrial, overexpression of p66Shc in mitochondrial increased intracellular ROS production in mitochondrial.
Nucleic acid monomers cannot get into the nucleus effectively; therefore, we used the RNA interference method to study p66Shc gene function in vitro, which can provide basis and means for gene therapy of some human diseases.15 We also used the lentivirus to transcript RNA to DNA.16 Its species characteristic is the integration of its own genome into the target cell in the no splitting target cells.21–24
Although we have performed a detailed study for the effects of p66Shc gene interfering lentivirus vectors on hyperoxia-induced apoptosis, our study also had a few weaknesses. The biggest weakness was that our experiment was performed in vitro only. In following studies, we would perform the related experiments in an in vivo model, and would also be applied to the clinical trials.
Hyperoxia could induce intracellular p66Shc high expression, phosphorylation, turn into mitochondria, and increase mitochondrial ROS generation decrease the membrane potential. We constructed targeting shRNA lentiviral vector which expressed p66Shc, transfected it into human alveolar type II epithelial A549 cells by RNA interference, which can cause p66Shc gene silencing, reduce mitochondrial ROS generation, reduce membrane potential decrease, reduce the apoptosis of A549 cells, and reduce alveolar epithelial cell injury. This has laid the foundation for the treatment of hyperoxic lung injury in neonates.
Disclosure
The authors report no conflicts of interest in this work.
References
Li LF, Liao SK, Ko YS, Lee CH, Quinn DA. Hyperoxia increases ventilator-induced lung injury via mitogen-activated protein kinases: a prospective, controlled animal experiment. Crit Care. 2007;11(1):R25. | ||
Tang PS, Mura M, Seth R, Liu M. Acute lung injury and cell death: how many ways can cells die? Am J Physiol Lung Cell Mol Physiol. 2008;294(4):L632–L641. | ||
Che ZL, Dong WB, Li QP. The role of PKCβ/p66Shc oxidative stress signal pathway in mediating alveolar epithelial cells apoptosis induced by hyperoxia. J Clin Pediatrics. 2013;11:1066–1069. | ||
Gertz M, Steegborn C. The lifespan-regulator p66Shc in mitochondria: redox enzyme or redox sensor? Antioxid Redox Signal. 2010;13(9):1417–1428. | ||
Orsini F, Migliacci OE, Moroni M, et al. The life span determinant p66Shc localizes to mitochondria where it associates with mitochondrial heat shock protein 70 and regulates trans2 membrane potential. J Biol Chem. 2004;279(24):25689–225695. | ||
Pinton P, Rimessi A, Marchi S, et al. Protein kinase C and prolylisomerase 1 regulate mitochondrial effects of the life span determinant p66Shc. Science. 2007;315(5812):659–663. | ||
Longo VD, Mitteldorf J, Skulachev VP. Programmed and altruistic ageing. Nat Rev Genet. 2005;6(11):866–872. | ||
Migliaccio E, Giorgio M, Mele S, et al. The p66shc adaptor protein controls oxidative stress response and life span in mammals. Nature. 1999;402(6759):309–313. | ||
Napoli C, Martin-Padura I, de Nigris F, et al. Deletion of the p66Shc longevity gene reduces systemic and tissue oxidative stress, vascular cell apoptosis, and early atherogenesis in mice fed a high-fat diet. Proc Natl Acad Sci U S A. 2003;100(4):2112–2116. | ||
Camici GG, Schiavoni M, Francia P, et al. Genetic deletion of p66(Shc) adaptor protein prevents hyperglycemia-induced endothelial dysfunction and oxidative stress. Proc Natl Acad Sci U S A. 2007;104(12):5217–5222. | ||
Menini S, Amadio L, Oddi G, et al. Deletion of p66Shc longevity gene protects against experimental diabetic glomerulopathy by preventing diabetes-induced oxidative stress. Diabetes. 2006;55(6):1642–1650. | ||
Menini S, Iacobini C, Ricci C, et al. Ablation of the gene encoding p66Shc protects mice against AGE-induced glomerulopathy by preventing oxidant-dependent tissue injury and further AGE accumulation. Diabetologia. 2007;50(9):997–2007. | ||
Koch OR, Fusco S, Ranieri SC, et al. Role of the life span determinant P66(shcA) in ethanol-induced liver damage. Lab Invest. 2008;88(7):750–760. | ||
Warner BB, Stuart LA, Papes RA, Wispe JR. Functional and pathological effects of prolonged hyperoxia in neonatal mice. Am J Physiol. 1998;275(1):L110–L117. | ||
Hilgendorff A, Reiss I, Ehrhardt H, Eickelberg O, Alvira CM. Chronic lung disease in the preterm infant: lessons learned from animal methods. Am J Respir Cell Mol Biol. 2014;50(2):233–245. | ||
Bhandari V. Hyperoxia-derived lung damage in preterm infants. Semin Fetal Neonatal Med. 2010;15(1):223–229. | ||
Hillman NH, Polglase GR, Pillow JJ, Saito M, Kallapur SG. Inflammation and lung maturation from stretch injury in preterm fetal sheep. Am J Physiol Lung Cell Mol Physiol. 2011;300(1):L232–L241. | ||
Pinton P, Rimessi A, Marchi S, et al. Protein kinase C beta and prolyl isomerase 1 regulate mitochondrial effects of the life-span determinant p66Shc. Science. 2007;315(5812):659–663. | ||
Milhavet O, Gary DS, Mattson MP. RNA interference in biology and medicine. Pharmacol Rev. 2003;55(4):629–648. | ||
Miller AD, Miller DG, Garcia JV. Use of retroviral vectors for gene transfer and expression. Methods Enzymol. 1993;217(3):581–599. | ||
Lewis P, Hensel M, Emerman M. Human immunodeficiency virus infection of cells arrested in the cell cycle. EMBO J. 1992;11(8):3053–3058. | ||
Lewis PF, Emerman M. Passage through mitosis is required for oncoretroviruses but not for the human immunodeficiency virus. J Virol. 1994;68(1):510–516. | ||
Naldini L. Lentiviruses as gene transfer agents for delivery to non-dividing cells. Curr Opin Biotechnol. 1998;9(5):457–463. | ||
Naldini L, Blomer U, Gallay P. In vivo gene delivery and stable transduction of nondividing cells by a lentiviral vector. Science. 1996;272(5259):263–267. |
Supplementary materials
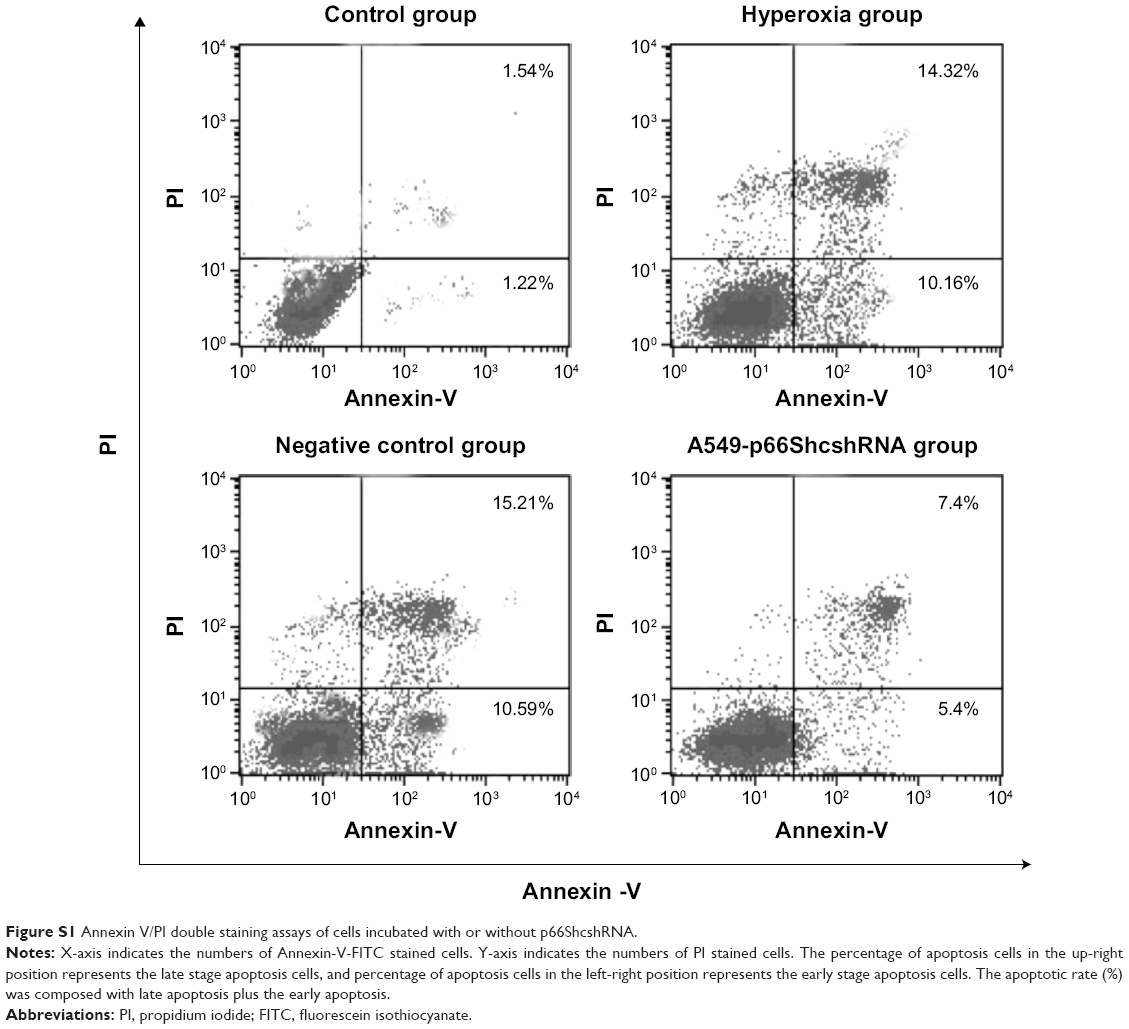 | Figure S1 Annexin V/PI double staining assays of cells incubated with or without p66ShcshRNA. |
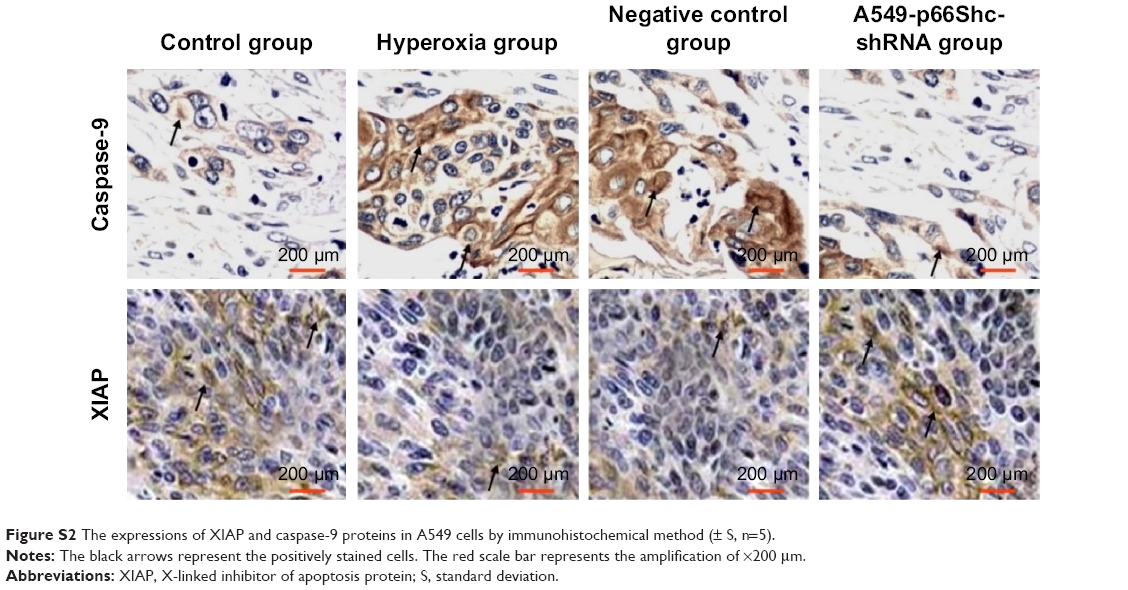 | Figure S2 The expressions of XIAP and caspase-9 proteins in A549 cells by immunohistochemical method (± S, n=5). |
 © 2016 The Author(s). This work is published and licensed by Dove Medical Press Limited. The full terms of this license are available at https://www.dovepress.com/terms.php and incorporate the Creative Commons Attribution - Non Commercial (unported, v3.0) License.
By accessing the work you hereby accept the Terms. Non-commercial uses of the work are permitted without any further permission from Dove Medical Press Limited, provided the work is properly attributed. For permission for commercial use of this work, please see paragraphs 4.2 and 5 of our Terms.
© 2016 The Author(s). This work is published and licensed by Dove Medical Press Limited. The full terms of this license are available at https://www.dovepress.com/terms.php and incorporate the Creative Commons Attribution - Non Commercial (unported, v3.0) License.
By accessing the work you hereby accept the Terms. Non-commercial uses of the work are permitted without any further permission from Dove Medical Press Limited, provided the work is properly attributed. For permission for commercial use of this work, please see paragraphs 4.2 and 5 of our Terms.