")
Back to Journals » Cancer Management and Research » Volume 10
Confirmed value of shear wave elastography for ultrasound characterization of breast masses using a conservative approach in Chinese women: a large-size prospective multicenter trial
Authors Lin X, Chang C, Wu CJ, Chen Q, Peng YL, Luo BM, Tang LN, Li J, Zheng JH, Zhou RH, Cui GH, Li A , Wang XM , Qian LX , Zhang JX, Wen CY , Gay J , Zhang HL , Li AH , Chen YL
Received 19 May 2018
Accepted for publication 10 August 2018
Published 11 October 2018 Volume 2018:10 Pages 4447—4458
DOI https://doi.org/10.2147/CMAR.S174690
Checked for plagiarism Yes
Review by Single anonymous peer review
Peer reviewer comments 3
Editor who approved publication: Dr Kenan Onel
Xi Lin,1 Cai Chang,2,3 Changjun Wu,4 Qin Chen,5 Yulan Peng,6 Baoming Luo,7 Lina Tang,8 Jing Li,9 Jihui Zheng,10 Ruhai Zhou,11 Guanghe Cui,12 Ao Li,13 Xuemei Wang,14 Linxue Qian,15 Jianxing Zhang,16 Chaoyang Wen,17 Joel Gay,18 Huili Zhang,18 Anhua Li,1 Yaling Chen2,3
1State Key Laboratory of Oncology in Southern China, Department of Ultrasound, Sun Yat-Sen University Cancer Center, Guangzhou 510060, P. R. China; 2Department of Ultrasound, Fudan University Shanghai Cancer Center, Shanghai 200032, P. R. China; 3Department of Oncology, Shanghai Medical College, Fudan University, Shanghai 200032, P. R. China; 4Department of Ultrasound, First Affiliated Hospital of Harbin Medical University, Harbin 150001, P. R. China; 5Department of Ultrasound, Sichuan Academy of Medical Sciences, Sichuan Provincial People’s Hospital, Chengdu 610072, P. R. China; 6Department of Ultrasound, West China Hospital of Sichuan University, Chengdu 610041, P. R. China; 7Department of Ultrasound, Sun Yat-Sen Memorial Hospital, Sun Yat-Sen University, Guangzhou 510235, P. R. China; 8Department of Ultrasound, Fujian Provincial Cancer Hospital, Fuzhou 350014, P. R. China; 9Department of Ultrasound, Shengjing Hospital of China Medical University, Shenyang 110004, P. R. China; 10Department of Ultrasound, The Fourth Affiliated Hospital of China Medical University, Shenyang 110032, P. R. China; 11Department of Ultrasound, Yinzhou Hospital Affiliated to Medical School of Ningbo University, Ningbo 315040, P. R. China; 12Department of Ultrasound, Binzhou Medical University Hospital, Binzhou 256603, P. R. China; 13Department of Ultrasound, Jiangsu Province Hospital, Nanjing 210029, P. R. China; 14Department of Ultrasound, The First Hospital of China Medical University, Shenyang 110001, P. R. China; 15Department of Ultrasound, Beijing Friendship Hospital of Capital Medical University, Beijing 100050, P. R. China; 16Department of Ultrasound, Guangdong Provincial Hospital of Traditional Chinese Medicine, Guangzhou 510120, P. R. China; 17Department of Ultrasound, First Affiliated Hospital of PLA General Hospital, Beijing 100037, P. R. China; 18Supersonic Imagine, Aix-en-Provence, France
Purpose: This study aimed to investigate the value of shear wave elastography (SWE) for characterization of breast masses in a Chinese population.
Patients and methods: Two thousand two hundred seventy-three women consented to be prospectively enrolled for the characterization of breast masses with ultrasound and SWE. Breast masses were known from symptoms, palpability, and/or previous imaging screening with mammography and/or ultrasound. Correlation of SWE qualitative and quantitative features with malignancy risk and impact on diagnostic performance of combining SWE features were assessed, and the Breast Imaging Reporting and Data System (BI-RADS) scoring was calculated using histopathology as reference.
Results: Data of 2,262 masses (median size: 13 mm; range: 1.3–50) from 2,262 patients (median age: 43 years; range: 18–91) were investigated, of which 752 (33.3%) were malignant. Sensitivity and specificity of BI-RADS diagnosis were 97.5% (733/752) and 54.8% (827/1,510), respectively. By logistic regression, the combination of maximum elasticity (Emax) measurements with BI-RADS assessments increased the area under the receiver operating characteristic curve from 0.908 (95% CI: 0.896–0.920) to 0.954 (95% CI: 0.944–0.962). Using Emax of 30 kPa or lower to selectively downgrade BI-RADS 4a masses to follow-up, and Emax of 160 kPa or higher to selectively upgrade BI-RADS 3 lesions to biopsy, specificity significantly increased from 54.8% (827/1,510) to 66.1% (998/1,510) (P<0.001) while sensitivity decreased nonsignificantly from 97.5% (733/752) to 96.9% (729/752) (P=0.2891). Positive predictive value for biopsy recommendation increased from 51.7% (733/1,417) to 58.7% (729/1,241) (P<0.001).
Conclusion: Adding SWE maximum stiffness to BI-RADS 3 and BI-RADS 4a breast masses in a Chinese population increased significantly the specificity of breast ultrasonography, without significant change in sensitivity.
Keywords: breast cancer, shear wave elastography, ultrasound, multicenter
Introduction
Ultrasonography (US) has become an indispensable tool in breast imaging. Morphologic descriptors of a given lesion seen on grayscale imaging were standardized by the American College of Radiology (ACR) with the Breast Imaging Reporting and Data System (BI-RADS)-US lexicon.1 The major advantages of this system are improved reliability and reproducibility of cancer risk assessment,2,3 high sensitivity (at least 90%), and negative predictive value (NPV; at least 90%) for breast cancer. However, it causes a high incidence of false-positive BI-RADS 4a, which leads to unnecessary biopsy.4,5
Mammography is the imaging modality of preference for breast cancer screening, although its sensitivity may decrease to 30%–48% in women with dense breasts,6,7 leading to insufficient screening accuracy in Asian populations including Chinese.8,9 The Japan Strategic Anti-cancer Randomized Trial (J-START) reported that US could offer a low cost way to increase the detection of early breast cancer.10 Another multicenter randomized trial revealed that US was superior to mammography for breast cancer screening in high-risk Chinese women.11
Breast US elastography has become a routine tool in addition to diagnostic US, enabling an increase in specificity by selectively reconsidering biopsy for low suspicion, BI-RADS 4a lesions.12 US elastographic evaluation has been incorporated into the second edition of the BI-RADS-US lexicon,1,13 and the Korean Society for Ultrasound in Medicine published its guidelines for the use of breast elastography.14
ShearWave™ Elastography (SWE™) is commercially available on the Aixplorer® general purpose ultrasound system (SuperSonic Imagine, Aix-en-Provence, France). SWE can provide qualitative and quantitative elastic information in real time and has proven to be highly reproducible.15
The clinical utility of SWE in ultrasonic diagnosis of breast lesions was demonstrated in previous studies, including the transatlantic BE1 study, the prospective multicenter, multinational study with the largest sample size published so far based on American and European population.16–19 It is concluded that adding SWE features, and especially maximum stiffness evaluation to US grayscale imaging could significantly reduce the number of false-positive cases, leading to a specificity increase from 61.1% to 78.5% without any loss in sensitivity. The clinical utility of SWE for ultrasound diagnosis of breast lesions in Asian populations has only been studied in single-center studies to date. The purpose of this prospective multicenter study was to validate the added value of SuperSonic Imagine SWE as proposed by Berg et al for the characterization of breast masses in a Chinese population.16
Patients and methods
This prospective Health Insurance Portability and Accountability Act (HIPAA)-compliant study protocol (www.clinicaltrials.gov, NCT02226081), funded by SuperSonic Imagine, was approved by Shanghai Fudan Medical University Chinese Ethics Committee (#1405135-3) and conducted from June 2014 to June 2015 in 16 Chinese mainland hospitals. There were 80 investigators in this study who were ultrasound specialists with a minimum experience of 4,000 breast ultrasound cases in the preceding 2 years, and they had a minimum training phase of 20 SWE examinations supervised by SuperSonic Imagine staff.
Ethics, consent, and permission
This study was approved by Shanghai Fudan Medical University Chinese Ethics Committee (#1405135-3). All procedures performed in studies involving human participants were in accordance with the ethical standards of the institutional and national research committee and with the 1964 Declaration of Helsinki and its later amendments or comparable ethical standards. Written informed consent was obtained from all individual participants included in the study.
Consent for publication
Written informed consent for the publication of these details was obtained from all participants.
Patients
Consecutive female patients of at least 18 years of age deriving from diagnosis who gave written informed consent were recruited and received SWE examinations free of charge. Breast lesions classified BI-RADS 2, 3, 4, or 5 had to be visible on ultrasound. Exclusion criteria included inability to give written informed consent, lesions previously treated or biopsied, multiple lesions, pregnant or breastfeeding women, breast lesions classified as BI-RADS 0 or 6, and women with previous ipsilateral breast surgery and/or with breast implants (More details in Supplementary material).
Data collection
Ultrasound examination
Ultrasound examinations were performed on Aixplorer ultrasound imaging system (SuperSonic Imagine) using the SL15-4 transducer in two orthogonal planes by one of two sonographers with over 10 years’ experience in breast imaging. Ultrasound characterization was performed according to the BI-RADS: Ultrasound lexicon.1 Lesion size was defined as the largest dimension of the maximum diameters measured in both scanning planes.
Three SWE acquisitions of three frozen frames were acquired following the manufacturer recommendations in both scanning planes, using the default maximum color scale of 180 kPa (7.7 m/second). Images were evaluated collectively by two principle investigators who were blinded to each other’s findings. Another experienced sonographer was invited to discuss and finally reach a consensus when the two principle investigators did not reach agreement.
Lesion maximum diameter on SWE images was measured encompassing the entire lesion on B-mode images and any stiffness halo immediately adjacent. Qualitative and quantitative SWE features were assessed.16,20
Qualitative features
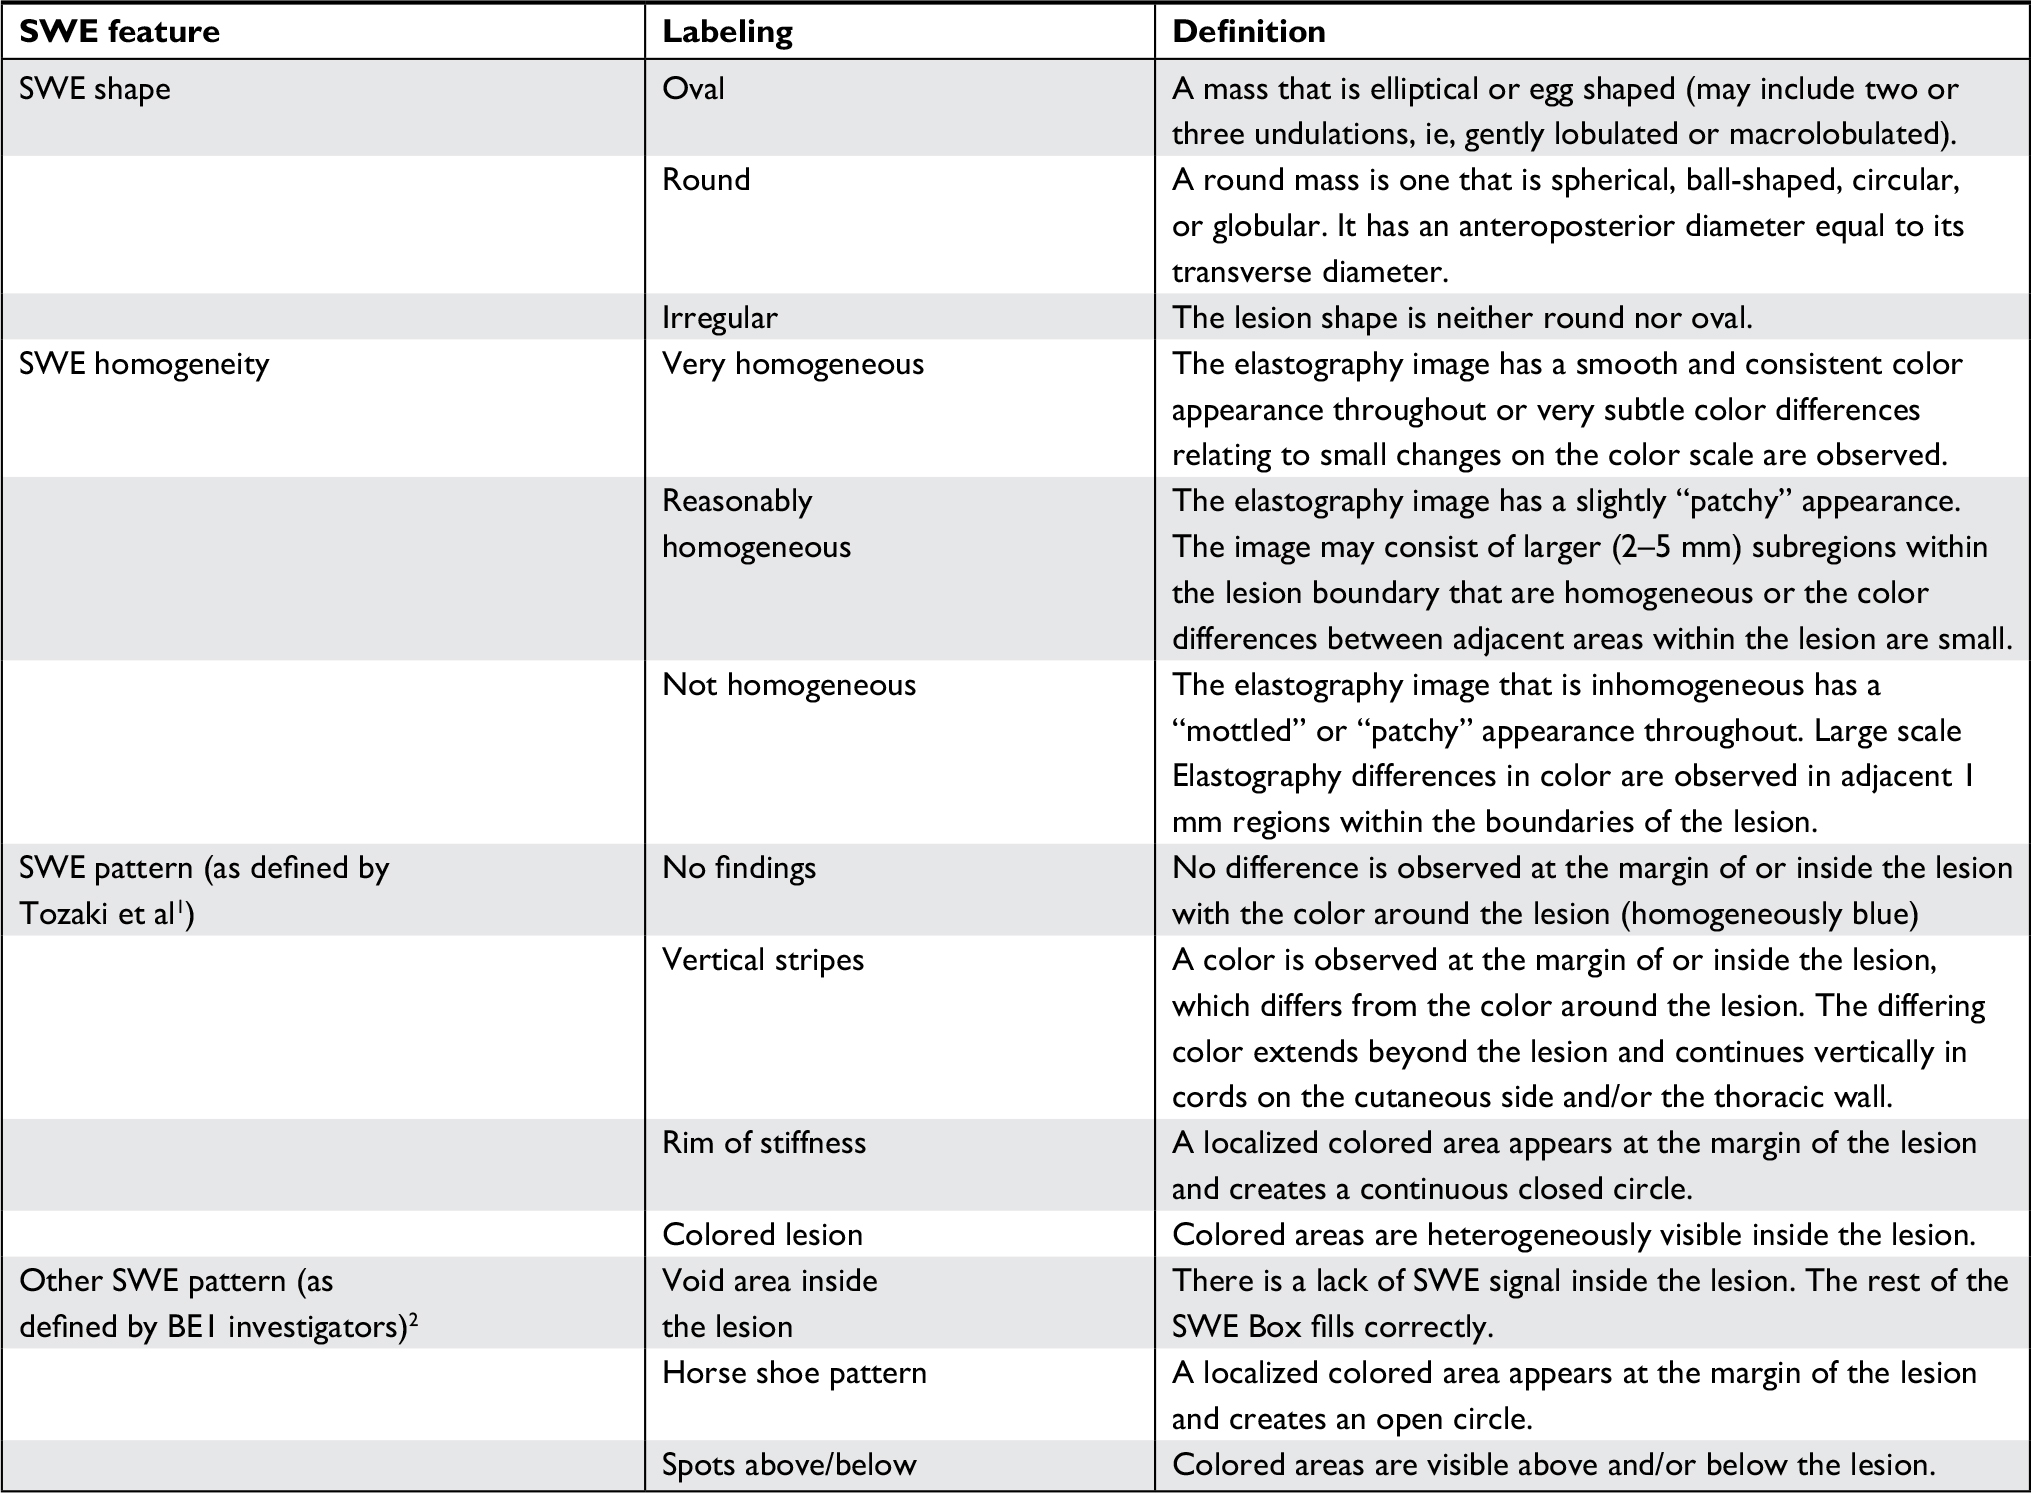
Qualitative features including SWE shape, SWE shape similarity with B-mode images, SWE homogeneity, and SWE color patterns were recorded (Details in Supplementary material).
SWE shapes of breast lesions were identified as three types, including oval, round, and irregular types. By comparing the SWE shapes with B-mode images, we identified the similarity as very similar, reasonably similar, and dissimilar.
SWE homogeneity was evaluated as very homogeneous, reasonably homogeneous, and not homogeneous, by observing the color distribution inside the lesions and between adjacent areas.
Seven color patterns could be demonstrated in this study including no finding, vertical stripes pattern, rim of stiffness pattern, colored lesion pattern, void center pattern, horseshoe pattern, and spots pattern (Figure 1).
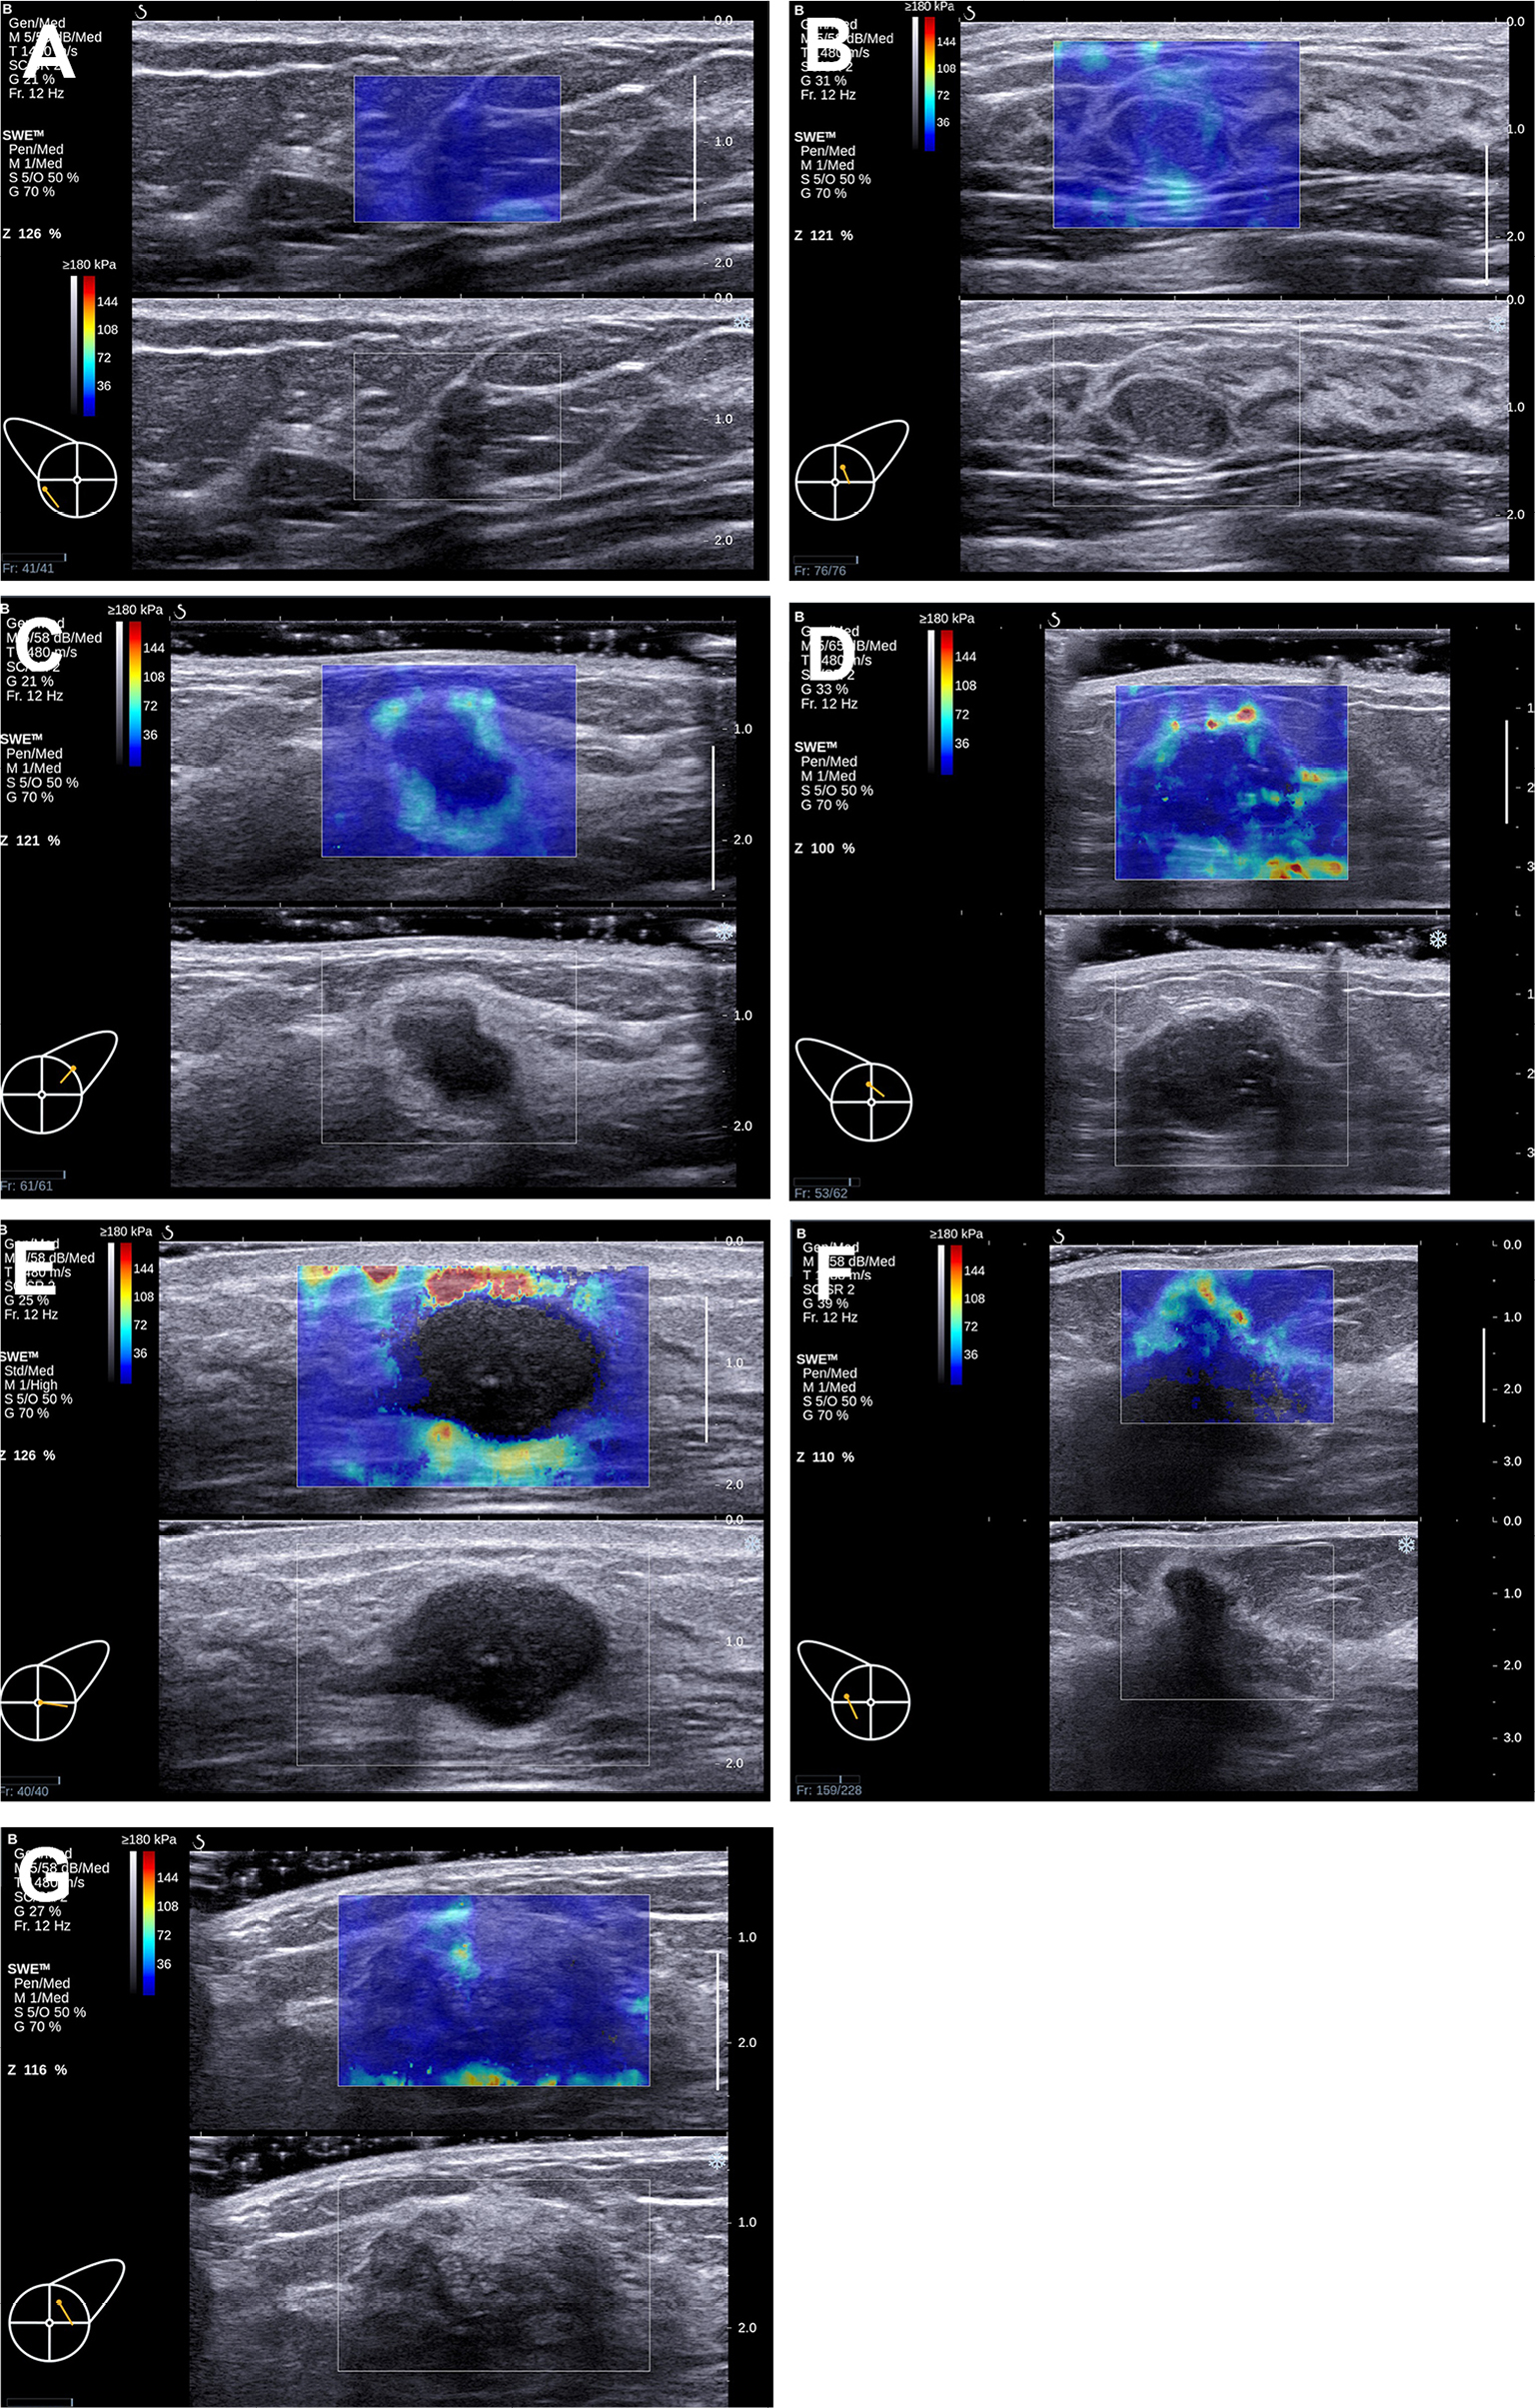 | Figure 1 Seven patterns could be demonstrated on the images acquired in ShearWave™ Elastography (SWE). Notes: (A) No findings: No difference is observed at the margin of or inside the lesion with the color around the lesion (homogeneously blue). (B) Vertical stripes pattern: A color is observed at the margin of or inside the lesion, which differs from the color around the lesion. The differing color extends beyond the lesion and continues vertically in cords on the cutaneous side and/or the thoracic wall. (C) Rim of stiffness pattern: A localized colored area appears at the margin of the lesion and creates a continuous closed circle. (D) Colored lesion pattern: Colored areas are heterogeneously visible inside the lesion. (E) Void center pattern: There is a lack of SWE signal inside the lesion. The rest of the SWE Box fills correctly. (F) Horseshoe pattern: A localized colored area appears at the margin of the lesion and creates an open circle. (G) Spots pattern: Colored areas are visible above and/or below the lesion. |
Quantitative features
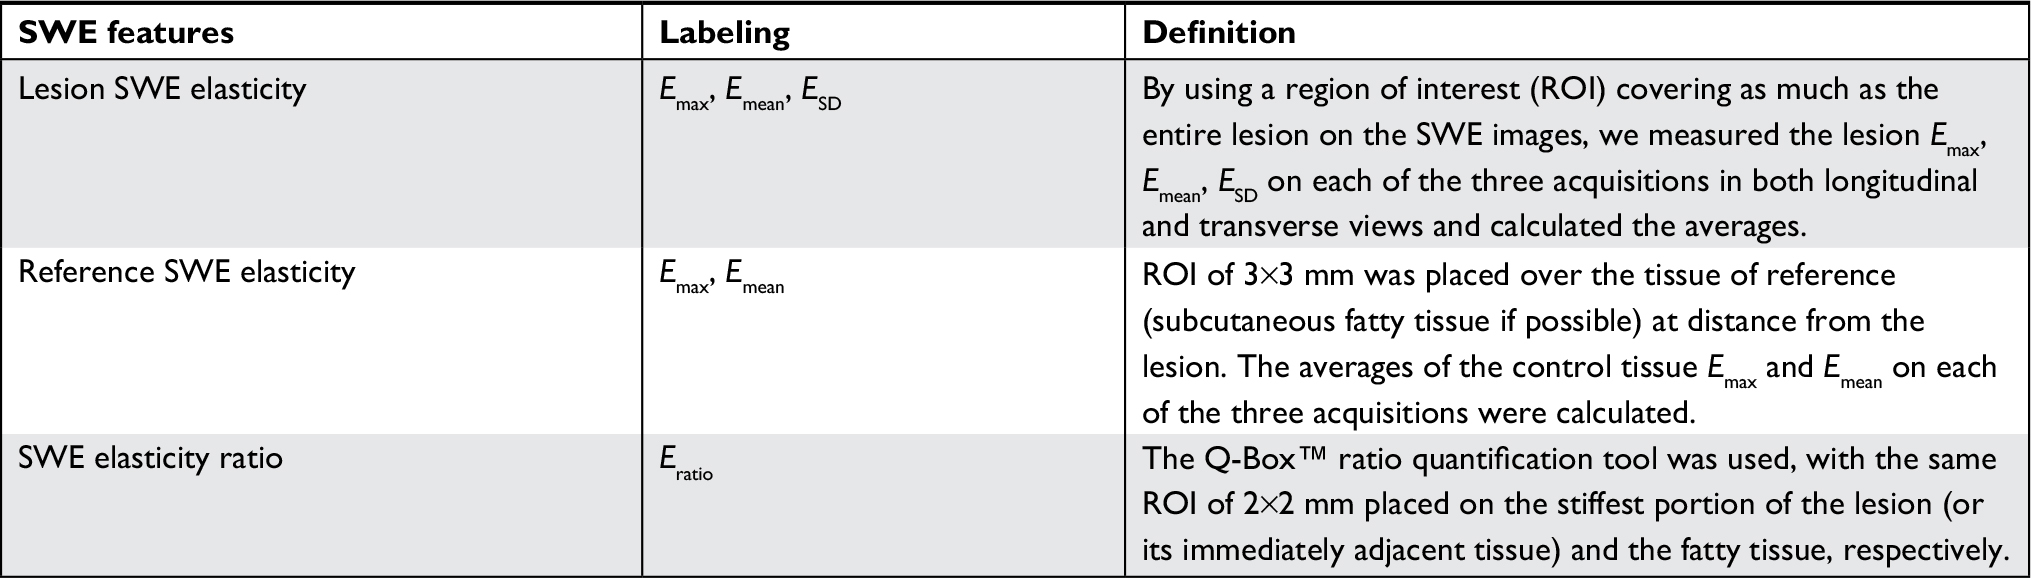
For each of the three SWE acquisitions in both views, elasticity measurements were performed by placing a first built-in “Q-Box™” quantification tool covering as much of the lesion as possible. This Q-Box provided three elasticity measurements: the lesion maximum elasticity value (Emax), the lesion average elasticity (Emean), and the lesion elasticity standard deviation (ESD). Additionally, an elasticity ratio (Eratio) was also calculated between the lesion and subcutaneous fatty tissue, by placing a 2 mm diameter Q-Box over the lesion’s stiffest area (or immediately adjacent to it) and another 2 mm diameter Q-Box over subcutaneous fatty tissue at distance from the lesion (Figure 2). When needed, the stiffest area on SWE images was identified by gradually lowering the color scale from 180 kPa until the first relevant red area appeared.
 | Figure 2 Two-dimensional grayscale ultrasound image (bottom) of a breast lesion in a 51-year-old female patient. Notes: According to morphological signs, the lesion was classified as probably benign (BI-RADS 3). Upper image shows the SWE semitransparent map that overlays the grayscale anatomical image. The largest dotted line circular region of interest (ROI) marked with an “X” was used to quantify global lesion stiffness values, reported on the right-hand side under “XQ-Box™.” The two smallest ROIs were used to calculate the elasticity ratio between the stiffest area within the lesion or surrounding stiffness halo and breast fatty tissue used as a reference. The SWE features of this lesion were suspicious for malignancy. Pathological outcome from breast biopsy was a mixed papillocarcinoma with mixed ductal carcinoma. Abbreviations: BI-RADS, Breast Imaging Reporting and Data System; SWE, shear wave elastography. |
Elasticity measurements were recorded on each of the three SWE acquisitions in both views using the “Q-Box” quantification tool. Maximum, average, and SD of lesion stiffness (lesion Emax, Emean, ESD) were measured with a Q-Box covering as much as lesion SWE map. Elasticity ratio (Eratio) between the lesion and fatty tissue was calculated with the Q-Box ratio tool, using a 2 mm diameter Q-Box over the lesion’s stiffest area (or immediately adjacent) and a second 2 mm diameter Q-Box over subcutaneous fatty tissue at a distance from the lesion (Figure 2). The maximum and average elasticity values (Emax, Emean) of fatty tissue were also recorded. When needed, the stiffest area on SWE images was identified by gradually lowering the color scale from 180 kPa until the first relevant red area appeared.
Reference standard
BI-RADS 2 lesions were considered benign. All the 152 lesions classified as BI-RADS 2 have been followed up for over 2 years until June 2017. For 695 lesions classified as BI-RADS 3 in this study, final pathological diagnosis was available because all the lesions underwent core-needle biopsy, among which 596 lesions underwent surgery, owing to the medical status of China and patients’ demand for intervention. BI-RADS 4a lesions or higher were core-biopsied under ultrasound guidance according to routine clinical practice. When surgery was performed, pathological results were collected. Ground truth for biopsied lesion was derived from histopathologic results after core biopsy, surgery, or a combination of these. The final diagnosis was determined from fine-needle aspiration (FNA) alone in eight cases, from core biopsy alone in 418 cases and from surgery and/or surgical biopsy alone in 1,381 cases. One lesion underwent FNA followed by core biopsy, another lesion underwent surgery after a positive FNA for malignancy, and 453 lesions received surgery after core biopsy. A total of 935 benign lesions were diagnosed after surgery (62%).
Statistical analysis
SWE variables were compared between benign and malignant lesions. Categorical variables were compared using chi-squared test and chi-squared test for trend, while continuous variables were compared using the Kruskal–Wallis test. For continuous variables (Emax, Emean, ESD, and Eratio), average values were calculated across the three acquisitions in both longitudinal and transverse planes.
The diagnostic value of the combination of the BI-RADS classification with each SWE variable was assessed by stepwise logistic regression, in which a model fit P-value <0.05 was used to identify features that contributed to the prediction of the outcome. The best-performing SWE variable was then selected to implement reclassification of initially BI-RADS 3 and 4a lesions according to reclassification rules proposed by Berg et al.16
Ultrasound tests (original BI-RADS and modified BI-RADS) were considered positive for malignancy for scores 4 and 5 and negative for scores 2 and 3. Diagnostic performances of ultrasound tests [sensitivity, specificity, positive predictive value (PPV), NPV, and accuracy] were calculated and compared using appropriate tests: the McNemar test for comparison of paired proportions and the chi-squared test for unpaired proportions. Aggressive and conservative reclassification rules of BI-RADS 3 and 4a lesions as proposed by Berg et al were also tested (Supplementary material).
Statistical analyses were performed using statistical analysis software MedCalc®, version 14.12.0–64 bit for Windows XP/Vista/7/8 (MedCalc Software bvba), with a P-value of <0.05 indicating statistical significance.
Results
Population description and lesions’ characteristics
Two thousand two hundred seventy-three breast lesions from 2,273 patients were recruited, from which 11 were excluded (nine with missing final pathology, one with no SWE acquisition, and one nonbreast lesion). The final study population consisted of 2,262 patients (median age: 43 years old; IQR: 35–51; range: 18–91), with 2,262 breast lesions, of which 752 were malignant (33.3%). All the 152 lesions classified as BI-RADS 2 had been followed up for over 2 years until June 2017. Characteristics of patients and breast lesions were described in Table 1.
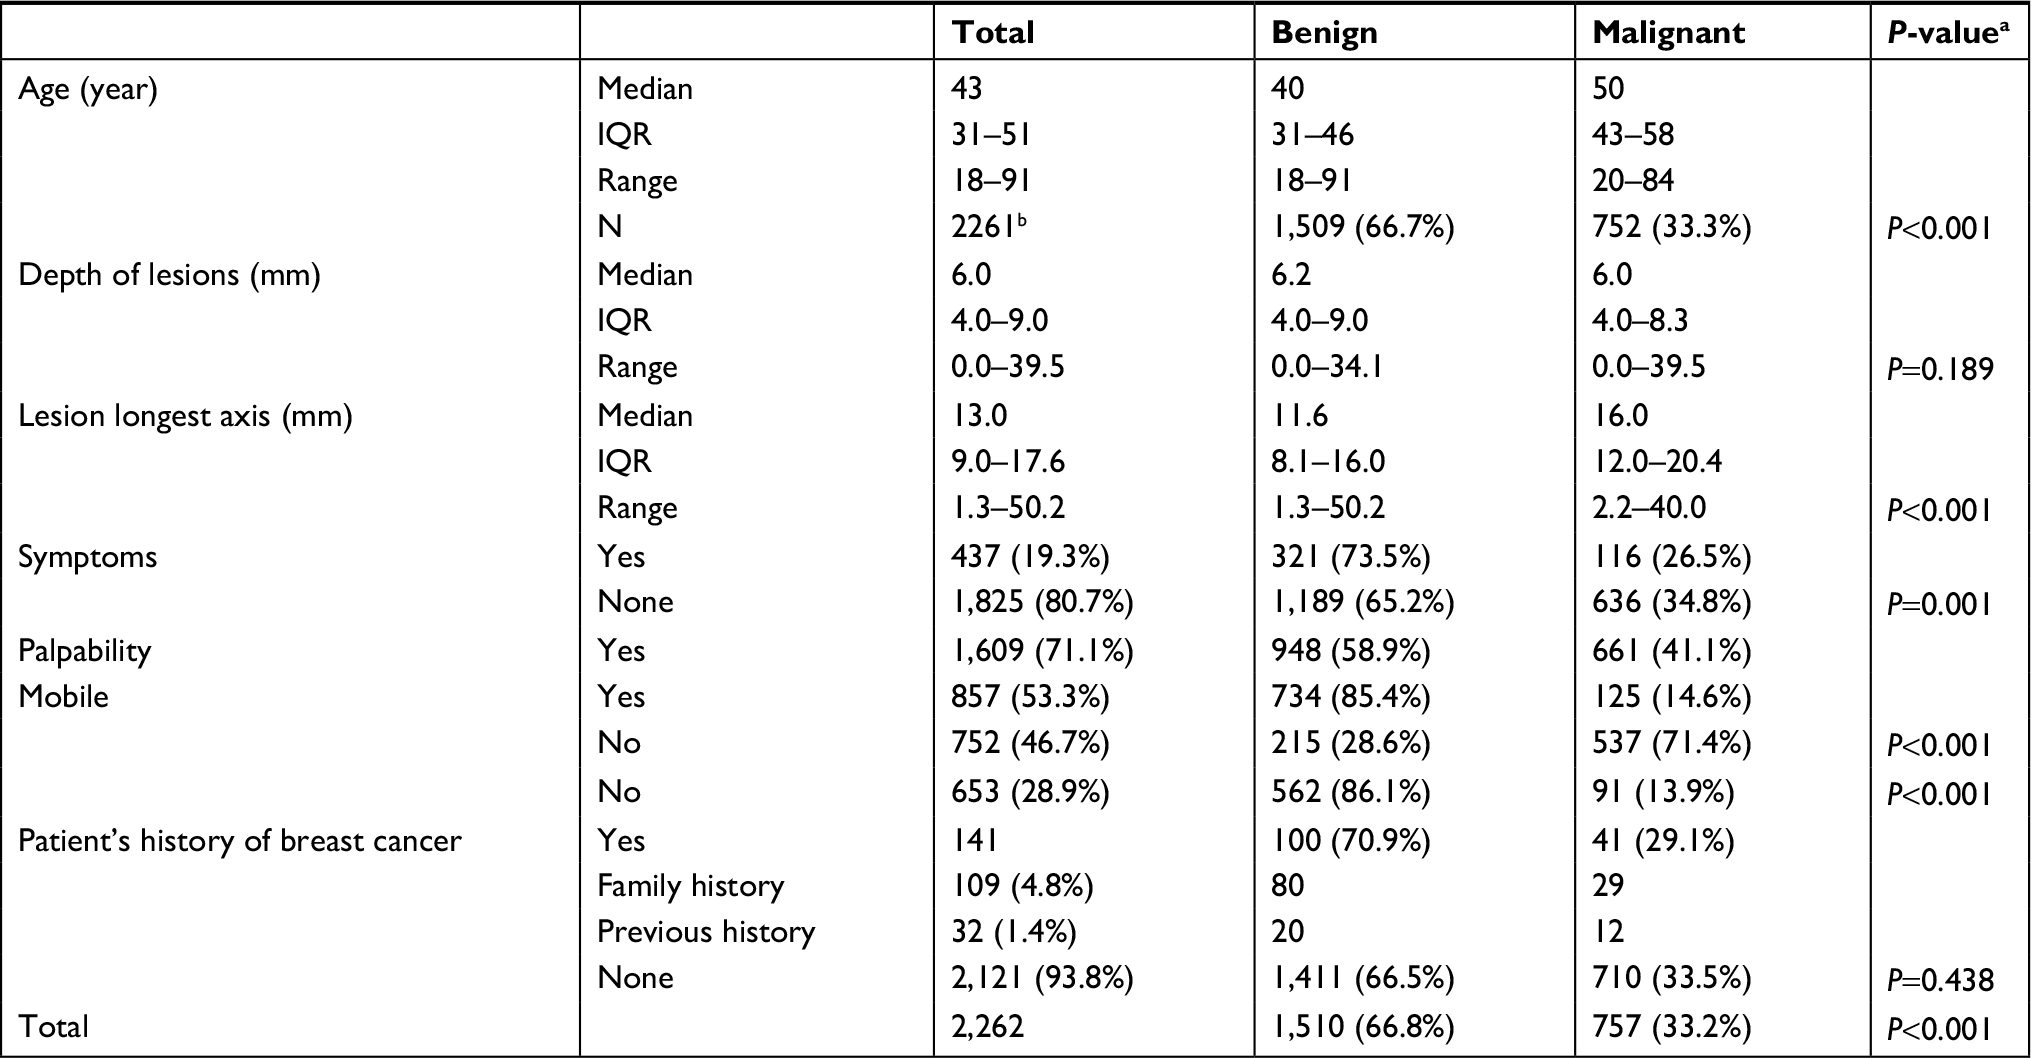 | Table 1 Description of the study population and lesion characteristics Notes: aP-value for statistical significance of difference between benign and malignant lesions using Kruskal–Wallis test (continuous variables) or the chi-squared test (categorical variables). bTotal population of 2,262 masses in 2,262 patients. Age was missing in one patient. |
Diagnostic performance of conventional ultrasound in breast lesions
Malignancy rates in the BI-RADS 2, 3, 4a, 4b, 4c, and 5 categories were 0/152 (0%), 19/694 (2.7%), 87/611 (14.2%), 147/267 (55.1%), 267/301 (88.7%), and 232/237 (99.7%), respectively. The sensitivity, specificity, PPV, and NPV for ultrasound characterization of breast lesions were 97.5% (733/752), 54.8% (827/1,510), 51.7% (733/1,417), and 97.8% (827/846), respectively. The diagnostic accuracy of breast ultrasound was 69% (1,560/2,262).
SWE evaluation
Qualitative SWE features (homogeneity, shape, and dissimilarity of lesion shape between B-mode and SWE imaging) were correlated with increased malignancy risk (Table 2). A single SWE pattern was reported in 1,049 (46.4%) lesions, of which 674 (64.3%) lesions were malignant. Patterns “Spots” and “Vertical stripes” failed to predict malignancy (OR 1.18; P=0.3692 and 0.52, P=0.004, respectively); all other patterns were predictive of malignancy: “Rim of stiffness” (OR 20.31; P<0.001), “Horseshoe pattern” (OR 10.61; P<0.001), “Colored lesion” (OR 3.45; P<0.001), and “Void center” (OR 3.45; P<0.001). When no specific SWE pattern was reported, the malignancy rate was low: 59/1,191 (4.95%). A combination of two or more SWE patterns was described in 22 cases (0.9%), of which 19 (86.4%) were malignant. All combinations involving any of “Rim of stiffness,” “Horseshoe,” or “Colored lesion” were highly predictive of malignancy (100%), with 12/12, 7/7, and 6/6 lesions being malignant, respectively.
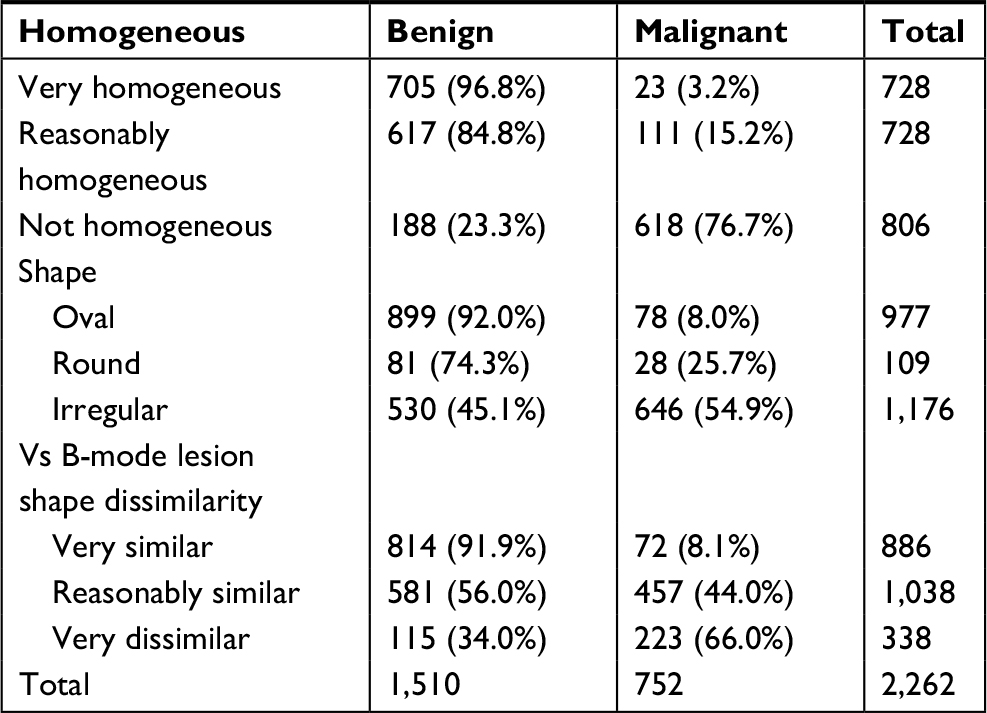 | Table 2 Rates of malignancy according to qualitative shear wave elastography features Notes: The chi-squared test for trend statistically significant (P<0.001) for difference between benign and malignant lesions for all three qualitative features. Data reported as total numbers and percentages per line. |
All stiffness measurements, including those performed in subcutaneous fat tissue, were significantly higher in breasts with malignant lesions in both scanning planes (Table 3).
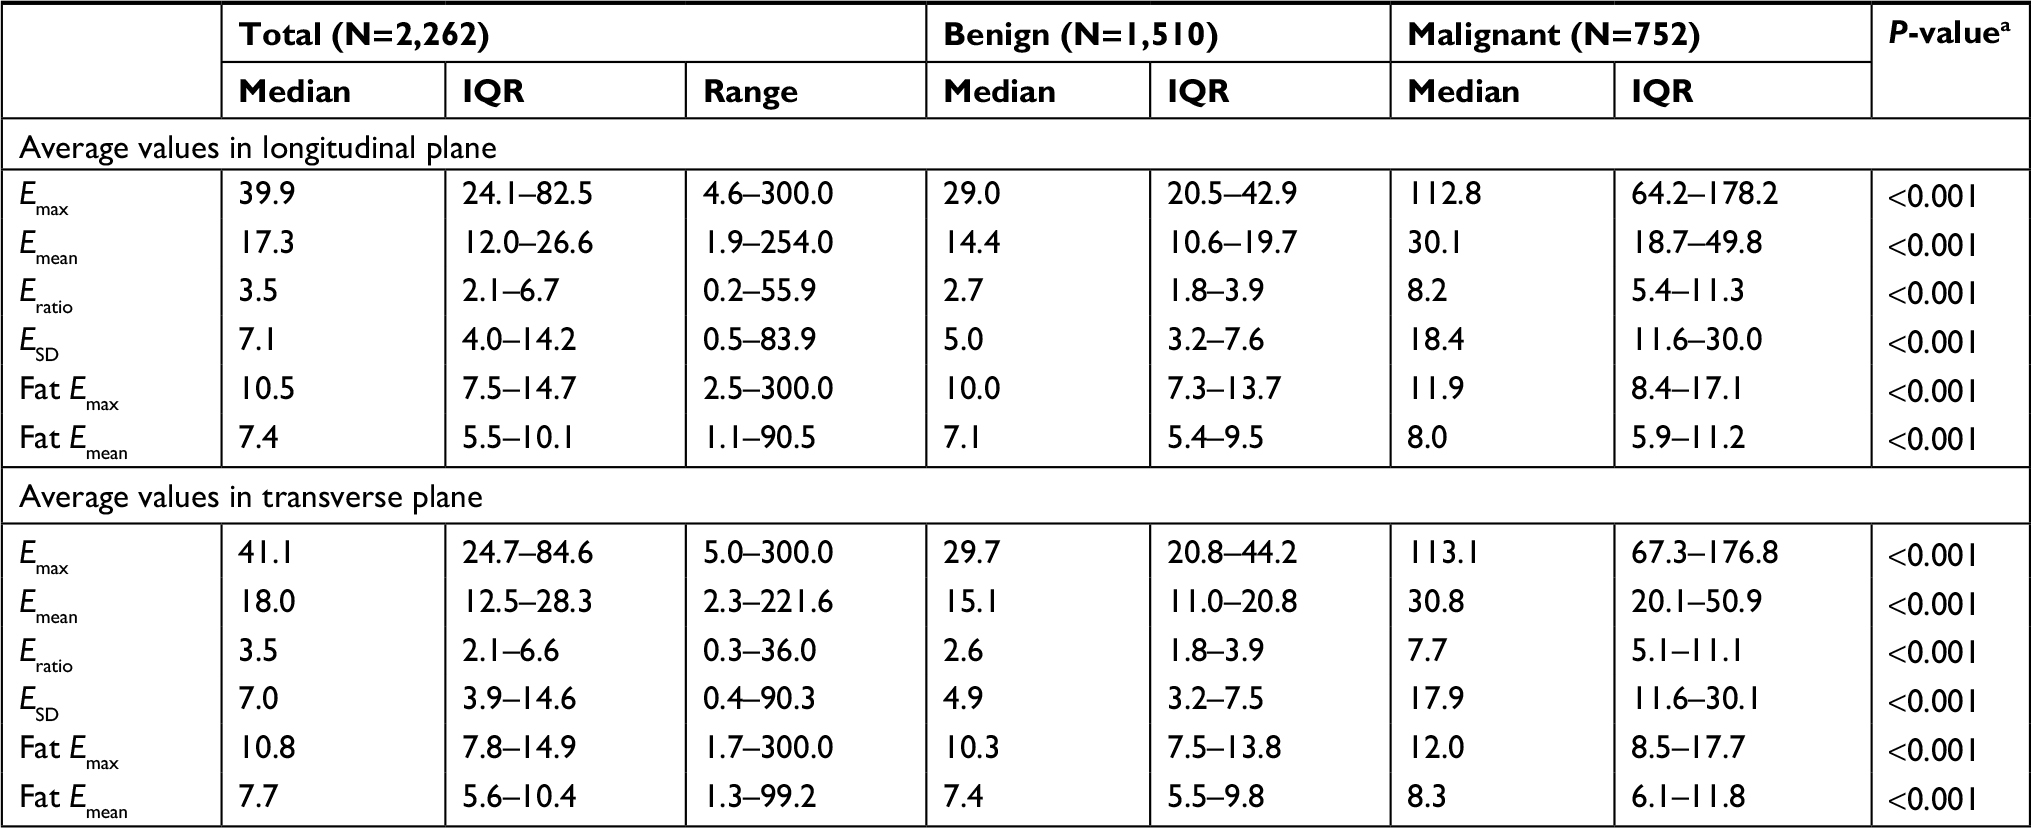 | Table 3 Shear wave elastography measurements performed in both scanning planes in the masses or their surrounding and in the reference fatty tissue Notes: aP-value for statistical significance of difference between benign and malignant lesions using the Kruskal–Wallis test. |
Diagnostic value of SWE variables
The diagnostic value of SWE features alone was described in Table 4. When combining SWE variables with original BI-RADS assessment by stepwise logistic regression, SWE homogeneity, SWE shape, “Rim of stiffness” color pattern, as well as all quantitative variables (Emax, Emean, Eratio, and ESD) significantly increased the area under the receiver operating characteristic curve (AUC) (P<0.001) (Table 5), among which Emax yielded the highest AUC (0.954).
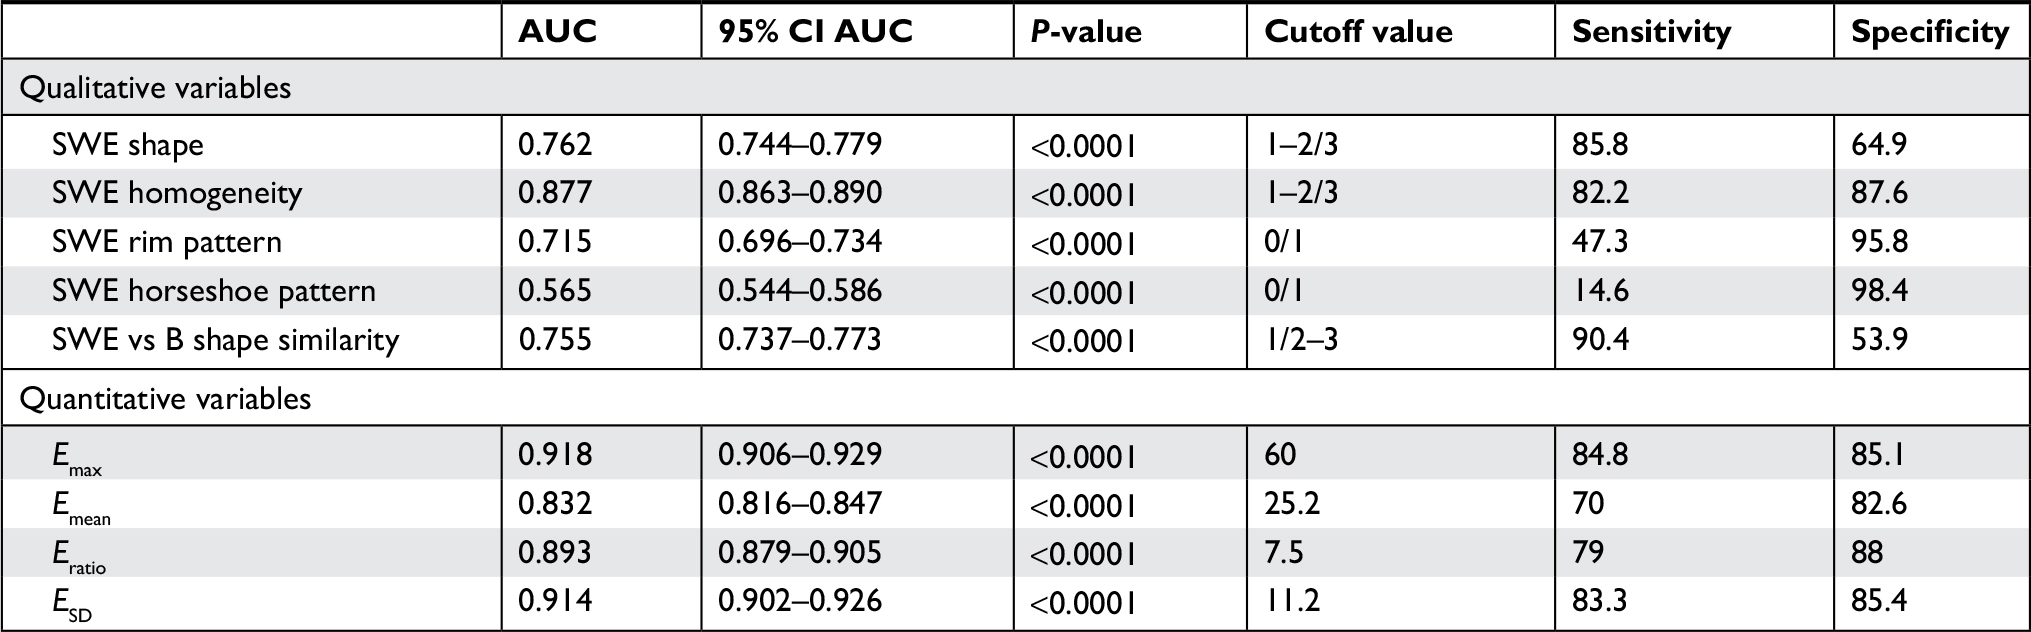 | Table 4 Cutoff value determined by the Youden index and associated performances of SWE feature Abbreviations: AUC, area under the receiver operating characteristic curve; SWE, shear wave elastography. |
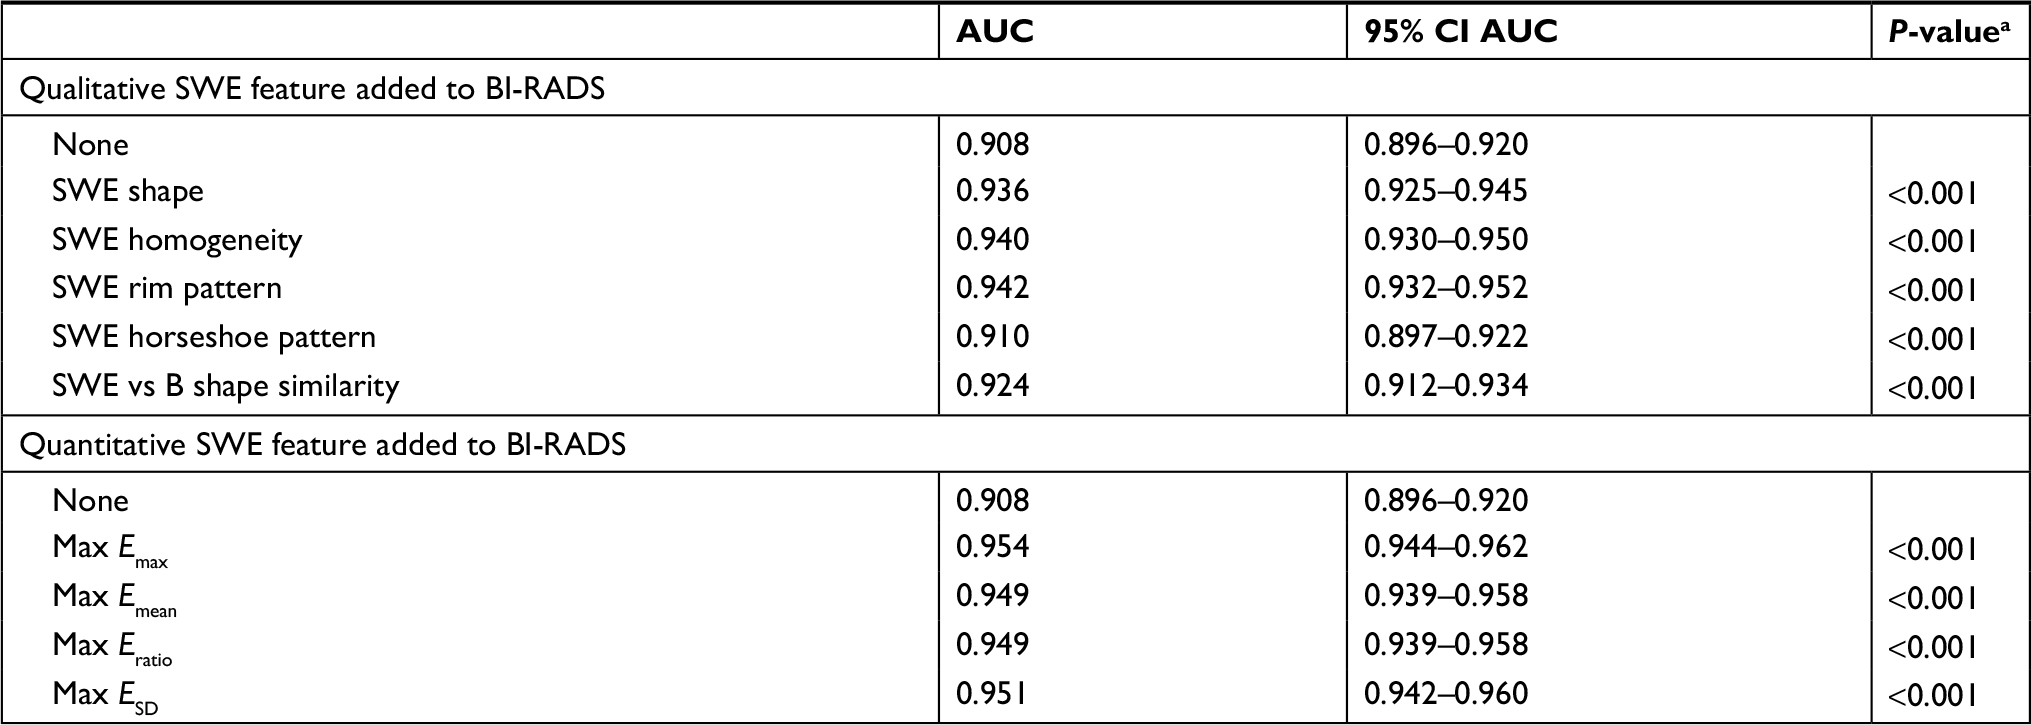 | Table 5 Impact of combining SWE characteristics with the BI-RADS classification on the global diagnostic performance (AUC) of the BI-RADS classification alone Notes: aP-value for statistical significance of AUC. Abbreviations: AUC, area under the receiver operating characteristic curve; BI-RADS, Breast Imaging Reporting and Data System; SWE, shear wave elastography. |
Confirming reclassification rules for BI-RADS category 3 and 4a lesions
When the conservative reclassification rule defined by BE1 study was applied to this study population,16 using Emax as the reclassifying SWE variable, the sensitivity, specificity, PPV, and NPV of the ultrasound diagnostic test would have changed from 97.5% (733/752) to 96.9% (729/752) (P=0.2891), 54.8% (827/1510) to 66.1% (998/1510) (P<0.001), 51.7% (733/1,416) to 58.7% (729/1,241) (P<0.001), and 97.8% (827/846) to 97.7% (998/1,021) (P=0.883), respectively. Using the more aggressive rule to downgrade the BI-RADS 4a masses would have led to a higher increase in specificity: from 54.8% (827/1,510) to 86.4% (1,305/1,510) (P<0.001), along with a significant decrease in sensitivity: from 97.5% (733/752) to 91.5% (688/752) (P<0.001), and NPV: from 97.8% (827/846) to 95.3% (688/893) (P=0.005) (Table 6).
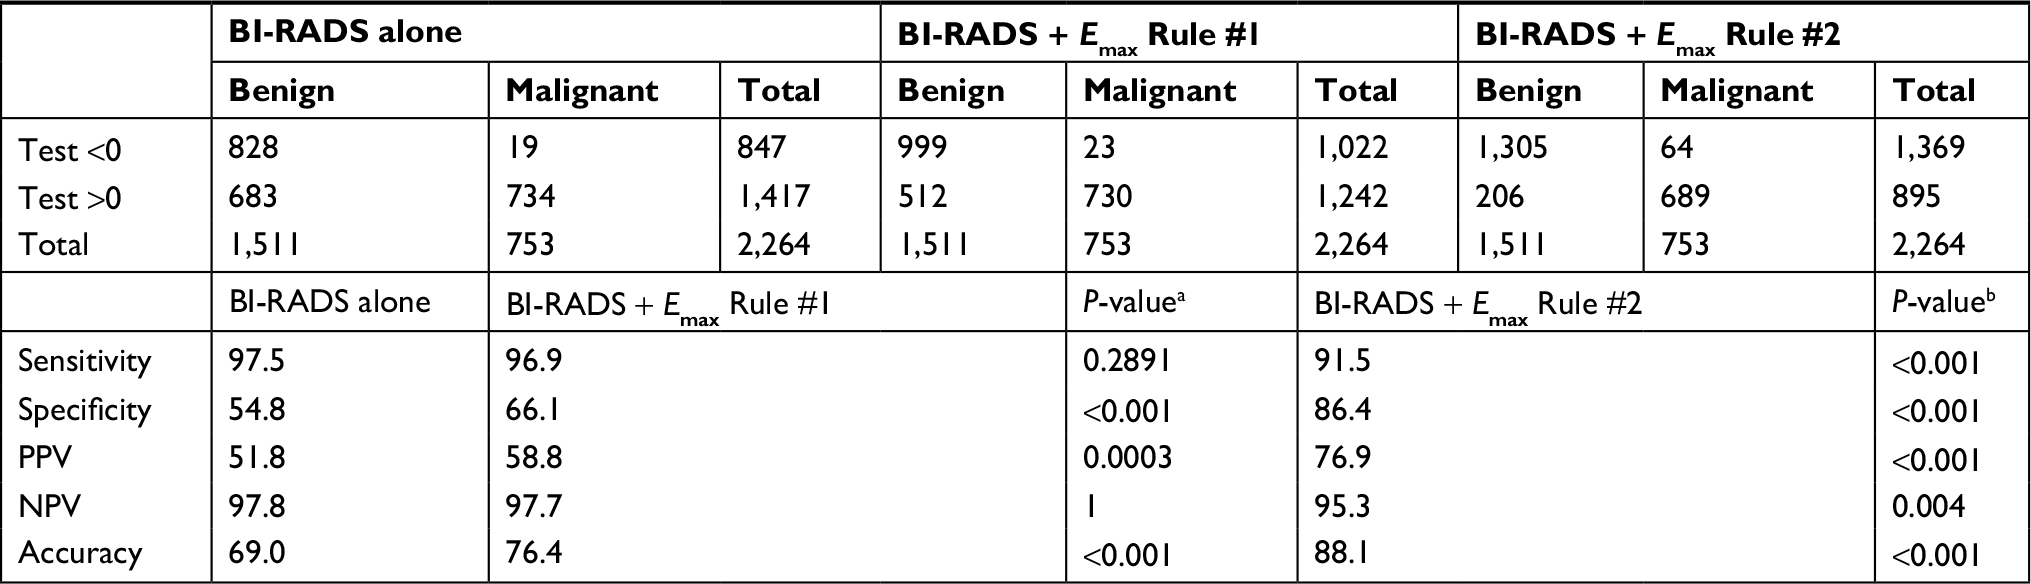 | Table 6 Diagnostic performance of combining SWE Emax with the BI-RADS classification according to conservative and aggressive reclassification rule from the BE1 study Notes: BI-RADS test is considered to be Test >0 for BI-RADS 4 and 5 and Test <0 for BI-RADS 2 and 3; Rule #1: the conservative reclassification rule from the BE1 study (Supplementary material); Rule #2: the aggressive reclassification rule from the BE1 study (Supplementary material); aP-value for statistical significance of difference between BI-RADS + Emax Rule #1 and BI-RADS alone using the chi-squared test. bP-value for statistical significance of difference between BI-RADS + Emax Rule #2 and BI-RADS alone using the chi-squared test. Abbreviations: BI-RADS, Breast Imaging Reporting and Data System; NPV, negative predictive value; PPV, positive predictive value; SWE, shear wave elastography. |
Focus on low suspicion masses
Low suspicion masses can be defined as BI-RADS 3 and 4a lesions showing oval shape, circumscribed margins, no posterior shadowing, or any other suspicious feature on grayscale imaging. A subset of 519 low suspicion masses could be extracted, of which 20 (3.9%) were cancers.
Using BE1 conservative reclassification rule, no cancer would be downgraded from BI-RADS 4a to follow-up nor upgraded from BI-RADS 3 to biopsy. Forty-three percent (43/99) of initial false-positive masses would be properly downgraded to follow-up, while no benign masses would be upgraded to biopsy, increasing nonsignificantly the positive biopsy rate from 9.2% (10/109) to 15.2% (10/66) (P=0.232671). The malignancy rate among BI-RADS 3 low suspicion lesions would decrease nonsignificantly from 2.4% (10/410) to 2.2% (10/453) (P=0.825447).
Discussion
To the best of our knowledge, this study was the first investigation into the clinical use of SWE in a prospective multicenter cross-sectional study in a Chinese population. Previous studies performed in China investigated the diagnostic value of strain elastography for breast lesion characterization,21–23 and only one yielded potential improvement of diagnostic performance of ultrasound by combining elastography information to grayscale evaluation.21 The main findings of SWE in this study were the reduction of false positives and improvement in specificity.
Despite general agreement on diagnostic value of SWE evaluation within ultrasound assessment of breast masses,16,17,19,24–30 consensus on the most valuable SWE feature(s) and cutoff value(s) has not been reached yet.31 Evans et al26 and Chang et al25 proposed to use Emean ≥50 kPa and ≥80.17 kPa as suspicious signs, respectively. In the study by Ko et al,32 the optimal Emean cutoff value (41.6 kPa) was lower than those determined by other published studies on solid breast masses.25,26,28 Other studies demonstrated best diagnostic performance for Emax when combining with the BI-RADS score: Berg et al,16 Lee et al,28 and Yoon et al20 used an Emax of 80–82.8 kPa while Zhou et al30 reported that both an ESD of 6.3 kPa and an Emax of 49.57 kPa had significantly better performance than any other quantitative measurements. Park et al31 demonstrated that Emax provided the best AUC compared with other quantitative parameters and determined the optimal cutoff value to be 45.1 kPa.32
Patterns “Spots” and “Vertical stripes” failed to predict malignancy because they were related with artifact produced by pressure of the probe. Results of this study confirmed that SWE homogeneity, SWE shape, the “Rim of Stiffness” sign, and the “Horse Shoe” pattern were indicative of malignancy risk. Evans et al,26 Tozaki et al,33 and Zhou et al30 showed that the “stiff rim” sign was a predictor of malignancy. Data of this study suggested that lesions presenting with a combination of two SWE patterns (1% of the sample population), including “Rim of Stiffness,” “Horse Shoe,” or “Colored Lesion” patterns, had a 100% malignancy rate. Desmoplastic reaction or infiltrating cancer cells have been proposed as explanations of the “Rim of Stiffness” or the “Horse Shoe.”12,26 As to the other patterns, low shear wave amplitudes and/or noise within malignant lesions have been presented as other possible explanations,32 which might be caused by the attenuation of the shear waves from lesion surrounding tissue.33
Lesion maximum stiffness (Emax) was found to be the best-performing stiffness measurement combined with the BI-RADS score, similar to findings from other experiences.16,17,19,24–30 In this study, we found that the BE1 conservative reclassification rule16 significantly increased the specificity of breast ultrasound to a slightly higher extent than that observed in the BE1 study (11.3 points from 54.8% to 66.1% compared with 4.6 points from 61.1% to 65.7%, respectively), providing a higher increase in PPV for biopsy recommendation (7 points higher in the BE3 population compared with 3.4 points in the BE1 population). However, the implementation of the BE1 aggressive reclassification rule to the studied Chinese population significantly decreased sensitivity by 6 points (from 97.5% to 91.5%). Therefore, we assume that the BE1 conservative rule is applicable to Chinese population, but not the aggressive rule, which legitimates the fact that both a conservative rule and an aggressive rule were initially developed. This study population could be used in future works to determine specific cutoff values for this population, for example, by randomly splitting it into two independent cohorts, one to determine new cutoffs values and the other to validate such new reclassification rules. As initially suggested by Berg et al,16 the benefit of conservative reclassification rule was confirmed in this study when applied to low suspicion masses. However, because no low suspicion masses initially classified as BI-RADS 3 had stiffness values over 160 kPa, none of the false-negative cases could be upgraded to biopsy by using SWE information.
The different outcome of the BE1 aggressive reclassification rule applied to this study population could be explained by populations’ differences. Increased breast tissue density in Asian patients may be one of the reasons; patients’ median age in this population was lower than the BE1 population (43vs 50 years old), theoretically in line with a younger average age of highest incidence of breast cancer in Asian populations. Palpable masses were more common in this population (70% vs 40%), with an apparently similar malignancy rate among palpable lesions (41% vs 43%, respectively); median Emax values seemed to be lower in this population of benign (30 vs 41 kPa) and malignant (113 vs 179 kPa) lesions. On the contrary, no differences were found for median lesion size and malignancy rates in BI-RADS classes.
The study has some limitations. First, combinations of several SWE features added to BI-RADS classification were not evaluated in this study because such combinations were proved to be useless.16,29 Second, this study design was not comparative, and patients’ management was not prospectively modified as a consequence of SWE evaluation. In such a comparative design, the upfront comparison of the number of biopsies performed, malignancy rates in each of the BI-RADS classes, and number of false negatives and false positives in both arms would probably provide the definitive proof of the benefit of SWE in the ultrasound characterization of breast masses. Third, owing to the patients’ requests, surgeons’ decisions, and the size of masses over 2 cm, there was a high number of BI-RADS 3 masses underwent surgery and finally confirmed as benign.
Conclusion
Results of this study confirmed several aspects of the use of ultrasound and SWE for the characterization of breast lesions in a large Chinese population. The ability of SWE features to improve the diagnostic performances of breast ultrasound, especially maximum stiffness (Emax), was confirmed, in particular in low suspicion masses. It was confirmed that SWE could be used as an additional criterion to reduce false positives of breast ultrasound characterization, and therefore improve diagnostic confidence.
Acknowledgments
We thank the following investigators for the collection of participants’ data: Lin X, Chen Y, Wu C, Chen Q, Peng Y, Luo B, Tang L, Li J, Zheng J, Zhou R, Cui G, Li A, Wang X, Qian L, Zhang J, Wen C. We thank the two PIs (Professor Chang C [Fudan University Shanghai Cancer Center, Shanghai] and Professor Li A [Sun Yat-Sen University Cancer Center, Guangzhou]) for the design and instruction of the study. Finally, we thank the following employees of SuperSonic Imagine for contributing to the definition of the study protocol, for training study investigators, and for ensuring the maintenance of the database: Holly Zheng, Rita Luo, Angelina Zhang, and Joel Gay for the statistical analysis. This work was funded by SuperSonic Imagine (Aix-en-Provence, France).
Author contributions
All authors contributed to data analysis, drafting and revising the article, gave final approval of the version to be published, and agree to be accountable for all aspects of the work.
Disclosure
The authors report no conflicts of interest in this work.
References
Mendelson EB, Böhm-Vélez M, Berg WA. ACR BI-RADS® Ultrasound. In: Reston VA, ed. ACR BI-RADS® Atlas, Breast Imaging Reporting and Data System: American College of Radiology: Mendelson EB; 2013;1–153. | ||
Baker JA, Kornguth PJ, Soo MS, Walsh R, Mengoni P. Sonography of solid breast lesions: observer variability of lesion description and assessment. AJR Am J Roentgenol. 1999;172(6):1621–1625. | ||
Lazarus E, Mainiero MB, Schepps B, Koelliker SL, Livingston LS. BI-RADS lexicon for US and mammography: interobserver variability and positive predictive value. Radiology. 2006;239(2):385–391. | ||
Berg WA, Blume JD, ACRIN 6666 Investigators, et al. Combined screening with ultrasound and mammography vs mammography alone in women at elevated risk of breast cancer. JAMA. 2008;299(18):2151–2163. | ||
Nothacker M, Duda V, Hahn M, et al. Early detection of breast cancer: benefits and risks of supplemental breast ultrasound in asymptomatic women with mammographically dense breast tissue. A systematic review. BMC Cancer. 2009;9:335. | ||
Kolb TM, Lichy J, Newhouse JH. Comparison of the performance of screening mammography, physical examination, and breast US and evaluation of factors that influence them: an analysis of 27,825 patient evaluations. Radiology. 2002;225(1):165–175. | ||
Mandelson MT, Oestreicher N, Porter PL, et al. Breast density as a predictor of mammographic detection: comparison of interval- and screen-detected cancers. J Natl Cancer Inst. 2000;92(13):1081–1087. | ||
Dai H, Yan Y, Wang P, et al. Distribution of mammographic density and its influential factors among Chinese women. Int J Epidemiol. 2014;43(4):1240–1251. | ||
Mariapun S, Li J, Yip CH, Taib NA, Teo SH. Ethnic differences in mammographic densities: an Asian cross-sectional study. PLoS One. 2015;10(2):e0117568. | ||
Ohuchi N, Suzuki A Sobue T, et al; J-START Investigator Groups. Sensitivity and specificity of mammography and adjunctive ultrasonography to screen for breast cancer in the Japan Strategic Anti-cancer Randomized Trial (J-START): a randomised controlled trial. Lancet. 2016;387(10016):341–348. | ||
Shen S, Zhou Y, Xu Y, et al. A multi-centre randomised trial comparing ultrasound vs mammography for screening breast cancer in high-risk Chinese women. Br J Cancer. 2015;112(6):998–1004. | ||
Itoh A, Ueno E, Tohno E, et al. Breast disease: clinical application of US elastography for diagnosis. Radiology. 2006;239(2):341–350. | ||
Mercado CL. BI-RADS update. Radiol Clin North Am. 2014;52(3):481–487. | ||
Lee SH, Chang JM, Cho N, et al. Practice guideline for the performance of breast ultrasound elastography. Ultrasonography. 2014;33(1):3–10. | ||
Cosgrove DO, Berg WA, BE1 Study Group, et al. Shear wave elastography for breast masses is highly reproducible. Eur Radiol. 2012;22(5):1023–1032. | ||
Berg WA, Cosgrove DO, BE1 Investigators, et al. Shear-wave elastography improves the specificity of breast US: the BE1 multinational study of 939 masses. Radiology. 2012;262(2):435–449. | ||
Gweon HM, Youk JH, Son EJ, Kim JA. Clinical application of qualitative assessment for breast masses in shear-wave elastography. Eur J Radiol. 2013;82(11):e680–e685. | ||
Klotz T, Boussion V, Kwiatkowski F, et al. Shear wave elastography contribution in ultrasound diagnosis management of breast lesions. Diagn Interv Imaging. 2014;95(9):813–824. | ||
Lee SH, Chang JM, Kim WH, et al. Added value of shear-wave elastography for evaluation of breast masses detected with screening US imaging. Radiology. 2014;273(1):61–69. | ||
Yoon JH, Ko KH, Jung HK, Lee JT. Qualitative pattern classification of shear wave elastography for breast masses: how it correlates to quantitative measurements. Eur J Radiol. 2013;82(12):2199–2204. | ||
Hao SY, Ou B, Li LJ, et al. Could ultrasonic elastography help the diagnosis of breast cancer with the usage of sonographic BI-RADS classification? Eur J Radiol. 2015;84(12):2492–2500. | ||
Mu WJ, Zhong WJ, Yao JY, et al. Ultrasonic elastography research based on a multicenter study: adding strain ratio after 5-point scoring evaluation or not. PLoS One. 2016;11(2):e0148330. | ||
Zhi H, Ou B, Xiao XY, et al. Ultrasound elastography of breast lesions in Chinese women: a multicenter study in China. Clin Breast Cancer. 2013;13(5):392–400. | ||
Barr RG. Shear wave imaging of the breast: still on the learning curve. J Ultrasound Med. 2012;31(3):347–350. | ||
Chang JM, Moon WK, Cho N, et al. Clinical application of shear wave elastography (SWE) in the diagnosis of benign and malignant breast diseases. Breast Cancer Res Treat. 2011;129(1):89–97. | ||
Evans A, Whelehan P, Thomson K, et al. Quantitative shear wave ultrasound elastography: initial experience in solid breast masses. Breast Cancer Res. 2010;12(6):R104. | ||
Garra BS, Cespedes EI, Ophir J, et al. Elastography of breast lesions: initial clinical results. Radiology. 1997;202(1):79–86. | ||
Lee EJ, Jung HK, Ko KH, Lee JT, Yoon JH. Diagnostic performances of shear wave elastography: which parameter to use in differential diagnosis of solid breast masses? Eur Radiol. 2013;23(7):1803–1811. | ||
Moon WK, Huang CS, Shen WC, et al. Analysis of elastographic and B-mode features at sonoelastography for breast tumor classification. Ultrasound Med Biol. 2009;35(11):1794–1802. | ||
Zhou J, Zhan W, Chang C, et al. Breast lesions: evaluation with shear wave elastography, with special emphasis on the “stiff rim” sign. Radiology. 2014;272(1):63–72. | ||
Park J, Woo OH, Shin HS, Cho KR, Seo BK, Kang EY. Diagnostic performance and color overlay pattern in shear wave elastography (SWE) for palpable breast mass. Eur J Radiol. 2015;84(10):1943–1948. | ||
Ko KH, Jung HK, Kim SJ, Kim H, Yoon JH. Potential role of shear-wave ultrasound elastography for the differential diagnosis of breast non-mass lesions: preliminary report. Eur Radiol. 2014;24(2):305–311. | ||
Tozaki M, Fukuma E. Pattern classification of ShearWave™ Elastography images for differential diagnosis between benign and malignant solid breast masses. Acta Radiol. 2011;52(10):1069–1075. |
Supplementary materials
- To illustrate the patient selection process in detail, the inclusion and exclusion criteria were supplemented as follows:
Inclusion Criteria
Patients eligible for participation in the study must:
- Be female,
- Be aged 18 years old or more,
- Already known breast lesion that has not been treated or biopsied,
- Have been referred to a breast ultrasound because of a breast mass found on at least one of the following examinations: physical palpation, mammography, ultrasound examination, or MRI.
Exclusion Criteria
The following patients must also be excluded:
- Women who are unwilling or unable to provide informed consent,
- Women whose breast lesions have been managed or treated or biopsied,
- Women with breast implants,
- Women who are pregnant or breastfeeding,
- Women in whom all lesions are diagnostically categorized as Breast Imaging Reporting and Data System (BI-RADS) 0 or 6,
- Women with previous ipsilateral breast surgery,
- Women with no visible breast mass on ultrasound examination,
- Women with multiple lesions,
- Women with axillary metastatic lymph nodes only,
- Women with foreign body in the breast.
- In order to analyze the diagnostic performance of shear wave elastography (SWE), both qualitative and quantitative SWE features were documented. These SWE features will be described on a SWE image with default maximum display setting of 180 kPa (7.7 m/second). Here is a detailed explanation of all SWE features of interest in this study.
- Aggressive and conservative reclassification rules
Rule #1
If Max Emax would be added to the BI-RADS test to help classify BI-RADS 3 and 4a masses, using the conservative reclassification rule from the BE1 study:
- Downgrade BI-RADS 4a below 30 kPa
- Upgrade BI-RADS 3 above 160 kPa
Rule #2
If Max Emax would be added to the BI-RADS test to help classify BI-RADS 3 and 4a masses, using the aggressive reclassification rule from the BE1 study:
- Downgrade BI-RADS 4a below 80 kPa
- Upgrade BI-RADS 3 above 160 kPa
 | Table S1 List of qualitative features acquired in ShearWave™ Elastography (SWE) |
 | Table S2 List of quantitative features acquired in ShearWave™ Elastography (SWE) Notes: Quantitative SWE features were measured on each of the three SWE images of two orthogonal views using the quantification tool “Q-Box” built in Aixplorer US system. The measurement of maximum diameter of the lesion on SWE images included the entire mass on B-mode images and any stiff areas immediately adjacent to the lesion. |
References
Tozaki M, Fukuma E. Pattern classification of ShearWave™ Elastography images for differential diagnosis between benign and malignant solid breast masses. Acta Radiol. 2011; 52(10):1069–1075. | ||
Berg WA, Cosgrove DO, Doré CJ, et al. Shear-wave elastography improves the specificity of breast US: the BE1 multinational study of 939 masses. Radiology. 2012; 262(2):435–449. |
 © 2018 The Author(s). This work is published and licensed by Dove Medical Press Limited. The full terms of this license are available at https://www.dovepress.com/terms.php and incorporate the Creative Commons Attribution - Non Commercial (unported, v3.0) License.
By accessing the work you hereby accept the Terms. Non-commercial uses of the work are permitted without any further permission from Dove Medical Press Limited, provided the work is properly attributed. For permission for commercial use of this work, please see paragraphs 4.2 and 5 of our Terms.
© 2018 The Author(s). This work is published and licensed by Dove Medical Press Limited. The full terms of this license are available at https://www.dovepress.com/terms.php and incorporate the Creative Commons Attribution - Non Commercial (unported, v3.0) License.
By accessing the work you hereby accept the Terms. Non-commercial uses of the work are permitted without any further permission from Dove Medical Press Limited, provided the work is properly attributed. For permission for commercial use of this work, please see paragraphs 4.2 and 5 of our Terms.