")
Back to Journals » Drug Design, Development and Therapy » Volume 10
Comparison of oral absorption models for pregabalin: usefulness of transit compartment model
Authors Hong T, Han S , Lee J, Jeon S, Yim DS
Received 27 September 2016
Accepted for publication 4 November 2016
Published 7 December 2016 Volume 2016:10 Pages 3995—4003
DOI https://doi.org/10.2147/DDDT.S123318
Checked for plagiarism Yes
Review by Single anonymous peer review
Peer reviewer comments 2
Editor who approved publication: Professor Anastasios Lymperopoulos
Taegon Hong,1 Seunghoon Han,2,3 Jongtae Lee,2,3 Sangil Jeon,4 Dong-Seok Yim2,3
1Department of Clinical Pharmacology, Severance Hospital, Yonsei University College of Medicine, 2Department of Clinical Pharmacology and Therapeutics, Seoul St Mary’s Hospital, 3PIPET (Pharmacometrics Institute for Practical Education and Training), College of Medicine, The Catholic University of Korea, 4C&R Research, Seoul, Republic of Korea
Abstract: Pregabalin is an anticonvulsant used for the treatment of neuropathic pain and partial seizure in adults. The aim of this study was to develop a population pharmacokinetic (PK) model to describe the absorption characteristics of pregabalin given fasted or after meals. Data from five healthy subject PK studies (n=88) of single- or multiple-dose pregabalin (150 mg) were used. Pregabalin was administered twice daily, without meals or 30 min after a meal (regular or high-fat diet) in the morning and 30 min or 4 h after a meal (regular diet) in the evening. Serial plasma samples were collected up to 24 h after the last dose for PK analysis. Because the peak concentrations were not properly modeled by a conventional first-order absorption model, Erlang frequency distribution, Weibull-type absorption, and transit compartment models were tested on a two-compartment linear PK model using a nonlinear mixed-effects method (NONMEM; version 7.3). The transit compartment model best described the absorption characteristics of pregabalin regardless of meal status. We conclude that the absorption model should be carefully chosen based on the principle of model development and validation and not by following a conventional first-order absorption model for its popularity and simplicity, especially when the PK dataset includes densely sampled absorption-phase data.
Keywords: absorption, NONMEM, pregabalin, transit compartment model
Introduction
Pregabalin, an analog of gamma-aminobutyric acid, binds to the α2δ subunit of a voltage-dependent calcium channel in the central nervous system1 and reduces calcium influx at nerve terminals, thereby decreasing the release of neurotransmitters such as glutamate, noradrenaline, and substance P.2–4 For these mechanisms of action, pregabalin has been prescribed worldwide for partial-onset seizure, generalized anxiety disorder, and neuropathic pain disorders since 2005.
The pharmacokinetic (PK) characteristics of an oral pregabalin immediate-release formulation have been extensively studied. Pregabalin is rapidly absorbed in the fasting state, with peak plasma concentrations occurring within 1 h. Food reduces the absorption rate, resulting in lowered and delayed maximum plasma concentration without a clinically significant effect on the extent (bioavailability).5 A few studies on the population PK of pregabalin have been conducted;6–8 these studies commonly employed a one-compartment model with first-order absorption and elimination only without mentioning any attempt to find a better model. However, in these studies, a common trend to underestimate pregabalin concentrations around the time of maximum plasma concentration (Tmax) was observed, which suggests the possibility of an inappropriate choice of absorption model (first-order absorption).
Recently, we conducted several PK studies on healthy subjects to compare a reference (Lyrica® 150 mg; Pfizer, Inc., New York, NY, USA) and sustained release formulation of pregabalin developed by domestic companies in Korea. Single- and multiple-dose PK data (fasted or fed) of the reference formulation of pregabalin from these studies were analyzed to find an absorption model that best describes the peak concentrations. The aim of this study was to develop a population PK model to describe the absorption characteristics of pregabalin given after fasting or food.
Materials and methods
Studies and subjects
PK data from 88 healthy male subjects in five different studies performed at the clinical trial center, Seoul St Mary’s Hospital in Korea, were used for the population PK analysis. We enrolled healthy Korean male volunteers meeting the following eligibility criteria: age 20–45 years, weight within 20% of ideal body weight (IBW), and no clinically significant abnormalities. Individuals were excluded if they had any history or evidence of disease in the major organ systems or any other acute or chronic disease. Individuals who donated blood within 2 months of the first blood sampling were also excluded, irrespective of the amount. Subjects abstained from drugs, foods, and any other lifestyle factors that might alter the PK characteristics of pregabalin for at least 2 weeks before and throughout the participation. The demographic characteristics, such as age, weight, and creatinine clearance (CLCR), between studies were not found to be significantly different using a Kruskal–Wallis test (SAS version 9.4; SAS Institute Inc., Cary, NC, USA). The subjects’ demographics are summarized in Table 1. All the studies were designed and monitored in accordance with Korean Good Clinical Practice guidelines and the principles of the Declaration of Helsinki. The independent institutional review board of Seoul St Mary’s Hospital approved the protocols before the start of the trials, and all subjects provided written informed consent to participate.
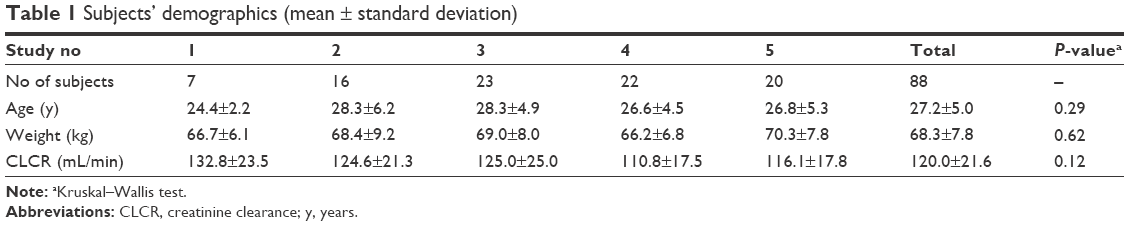 | Table 1 Subjects’ demographics (mean ± standard deviation) |
Study design and blood sampling
The study design, dosing regimen, and type of meals for the five studies are presented in Table 2. Peripheral venous blood was tightly sampled into ethylenediaminetetraacetic acid-containing tubes (Vacutainer; BD Belliver Industrial Estate, Plymouth, UK) up to 24 h after a single dose or the last dose at a steady state. The PK sampling time points for each study are summarized in Table 2. Plasma was separated immediately by centrifugation at 3,000× g for 10 min at 4°C and stored at −70°C until pregabalin was assayed.
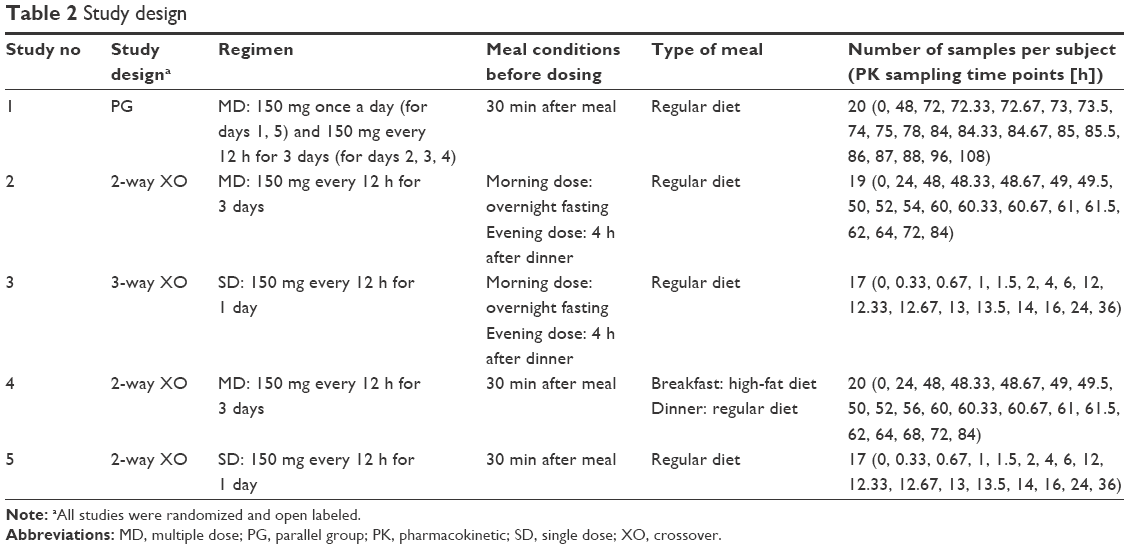 | Table 2 Study design |
Assay of pregabalin plasma concentration
The plasma concentration of pregabalin was assayed by validated methods using high-performance liquid chromatography coupled with tandem mass spectrometry (LC/MS/MS).9 The assay method was as follows. Plasma (100 μL) was precipitated with methanol containing an internal standard. After thoroughly vortexing for ~1 min, the samples were centrifuged at 12,000–13,000× g for 8–10 min at 4°C. The supernatant was diluted with methanol, and then 1–2 μL was injected into the LC/MS/MS system. Plasma concentrations were determined using four different analytical contract research organizations (CROs). The assay conditions including instruments were slightly different between the CROs (Table 3).
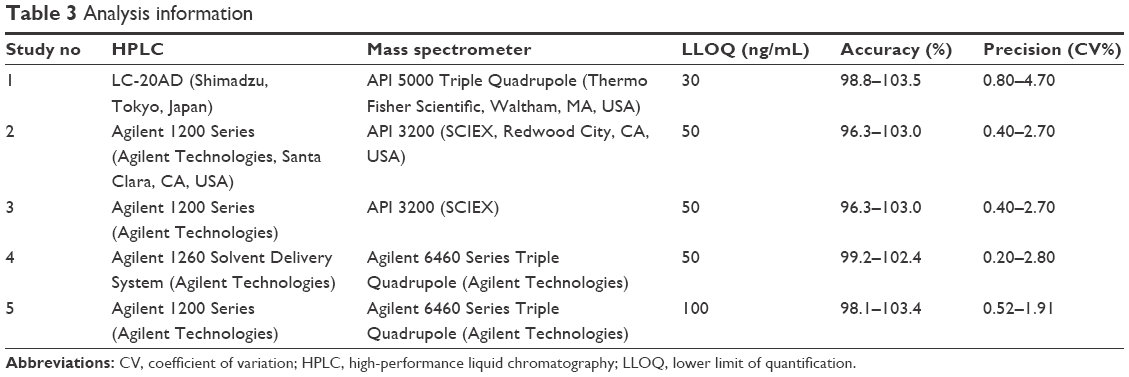 | Table 3 Analysis information |
Population PK model development
PK analysis with the mixed-effects modeling method was conducted using a nonlinear mixed-effects method (NONMEM), version 7.3 (ICON Development Solutions, Ellicott City, MD, USA), with the GFortran compiler. The dataset consisted of 1,615 pregabalin concentration observations from the 88 subjects in the five studies.
Basic PK model
The first-order conditional estimation method with interaction (FOCE-I) was used throughout the model building process.10 The between-subject variability (BSV) for each parameter was applied exponentially as follows:
|
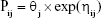
where Pij is the jth parameter for the ith individual, θj is the typical value of the jth population parameter, and ηij is a random variable following a Gaussian distribution with a mean of 0 and variance of ωj2.
To refine the PK model, the covariance between random effects in the model was explored using the OMEGA BLOCK option. Additive, proportional, and combined error models were tested for residual errors.
The appropriateness of model was evaluated based on various goodness-of-fit criteria, including diagnostic scatter plots, likelihood ratio test (LRT), and measures of model stability and adequacy (condition number, successful convergence, significant digits, and matrix singularity). The residual-based model diagnostic was performed using conditional weighted residuals (CWRES). The results for LRT were considered statistically significant if decreases in the objective function value (OFV) of nested models were >3.84 (P<0.05, one degree of freedom) and 5.99 units (P<0.05, two degrees of freedom) throughout the model building process. Besides the OFV, the predictive performance of the non-nested model was evaluated using the Akaike information criterion (AIC), which is expressed as follows:
|
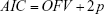
where p is the number of all parameters.
Both the one- and two-compartment models were tested, and all PK processes (except absorption) were assumed to follow first-order kinetics. The first-order rate constant and zero-order input (with or without lag time), Erlang frequency distribution,11 transit compartment,12 and Weibull-type absorption models13 were tested to determine the best description of the absorption profile of fasted and fed states. Because our drug concentration data include multiple-dose administration, we introduced the concept of dose superimposition to apply the transit compartment or Weibull-type absorption models.14
Covariate selection
Demographic and clinical variables, such as age, weight, IBW,15 and CLCR, calculated with the Cockcroft–Gault equation16 and fasted/fed status were tested as potential covariates for PK parameters.
Both visual (parameter vs covariate scatter plots) and numerical (generalized additive model in Xpose, version 4.0.4) covariate screening procedures were performed before adding each covariate to the basic model. Covariates that passed either of the screening procedures were subsequently tested in the model. Covariates were chosen using forward selection–backward elimination with the LRT.
Model evaluation
A bootstrap resampling method was used to evaluate the stability and robustness of the final PK model. Resampling with replacement generated 1,000 bootstrap datasets, and the final population PK model was fitted repeatedly to each of the 1,000 bootstrap datasets. The median and 95% confidence intervals of parameters obtained from this step were compared with the final parameter estimates. In addition, a visual predictive check (VPC) with 1,000 simulated datasets was also performed. Results from the VPC were assessed using graphical comparison of the simulated data overlaid observed data.
Results
Population PK model
The OFV results obtained from the different structural models tested are summarized in Table 4. A two-compartment model with first-order elimination and proportional residual error was chosen as the basic PK model. The OMEGA BLOCK structure between apparent clearance (CL/F) and apparent central compartment volume incorporated into the basic model was maintained throughout the model development process. The absorption profile of pregabalin was best described by the transit compartment model that resulted in a significant improvement in the AIC compared with the first-order absorption model (ΔAIC, 497.3) or the Erlang frequency distribution model (ΔAIC, 8.5) and better performance in the visual exploration of diagnostic plots. The average and maximal η shrinkage values of the final model parameters were 26.3% and 37.2%, respectively.
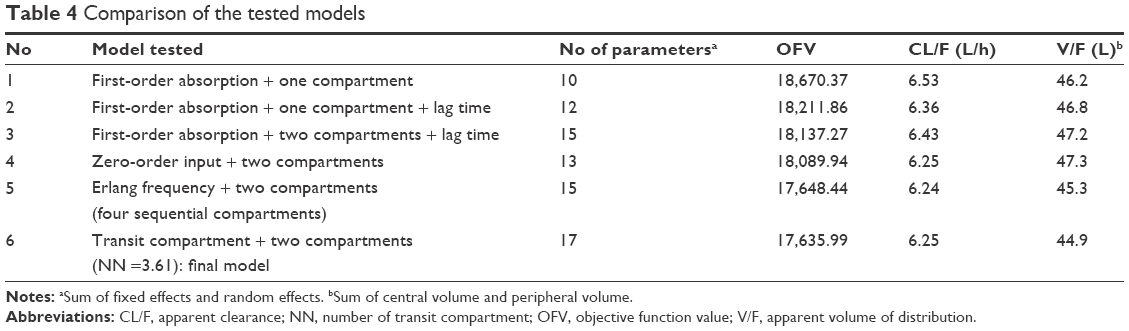 | Table 4 Comparison of the tested models |
The goodness-of-fit plots of the transit compartment model are shown in Figure 1. The distribution pattern of CWRES at individual Tmax also showed the outperformance of the transit compartment model (Figure 2).
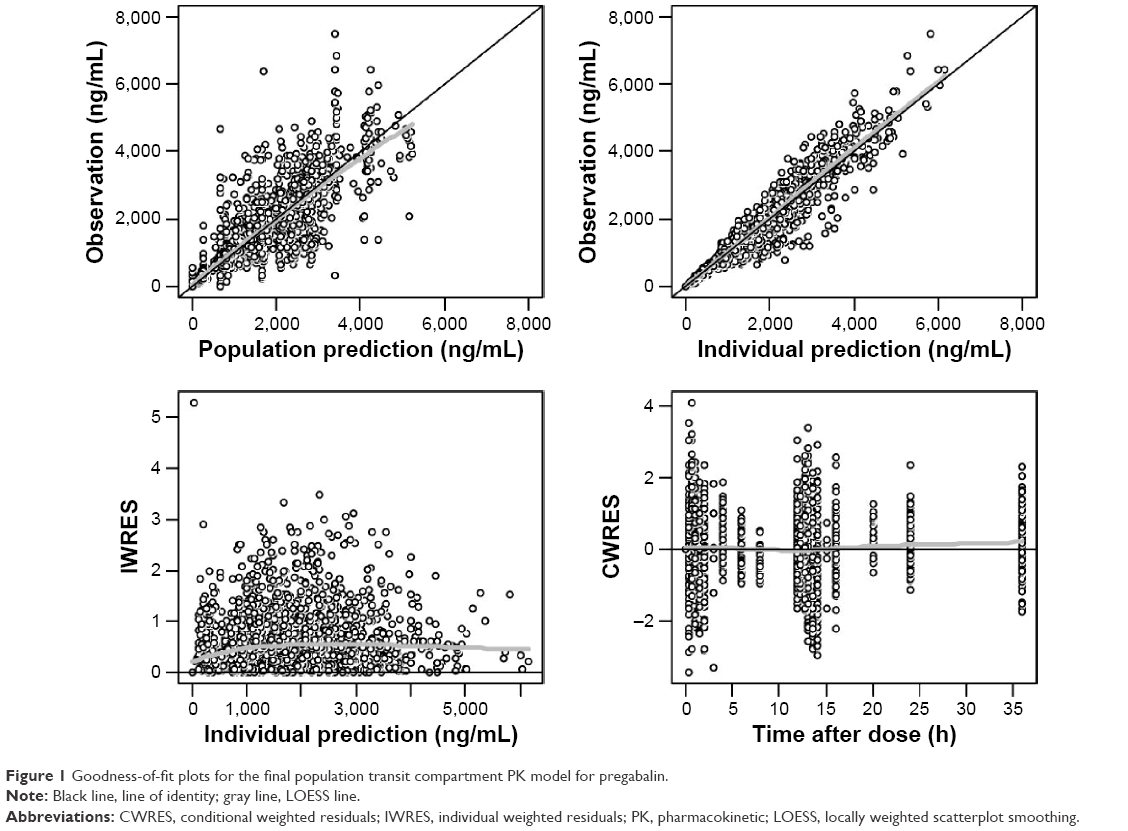 | Figure 1 Goodness-of-fit plots for the final population transit compartment PK model for pregabalin. |
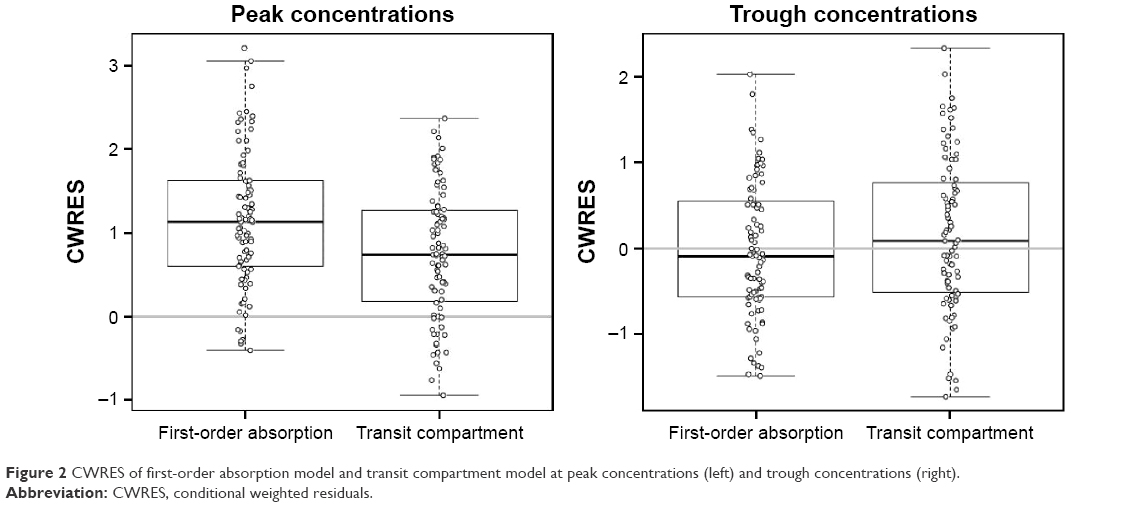 | Figure 2 CWRES of first-order absorption model and transit compartment model at peak concentrations (left) and trough concentrations (right). |
Because the absorption profile for the PK data obtained after overnight fasting was markedly different from that after a meal, the absorption parameters were estimated separately (Table 5). However, details such as dosing time differences after meals (30 min after versus 4 h after a meal) were not successfully modeled. The relative bioavailability changes caused by meals were not considered in the model because the changes were not acknowledged in the statistical tests of linear-trapezoidal area under the curves (AUCs; not shown in this report). CLCR on CL was the only covariate incorporated into the model.
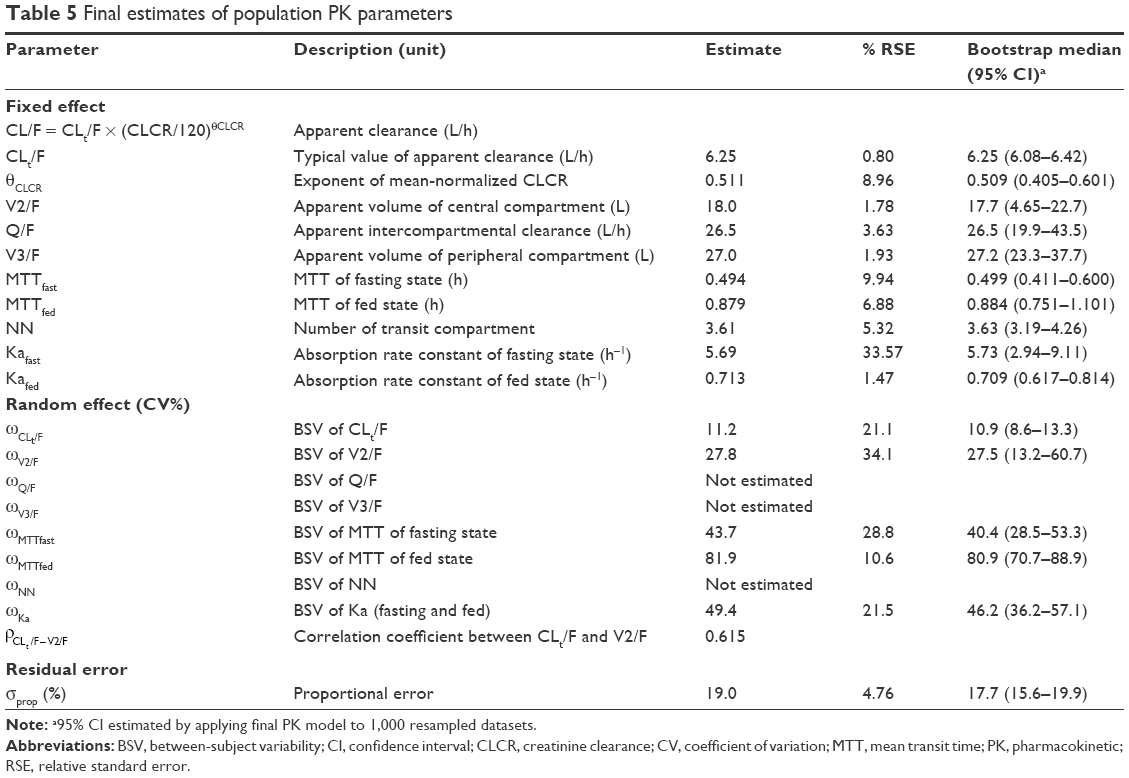 | Table 5 Final estimates of population PK parameters |
Model evaluation
The VPC plots from the final population PK models using the first-order absorption and transit compartment models were overlaid for comparison (Figure 3). Although the superiority of the transit compartment model was clear before testing covariates, we continued to build models using the first-order absorption model to compare the performance of final models built using different absorption models. Therefore, the first-order absorption model used to draw the VPC plot had the CLCR as its covariate as did the final transit compartment model that was compared in the same graph.
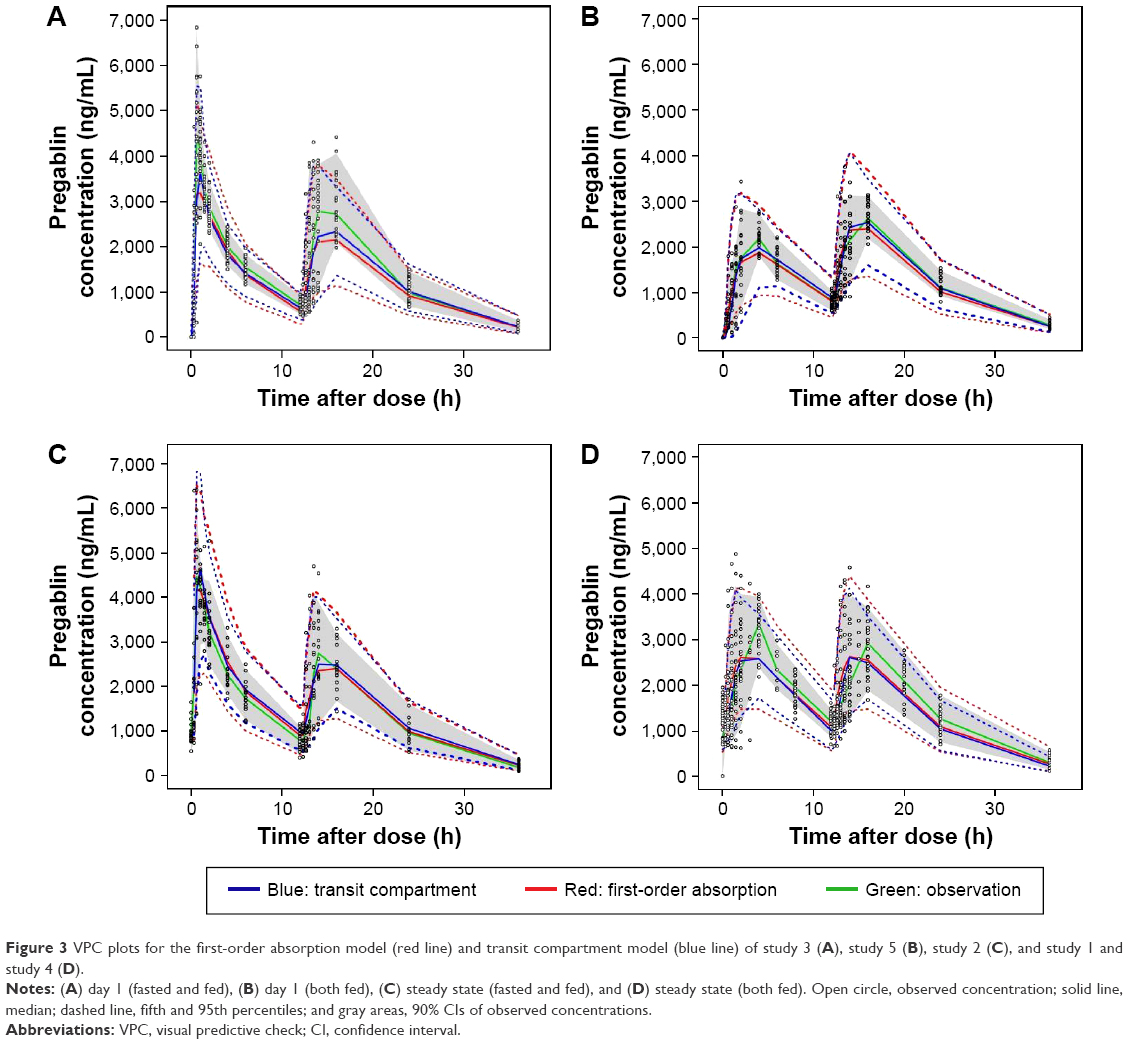 | Figure 3 VPC plots for the first-order absorption model (red line) and transit compartment model (blue line) of study 3 (A), study 5 (B), study 2 (C), and study 1 and study 4 (D). |
The location of the median and lower 5th percentile curves in comparison with the observed concentration spots scattered in the panels indicated better performance of the transit compartment model than the first-order absorption model. The median parameter estimates obtained from the 1,000 bootstrap data sets were very similar to the estimates of the final model, as summarized in Table 5.
Discussion
In this study, we sought to develop a population PK model for pregabalin based on our data, without following the population PK model previously used. We found that the pregabalin PK in our data was best described by two-compartment distribution and transit compartment absorption model.
There is a time delay between pregabalin exposure and response as a result of its binding to the calcium channel in the central nervous system that is consistent with considerable time lags between Tmax of cerebrospinal fluid and plasma.17 Bender et al18 adopted an effect compartment model to analyze the static allodynia response to pregabalin in rats with neuropathic pain. Accurate prediction of peak concentrations is pivotal in the effect compartment model approach. A pooled analysis of 11 clinical studies found that the relative risk of most common adverse events increased with the dose of pregabalin.19 Because the peak concentrations of pregabalin are dose proportional, they are closely related to adverse events. Therefore, proper description of the absorption process is crucial to evaluate efficacy and safety.
The absorption process of drug is complicated and influenced by many physiological factors, but the PK models frequently used are rather simple. In most cases, modelers seem to use first- or zero-order (with or without lag time) models without testing others. However, when these conventional models do not seem to properly describe the absorption profile, others such as the transit compartment or Weibull-type absorption can be considered. Gamma distribution, which is used in the transit compartment model, has the advantage of accounting for the concave-shaped time–concentration curves in the absorption phase; in other words, the absorption rate increases over time.20 This flexibility of the transit compartment model makes it possible to describe uncommon situations, such as the longer duration of absorption, from varying drug input rates along the gastrointestinal tract or release of the encapsulated drug through dissolution processes. Because a previous dose may not be absorbed completely before the next dosing time, we used the NONMEM code provided by Shen et al14 to implement the dose superimposition. We also sought to implement Weibull-type absorption for dose superimposition, but failed to estimate appropriate parameters.
Estimated population CL/F in the first-order absorption model (6.43 L/h) was slightly greater than that of the transit compartment model (6.25 L/h). This difference in CL/F may have been caused by the underestimated individual prediction (IPRED) concentrations by the first-order absorption model in the early absorption phase. In the lag-time IPRED, concentrations were 0. However, true concentrations may be somewhere between 0 and lower limit of quantification (LLOQ). At the Tmax, the IPRED concentrations in the first-order absorption model also tended to be lower than those in the transit compartment model. This may have caused smaller estimated AUC values and therefore larger CL/F in the first-order absorption model. The problem of the lag time model ignoring initial slow absorption is understood in the context that the concept of lag time is not physiologically plausible.20
Food significantly decreased the rate of oral absorption in the central compartment (rate constant decreased by 87.5% compared with overnight fasting) and prolonged mean transit time by ~0.39 h; however, differences in food types (high fat or regular) or time after meal (0.5 h versus 4 h) were not significantly different or discernible.
The population CL/F of pregabalin in the reports by Bockbrader et al6 and Shoji et al7 proportionally increased with CLCR up to a breakpoint of 107 mL/min (0.0464 or 0.0462× CLCR as mL/min) and remained unchanged beyond this point. However, such a breakpoint was not found in data from our healthy subjects. As illustrated in Figure 4, the individual predicted CL/F in the final model increased with CLCR without showing any saturation or breakpoint-like pattern around the CLCR 107 mL/min, which may have resulted from the relatively smaller number and homogeneity of the subjects in our study. The population CL/F of pregabalin reported previously was 4.96 L/h6 or 4.94 L/h7 in individuals with a CLCR of 107 mL/min and an IBW of 62 kg. In a typical individual with the same CLCR, the CL/F was predicted to be 5.89 L/h by our transit compartment model. Such differences may be attributed to differences in subjects (patients vs young healthy male volunteers).
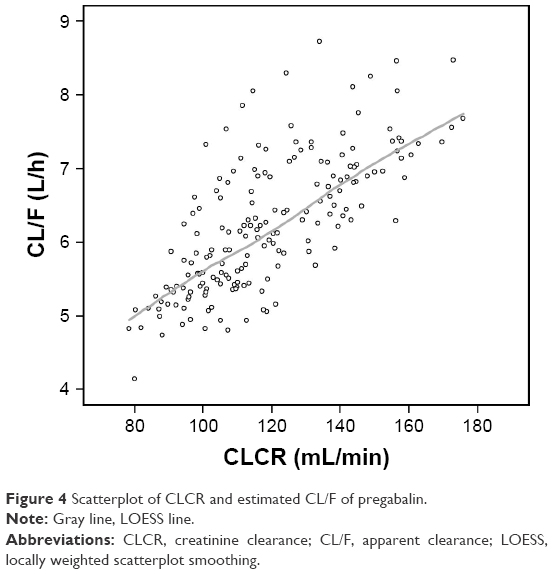 | Figure 4 Scatterplot of CLCR and estimated CL/F of pregabalin. |
In the datasets used in the references cited above, fasted PK datasets densely sampled from healthy volunteers at the absorption phase that may show discernible distribution phases were included. However, both groups of the investigators started their model development at the one-compartment model with first-order absorption and elimination without mentioning further comparison of multicompartment or any other absorption models. It is supposed that their population analyses were mainly focused on finding structural models and covariates for the CL of pregabalin. Although the transit compartment model used in the present report is more complicated than the simple zero- or first-order absorption model, it may be applied for a more precise evaluation of safety profiles of drugs when their adverse effects are closely related to peak concentrations.
Conclusion
In the present report, we showed that the population absorption profile of pregabalin was better described by a transit compartment model than by a first-order absorption model with lag time. Through the present analysis, we concluded that the absorption model should be carefully chosen based on the principle of model development and validation, as opposed to following a conventional model for popularity and simplicity, especially when the PK dataset includes densely sampled absorption-phase data.
Acknowledgments
This study was supported by Global Center of Excellence in Clinical Trials (HI14C1062), Yonsei University Health System funded by Ministry of Health and Welfare, Korea. A part of this manuscript was presented at the Population Approach Group in Europe (PAGE) meeting in 2013 (Glasgow, UK).
Disclosure
The authors report no conflicts of interest in this work.
References
Taylor CP, Angelotti T, Fauman E. Pharmacology and mechanism of action of pregabalin: the calcium channel α2-δ (alpha2-delta) subunit as a target for antiepileptic drug discovery. Epilepsy Res. 2007;73(2):137–150. | ||
Dooley DJ, Donovan CM, Pugsley TA. Stimulus-dependent modulation of [(3)H] norepinephrine release from rat neocortical slices by gabapentin and pregabalin. J Pharmacol Exp Ther. 2000;295(3):1086–1093. | ||
Fink K, Dooley DJ, Meder WP, et al. Inhibition of neuronal Ca2+ influx by gabapentin and pregabalin in the human neocortex. Neuropharmacology. 2002;42(2):229–236. | ||
Micheva KD, Taylor CP, Smith SJ. Pregabalin reduces the release of synaptic vesicle form cultured hippocampal neurons. Mol Pharmacol. 2006;70(2):467–476. | ||
Bockbrader HN, Radulovic LL, Posvar EL, et al. Clinical pharmacokinetics of pregabalin in healthy volunteers. J Clin Pharmacol. 2010;50(8):941–950. | ||
Bockbrader HN, Burger P, Knapp L, Corrigan BW. Population pharmacokinetics of pregabalin in healthy subjects and patients with chronic pain or partial seizures. Epilepsia. 2011;52(2):248–257. | ||
Shoji S, Suzuki M, Tomono Y, Bockbrader HN, Matsui S. Population pharmacokinetics of pregabalin in healthy subjects and patients with post-herpetic neuralgia or diabetic peripheral neuropathy. Br J Clin Pharmacol. 2011;72(1):63–76. | ||
Olesen AE, Olofsen E, Olesen SS, et al. The absorption profile of pregabalin in chronic pancreatitis. Basic Clin Pharmacol Toxicol. 2012;111(6):385–390. | ||
Vaidya VV, Yetal SM, Roy SM, Gomes NA, Joshi SS. LC-MS-MS determination of pregabalin in human plasma. Chromatographia. 2007;66(11):925–928. | ||
Boeckmann A, Sheiner L, Beal S. NONMEM User’s Guide – Part V, Introductory Guide. San Francisco, CA: NONMEM Project Group, University of California at San Francisco; 2013. | ||
Rousseau A, Léger F, Le Meur Y, et al. Population pharmacokinetic modeling of oral cyclosporine using NONMEM. Ther Drug Monit. 2004;26(1):23–30. | ||
Savic RM, Jonker DM, Kerbusch T, Karlsson MO. Implementation of a transit compartment model for describing drug absorption in pharmacokinetic studies. J Pharmacokinet Pharmacodyn. 2007;34(5):711–726. | ||
Petricoul O, Cosson V, Fuseau E, Marchand M. Population models for drug absorption and enterohepatic recycling. In: Ette EI, Williams PJ, editors. Pharmacometrics: The Science of Quantitative Pharmacology. Hoboken, NJ: John Wiley & Sons, Inc. 2007:345–382. | ||
Shen J, Boeckmann A, Vick A. Implementation of dose superimposition to introduce multiple doses for a mathematical absorption model (transit compartment model). J Pharmacokinet Pharmacodyn. 2012;39(3):251–262. | ||
Pai MP, Paloucek FP. The origin of the “ideal” body weight equations. Ann Pharmacother. 2000;34(9):1066–1069. | ||
Cockcroft DW, Gault MH. Prediction of creatinine clearance from serum creatinine. Nephron. 1976;16(1):31–41. | ||
Buvanendran A, Kroin JS, Kari M, Tuman KJ. Can a single dose of 300 mg of pregabalin reach acute antihyperalgesic levels in the central nervous system? Reg Anesth Pain Med. 2010;35(6):535–538. | ||
Bender G, Florian JA Jr, Bramwell S, et al. Pharmacokinetic-pharmacodynamic analysis of the static allodynia response to pregabalin and sildenafil in a rat model of neuropathic pain. J Pharmacol Exp Ther. 2010;334(2):599–608. | ||
Semel D, Murphy TK, Zlateva G, Cheung R, Emir B. Evaluation of the safety and efficacy of pregabalin in older patients with neuropathic pain: results from a pooled analysis of 11 clinical studies. BMC Fam Pract. 2010;11:85. | ||
Wilkins JJ, Savic RM, Karlsson MO, et al. Population pharmacokinetics of rifampin in pulmonary tuberculosis patients, including a semimechanistic model to describe variable absorption. Antimicrob Agents Chemother. 2008;52(6):2138–2148. |
 © 2016 The Author(s). This work is published and licensed by Dove Medical Press Limited. The full terms of this license are available at https://www.dovepress.com/terms.php and incorporate the Creative Commons Attribution - Non Commercial (unported, v3.0) License.
By accessing the work you hereby accept the Terms. Non-commercial uses of the work are permitted without any further permission from Dove Medical Press Limited, provided the work is properly attributed. For permission for commercial use of this work, please see paragraphs 4.2 and 5 of our Terms.
© 2016 The Author(s). This work is published and licensed by Dove Medical Press Limited. The full terms of this license are available at https://www.dovepress.com/terms.php and incorporate the Creative Commons Attribution - Non Commercial (unported, v3.0) License.
By accessing the work you hereby accept the Terms. Non-commercial uses of the work are permitted without any further permission from Dove Medical Press Limited, provided the work is properly attributed. For permission for commercial use of this work, please see paragraphs 4.2 and 5 of our Terms.