")
Back to Archived Journals » Advances in Genomics and Genetics » Volume 5
Coding and noncoding expression patterns associated with rare obesity-related disorders: Prader–Willi and Alström syndromes
Authors Butler M, Wang K, Marshall J, Naggert J, Rethmeyer J, Gunewardena S, Manzardo A
Received 19 September 2014
Accepted for publication 19 November 2014
Published 27 January 2015 Volume 2015:5 Pages 53—75
DOI https://doi.org/10.2147/AGG.S74598
Checked for plagiarism Yes
Review by Single anonymous peer review
Peer reviewer comments 3
Editor who approved publication: Dr John Martignetti
Merlin G Butler,1,2 Kun Wang,1 Jan D Marshall,3 Jürgen K Naggert,3 Jasmine A Rethmeyer,1 Sumedha S Gunewardena,4 Ann M Manzardo1
1Department of Psychiatry and Behavioral Sciences, 2Department of Pediatrics, University of Kansas Medical Center, Kansas City, KS, USA; 3The Jackson Laboratory, Bar Harbor, ME, USA; 4Department of Biostatistics, Molecular and Integrative Physiology, University of Kansas Medical Center, Kansas City, KS, USA
Abstract: Obesity is accompanied by hyperphagia in several classical genetic obesity-related syndromes that are rare, including Prader–Willi syndrome (PWS) and Alström syndrome (ALMS). We compared coding and noncoding gene expression in adult males with PWS, ALMS, and nonsyndromic obesity relative to nonobese males using readily available lymphoblastoid cells to identify disease-specific molecular patterns and disturbed mechanisms in obesity. We found 231 genes upregulated in ALMS compared with nonobese males, but no genes were found to be upregulated in obese or PWS males and 124 genes were downregulated in ALMS. The metallothionein gene (MT1X) was significantly downregulated in ALMS, in common with obese males. Only the complex SNRPN locus was disturbed (downregulated) in PWS along with several downregulated small nucleolar RNAs (snoRNAs) in the 15q11-q13 region (SNORD116, SNORD109B, SNORD109A, SNORD107). Eleven upregulated and ten downregulated snoRNAs targeting multiple genes impacting rRNA processing, developmental pathways, and associated diseases were found in ALMS. Fifty-two miRNAs associated with multiple, overlapping gene expression disturbances were upregulated in ALMS, and four were shared with obese males but not PWS males. For example, seven passenger strand microRNAs (miRNAs) (miR-93*, miR-373*, miR-29b-2*, miR-30c-1*, miR27a*, miR27b*, and miR-149*) were disturbed in association with six separate downregulated target genes (CD68, FAM102A, MXI1, MYO1D, TP53INP1, and ZRANB1). Cell cycle (eg, PPP3CA), transcription (eg, POLE2), and development may be impacted by upregulated genes in ALMS, while downregulated genes were found to be involved with metabolic processes (eg, FABP3), immune responses (eg, IL32), and cell signaling (eg, IL1B). The high number of gene and noncoding RNA disturbances in ALMS contrast with observations in PWS and males with nonsyndromic obesity and may reflect the progressing multiorgan pathology of the ALMS disease process.
Keywords: hyperphagia, microarray analysis, gene, obesity, exon expression, miRNA expression
Introduction
There are several obesity-related genetic disorders identified in humans, but monogenic causes of morbid obesity are uncommon. Obesity is accompanied by hyperphagia in several classical but rare genetic obesity-related syndromes, such as Prader–Willi syndrome (PWS) and Alström syndrome (ALMS).1–4 A better understanding of the basis of obesity will also elucidate mechanisms controlling food intake, exercise, and energy balance. Coding and noncoding RNA expression, specifically microRNAs (miRNAs) and small nucleolar RNAs (snoRNAs) that regulate a variety of biological processes, may impact appetite control, adipocyte formation, metabolic activity, and insulin resistance.2 To investigate the unique, disease-specific patterns and common disturbed mechanisms in the development of obesity, coding and noncoding expression patterns will be characterized in adult males with ALMS and PWS and nonsyndromic obesity in relationship to nonobese adult males.
Alström syndrome
ALMS (OMIM 203800) is caused by mutations of the ALMS1 gene with multiple organ system involvement including ocular findings, hearing loss, dilated cardiomyopathy, and pulmonary hypertension. Fibrotic changes are noted in most organs with advancing age.1–4
Hyperphagia and decreased physical activity exacerbated by loss of both vision and hearing contribute to the development of obesity.2 Most individuals with ALMS have normal intelligence, but major depression, obsessive compulsive behavior, and psychiatry problems are often reported.1–3 Reduced glomerular filtration rate and end-stage renal disease can occur during the teenage years, causing death in about 10% of ALMS individuals.1–3
The ALMS1 gene is located on chromosome 2p13 and consists of 23 exons and expressed in most tissues including lymphoblasts.2–7 Over 100 different mutations have been reported in the ALMS1 gene usually of the nonsense type (55%), indels (42%), or splice site (3%), with the majority located in exons 8, 10, and 16 (41% of all mutations are found in this exon).1,2 The protein encoded by the ALMS1 gene is thought to play a role in ciliary function, intercellular trafficking, and adipocyte differentiation.
Prader–Willi syndrome
PWS (OMIM 176270) is a complex neurodevelopmental genomic imprinting disorder usually due to lack of paternally expressed genes from a deletion of the chromosome 15q11-q13 region seen in ~75% of cases, maternal disomy 15 in ~25% of cases, and imprinting center defects in the remaining 1%–3% of cases.8–14 The activity of imprinted genes depends on the sex of the parent contributing the gene allele.15
PWS is characterized by infantile hypotonia, poor sucking and feeding difficulties, growth hormone deficiency, short stature, hypogonadism, and hyperphagia in early childhood leading to obesity, if uncontrolled. Mild intellectual disability, problematic behaviors (eg, skin picking, tantrums, aggressive food seeking), and hypopigmentation are common.8,10,11,16,17 PWS has a prevalence of 1 in 15,000 individuals and is recognized as the most common syndromic cause of morbid obesity in childhood.8,9
Approximately 100 genes and/or transcripts are identified in the chromosome 15q11-q13 region, with fewer than 10 genes imprinted or paternally active and expressed in most tissues including lymphoblasts.18–21 The complex SNRPN (small nuclear ribonucleoprotein N) locus along with SNURF (SNRPN upstream reading frame) found in the region and copies of small nucleolar C/D box RNAs (snoRNAs) or SNORDs are disturbed in this syndrome involved with RNA processing.9 The MKRN3, MAGEL2, NDN, and C15orf2 genes in this region participate in neural development and function, while recent evidence supports a role in precocious puberty for the MKRN322 gene and autism for the MAGEL2 gene.23
Coding and noncoding RNA expression
Advances in genetic technology and bioinformatics have brought genetics to the forefront in the study of neurodevelopment. Coding RNA (mRNA or genes) is required for protein production (structural and regulatory), while noncoding RNA (eg, miRNA, snoRNA) plays a role in a variety of biological processes and pathways and pathogenesis, possibly applicable to obesity through gene regulation, although the mammalian genome contains fewer than 2% protein-coding genes.24
Noncoding miRNAs are about 22 nucleotides in size and have the ability to control gene expression through posttranscriptional regulation by binding to the 3'-untranslated region of specific target mRNAs.25,26 This binding inhibits protein translation by affecting mRNA degradation or processing, thereby regulating the amount of protein encoded by the gene target.27 The mature guide strand miRNA generally exhibits an inverse expression correlation with the expression level of target genes.28 More than 1,100 unique miRNAs are found in human cells and have complementary sites that bind to thousands of predicted mRNA targets.26
miRNAs are derived from hairpin or stem-loop structures requiring processing by Drosha proteins in the nucleus of the cell and RNAse III endoribonuclease Dicer in the cytoplasm that converts the hairpin precursor or pre-miRNA to a mature miRNA that is complementary to specific target genes (mRNA). miRNAs are incorporated into RNA-induced silencing complexes (RISCs) that are associated with Argonaute proteins and regulate mature miRNA expression levels.29–32 The processed pre-miRNA is actively transported through the nuclear membrane to the cytoplasm, where the hairpin or loop structure is cleaved by Dicer.33 Disruptions in this process can cause additional intermediates with cleaved precursor miRNAs or ac-pre-miRNAs, leading to alternative forms interfering with regulation of gene function and protein translation at multiple levels.29,31,34 Low-frequency passenger miRNA strands designated as star (*) or 5p are produced during processing but mostly degraded. These passenger miRNA strands are complementary to the mature major guide strand and, if not degraded, act as an anti-miRNA factor interfering with the function of the mature guide strand. Low-frequency passenger strands are read in both the 3′ and 5′ directions, suggesting coordinated regulation of miRNA production.34 Hence, human miRNAs are generated in two forms: immature (designate as hsa-mir) and mature (designated as hsa-miR), and the balance of subtypes can influence gene expression and quantity of protein produced.
miRNAs are critical for both development and gene regulation with differential expression in tissues.35–40 miRNAs regulate and target most protein-coding genes in the human genome, with multiple classes highly expressed in the nervous system.25,41 They actively participate in neuronal development, function, and network activity.40,42–44 snoRNAs are noncoding RNAs that are larger in size than miRNAs and act with other ribonuclear proteins to guide modification of RNA transcripts, particularly ribosomal RNA (rRNA), through methylation, pseudouridylation, and alternative splicing.45–49 Two primary snoRNA classes are defined based upon the presence or absence of conserved sequence motifs: C/D box (RUGAUGA/CUGA) snoRNAs generally guide or carry out 2'O-ribose-methylation of pre-rRNA to mature rRNA, while H/ACA box (ANANNA/ACA) snoRNAs guide pseudouridylation. A third composite class of snoRNAs are referred to as Cajal body-specimen RNAs (scaRNAs) due to their tendency to accumulate in this body and possess both H/ACA and C/D box sequences having dual functions.45–49 Methylation and/or pseuodouridylation of RNA are processes that may influence RNA folding and protein interactions. Still other snoRNAs may act as miRNAs controlling protein production or target intron–exon borders of mRNAs leading to splicing events and protein isoforms dictating protein quality in humans.35,36,39 snoRNAs located in intronic gene regions do interact with the host gene product and may be used to internally regulate gene function or activity.
Another emerging area of research interest is the role of snoRNAs in small nucleolar ribonucleoprotein (snoRNP) complexes and associated sumoylation processes involved with large and small ribosome subunit assembly.50,51 Small ubiquitin-related modifiers (SUMOs) are known to covalently link to selected ribonuclear proteins via lysine residues through a complex enzymatic cascade involving a unique enzyme ligase and an E2 conjugating enzyme (UBC9).52,53 One of the best characterized SUMO pathways is the SUMO E3 ligase RanBP2 (Nup358) involving the Ran GTPase (E1) activating protein (RanGAP1).54,55 The SUMO E3 ligase RanBP2(Nup358) complex impacts upon nucleoplasmic transport, microtubule binding and organization, as well as spindle assembly and disassembly56,57 functions, similar to those proposed for the ALMS1 gene.
For obesity-related genetic conditions, little is known about the role and/or frequency of abnormalities in snoRNAs, miRNAs, and the proportion of mature major guide strands (hsa-miR) versus the less frequent minor passenger strands with interference in immature stem loop (hsa-mir) processing. We report our experience with coding and noncoding RNA expression patterns for the first time using microarray technology and bioinformatics with living lymphoblastoid cells from selected male adults with PWS and ALMS compared with nonsyndromic obese or nonobese males to give insight into the molecular genetic processes controlling gene function in these rare obesity-related disorders. Lymphoblasts were selected as the cell source for this study. Other fresh tissue sources, such as skin, liver, fat, muscle, or brain from biopsies or surgical specimens, were not available for coding or noncoding RNA expression studies. Previous studies have shown the feasibility of lymphoblasts for gene expression or microarray RNA analysis in individuals with autism,58 fragile X,59 Prader–Willi,60–64 and Angelman syndromes,63,65 including comparison with other tissue sources and brain specimens.63,66 Gene expression disturbances are detectable in lymphoblastoid cells in disorders with single gene mutation, (eg, fragile X and Angelman syndromes),59,65 uniparental disomy 15,60,67 or cytogenetic deletions (eg, 15q11-q13 deletions)60,61,67 or duplications,62 further supporting the selection of readily available lymphoblastoid cells in our coding and noncoding RNA expression studies in rare obesity-related genetic disorders to study the genes involved with obesity.
Materials and methods
Participants
Expression profiles for noncoding RNA (miRNA) and coding RNA (gene or exon) were characterized from total RNA collected from actively growing lymphoblastoid cells established from readily available peripheral blood extracted using the MiRNA Easy kit from Qiagen (Gaithersburg, MD, USA) following the manufacturer’s instructions. Our participants were adult Caucasian males with ALMS and similarly aged adult Caucasian males with PWS. The males with ALMS (average body mass index [BMI] =42) and nonsyndromic obesity (average BMI =51) were categorized as having morbid obesity (BMI >40) while the PWS males (average BMI =39) had a BMI in the obese range (BMI ≥30; Table 1). All participants signed a consent form approved by the local Institutional Review Board.
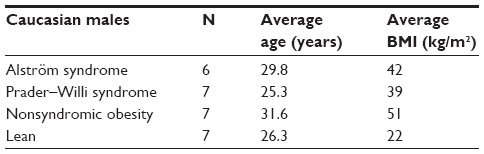 | Table 1 Description of adult male participants |
The adult males with ALMS and PWS were genetically confirmed before study with either 15q deletions (N=5 males) or maternal disomy 15 (N=2 males) in PWS or ALMS1 gene mutations in ALMS. The mean RNA integrity number (RIN) was >6 for all subjects, which was considered adequate for microarray expression analysis. Samples were obtained from the subjects following consent using forms approved by the local Human Subjects Committee. The same RNA aliquot was used for miRNA and exon expression studies as well as for quantitative reverse-transcription polymerase chain reaction (qRT-PCR) validation. Array preparation, processing, and hybridization were performed by the Microarray Core Facility at the University of Kansas Medical Center, following established protocols in their laboratory setting.
Microarray exon expression
The Human Exon 1.0 ST (sense target) Array (Affymetrix, Inc.; Santa Clara, CA, USA) was used in our study to not only identify mRNA expression patterns and disturbances at the gene level but also to assess the functional impact of recognized miRNA expression useful for experimental validation purposes. Both exon and miRNA arrays used the same RNA source for hybridization studies. The practice of using high-throughput techniques and merged microarray datasets to validate experimental data is gaining acceptance in research.66,68,69 For example, overexpression of major guide mature miRNAs should show decreased expression of their predicted and validated target mRNAs with the frequency of miRNA classes in comparison with the two study subject groups. Quantitative RT-PCR was also performed for a subset of disturbed target mRNAs for validation.
The array description and specification can be found in more detail in Manzardo et al.66 Briefly, the Human Exon 1.0 ST Array contained source cDNA-based content consistent with the human RefSeq mRNAs, GenBank® mRNAs, and/or ESTs from dbEST. All probe locations were obtained from the human genome reference GRCh36/hg19 build assembly (http://genome.ucsc.edu/cgi-bin/hgGateway?db=hg19) with probe length ≥25 mer in size and containing >5.3 million probes grouped into 1.4 million probe sets. These probe sets interrogate at the exon level for 28,869 well-annotated genes using multiple probes. The average probe density was four probes per exon or 30–40 probes per transcript. About 300,000 core exon probe sets in this array map to 17,800 RefSeq genes. The Robust Multi-chip Analysis (RMA) algorithm was used to derive CEL file probe-level hybridization intensities at the gene expression level, as previously reported.66 The RMA model normalizes signal intensities to the median of control samples, corrects the background for each array, and summarizes the probe set intensities for analysis purposes. Gene expression levels were also summarized using the Median Polish algorithm, as previously described.66
Bioinformatics methodology for the analysis of high-resolution exon microarray data is still evolving, particularly the techniques utilized for the calculation of false discovery rates (FDRs). The current methodology applied for gene-level analysis does not adjust for increased power and confidence associated with the use of multiple probes per gene. Conversely, the technique considers each probe for a gene as a separate “independent” experiment resulting in a bias toward a higher rather than lower FDR estimate for gene disturbances. For this reason, the FDR cutoff for these experiments was set at ≤0.2 and the fold change set at a cutoff of 1.5.
Microarray miRNA and snoRNA expression
The study uses GeneChip miRNA 2.0 Array (Affymetrix, Inc.) to examine noncoding miRNA (snoRNA) expression disturbances in our adult males with ALMS and PWS relative to nonsyndromic obese and nonobese adult male controls following protocols as previously described.58 A more complete description of array specifications can be found in Manzardo et al.66 Briefly, the noncoding array utilizes sources from Sanger miBase miRNA (http://microrna.sanger.ac.uk), snoRNABase (http://www.snorna.biotoul.fr/coordinates.php), and Ensembl Archive (http://www.ensembl.org/biomart/martview) with probe locations based on the human genome reference GRCh36/hg19 build assembly (http://genome.ucsc.edu/cgi-bin/hgGateway?db=hg19). The average probe length is ≤25 mer in size and includes 20,287 total probe sets per array. For this array, the human probe set encompasses 1,105 mature miRNAs, 1,121 pre-miRNAs, 2,302 snoRNAs, and 32 scaRNAs. Array hybridization and processing were performed according to standard protocols using the same batch of commercially available and standard laboratory conditions for microarrays.
Quantitative reverse-transcription PCR
qRT-PCR was used to evaluate genes differentially expressed in our exon arrays, and an additional subset of selected target genes found to be disturbed (both up and downregulated) was then considered for validation purposes. The first-strand cDNA was synthesized from 500 ng of total mRNA using the iScript cDNA Syntheses Kit (Bio-Rad, Hercules, CA, USA). Primers for MT1X, FABP3, and RB1 and the internal control gene GAPDH were purchased from QIAGEN (Hilden, Germany) and selected to avoid potential genomic DNA contamination by spanning primers only at exon–exon junctions. SYBR green PCR assays were performed using the MJ Mini Personal Thermal Cycler (Bio-Rad). The PCR cycling parameters consisted of PCR cycles at 95°C for 10 minutes, then followed by 40 cycles of 95°C for 10 seconds and 60°C for 1 minute. Expression levels of the selected target genes (MT1X, FABP3, and RB1) were normalized to GAPDH. Fold expression induction values were calculated using the ΔΔCt method according to established protocols.63,64 With advanced genetic technology and coding and noncoding expression microarrays, the validation of expression patterns can also be confirmed by the comparison of coding (exon) and noncoding (miRNAs) microarray hybridization data from the same RNA source, which is becoming a more commonly accepted method for validation purposes.66,68,69
Data analysis
Exon array analysis
The Affymetrix GeneChip Human Exon 1.0 ST Array data were used for gene-level expression profiling and examination of the typically inverse correlation between specific major guide mature miRNAs and target gene expression. Gene-level expression profiles were determined using signal intensity values averaged over multiple probes per exon as reported by Manzardo et al.66 The Median Polish algorithm was used for RMA-background-corrected and quantile-normalized array results and to generate log (base 2)-transformed expression values.66,70 Linear contrast measures were used to calculate fold change statistics for individual genes using the least square means of the (log) ALMS (PWS or obese) and (log) nonobese control males, and then to back-transform the results to a linear scale. Significance was based on the t-statistic of the linear contrast. The FDR for exon (gene) expression data was set at ≤0.2. The cutoff for fold change and prediction target analysis was set at 1.5.
Target miRNA predictions were investigated for all disturbed exons and miRNAs meeting criteria (FDR ≤0.2 and fold change >1.5) with established web-based search engines (targetscan.org, microRNA.org and TarBase 6.0).68,69,71 These programs utilize specially developed prediction software and algorithms that consider sequence complementarity that are weighted for sequence matching and molecular energetics as well as manually curated, experimentally validated interactions. The predictions were generated from validated associations in a comprehensive database of experimentally supported human and animal miRNA targets using similar microarray technology66,69 and as similarly performed elsewhere using established protocols.66
MiRNA array analysis
The Affymetrix GeneChip miRNA 2.0 Array was used to obtain the miRNA expression profile for 2,226 human miRNA probesets (1,105 mature miRNA; 1,121 pre-miRNA), which were background-corrected, normalized, and summarized using the RMA procedure.66,70 A multiple linear regression model fitted log (base 2) intensity values such that Y = μ + ALMS + Scan Date + e, where the intercept μ models the common effect, the categorical variable “ALMS” thereby models the condition (ALMS or nonobese control), while the “Scan Date” models the random effects related to the particular day the scan was taken. The specific random error (variable “e”) associated with the model is assumed to be normally and independently distributed with mean zero. Batch effects related to the RIN were examined using principal component analysis and as a factor in our linear regression model. The Wilcoxon rank-sum test was carried out using the Affymetrix Expression Console to compare the miRNA probe signal (signal) to the GC-content-matched anti-genomic probes (background noise). Detection of signal in at least two-thirds of the samples was sufficient to meet significant criteria for probe-level hybridization in the ALMS group for upregulated miRNA or significant detection of signal in at least two-thirds of the samples in the control group for downregulated miRNAs. The Benjamini and Hochberg procedure was used to calculate the FDR, which was set at ≤0.2 for miRNA expression. A similar research design, interpretation, and analytical approach were undertaken with PWS males versus nonobese control males and obese versus nonobese control males and in the comparison of snoRNAs in the subject groups.
Results
Exon (gene) expression
There were 231 (FDR ≤0.2; fold ≥1.5), 196 (FDR ≤0.15; fold ≥1.5), and 37 (FDR ≤0.10; fold ≥1.5) upregulated genes found in the six ALMS adult males versus seven nonobese control males, but no upregulated genes were seen in the seven PWS or seven nonsyndromic obese adult males compared with nonobese males at similar ages. The Venn diagram (Figure 1) shows the top ten upregulated genes in lymphoblastoid cell lines found only in ALMS males. The 231 upregulated genes in ALMS were grouped by gene ontology (GO) biological processes based on reported GO and function (eg, http://www.geneontology.org/GO.process) into the top ten categories and shown in Figure 2. The top 30 upregulated genes in ALMS are listed in Table 2.
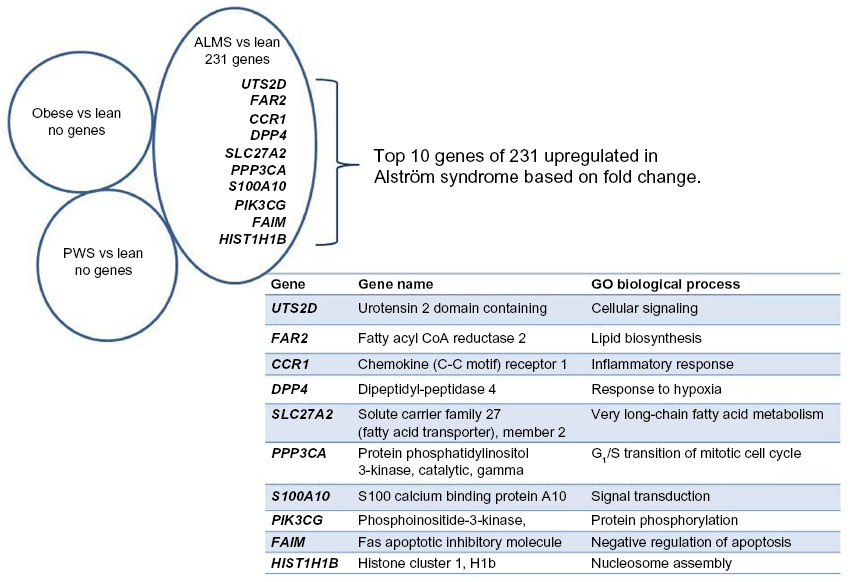 | Figure 1 Upregulated genes by subject group using lymphoblasts from nonobese (lean) males as controls (FDR ≤0.2; fold ≥1.5) but upregulated genes found only for ALMS. |
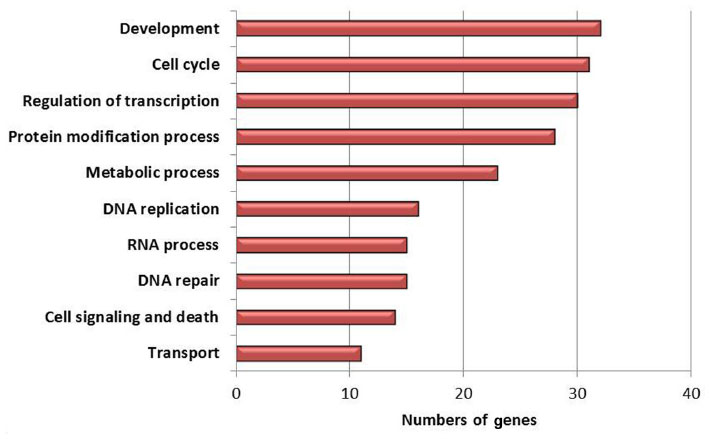 | Figure 2 Upregulated genes grouped by GO biological process in ALMS. |
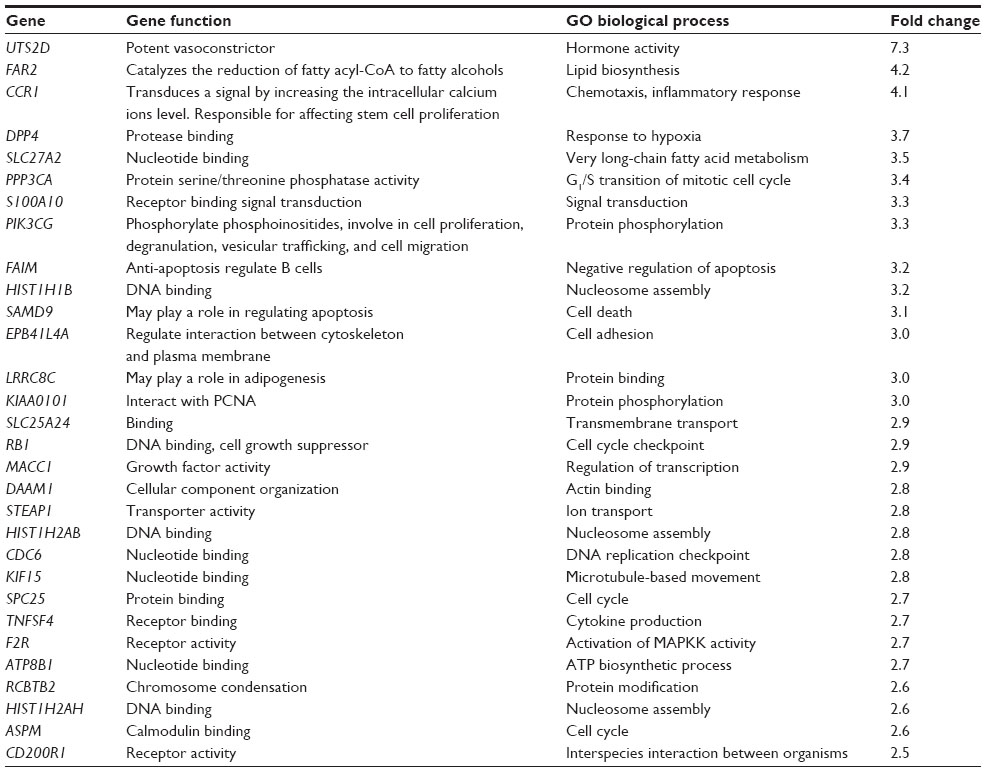 | Table 2 Top 30 upregulated genes in lymphoblasts from Alström syndrome males compared with nonobese (lean) males (FDR ≤0.2) |
There were 124 (FDR ≤0.2; fold ≤-1.5), 108 (FDR ≤0.15; fold ≤-1.5), and 16 (FDR ≤0.10; fold ≤-1.5) downregulated genes identified in the ALMS males compared with nonobese males. Figure 3 shows the top ten downregulated genes found in ALMS and their relationship to gene expression disturbances observed in PWS and obese males but with no disturbed genes found in common among the three subject groups. When comparing the nonsyndromic obese males with nonobese (lean) males, two genes (MT1G and MT1X) were found to be downregulated in the obese males, while only one complex gene locus (ie, SNRPN) was downregulated in PWS compared to nonobese males. Figure 4 shows the top ten downregulated genes in ALMS grouped by GO biological processes. Ten disturbed upregulated genes found in ALMS represented 63% of the genes (10 of 16) in the DNA replication cascade according to the KEGG database (eg, http:www.genomic.jp/kegg-bin/show_pathway?map). Sixteen of 31 (52%) upregulated genes found in ALMS were also represented in the cell-cycle cascade available at the KEGG database (http://www.wikipathways.org/index.php/Pathway:WP179), implying the importance of disturbed gene proteins in ALMS directly impacting DNA replication, transcription, cell cycle, and cell division.
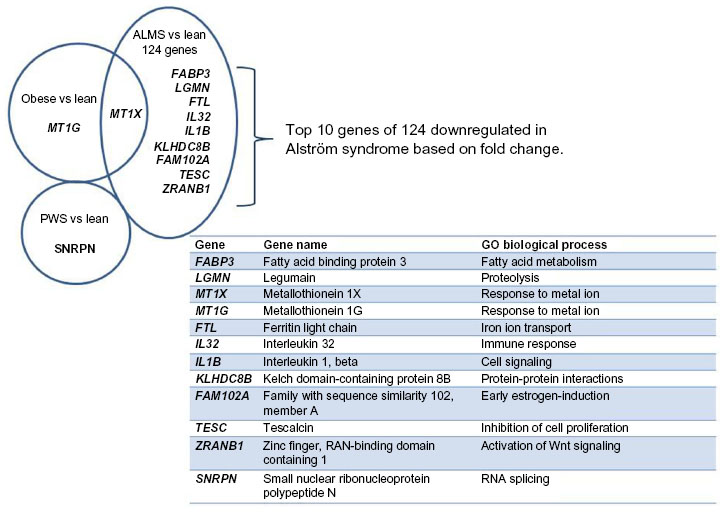 | Figure 3 Downregulated genes by subject group using lymphoblasts from nonobese (lean) males as controls (FDR ≤0.2; fold ≤−1.5). |
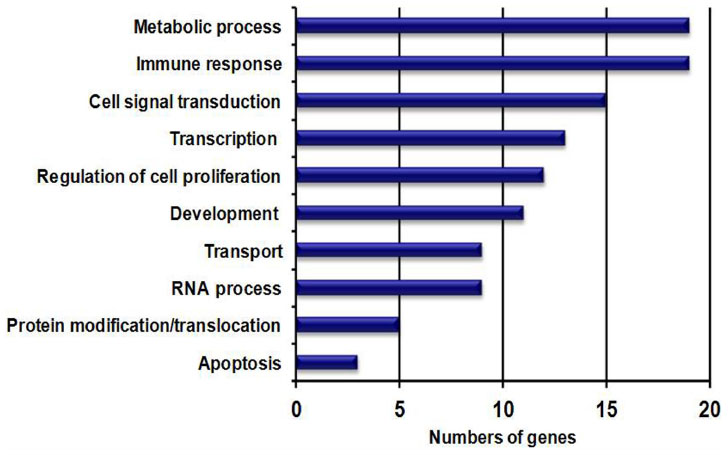 | Figure 4 Downregulated genes in ALMS grouped by biological process; genes are grouped by GO biological process. |
The Affymetrix Human Exon 1.0 ST Array possesses a high level of resolution and internal validity, with about 40 probes per gene and an average intensity signal calculated across multiple exons to generate gene-level expression values. However, the probe number varies widely by the gene. For example, the expression level analysis of the RB1 gene is based upon the average intensity reading of 336 separate probes of the RB1 exons, while the expression level analysis of the MT1X gene was based upon 41 separate probes. The use of high-resolution microarrays are much more robust than earlier arrays with only one probe per gene available, requiring external validation methods (eg, qRT-PCR), and, thus, decreases the need for an alternative method for validation. Nonetheless, three genes (FABP3, MT1X, RB1) disturbed in the microarray exon expression studies were chosen representing both down and upregulated genes for qRT-PCR analysis. The GAPDH gene was used as a control along with expression from nonobese males. The qRT-PCR study was in agreement with the fold change findings identified in the microarray analysis (ie, FABP3, −4.2[Alström microarray], −4.3 [Alström qRT-PCR]; MT1X, −3.5 [obese microarray], −5.0 [obese qRT-PCR]; and RB1, 6.2 [Alström microarray], 2.9 [Alström qRT-PCR]).
MiRNA and snoRNA expression
Misregulated miRNAs from isolated lymphoblasts in ALMS males versus lean control males shown in Table 3 have multiple gene targets that were also disturbed with possible influence over gene expression. The corresponding target genes with increased or decreased expression, their chromosome location, and the expression (fold change) for their respective class of miRNAs are shown in Tables S1–S4. Venn diagrams representing expression patterns of target genes with decreased expression correlating with disturbed complementary mature miRNAs, but of the minor passenger strand type (ie, star, 5p) from ALMS males are shown in Figure 5A and B. No disturbances in immature (hsa-mir) miRNAs were observed in our rare disease microarray expression study. Yet, disturbed miRNAs of the minor passenger strand type were found in ALMS in relationship to lean control males, implying disturbances in miRNA biogenesis or processing. This pattern was not found in PWS or nonsyndromic obese males.
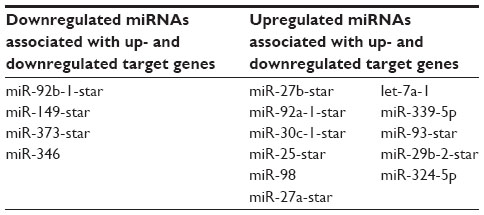 | Table 3 List of disturbed miRNAs in Alström syndrome males versus lean males targeting 124 downregulated and 231 upregulated genes |
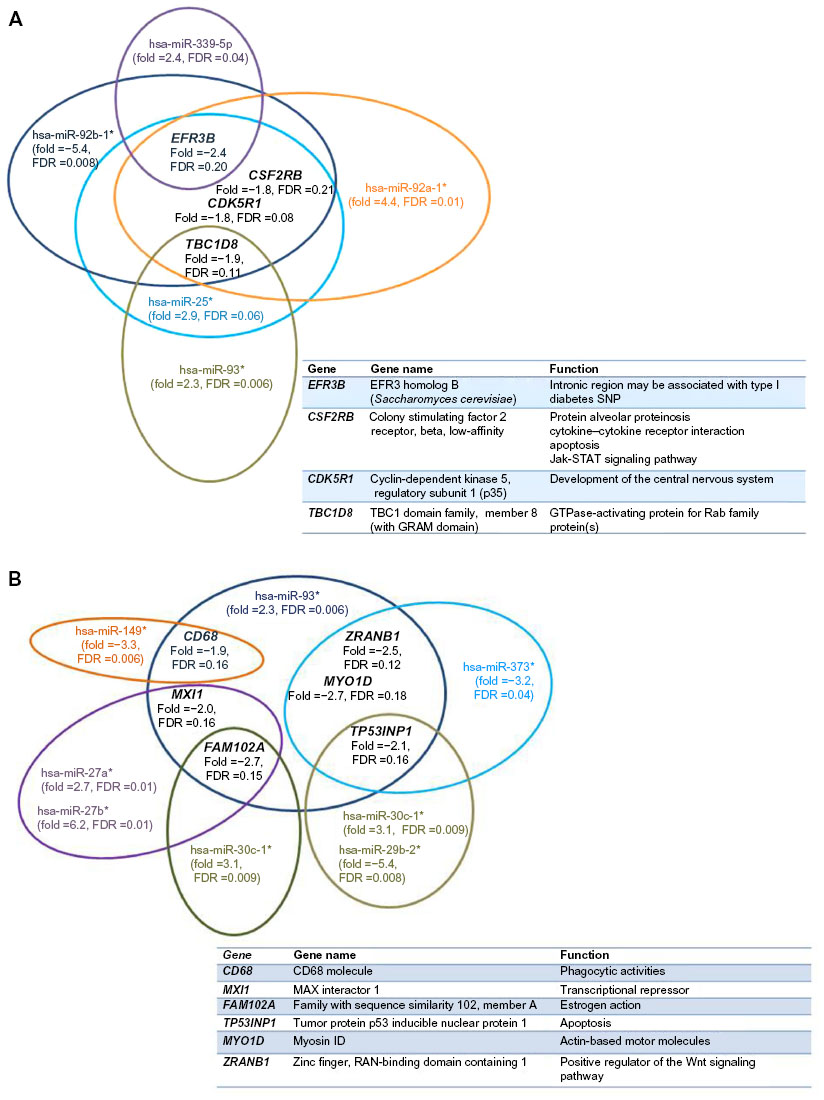 | Figure 5 (A and B) Illustration of two separate collections of representative examples of downregulated target genes and their associated disturbed mature miRNAs (passenger strand [star or 5p] type) in lymphoblasts from ALMS males (N=6) versus lean males (N=7), with gene name and function listed. *Indicate low frequency strand miRNA type. |
The miRNA expression patterns in PWS, lean, and nonsyndromic obese males were also analyzed, but few disturbances were found in contrast to ALMS. However, the immature hsa-mir 34a miRNA was upregulated when comparing PWS with lean males, and the mature major guide strand hsa-miR-885-3p was downregulated when comparing PWS males with obese males. The hsa-miR-541-star minor passenger strand was also upregulated, but no downregulated miRNAs were found when comparing PWS with obese males (Table 4). When comparing miRNA expression patterns in nonsyndromic obese males versus nonobese (lean) males, eight upregulated miRNAs were found with five classified as the immature type. Twelve miRNAs were downregulated in the obese males and seven classified as the immature type (Table 5).
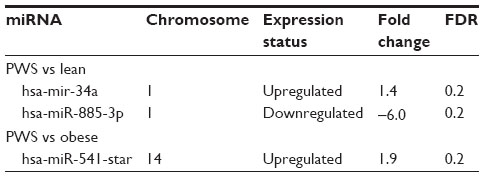 | Table 4 miRNA expression patterns in lymphoblasts from PWS, nonobese (lean), and nonsyndromic obese males |
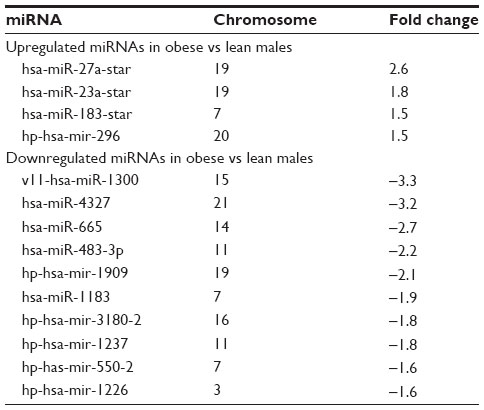 | Table 5 miRNA expression patterns in lymphoblasts from nonsyndromic obese males in comparison with nonobese (lean) males |
There were 15 disturbed miRNAs (11 upregulated and 4 downregulated) showing significant expression (P≤0.05; absolute fold change ≥2.0) between ALMS and nonobese control males. The Unweighted Average Distance (UPGMA) algorithm was used to hierarchically cluster significantly disturbed miRNAs for visualization using the Euclidean distance matrix of pairwise distances between miRNAs computed from the standardized log expression values of individual subjects. The genes were grouped by different FDR and fold change levels. All computations were performed using MATLAB (R2009b, The MathWorks Inc., Natick, MA, USA) and the Partek Genomic suite (v 6.5, Partek Inc., St Louis, MO, USA).
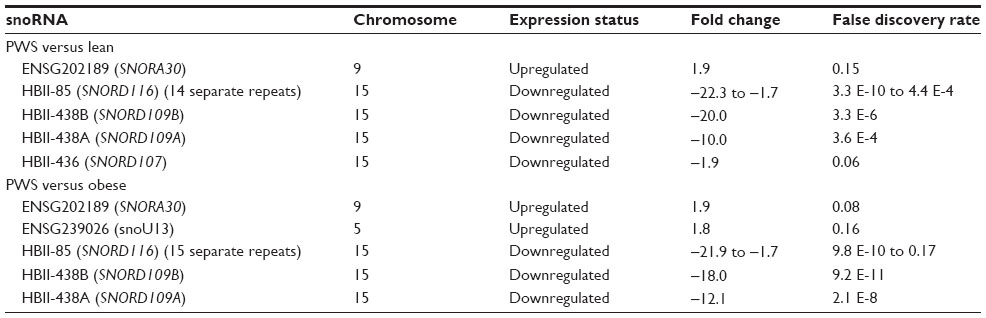
When analyzing snoRNAs, ENSG202189 (SNORA30) and ENSG238400/ENSG239026 (snoU13 family) were upregulated at the FDR ≤0.20 level in PWS compared with obese and nonobese males along with downregulation of multiple repeats of the imprinted, paternally expressed snoRNAs HBII-85 (SNORD116), along with HBII-438B (SNORD109B), HBII-438A (SNORD109A), and HBII-436 (SNORD107) localized to 15q11-q13 region (Table 6). No up- or downregulated snoRNAs were found when comparing the obese males with lean males, but numerous snoRNA disturbances were noted in ALMS compared with lean males (Table 7). Up- and downregulated snoRNA in ALMS were co-localized in the same chromosome region with several ribonuclear proteins involved with rRNA processing including RPS8, NOP5/NOP58, METTL12, SNHG9, RPL7A, EIF4A2, GAS5, and NCL.72 Upregulated snoRNAs ENSG00000238947 (U13) and ENSG00000252349 (SNORA31) were also co-localized with genes involved with fatty-acid processing (CCDC57, ALDH3A2). Downregulated snoRNAs were co-localized with genes coding for molecular scaffolding proteins (MYLK, DEDD) and proteins involved with hormone secretion (RAPGEF4), development (CFDP1), or previously implicated in disease processes impacting multiple organ systems (MYLK, RAPGEF4, CFDP1, ACAA2, MYO5B). The downregulated scaRNA17 was also co-localized with ACAA2 involved with mitochondrial beta-oxidation and MYO5B implicated in microvillus inclusion disease affecting recycling of transferrin.73,74
 | Table 6 snoRNA expression patterns in lymphoblasts from Prader–Willi Syndrome (PWS), nonobese (lean), and obese males |
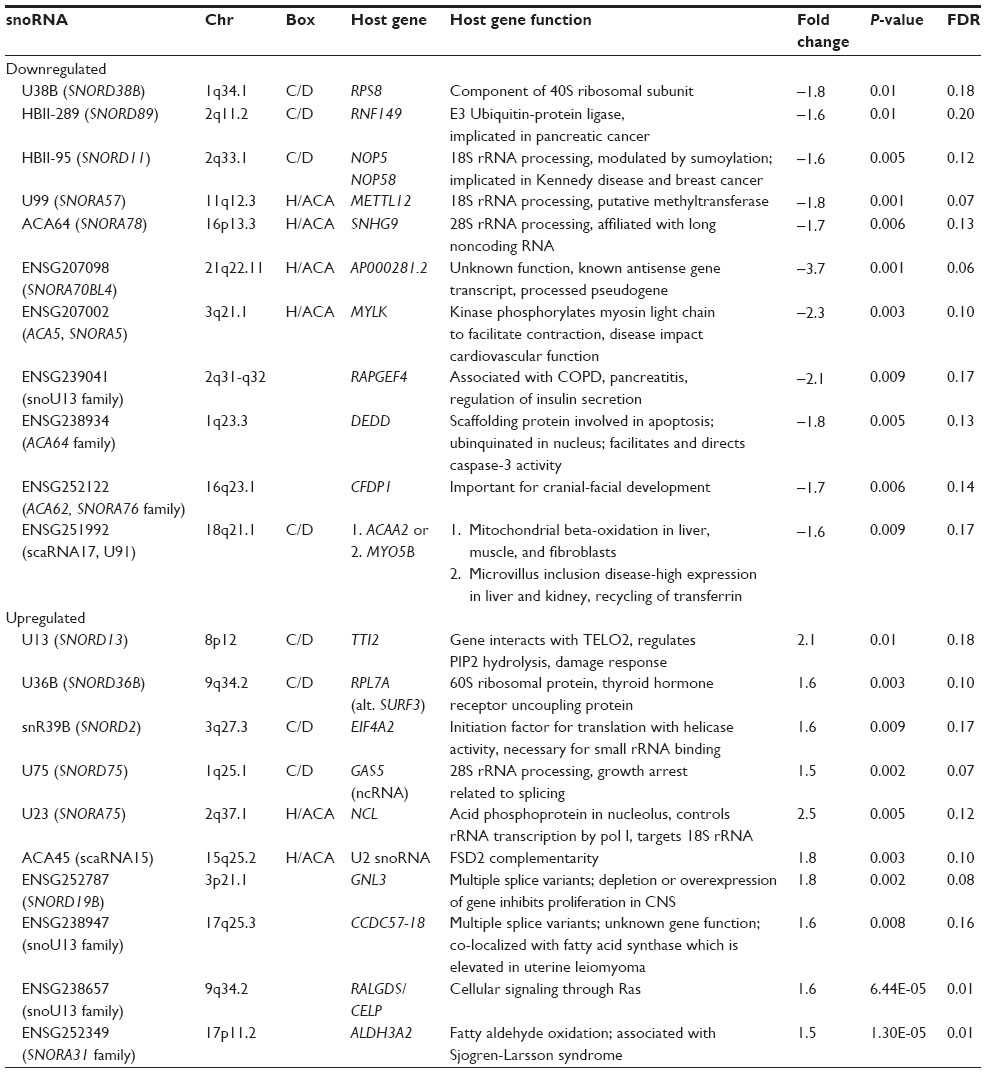 | Table 7 snoRNA disturbances for Alström versus lean males |
Discussion
We analyzed lymphoblastoid cell lines established from seven genetically confirmed adult males with PWS, seven adult males with nonsyndromic obesity, seven nonobese (lean) adult males with normal BMI, and six genetically confirmed adult males with ALMS, and then characterized their coding and noncoding RNA expression patterns. As predicted, lower expression of snoRNAs in the imprinted 15q11-q13 region (eg, SNORD116) distinguished PWS from lean and obese males, but no snoRNA disturbances were seen when comparing obese and lean males. For miRNA analysis in PWS versus lean males, we found overexpression of the immature mir-34a miRNA and downregulation of the mature miR-885-3p miRNA in PWS. For PWS versus obese, we found overexpression of miR-541-star in PWS. In examination of obese versus lean males, we found upregulation of 8 miRNAs in obese males with the highest expression for the minor miR-27a-star and downregulation in 12 miRNAs.
Exon array analysis found only downregulation of the SNRPN gene in PWS compared to obese and lean males, while obese and lean males were distinguished by downregulation of the metallothionein 1G (MT1G) and metallothionein 1X (MT1X) genes in obese males. The metallothionein genes code for a family of proteins that are believed to provide protection against metal toxicity and oxidative stress and may indicate an increase in vulnerability to exposure, toxicity, or excessive heavy-metal levels in individuals with obesity (Online Mendelian Inheritance in Man [http://www.omim.org]). This finding is unexpected in obesity, because metallothionein proteins are upregulated by inflammatory processes, cytokine/chemokine involvement, and in response to environmental stress, which may play a role in obesity. The metallothionein gene was a target for both major guide and minor passenger strand miRNAs including miR-27a-star, miR-23a-star, mir-296, and miR-513a-3p, which were upregulated in our obese males compared with lean males and may reflect disturbances in miRNA function. MiRNA expression in PWS males did not appear to broadly influence the exon expression analyzed at the gene level in lymphoblasts. Upregulation of the immature mir-34a miRNA observed in our study could impact the GABA-A receptor gene family known to be disturbed in PWS with three GABA-A receptor genes (ie, GABRA5, GABRB3, GABRG3) found in the 15q11-q13 region.63 Further investigations would warrant expression analysis at the level of individual exons.
Few gene expression disturbances were seen using lymphoblastoid cells with respect to nonsyndromic obesity, which may be related to the statistical approach in analyzing data from high-resolution expression microarrays that involve multiple tests, with corrections further complicated by small subject numbers possibly reducing the sensitivity for identification of clinically relevant genetic outcomes and gene disturbances. In addition, other tissues including adipose may be a better source for identifying gene expression disturbances in nonsyndromic obesity. More gene disturbances were seen in ALMS males in our study particularly, with increased expression compared with obese or PWS males in relationship to lean males using lymphoblastoid cells, but may still contribute to the understanding of obesity. For 231 upregulated genes in ALMS, the top three biological categories (development, cell cycle, and regulation of transcription) accounted for 40% of the disturbed genes. For 124 downregulated genes representing the top three biological categories (metabolic function, immune response, and cell signal transduction) accounted for 43% of the disturbed genes. Ten (63%) of the 16 genes known to be involved in DNA replication were upregulated in ALMS males, while 16 (52%) of the 31 genes known to be involved in the cell cycle cascade were upregulated. Ten of the downregulated genes targeted by miRNAs in ALMS males compared with lean males (ie, EFR3B, CSF2RB, CDK5R1, TBC1D8, MXI1, CD68, ZRANB1, MYO1D, TP53NP1, and FAM102A) were found to be involved in several disease states (eg, diabetes, alveolar proteinosis) and in central nervous system development, signaling pathways, apoptosis, cytokine function, phagocytic activities, and in transcriptional repression. These findings support a global perturbation and gross upregulation of biosynthetic and replication pathways in ALMS, possibly as compensation for diminished metabolic, immunologic, and signaling capacity and increased cell death.
Fibrotic changes reported in multiple organs in ALMS occur when inappropriate tissue remodeling is present with excess matrix production and increased survival of myofibroblasts or lack of extracellular matrix degradation.75 Inflammation also occurs with enhanced cell signaling76–78 impacting gene expression (primary or secondary), and altered cytokine production during the fibrotic process.76 Eighty-four known miRNAs (all mature miRNA guide strand with no passenger star strands) are associated with fibrosis (pro-fibrosis, anti-fibrosis) impacting on extracellular matrix formation and remodeling, cell adhesion,26,76,79,80 inflammation,26,38,81,82 angiogenesis,26,82 signal transduction and transcriptional regulation,76,81 and epithelial to mesenchymal transition.80,83–86 We found predominantly miRNA passenger strand disturbances with only one mature miRNA (ie, miR-324-5p) involved (upregulated by 2.1-fold) in ALMS males. However, passenger strand members of the same mature miRNA category (miR-27a vs miR-27a star) previously reported as fibrotic-related miRNAs (miR-27a, miR-27b, miR-29b, and miR-25) were disturbed in our ALMS males. Increased disturbances in the miRNA passenger (star) strand type indicate derangement or errors in miRNA transportation, biogenesis, and/or processing, possibly impacting gene regulation by interference with the major guide strand miRNA.
Many genes are involved in fibrosis including extracellular matrix components and cell adhesion (eg, the collagen genes COL1A1, COL1A2, etc), remodeling enzymes (eg, CTSG, CTSK, MMP1, SERPINE1, TIMP1), cellular adhesion (eg, CDH1, ITGA1, ITGA2, ITGA3, etc), cytoskeleton (eg, ACTA2, ACTC1, RAC1, etc), inflammatory cytokines and chemokines (eg, CCL2, CCL7, CXCL1, CXCL11, IFNG, IL10, IL4, etc), growth factors (eg, ANGPT1, CSF2, EGF, FGF2, FGF10, IGF1, TGFB1, etc), and signal transduction for TGF (eg, STAT3, TGFB1), WNT (eg, CTNNB1, WNT5A), phosphorylation (eg, MAPK1, PTEN), and receptors (eg, EGFR) (http://www.omim.org; http://www.genetests.org). However, these genes did not appear to be disturbed in the ALMS males in our expression study when comparing the complete microarray expression dataset among the subject groups and correcting for multiple testing. These results suggest that the fibrotic process in ALMS is not detectable using our tissue source and methodology or by employing more stringent RMA modeling to normalize baseline intensities without selecting a subset of genes (or gene family, eg, collagen) in small group analysis.
Hypoxic stress can cause phosphorylation of Argonaute proteins (ie, AG02) required for miRNA processing by interacting with the epidermal growth factor receptor and reducing the binding to Dicer in the cytoplasm and further inhibiting miRNA processing to the mature form.29,31,32 Stress secondary to the ongoing multiorgan fibrotic changes in the lungs and cardiovascular system could partially account for the abundance of disturbances in miRNAs produced in ALMS males compared with obese, PWS, or nonobese males. Furthermore, the alternate ac-pre-miRNA biogenesis pathway may be overutilized in ALMS secondary to an abnormal function of the ALMS1 gene involved with ciliary activity, thereby controlling cellular movement and transport. The transport defect may interfere with the export of the pre-miRNA precursor from the nucleus or with normal degradation of the lesser passenger strand. The disturbances may also reflect the ongoing multiorgan involvement known to be present in ALMS with abnormal pathophysiology in relationship to nonsyndromic obesity and PWS males.
Examination of snoRNA expression in ALMS showed up- and downregulation of specific snoRNAs co-localized with genes for ribonuclear proteins (RPS8, RNF149, NOP58, METTL12, SNHG9, RPL7A, EIF4A2, GAS5, and NCL) involved with rRNA processing (sumoylation, and ubiquitination), which have the potential to influence protein synthesis.87,88 Other disturbed snoRNAs in ALMS were co-localized with genes functioning in cell signaling, growth, and development as well as fatty acid processing. Downregulated snoRNAs co-localized with genes coding for nonribosomal proteins may participate in RNA editing of these genes. It is unclear how or whether variations in snoRNA level would impact RNA editing functions; however, disturbed snoRNAs were associated with genes previously implicated in disease processes impacting multiple organ systems (MYLK, RAPGEF4, CFDP1, ACAA2, and MYO5B).73,89–93 Further, co-localization of scaRNA17 with genes involved with mitochondrial beta-oxidation (ACAA2)73 and implicated in microvillus inclusion disease with effects on recycling of transferrin (MYO5B)92 are consistent with an obesogenic phenotype and the observed disruption in metal ion transporter levels (MT1G, MT1X). However, the impact of specific snoRNA expression disturbances on rRNA activity in general or RNA splicing/editing functions is not presently known and requires further study. Disturbances in rRNA-related proteins and intermediates in our study raise questions about the functionality of sumoylation processes, rRNA assembly, and the integrity of ribosomal subunits. For example, a 2.3-fold increase was observed in SP100 gene expression encoding a ribonuclear protein associated with the SUMO E3 ligase RanBP2(Nup358) complex with functional impact on nucleoplasmic transport, microtubule binding and organization, as well as spindle assembly and disassembly, which are functions highly similar to those proposed for the ALMS1 gene. Future research should explore a possible relationship between ALMS1 and SUMO E3 ligase RanBP2 (Nup358) complex or other E3 SUMO ligase complexes.
A paucity of gene expression data exists in PWS and ALMS, and consistency with tissues studied as sources for collection of biopsy or autopsy specimens are scarce for rare genetic diseases, thereby limiting access to viable cells for coding and noncoding RNA expression analysis. Different sources (eg, fibroblasts in PWS94 or ALMS95) have been used as well as different syndromic genetic disturbances and sexes (eg, single PWS female with mosaicism94) applying early, lower-resolution microarray technology with fewer probes and lack of internal validation (eg, one probe per gene in PWS63). Multiple probes per gene at the exon level per assay are now accessible, as evidenced in our study (eg, 249 probes for the FAR2 gene). Our investigation extends and expands upon the earlier limited research with simultaneous high-resolution coding and noncoding expression arrays and advanced bioinformatic approaches in readily available tissue lymphoblastoid cells grown in suspension and transformed from B lymphocytes following primary infection with Epstein–Barr virus establishing immortalized cell lines. Total RNA isolated from actively growing cell cultures was treated similarly among all subjects studied. Lymphoblastoid cell lines have commonly been used in a number of population-based genetic studies of gene expression94 in which the virus genome is transcriptionally silent.95
Previous genome-wide expression studies using early microarray technology examined lymphoblasts from seven males with PWS and three obese males63 and fibroblast cells from a single PWS female mosaic for a normal cell line and a cell line with maternal disomy 15.96 Bittel et al63 reported no expression of the paternally expressed genes from the 15q11-q13 region (eg, SNRPN) in lymphoblasts from PWS males. A secondary small group analysis of gene clusters by structural/functional category (neurodevelopmental, lipid/metabolism, GABA receptors, serotonin receptors, select candidate genes) was carried out by comparing mean intensity signal values in the lymphoblasts from PWS males normalized to the median signal value of obese males then divided by the 50th centile of all measurements in that sample. Expression disturbances (fold change ≥±1.5 of FDR ≤0.2) were found for 14 neurodevelopment genes (eg, SAG, NOTCH1, TH, GRIN2B, NTSR1, PAX2, UBE3A), three lipid metabolism/obesity genes (eg, INMT, SNRPN, STAR), nine GABA or serotonin receptor genes, and other candidate genes (eg, HCRT, MCR2, ADIPOR2, OXTR). Of these genes, the complex SNRPN gene locus including multiple transcripts (eg, PAR1, IPW, and HBII-85 [SNORD116]) was most disturbed based upon fold change and FDR as observed in our investigation. Furthermore, Horsthemke et al96 reported that SNURF-SNRPN-IPW and NDN genes had the highest fold change differences (decreased in PWS) and did not detect any other 15q gene disturbance similar to our study. Expression of DUSP4A, RNF29, HOXB6, ARL5, CD36, and SCG2 genes were greatly reduced or absent in the mosaic PWS cell line. None of these genes was found to be dysregulated in our high-resolution microarray and analysis.
Zulato et al97 reported on four adult patients with ALMS and three control subjects with normal weight by obtaining dermal fibroblasts and whole genome expression analysis of 21,500 genes and found 560 to be differentially expressed with 188 upregulated and 372 downregulated genes in ALMS. The disturbed genes were classified into four groups represented by cell cycle, extracellular matrix or fibrosis regulation, cell adhesion, or motility and apoptosis. They reported that downregulated genes involved in cell cycle progression and DNA replication including mini-chromosome maintenance complex (MCM) genes and assembly of the replication complex (RFC3-5). We also found MCM gene family expression disturbances as well as upregulated genes impacting most often on development and the cell cycle cascade followed by transcription regulation and protein modification, DNA replication and repair, and RNA processing. Zulato et al97 reported upregulated genes for components of extracellular matrix and collagen types (eg, COL1A1), proteins and chain assembly including P4HA1, LEPRE1, and SERPINH1 and, in addition, upregulation of genes involved in focal adhesion structures such as TNS1, LIMS2, and SGCD. They also found upregulated gene expression involved with fibrosis such as POSTN, IGFBP3, IGFBP5, CTGF, WISP1, CYR61, NOV, and ACTA2 as well as apoptotic-related genes (IL24, GULP1, NALP1, MAF). Genes most commonly downregulated in ALMS in our study included metabolic processing and immune response followed by cell signal transduction and transcription, regulation of cell proliferation and development, transport, RNA process, protein modifications, and apoptosis. Hence, our gene expression studies in lymphoblasts in ALMS did show overlap with Zulato et al97 in certain functions, particularly in cell cycle/proliferation, DNA replication, transcription, and RNA/protein processing.
Conclusion
In summary, hundreds of coding and noncoding RNA expression disturbances were seen in readily available lymphoblastoid cell lines, which have been used in previous reports as feasible resources for coding and noncoding RNA expression studies in neurodevelopmental disorders (eg, autism) and exogenous or syndromic obesity. Lymphoblastoid cell lines established from ALMS males compared with nonobese males showed multiple gene expression differences (both up- and downregulated), while lymphoblastoid cell lines from nonsyndromic obese males and PWS males showed few differences. Members of the metallothionein gene family showed decreased expression in both obese and ALMS males, while the imprinted complex SNRPN locus disturbed in PWS showed decreased expression in the PWS males only. For ALMS, pervasive disturbances were observed in gene expression for about 350 genes. There was involvement of multiple snoRNAs and miRNAs (both immature and mature) impacting the cell cycle cascade, DNA replication, and repair, possibly leading to, or resulting from, the complex progression of multiorgan pathophysiology seen in ALMS. Overabundance of minor miRNA passenger strands in ALMS, indicating an RNA processing defect, and when not degraded, could compete with the function of the major mature guide strand, thus interfering with the latter’s role and interaction in gene activity. RNA sequencing as a more novel approach is currently under way in rare genetic syndromes with obesity including PWS, ALMS, and nonsyndromic obesity, but is not a focus of this microarray expression study. The discovery of disturbed molecular pathways or mechanisms should stimulate new directions for research and intervention and the use of multiple tissue sources for confirmation. Ideally, fresh brain or adipose tissue when available will lend new and additional information on pathophysiological disturbances leading to pharmaceutical approaches in the study of obesity and rare genetic obesity-related disorders. The rarity of the syndromes involved in these studies with limited access to large numbers of subjects, viable tissue sources (brain, adipose), and types with sufficient quality and quantity, along with expense (time, resources and allotment, available expertise) associated with advanced genetic/genomic technology, adds to the challenge answering complex questions regarding the genetics of obesity.
Acknowledgments
We thank the families and study participants for allowing us to collect blood specimens for investigations. We also thank Carla Meister and Devin Cox for the preparation of the manuscript. This research was partially supported by a grant from the Prader-Willi Syndrome Association (USA) (Big Idea Grant –BIG) and by the NIH Fogarty International Research (HD060500), NICHD HD02528, and the Angelman, Rett, and Prader–Willi Syndrome Consortium (U54 HD06122), which is part of the National Institutes of Health (NIH) Rare Disease Clinical Research Network (RDCRN), supported through collaboration between the NIH Office of Rare Diseases Research (ORDR) at the National Center of Advancing Translational Science (NCATS), and the National Institute of Child Health and Human Development (NICHD). JKN and JDM were supported by an NIH HD036878 grant. The content is solely the responsibility of the authors and does not necessarily represent the official views of the National Institutes of Health.
Disclosure
The authors report no conflicts of interest in this work.
References
Marshall JD, Maffei P, Beck S, Barrett TG, Paisey R, Naggert JK. Clinical utility gene card for: Alstrom syndrome – update 2013. Eur J Hum Genet. 2013;21(11). Epub April 24, 2013. | |
Marshall JD, Maffei P, Collin GB, Naggert JK. Alstrom syndrome: genetics and clinical overview. Curr Genomics. 2011;12(3):225–235. | |
Marshall JD, Beck S, Maffei P, Naggert JK. Alstrom syndrome. Eur J Hum Genet. 2007;15(12):1193–1202. | |
Collin GB, Marshall JD, Ikeda A, et al. Mutations in ALMS1 cause obesity, type 2 diabetes and neurosensory degeneration in Alstrom syndrome. Nat Genet. 2002;31(1):74–78. | |
Joy T, Cao H, Black G, et al. Alstrom syndrome (OMIM 203800):a case report and literature review. Orphanet J Rare Dis. 2007;2:49. | |
Marshall JD, Hinman EG, Collin GB, et al. Spectrum of ALMS1 variants and evaluation of genotype-phenotype correlations in Alstrom syndrome. Hum Mutat. 2007;28(11):1114–1123. | |
Redin C, Le Gras S, Mhamdi O, et al. Targeted high-throughput sequencing for diagnosis of genetically heterogeneous diseases: efficient mutation detection in Bardet-Biedl and Alstrom syndromes. J Med Genet. 2012;49(8):502–512. | |
Butler MG. Prader-Willi syndrome: current understanding of cause and diagnosis. Am J Med Genet. 1990;35(3):319–332. | |
Butler MG. Prader-Willi syndrome: obesity due to genomic imprinting. Curr Genomics. 2011;12(3):204–215. | |
Cassidy SB, Driscoll DJ. Prader-Willi syndrome. Eur J Hum Genet. 2009;17(1):3–13. | |
Cassidy SB, Schwartz S, Miller JL, Driscoll DJ. Prader-Willi syndrome. Genet Med. 2012;14(1):10–26. | |
Bittel DC, Butler MG. Prader-Willi syndrome: clinical genetics, cytogenetics and molecular biology. Expert Rev Mol Med. 2005;7(14):1–20. | |
Butler MG, Lee PDK, Whitman BY. Management of Prader-Willi Syndrome. 3rd ed. New York: Springer-Verlag Publishers; 2006. | |
Nicholls RD, Knoll JH, Butler MG, Karam S, Lalande M. Genetic imprinting suggested by maternal heterodisomy in nondeletion Prader-Willi syndrome. Nature. 1989;342(6247):281–285. | |
Butler MG. Genomic imprinting disorders in humans: a mini-review. J Assist Reprod Genet. 2009;26(9–10):477–486. | |
Butler MG. Hypopigmentation: a common feature of Prader-Labhart-Willi syndrome. Am J Hum Genet. 1989;45(1):140–146. | |
Butler MG, Meaney FJ, Palmer CG. Clinical and cytogenetic survey of 39 individuals with Prader-Labhart-Willi syndrome. Am J Med Genet. 1986;23(3):793–809. | |
Christian SL, Robinson WP, Huang B, et al. Molecular characterization of two proximal deletion breakpoint regions in both Prader-Willi and Angelman syndrome patients. Am J Hum Genet. 1995;57(1):40–48. | |
Nicholls RD, Knepper JL. Genome organization, function, and imprinting in Prader-Willi and Angelman syndromes. Annu Rev Genomics Hum Genet. 2001;2:153–175. | |
Chai JH, Locke DP, Greally JM, et al. Identification of four highly conserved genes between breakpoint hotspots BP1 and BP2 of the Prader-Willi/Angelman syndromes deletion region that have undergone evolutionary transposition mediated by flanking duplicons. Am J Hum Genet. 2003;73(4):898–925. | |
Butler MG, Fischer W, Kibiryeva N, Bittel DC. Array comparative genomic hybridization (aCGH) analysis in Prader-Willi syndrome. Am J Med Genet A. 2008;146(7):854–860. | |
Abreu AP, Dauber A, Macedo DB, et al. Central precocious puberty caused by mutations in the imprinted gene MKRN3. N Engl J Med. 2013;368(26):2467–2475. | |
Schaaf CP, Gonzalez-Garay ML, Xia F, et al. Truncating mutations of MAGEL2 cause Prader-Willi phenotypes and autism. Nat Genet. 2013;45(11):1405–1408. | |
Dinger ME, Mercer TR, Mattick JS. RNAs as extracellular signaling molecules. J Mol Endocrinol. 2008;40(4):151–159. | |
Cao X, Yeo G, Muotri AR, Kuwabara T, Gage FH. Noncoding RNAs in the mammalian central nervous system. Annu Rev Neurosci. 2006;29:77–103. | |
Ullah S, John P, Bhatti A. MicroRNAs with a role in gene regulation and in human diseases. Mol Biol Rep. 2014;41(1):225–232. | |
Lewis BP, Burge CB, Bartel DP. Conserved seed pairing, often flanked by adenosines, indicates that thousands of human genes are microRNA targets. Cell. 2005;120(1):15–20. | |
Leuschner PJ, Ameres SL, Kueng S, Martinez J. Cleavage of the siRNA passenger strand during RISC assembly in human cells. EMBO Rep. 2006;7(3):314–320. | |
Diederichs S, Haber DA. Dual role for argonautes in microRNA processing and posttranscriptional regulation of microRNA expression. Cell. 2007;131(6):1097–1108. | |
Winter J, Jung S, Keller S, Gregory RI, Diederichs S. Many roads to maturity: microRNA biogenesis pathways and their regulation. Nat Cell Biol. 2009;11(3):228–234. | |
Hauptmann J, Meister G. Argonaute regulation: two roads to the same destination. Dev Cell. 2013;25(6):553–554. | |
Shen J, Xia W, Khotskaya YB, et al. EGFR modulates microRNA maturation in response to hypoxia through phosphorylation of AGO2. Nature. 2013;497(7449):383–387. | |
Lund E, Guttinger S, Calado A, Dahlberg JE, Kutay U. Nuclear export of microRNA precursors. Science. 2004;303(5654):95–98. | |
Matranga C, Tomari Y, Shin C, Bartel DP, Zamore PD. Passenger-strand cleavage facilitates assembly of siRNA into Ago2-containing RNAi enzyme complexes. Cell. 2005;123(4):607–620. | |
Bratkovic T, Rogelj B. Biology and applications of small nucleolar RNAs. Cell Mol Life Sci. 2011;68(23):3843–3851. | |
Esteller M. Non-coding RNAs in human disease. Nat Rev Genet. 2011;12(12):861–874. | |
Heneghan HM, Miller N, Kerin MJ. Role of microRNAs in obesity and the metabolic syndrome. Obes Rev. 2010;11(5):354–361. | |
Mendell JT, Olson EN. MicroRNAs in stress signaling and human disease. Cell. 2012;148(6):1172–1187. | |
Rederstorff M, Huttenhofer A. Small non-coding RNAs in disease development and host-pathogen interactions. Curr Opin Mol Ther. 2010;12(6):684–694. | |
Tal TL, Tanguay RL. Non-coding RNAs – novel targets in neurotoxicity. Neurotoxicology. 2012;33(3):530–544. | |
Rogelj B, Giese KP. Expression and function of brain specific small RNAs. Rev Neurosci. 2004;15(3):185–198. | |
Abelson JF, Kwan KY, O’Roak BJ, et al. Sequence variants in SLITRK1 are associated with Tourette’s syndrome. Science. 2005;310(5746):317–320. | |
Krichevsky AM, King KS, Donahue CP, Khrapko K, Kosik KS. A microRNA array reveals extensive regulation of microRNAs during brain development. RNA. 2003;9(10):1274–1281. | |
Mehler MF, Mattick JS. Non-coding RNAs in the nervous system. J Physiol. 2006;575(pt 2):333–341. | |
Bachellerie JP, Cavaillé J. Guiding ribose methylation of rRNA. Trends Biochem Sci. 1997;22(7):257–261. | |
Kiss-László Z, Henry Y, Bachellerie JP, Caizergues-Ferrer M, Kiss T. Site-specific ribose methylation of preribosomal RNA: a novel function for small nucleolar RNAs. Cell. 1996;85(7):1077–1088. | |
Lui L, Lowe T. Small nucleolar RNAs and RNA-guided post-transcriptional modification. Essays Biochem. 2013;54:53–77. | |
Maden BE, Hughes JM. Eukaryotic ribosomal RNA: the recent excitement in the nucleotide modification problem. Chromosoma. 1997;105(7–8):391–400. | |
Nicoloso M, Qu L-H, Michot B, Bachellerie J-P. Intron-encoded, antisense small nucleolar RNAs: the characterization of nine novel species points to their direct role as guides for the 2′-O-ribose methylation of rRNAs. J Mol Biol. 1996;260:178–195. | |
Finkbeiner E, Haindl M, Raman N, Muller S. SUMO routes ribosome maturation. Nucleus. 2011;2(6):527–532. | |
Westman BJ, Lamond AI. A role for SUMOylation in snoRNP biogenesis revealed by quantitative proteomics. Nucleus. 2011;2(1):30–37. | |
Mascle XH, Lussier-Price M, Cappadocia L, et al. Identification of a non-covalent ternary complex formed by PIAS1, SUMO1, and UBC9 proteins involved in transcriptional regulation. J Biol Chem. 2013;288(51):36312–36327. | |
Yang XJ, Chiang CM. Sumoylation in gene regulation, human disease, and therapeutic action. F1000Prime Rep. 2013;5:45. | |
Flotho A, Werner A. The RanBP2/RanGAP1*SUMO1/Ubc9 complex: a multisubunit E3 ligase at the intersection of sumoylation and the RanGTPase cycle. Nucleus. 2012;3(5):429–432. | |
Werner A, Flotho A, Melchior F. The RanBP2/RanGAP1*SUMO1/Ubc9 complex is a multisubunit SUMO E3 ligase. Mol Cell. 2012;46(3):287–298. | |
Hamada M, Haeger A, Jeganathan KB, et al. Ran-dependent docking of importin-beta to RanBP2/Nup358 filaments is essential for protein import and cell viability. J Cell Biol. 2011;194(4):597–612. | |
Hutten S, Flotho A, Melchior F, Kehlenbach RH. The Nup358-RanGAP complex is required for efficient importin alpha/beta-dependent nuclear import. Mol Biol Cell. 2008;19(5):2300–2310. | |
Talebizadeh Z, Butler MG, Theodoro MF. Feasibility and relevance of examining lymphoblastoid cell lines to study role of microRNAs in autism. Autism Res. 2008;1(4):240–250. | |
Bittel DC, Kibiryeva N, Butler MG. Whole genome microarray analysis of gene expression in subjects with fragile X syndrome. Genet Med. 2007;9(7):464–472. | |
Bittel DC, Kibiryeva N, Talebizadeh Z, Butler MG. Microarray analysis of gene/transcript expression in Prader-Willi syndrome: deletion versus UPD. J Med Genet. 2003;40(8):568–574. | |
Bittel DC, Kibiryeva N, Butler MG. Expression of 4 genes between chromosome 15 breakpoints 1 and 2 and behavioral outcomes in Prader-Willi syndrome. Pediatrics. 2006;118(4):e1276–e1283. | |
Bittel DC, Kibiryeva N, Dasouki M, Knoll JH, Butler MG. A 9-year-old male with a duplication of chromosome 3p25.3p26.2: clinical report and gene expression analysis. Am J Med Genet A. 2006;140(6):573–579. | |
Bittel DC, Kibiryeva N, Sell SM, Strong TV, Butler MG. Whole genome microarray analysis of gene expression in Prader-Willi syndrome. | |
Henkhaus RS, Bittel DC, Butler MG. TPH2 polymorphisms and expression in Prader-Willi syndrome subjects with differing genetic subtypes. J Neurodev Disord. 2010;2(3):144–148. | |
Talebizadeh Z, Lam DY, Theodoro MF, Bittel DC, Lushington GH, Butler MG. Novel splice isoforms for NLGN3 and NLGN4 with possible implications in autism. J Med Genet. 2006;43(5):e21. | |
Manzardo AM, Gunewardena S, Butler MG. Over-expression of the miRNA cluster at chromosome 14q32 in the alcoholic brain correlates with suppression of predicted target mRNA required for oligodendrocyte proliferation. Gene. 2013;526(2):356–363. | |
Bittel DC, Kibiryeva N, Talebizadeh Z, Driscoll DJ, Butler MG. Microarray analysis of gene/transcript expression in Angelman syndrome: deletion versus UPD. Genomics. 2005;85(1):85–91. | |
Vergoulis T, Vlachos IS, Alexiou P, et al. TarBase 6.0: capturing the exponential growth of miRNA targets with experimental support. Nucleic Acids Res. 2012;40(Database issue):D222–D229. | |
Vlachos IS, Kostoulas N, Vergoulis T, et al. DIANA miRPath v.2.0: investigating the combinatorial effect of microRNAs in pathways. Nucleic Acids Res. 2012;40(Web Server issue):W498–W504. | |
Irizarry RA, Hobbs B, Collin F, et al. Exploration, normalization, and summaries of high density oligonucleotide array probe level data. Biostatistics. 2003;4(2):249–264. | |
Betel D, Wilson M, Gabow A, Marks DS, Sander C. The microRNA.org resource: targets and expression. Nucleic Acids Res. 2008;36(Database issue):D149–D153. | |
Lyman SK, Gerace L, Baserga SJ. Human Nop5/Nop58 is a component common to the box C/D small nucleolar ribonucleoproteins. RNA. 1999;5(12):1597–1604. | |
Abe H, Ohtake A, Yamamoto S, et al. Cloning and sequence analysis of a full length cDNA encoding human mitochondrial 3-oxoacyl-CoA thiolase. Biochim Biophys Acta. 1993;1216:304–306. | |
Erickson RP, Larson-Thome K, Valenzuela RK, Whitaker SE, Shub MD. Navajo microvillous inclusion disease is due to a mutation in MYO5B. Am J Med Genet. 2008;146A:3117–3119. | |
Yang S, Cui H, Xie N, et al. miR-145 regulates myofibroblast differentiation and lung fibrosis. FASEB J. 2013;27(6):2382–2391. | |
Hartl M, Grunwald Kadow IC. New roles for “old” microRNAs in nervous system function and disease. Front Mol Neurosci. 2013;6:51. | |
Rao P, Benito E, Fischer A. MicroRNAs as biomarkers for CNS disease. Front Mol Neurosci. 2013;6:39. | |
Srivastava SP, Koya D, Kanasaki K. MicroRNAs in kidney fibrosis and diabetic nephropathy: roles on EMT and EndMT. Biomed Res Int. 2013;2013:125469. | |
Das S, Kumar M, Negi V, et al. MicroRNA-326 regulates pro-fibrotic functions of transforming growth factor-beta in pulmonary fibrosis. | |
Yamada M, Kubo H, Ota C, et al. The increase of microRNA-21 during lung fibrosis and its contribution to epithelial-mesenchymal transition in pulmonary epithelial cells. Respir Res. 2013;14:95. | |
Maciotta S, Meregalli M, Torrente Y. The involvement of microRNAs in neurodegenerative diseases. Front Cell Neurosci. 2013;7:265. | |
Chen CZ, Li L, Lodish HF, Bartel DP. MicroRNAs modulate hematopoietic lineage differentiation. Science. 2004;303(5654):83–86. | |
Bullock MD, Sayan AE, Packham GK, Mirnezami AH. MicroRNAs: critical regulators of epithelial to mesenchymal (EMT) and mesenchymal to epithelial transition (MET) in cancer progression. Biol Cell. 2012;104(1):3–12. | |
Naito Y, Sakamoto N, Oue N, et al. MicroRNA-143 regulates collagen type III expression in stromal fibroblasts of scirrhous type gastric cancer. Cancer Sci. 2014;105(2):228–235. | |
Pandit KV, Milosevic J, Kaminski N. MicroRNAs in idiopathic pulmonary fibrosis. Transl Res. 2011;157(4):191–199. | |
Zhao X, Lu Y, Nie Y, Fan D. MicroRNAs as critical regulators involved in regulating epithelial- mesenchymal transition. Curr Cancer Drug Targets. 2013;13(9):935–944. | |
Falaleeva M, Stamm S. Processing of snoRNAs as a new source of regulatory non-coding RNAs: snoRNA fragments form a new class of functional RNAs. Bioessays. 2013;35(1):46–54. | |
Nallar SC, Kalvakolanu DV. Regulation of snoRNAs in cancer: close encounters with interferon. J Interferon Cytokine Res. 2013;33(4):189–198. | |
Chen YF, Chiu HH, Wu CH, et al. Retinoblastoma protein (pRB) was significantly phosphorylated through a Ras-to-MAPK pathway in mutant K-ras stably transfected human adrenocortical cells. DNA Cell Biol. 2003;22(10):657–664. | |
Makeyev AV, Bayarsaihan D. Molecular basis of Williams-Beuren syndrome: TFII-I regulated targets involved in craniofacial development. Cleft Palate Craniofac J. 2011;48(1):109–116. | |
Makeyev AV, Bayarsaihan D. ChIP-Chip Identifies SEC23A, CFDP1, and NSD1 as TFII-I target genes in human neural crest progenitor cells. Cleft Palate Craniofac J. 2013;50(3):347–350. | |
Muller T, Hess MW, Schiefermeier N, et al. MYO5B mutations cause microvillus inclusion disease and disrupt epithelial cell polarity. Nat Genet. 2008;40:1163–1165. | |
Wang L, Guo D, Cao J, et al. Mutations in myosin light chain kinase cause familial aortic dissections. Am J Hum Genet. 2010;87:701–707. | |
Houldcroft CJ, Petrova V, Liu JZ, et al. Host genetic variants and gene expression patterns associated with epstein-barr virus copy number in lymphoblastoid cell lines. PLoS One. 2014;9(10):e108384. | |
Miyashita EM, Yang B, Lam KM, Crawford DH, Thorley-Lawson DA. A novel form of Epstein-Barr virus latency in normal B cells in vivo. Cell. 1995;80(4):593–601. | |
Horsthemke B, Nazlican H, Hüsing J, et al. Somatic mosaicism for maternal uniparental disomy 15 in a girl with Prader-Willi syndrome: confirmation by cell cloning and identification of candidate downstream genes. Hum Mol Genet. 2003;12(20):2723–2732. | |
Zulato E, Favaretto F, Veronese C, et al. ALMS1-deficient fibroblasts over-express extra cellular matrix components, display cell cycle delay and are resistant to apoptosis. PLoS One. 2011;6(4):e19081. |
Supplementary materials
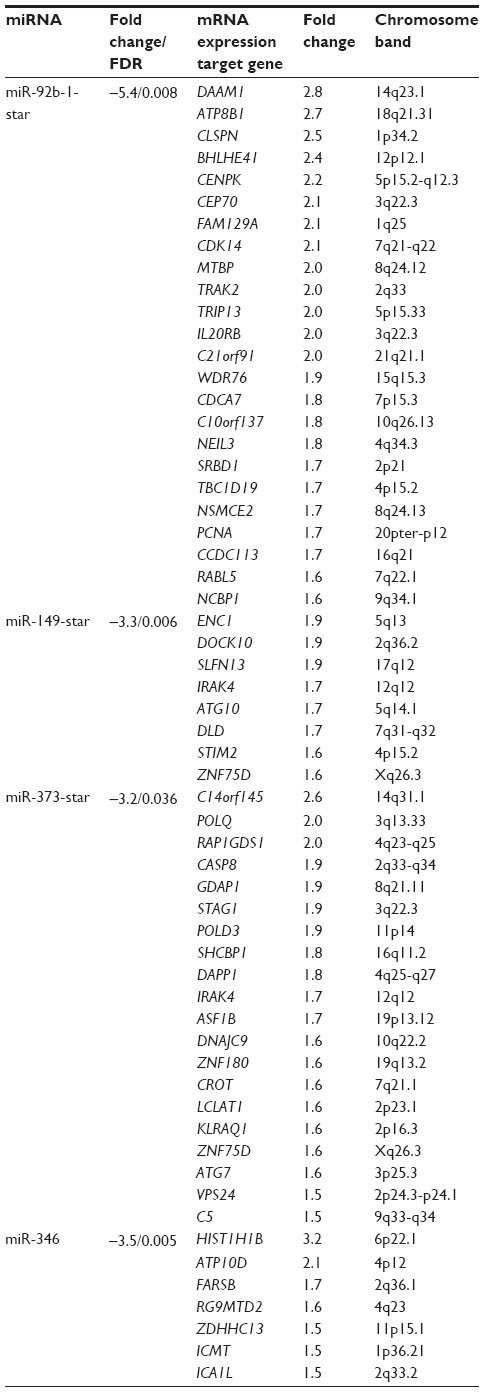 | Table S1 Target genes with increased expression and their respective class of downregulated miRNAs in Alström syndrome versus lean control males (FDR <0.2) |
 | Table S2 Target genes with increased expression and their respective class of upregulated miRNAs in Alström syndrome versus lean control males (FDR <0.2) |
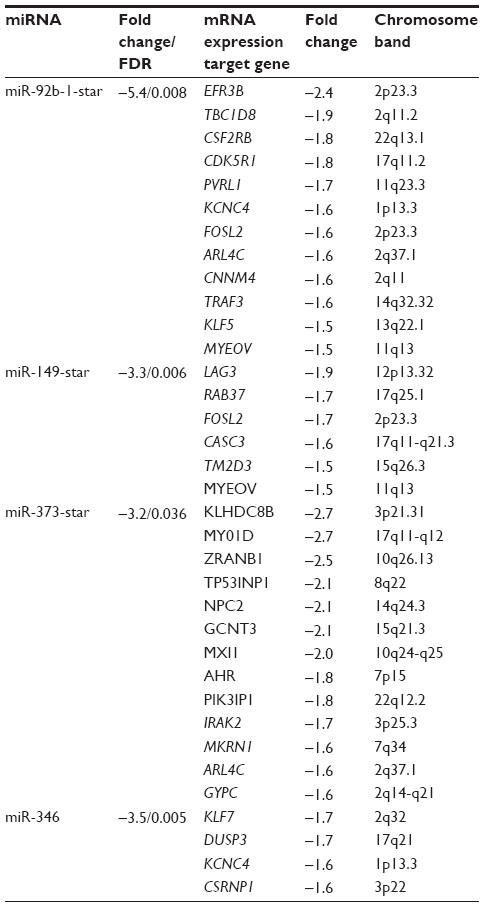 | Table S3 Target genes with decreased expression and their respective class of downregulated miRNAs in Alström syndrome versus lean control males (FDR <0.2) |
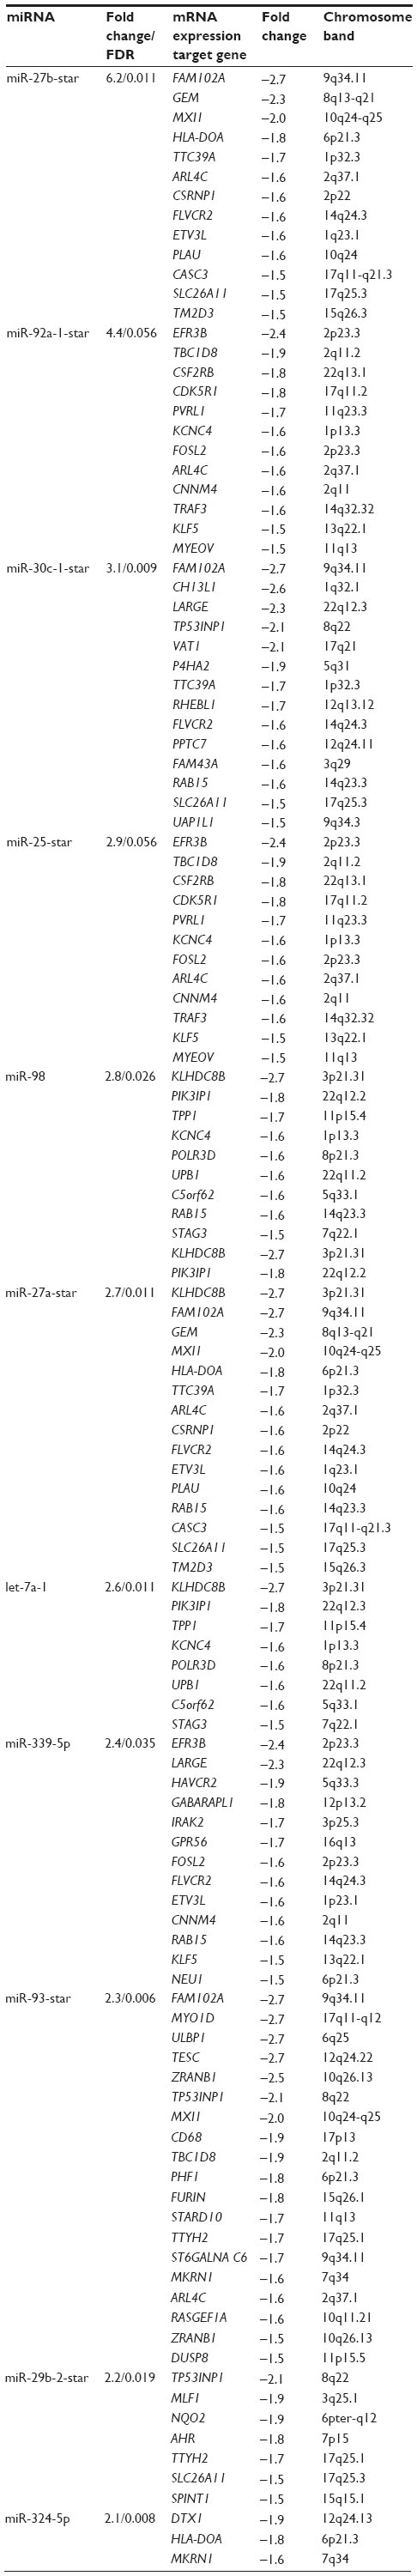 | Table S4 Target genes with decreased expression and their respective class of upregulated miRNAs in Alström syndrome versus lean control males (FDR <0.2) |
 © 2015 The Author(s). This work is published and licensed by Dove Medical Press Limited. The full terms of this license are available at https://www.dovepress.com/terms.php and incorporate the Creative Commons Attribution - Non Commercial (unported, v3.0) License.
By accessing the work you hereby accept the Terms. Non-commercial uses of the work are permitted without any further permission from Dove Medical Press Limited, provided the work is properly attributed. For permission for commercial use of this work, please see paragraphs 4.2 and 5 of our Terms.
© 2015 The Author(s). This work is published and licensed by Dove Medical Press Limited. The full terms of this license are available at https://www.dovepress.com/terms.php and incorporate the Creative Commons Attribution - Non Commercial (unported, v3.0) License.
By accessing the work you hereby accept the Terms. Non-commercial uses of the work are permitted without any further permission from Dove Medical Press Limited, provided the work is properly attributed. For permission for commercial use of this work, please see paragraphs 4.2 and 5 of our Terms.