")
Back to Journals » International Journal of Nanomedicine » Volume 14
Co-disposition of chitosan nanoparticles by multi types of hepatic cells and their subsequent biological elimination: the mechanism and kinetic studies at the cellular and animal levels
Authors Jiang LQ , Wang TY, Wang Y, Wang ZY, Bai YT
Received 12 March 2019
Accepted for publication 3 July 2019
Published 31 July 2019 Volume 2019:14 Pages 6035—6060
DOI https://doi.org/10.2147/IJN.S208496
Checked for plagiarism Yes
Review by Single anonymous peer review
Peer reviewer comments 3
Editor who approved publication: Dr Linlin Sun
Li-Qun Jiang,1 Ting-Yu Wang,1 Yun Wang,1 Zi-Yao Wang,1 Yu-Ting Bai1,2
1Jiangsu Key Laboratory of New Drug Research and Clinical Pharmacy, School of Pharmacy, Xuzhou Medical University, Xuzhou, China; 2School of Stomatology, Xuzhou Medical University, Xuzhou, China
Background: The clearance of nanomaterials (NMs) from the liver is essential for clinical safety, and their hepatic clearance is primarily determined by the co-disposition process of various types of hepatic cells. Studies of this process and the subsequent clearance routes are urgently needed for organic NMs, which are used as drug carriers more commonly than the inorganic ones.
Materials and methods: In this study, the co-disposition of chitosan-based nanoparticles (CsNps) by macrophages and hepatocytes at both the cellular and animal levels as well as their subsequent biological elimination were investigated. RAW264.7 and Hepa1-6 cells were used as models of Kupffer cells and hepatocytes, respectively.
Results: The cellular studies showed that CsNps released from RAW264.7 cells could enter Hepa1-6 cells through both clathrin- and caveolin-mediated endocytosis. The transport from Kupffer cells to hepatocytes was also studied in mice, and it was observed that most CsNps localized to the hepatocytes after intravenous injection. Following the distribution in hepatocytes, the hepatobiliary–fecal excretion route was shown to be the primary elimination route for CsNps, besides the kidney–urinary excretion route. The elimination of CsNps in mice was a lengthy process, with a half time of about 2 months.
Conclusion: The demonstration in this study of the transport of CsNps from macrophages to hepatocytes and the subsequent hepatobiliary–fecal excretion provides basic information for the future development and clinical application of NMs.
Keywords: chitosan nanoparticles, hepatocytes, macrophages, disposition, hepatobiliary–fecal elimination
Introduction
The rapid development of nanotechnology has led to an increasing number of injectable nanomaterials (NMs) for application in disease diagnosis and treatment, such as nanoparticles (Nps),1 liposomes,2 micelles,3,4 dendrimers,5 etc. After entering into the body, the NMs (>6 nm) accumulate predominantly in the mononuclear phagocyte system (MPS) organs, such as liver, spleen, lung, etc.,6 due to the recognition and subsequent internalization by macrophages in the MPS.7,8 Some NMs, such as gold Nps (40 nm),9 dextran-coated magnetite Nps (8–10 nm core diameter),10,11 etc., are gradually degraded in the cells over a few months or even longer periods and sequestered in the MPS for a long time. Indeed, it has been observed that the long-term sequestration in the MPS induces some potential side effects, especially immunotoxicities.12 Accordingly, the elimination of NMs from the MPS organs, especially from liver, sequesters 30–99% of the administered NMs from the bloodstream.6 And it is essential for the clinical safety of NMs. So it is required that all injected NMs be completely eliminated over a reasonable period of time.13
The clearance kinetics and elimination routes of NMs from the liver are highly dependent on the co-disposition of NMs by various types of hepatic cells, including both the parenchymal cells (namely hepatocytes) and the non-parenchymal cells (such as Kupffer cells, motile macrophages, liver sinusoidal endothelial cells, etc.). The Kupffer cells are specialized macrophages located in liver and make up 80–90% of total body macrophage population,14 and this kind of cells has been reported to be responsible for most of the phagocytosis of NMs in the liver.15 Some studies showed that after uptake by the macrophages, the NMs can be released by exocytosis16 or death of the macrophages.9 However, some NMs, eg PLGA Nps (271 nm),17 have been found to be retained in Kupffer cells rather than hepatocytes. Following hepatic disposition, some NMs smaller than the renal molecular weight cutoff size (~48 kDa) or 5–6 nm,6,13,18 such as cysteine @ CdSe/ZnS (4.36 nm),13 GSH-coated gold Nps (3.0 nm),19 PEG5000-coated silica Nps (3.3 nm),20 etc., were reported to be eliminated through the renal (urinary) pathway. Instead, NMs larger than this cutoff size, eg zinc oxide Nps (20 nm or 70 nm),21,22 silica Nps (50–200 nm),23 ormosil (20 nm),24 etc., can only be eliminated through the biliary (fecal) excretion route, involving the intercellular transport of NMs from MPS cells to hepatocytes.
The NMs–hepatic cell interactions (shown in Scheme 1) and the biological elimination pathways of various types of NMs have been well elucidated in the literature.6,15,25 However, most of these studies involved inorganic NMs, such as gold Nps, silica Nps, quantum dots, etc. In fact, only a limited number of studies17,26,27 have focused on organic NMs, which were most commonly used as drug carriers for their biocompatibility. However, most of these studies focused on a single type of cells, and the current studies did not consider how the unique architecture and position of various types of cells within the liver affect the clearance of NMs. Besides, the elimination routes for the organic NMs still remained an ambiguous issue, even though those of the inorganic NMs have been well elucidated, as described above.
Chitosan (Cs), one of the commonly used organic materials for the development of drug carriers, has attracted increasing interest due to its low toxicity and biocompatibility. Cs-based NMs, such as Cs nanoparticles (CsNps), Cs-based micelles, Cs-coated NMs, etc., have been widely developed for drug delivery.28 Although Cs was always considered to be safe, it appears that the NMs formulated from Cs have higher toxicity than Cs.29 For instance, in the zebra fish embryo model, it was found that CsNps decreased the hatching rate and increased the mortality.30 Therefore, the rapid and total clearance of CsNps from the body is required to reduce these potential side effects. In our previous study,16 the clearance of CsNps from a single type of macrophage was evaluated in vitro. In this study, the RAW264.7 cells and Hepa1-6 cells were used as models of Kupffer cells and hepatocytes, respectively, and the hepatic elimination and co-disposition of CsNps by these cells were studied. Additionally, the cellular distribution of CsNps in liver and their biological elimination routes in mice were analyzed at the cellular and animal levels. The Nps disposition behaviors detected in this study provide basic information for the clinical safety of Cs based NMs.
Materials
Cs (degree of deacetylation, 90%; average MW, 50 kDa; using shrimp and crab shells as raw materials) was purchased from Zhejiang Golden Shell Pharmaceutical Co., Ltd. (Zhejiang, China). Pentasodium tripolyphosphate (TPP, chemical reagent) and acetic acid were supplied by Sinopharm Chemical Reagent Co., Ltd. (Shanghai, China). Fluorescein isothiocyanate (FITC), rhodamine B isothiocyanate (RBITC), O-phospho-L-serine, primaquine, glogicide A, sucrose, nystain, wortmannin, paraformaldehyde and glutaraldehyde were purchased from Sigma-Aldrich Co., Ltd. (St. Louis, MO, USA). Cy5-NHS was purchased from Nanjing Bioorth BIOTECH Co., Ltd. (Nanjing, China). Vacuolin-1 and nocodazle were purchased from Santa Cruz Biotechnology (Shanghai, China). OCT embedding medium was purchased from Sakura Finetek Co., Ltd. (Taizhou, China). High-glucose DMEM was purchased from Jiangsu KeyGen Biotech Co., Ltd (Nanjing, China). FBS was purchased from Thermo Fisher Scientific (Nanjing, China).
Methods
CsNps and dye-labeled CsNps preparation and characterization
Dye-labeled Cs preparation
The free amines on the Cs polymer backbone were labeled with FITC, RBITC and Cy5, respectively. A total of 500 mg of Cs was dissolved in 0.1 M acetic acid and then mixed with FITC (5 mg), RBITC (5 mg) or Cy5-NHS (5 mg) by stirring. After reaction for 12 hrs, FITC-, RBITC- and Cy5-labeled Cs (FITC-Cs, RBITC-Cs and Cy5-Cs) were precipitated by adjusting the pH value to 11 with NaOH. The free dyes were removed by dialysis, and the dye-labeled Cs was obtained by lyophilization.
CsNps and dye-labeled CsNps preparation
CsNps and dye-labeled CsNps (FITC-CsNps, RBITC-CsNps and Cy5-CsNps) were prepared using a modified ionic gelation method described by Calvo et al.31 Cs/dye-labeled Cs and TPP were dissolved in a 1% (w/v) aqueous acetic acid solution at a concentration of 3 mg/mL and 5 mg/mL, respectively. The Nps were prepared by adding 0.5 mL TPP solution to 5 mL Cs/dye-labeled Cs solution for 5 mins by magnetic stirring at 25°C. Considering that the particles using only TPP as the crosslinker might adhere with each other and form the sedimentations in various buffers (especially in the neutral or alkaline buffers) in storage,32,33 glutaraldehyde (glutaraldehyde: Cs=0.46:1, w/w) was added for chemical crosslinking for 2 hrs to improve the physical stability of the particles.34 The crosslinked Nps were isolated by centrifugation (12,000 rpm, 45 mins), re-suspended in deionized water and kept at 4°C before use.
Diameter, zeta potential and morphology detection
The particle size distribution and surface charge of the Nps were determined using a NICOMP 380 ZLS Zeta potential/particle sizer (PSS.NICOMP Particle Sizing Systems, Santa Barbara, CA, USA) at room temperature, and the morphology of these NPs was determined by transmission electron microscopy (TEM) on a Tecnai G2 Spirit Twin transmission electron microscope (FEI Company, Hillsboro, OR, USA).
Fluorescence and photon signal stability detection
The FITC-CsNps, RBITC-CsNps and Cy5-CsNps were kept in acetate buffer (pH 5.0) or acidic cell lysates (pH 5.0) at 37°C, and after different periods of time, the pH values of the samples were adjusted to 8.0. The fluorescence intensities (FIs) of the FITC-CsNps and RBITC-CsNps were measured using a Synergy2™ multi-mode microplate reader (BioTek Instruments, Winooski, VT, USA) at 480 and 550 nm, respectively. The photon counts (PCs) of the Cy5-CsNps were detected using a NightOWL LB 983 in vivo Imaging System (Berthold Technologies, Bad Wildbad, Germany) and the IndiGO software (Berthold Technologies). The acidic cell lysates were prepared by splitting the RAW 264.7 cells via three freeze-thaw cycles (−80°C and 37°C), and the pH value was adjusted to 5.0 with acetic acid.
Fluorescence and photon signal release in vitro
The release of dyes from the dye-chemically labeled CsNps was conducted in the cell lystate buffer (pH 5.0) by the dialysis method as described in literature.16 In brief, the dialysis bag (MW: 8000 Da) containing 1 mL of dye-labeled CsNps (20 mg/mL) was submerged into 50 mL of acidic cell lysates (pH 5.0) at 37°C while stirring for 24 hrs. At appropriate time intervals, 0.5 mL of the aliquots was withdrawn; after the sample was diluted with the same volume of PBS (pH 8.0), the FIs (for FITC and RBITC) and PCs (for Cy5) were detected as described above.
Cell culture
The murine macrophage cell line RAW264.7 and murine hepatoma cell line Hepa1-6, which have been used as model cells of Kupffer cells35 and hepatocyte cells36 respectively, were cultured in DMEM (high glucose) supplemented with 10% FBS at 37°C in a 5% CO2 atmosphere.
Intracellular disposition of CsNps by each type of cells
Uptake kinetics and pathways detection
To detect the intracellular uptake kinetics of CsNps by each type of cells, FITC-CsNps diluted with serum-free medium to 250 μg/mL were incubated with the cells in 96-well white plates (Corning NY14831; Corning, NY, USA) at 37°C. After incubation for various lengths of time (2, 4, 6, 8 and 10 hrs), the cells were washed three times with cold PBS, and the intracellular FIs were quantitatively measured on a multi-mode microplate reader at 480 nm.
To determine the uptake pathways, the cells were pretreated with various inhibitors for 30 mins, including O-phospho-L-serine (1 mM),37,38 sucrose (450 mM)39 and nystain (30 μM)40 (as shown in Scheme 1) and then incubated with FITC-CsNps (250 μg/mL) for various periods of time. Then, the effects of the inhibitors on the Nps uptake were determined both by qualitative observation using an Olympus U-REL-T, TH4-200, TX2-ILL200 inverted fluorescence microscope (Olympus Corporation, Tokyo, Japan) and by quantitative measurement using a multi-mode microplate reader.
Exocytosis kinetics and pathways detection
To analyze the kinetics of the exocytosis of the CsNps by the cells, after preincubation of the cells with FITC-CsNps (250 μg/mL) for 2 hrs, the cells were incubated with fresh Nps-free DMEM medium, and this time point was set as the starting time (0 hr) for the exocytosis analysis. After various incubation periods (2, 4, 6, 8, 12, 24 and 36 hrs), the medium was removed, and the cells were washed with cold PBS buffer. Then, quantitative and qualitative detections were performed as described in section “Uptake kinetics and pathways detection”.
The cellular exocytosis pathways were determined using various exocytosis inhibitors, including primaquine (300 μM),41 golgicide A (50 μM),42 vacuolin-1 (1 μM)43 and wortmannin (33 μM),44 which inhibit the recycling endosome-mediated, Golgi-mediated, lysosome-mediated and multivesicular bodies (MVBs)-mediated exocytosis, respectively (Scheme 1). After preincubation of the cells with FITC-CsNps (250 μg/mL) for 2 hrs, the medium was replaced with the inhibitor-containing medium, and this time point was set as the starting time (0 hr). At various time points (2, 4, 6, 8, 12, 24 and 36 hrs), the cells were washed with cold PBS buffer, and the FIs of the FITC-CsNps retained in the cells were measured on a multi-mode microplate reader. The exocytosis percentages, which were defined as the ratio of the FIs retained in the cells at the various time points to that at the starting time, were calculated to reflect the effects of the various inhibitors.
Co-disposition of CsNps by multiple types of cells
Transwell cellular model development
To simulate the structure and Nps disposition functions of liver sinusoidal cells, as shown in Scheme 2A, the transwell cellular model was developed using two types of cells (Scheme 2B). Murine RAW 264.7 macrophages seeded in the inserts of the transwell chambers (24 wells) were used as the Kupffer cell model, and mouse liver hepatoma Hepa1-6 cells seeded in the bottom wells were used as the hepatocyte model. The transwell membrane with a cutoff size of 0.4 μm was selected to simulate the functions of the vascular endothelial fenestrae (about 100–150 nm45,46), which allowed plasma substances to cross the vascular endothelium and attach to the hepatocytes.
Transport of CsNps from RAW264.7 to Hepa1-6 cells
Intercellular transport observation: To investigate whether CsNps can be transferred from macrophages of the MPS to hepatocytes, the transport of FITC-CsNps between the different types of cells in vitro was monitored. The treatment of the cells is shown in Scheme 2B. Briefly, in the transwell model, RAW264.7 cells and Hepa1-6 cells were, respectively, cultured in the inserts and bottom wells of different transwell plates. After the RAW264.7 cells were cultured with FITC-CsNps (250 μg/mL) for 4 hrs, FITC-CsNps-containing medium was removed and the cells were washed three times with cold PBS. Then, the inserts were picked up and transferred onto the top of Hepa1-6 cells with the addition of 500 μL of fresh DMEM medium into the inserts. After 2, 6, 12 and 24 hrs, the fluorescence in the Hepa1-6 cells was measured by laser confocal microscopy.
Transport pathway detection: After culturing the RAW264.7 cells in the inserts with FITC-CsNps (250 μg/mL) for 4 hrs and washing with cold PBS, the inserts were placed on the top of the Hepa1-6 cells, which were seeded in the bottom chambers of the transwell plates and pretreated with various chemical inhibitors for 30 mins. After 4 and 8 hrs, the fluorescence signals in the Hepa1-6 cells were measured with an inverted fluorescence microscope. O-phospho-L-serine (1 mM),37,38 sucrose (450 mM)39 and nystain (30 μM)40 were used as inhibitors of phagocytosis, clathrin-mediated and caveolin-mediated endocytosis, respectively, as shown in Scheme 1.
Exocytosis of CsNps from Hepa1-6 cells after intercellular transport
Exocytosis analysis: After culturing the RAW264.7 cells with FITC-CsNps (250 μg/mL) for 4 hrs in advance, the Nps-containing medium was removed, and the Hepa1-6 and RAW264.7 cells were co-cultured in transwell plates with fresh medium. After 24 hrs of co-culture, the inserts were removed, and the medium in the Hepa1-6 culture plates was replaced with fresh medium. This time point was set as the start time (0 hr) of exocytosis analysis, and after 6 and 12 hrs, the fluorescence signals in the Hepa1-6 cells were measured on a laser confocal microscope.
Exocytosis pathway determination: To determine the exocytosis pathways of CsNps in Hepa1-6 cells in the transwell model, after co-culture of Hepa1-6 cells with the Nps-pretreated RAW264.7 cells for 24 hrs and the subsequent removal of the inserts with the RAW264.7 cells, as described above, the Hepa1-6 cells were cultured with DMEM medium containing various chemical inhibitors, including primaquine (300 μM),41 golgicide A (50 μM),42 vacuolin-1 (1 μM)43 and wortmannin (33 μM),44 which inhibit the recycling endosome-mediated, Golgi-mediated, lysosome-mediated, and MVBs-mediated exocytosis, respectively. The effects of the inhibitors were analyzed by measuring the fluorescence retained in the Hepa1-6 cells on a laser confocal microscope.
Animal experiments
Male mice of approximately 20 g were kept at a temperature of 20–25°C and 50–60% humidity before experiments, and the experiments were approved by the local ethics committee.
Cellular location of CsNps in the liver of mouse
To detect the cellular location of the CsNps in mouse liver, the mice (n=3) were intravenously injected with RBITC-CsNps at a dose of 0.16 g/kg. After 3 hrs, 12 hrs, 1 day, 3 days, 5 days and 30 days, the mice were sacrificed, and the liver was excised and immediately frozen in Tissue-Tek OCT embedding medium (Sakura Finetek, Torrance, CA, USA) for 8 μm cryo-sectioning. Kupffer cells in the sections were analyzed by immunofluorescence staining with mouse anti-mouse CD68 monoclonal antibody (Abcam, Shanghai, China) followed by rabbit anti-mouse kFlour647-labeled anti-IgG antibody (KeyGene Biotec, Nanjing, China). The hepatocytes were analyzed by immunofluorescence staining with mouse Anti-CK18 followed by goat anti-mouse IgG(H+L)/FITC (KeyGene Biotec). The nuclei in the sections were stained with DAPI, and the sections were visualized on a laser confocal microscope.
Considering the tissue sections in this test were only 8 μm, to increase the fluorescence signals in the very thin sections, the dosage was set as 0.16 g/kg, four times higher than the following animal tests, in which the signals were detected in the whole tissues or in feces/urines.
Elimination routes of CsNps after intravenous injection
After Cy5-CsNps were intravenously injected at a dose of 0.04 g/kg, the feces and urine of the mice (n=6) were collected using a rat metabolic cage at a series of time points within 2 months. The mice injected with either free Cy5-NHS or normal saline were used as the control groups. The fluorescence signals in the feces and urine were measured with a NightOWL LB 983 in vivo Imaging System, and the PCs of the samples were calculated with the IndiGO software.
Elimination kinetics of CsNps in mouse
To analyze the clearance kinetics of the CsNps in mouse tissues, Cy5-CsNps were intravenously injected at a dose of 0.04 g/kg. At various time points (0.063, 0.125, 0.25, 0.75, 1, 2, 3, 4, 6, 7, 10, 14, 18, 22, 26, 30 and 60 days) after injection, the mice were sacrificed, and the organs, including liver, lung, spleen, heart, kidney and gallbladder, were excised and imaged with the NightOWL LB 983 in vivo Imaging System. The PCs of the organs were calculated with the IndiGO software. The first-order process was used to simulate the PCs elimination kinetics, and the elimination rate constant (kel) can be obtained from the slope of the natural logarithm of the PCs-time plot. Three mice were used for each time point, and the mice injected with free Cy5-NHS or normal saline were used as the two control groups.
Statistical analysis
The results were statistically analyzed using Student’s t-tests. Differences in the results were considered statistically significant when P<0.05 and highly significant when P<0.01.
Results and discussions
CsNps preparation and characterization
To determine the disposition of CsNps in vitro in the cellular model and in vivo in the mice, various fluorescently labeled CsNps were prepared, namely FITC-CsNps, RBITC-CsNps and Cy5-CsNps. The particle sizes and zeta potentials, which are listed in Table 1, revealed that these Nps had a similar diameter of about 220 nm and a similar positive zeta potential of about 20 mV. The morphology and structure analysis by TEM (Figure 1) revealed that all these NPs had similar structures, and these structures were consistent with the results reported previously.47
 |
Table 1 Particle sizes and zeta potentials of CsNps, FITC-CsNps, RBITC-CsNps and Cy5-CsNps. (n=3) |
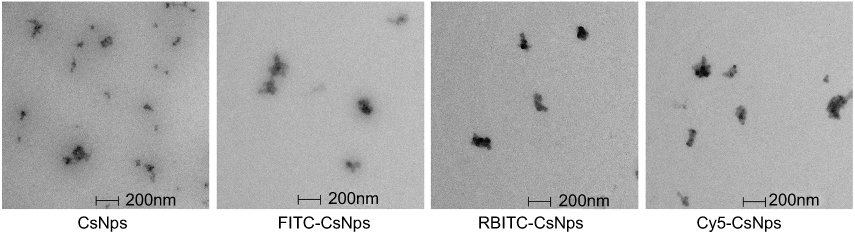 |
Figure 1 Morphology of CsNps, FITC-CsNps, RBITC-CsNps and Cy5-CsNps, showing that these particles have similar ellipsoidal and spherical structures. |
Considering that the acidic microenvironment in the cells, especially in the lysosomes, might destroy the fluorescence signals of dye-labeled Nps, the fluorescence signal stabilities of these Nps in acetate buffer (pH 5.0) and acidic cell lysates (pH 5.0) were measured (Figure S1). The results showed that over 90% of the FIs or PCs could still be obtained with incubation of 48 hrs (FITC-CsNps) or 64 d (RBITC-CsNps and Cy5-CsNps) in acetate buffer. The difference in the incubation periods for the various particles was based on the detection periods of certain particles at the cellular and animal levels. To further determine the fluorescence signal stabilities of these Nps in the cells and in the mice bodies, the dye-labeled Nps were incubated with acidic cell lysates for 48 hrs at 37°C. The results showed that an increase in the FIs or PCs could be observed in the cell lysates due to the partial degradation of the NPs in the cell lysates,16 which resulted in the unbound dyes experiencing less fluorescence quenching.16,48,49 Since the cell lysates could not be kept for a long time at 37°C, the fluorescence signal stability of the RBITC-CsNps and Cy5-CsNps was measured within only 48 hrs, and the results in the animal experiments (section “Elimination kinetics of CsNps in mouse”) showed that the signal of these Nps was still observed within 2 months in the mouse body, indicating that the dye-labeled CsNps can be used in the subsequent animal studies.
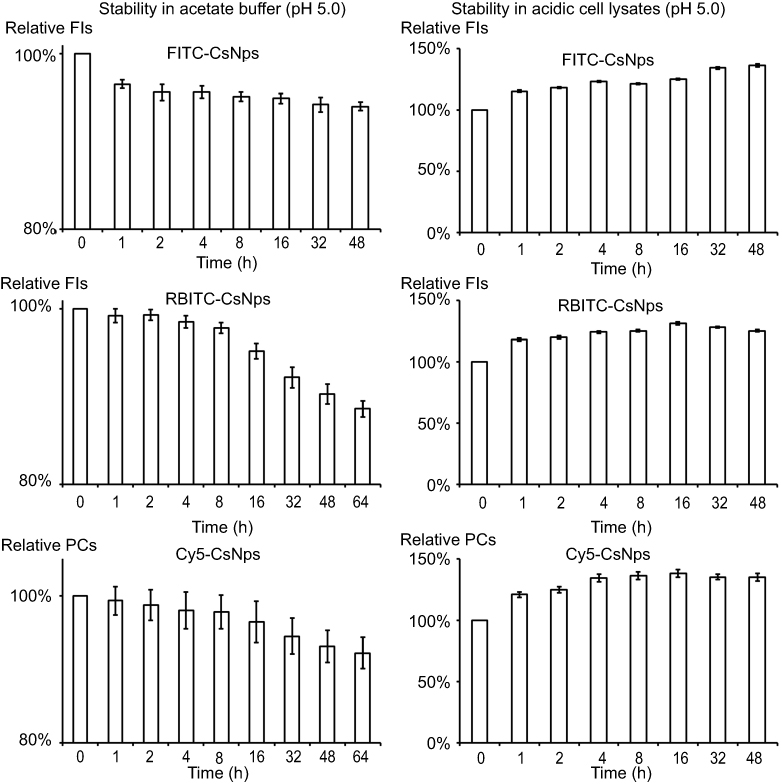 |
Figure S1 Photo signal stabilities of FITC-CsNps, RBITC-CsNps and Cy5-CsNps in acetate buffer (pH5.0) and acidic cell lysates (pH5.0), suggesting the dye-labeled CsNps could be used in the following cellular and animal studies. (n=6). |
The in vitro release of the dyes from dye-labeled CsNps is shown in Figure S2. Whinin 8 hrs, the concentrations of all the free dyes (FITC, RBITC and Cy5) in the dialysis bag and the outside buffers were identical, indicating the diffuse balance of the free dyes could be obtained within this time period. For the dye-labeled CsNps, only 0.25% of FITC, 0.13% of RBITC and 0.17% of Cy5 were diffused out of the dialysis bag at 24 hrs. These results proved the dyes, which were chemically labeled in the particles, could not be released from the particles and the disposition results observed using the fluorescence method were certainly the disposition of NPs and not of the free dyes.
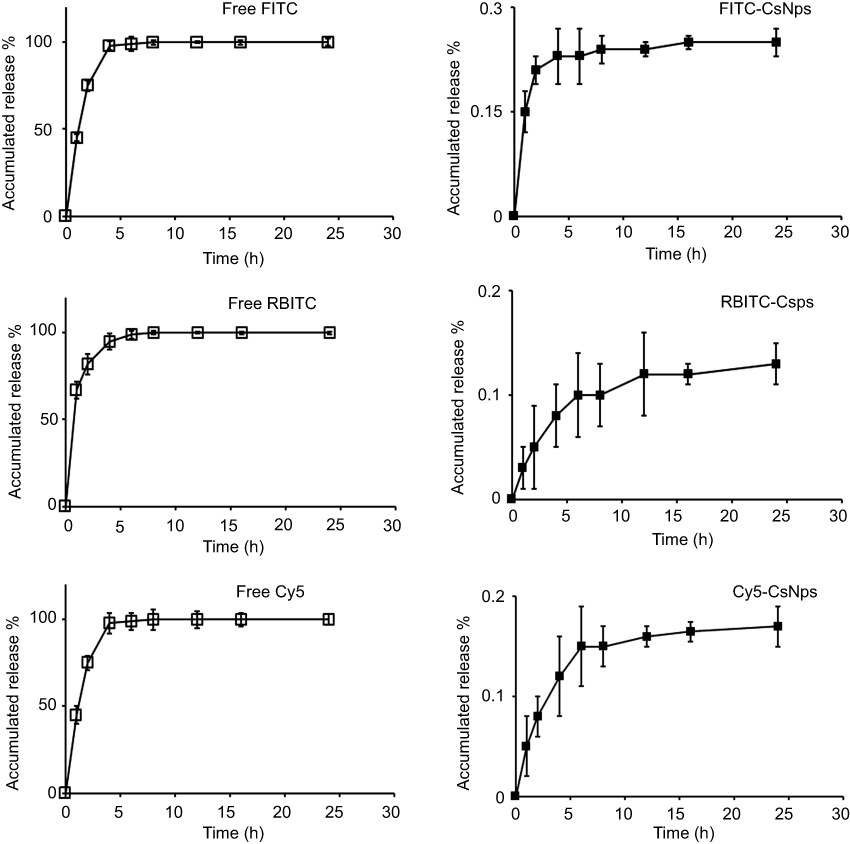 |
Figure S2 The accumulated release of dyes (FITC, RBITC and Cy5) from the dye-labeled CsNps. The diffusion of free dyes from the dialysis bag was used as control. (n=3). |
Disposition of CsNps by single type of cells
As previously reported, RAW264.7 cells and Hepa1-6 cells can be used as model cells of Kupffer cells35 and hepatocyte cells,36 respectively. The intracellular uptake and exocytosis of CsNps by RAW264.7 cells were studied in our previous work,16 which showed that both phagocytosis and clathrin-mediated endocytosis contributed to the cellular uptake of CsNps and their release from the cells through the lysosomal and multivesicular bodies pathways. Accordingly, the studies in this section are mainly focused on the disposition of CsNps by the mouse liver hepatoma Hepa1-6 cells.
Intracellular uptake of CsNps
The kinetics of the uptake of FITC-CsNps by Hepa1-6 cells isshown in Figure 2A, which also included the uptake behavior of RAW264.7 cells for comparison purposes. The results showed that Hepa1-6 cells effectively took up the particles, but there was no significant difference in the CsNps uptake efficiency between the two types of cells.
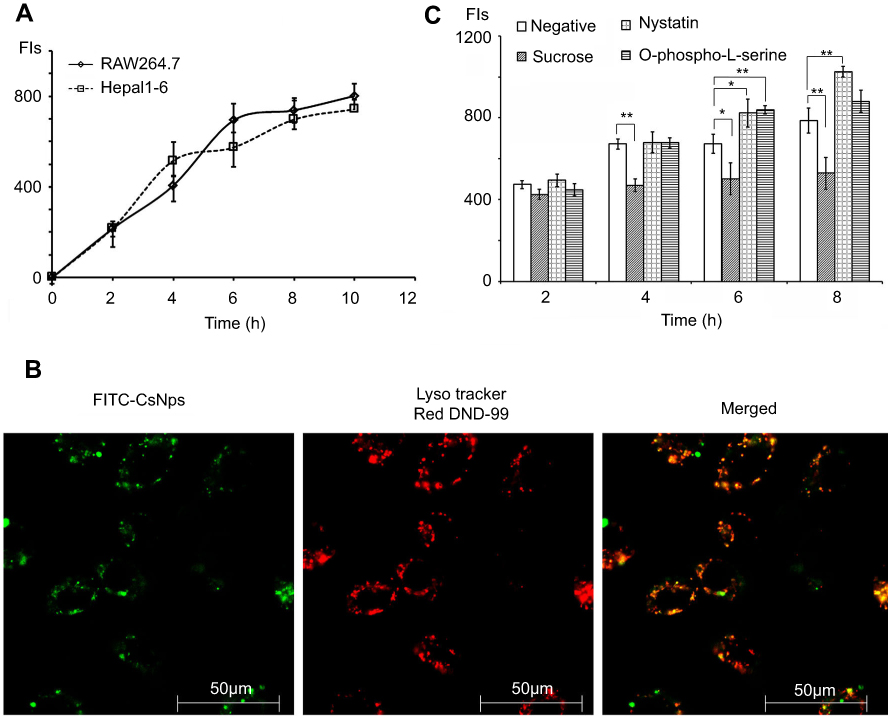 |
Figure 2 FITC-CsNps can effectively be taken up by Hepa1-6 cells by clathrin-mediated endocytosis. (A) intracellular uptake kinetics of FITC-CsNps by Hepa1-6 cells with RAW264.7 cells as the control group for comparison (n=6); (B) the acidic subcellular compartments stained with LysoTracker Red DND-99 were observed by laser confocal microscopy, showing that the acidic compartments might play important roles in the cellular uptake process; (C) the effects of chemical inhibitors on FITC-CsNps uptake showed the contribution of clathrin-mediated endocytosis to the cellular uptake process (n=6); *P<0.05 and **P<0.01. |
When the acidic subcellular compartments were tracked with the LysoTracker Red DND-99 (Thermo Fisher Scientific, Waltham, MA, SUA), as shown in Figure 2B, co-location of FITC-CsNps with red fluorescence signals was observed, indicating that these acidic subcellular compartments might have a great impact on the cellular disposition of CsNps. When sucrose, nystatin and O-phospho-L-serine were used as chemical inhibitors for clathrin-mediated endocytosis, caveolin-mediated endocytosis and phagocytosis pathways, respectively, as shown in Scheme 1, it was observed (Figure 2C) that sucrose exerted a significant inhibitory effect on cellular uptake compared with the negative control group, which was not treated with chemical inhibitors. As the hypertonic sucrose could deplete the cytoplasmic pools of clathrin and consequently the normal coated pit formation,50,51 it was concluded that the clathrin-mediated endocytosis played the most important role in the cellular uptake of CsNps by Hepa1-6 cells, as shown in Scheme 2. Nystatin and O-phospho-L-serine had no significant inhibitory effects, indicating that the CsNps uptake by Hepa1-6 cells was not dependent on the caveolae-mediated endocytosis and phagocytosis pathways.
Exocytosis of CsNps
The kinetics of the exocytosis of FITC-CsNps by Hepa1-6 cells is shown in Figure 3A using the data of RAW264.7 cells for comparison purposes. The results in this figure revealed a gradual FI decrease in Hepa1-6 cells, with about 33% of the FIs being retained in Hepa1-6 cells until 36 hrs. The qualitative detection of the exocytosis behavior is shown in Figure 3B (negative group), and the results showed that the fluorescence signals at the time points of 6, 12 and 24 hrs decreased obviously comparing with those at 0 hr, which was consistent with the quantitative results.
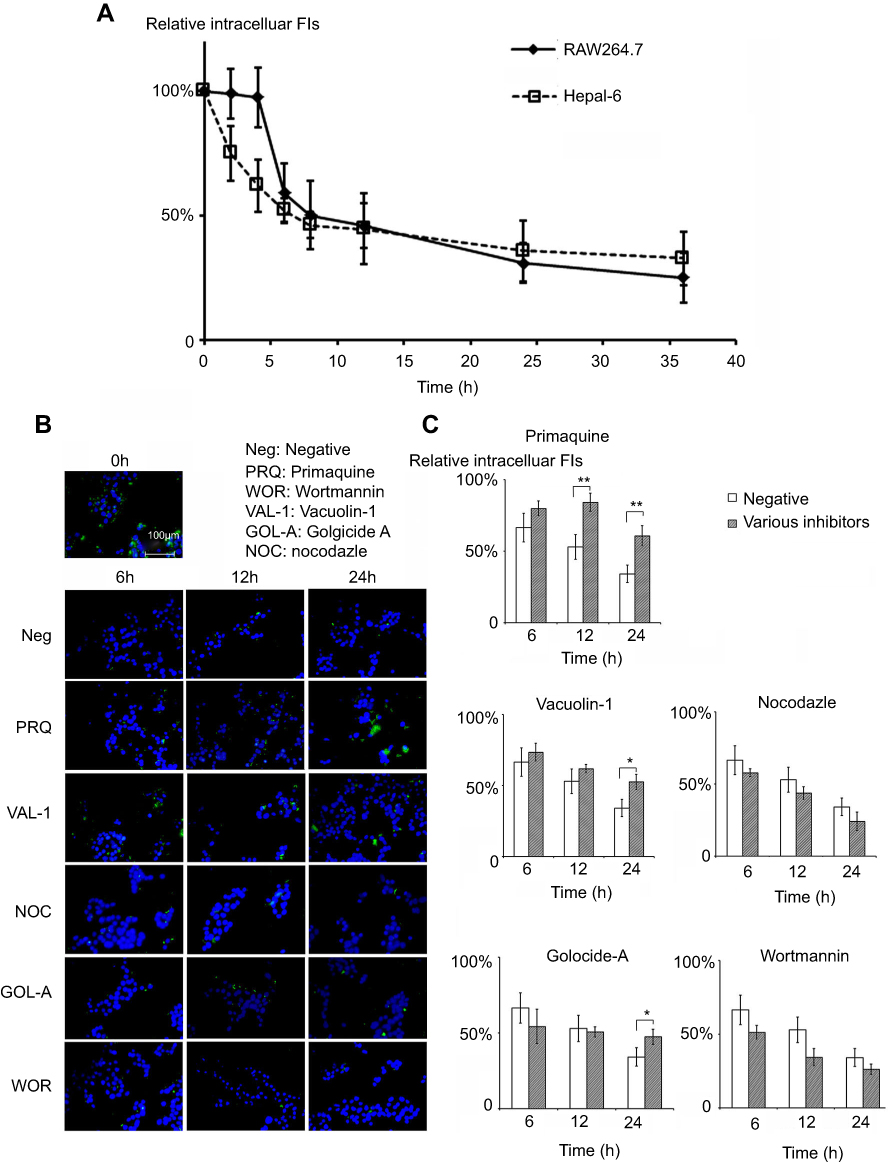 |
Figure 3 FITC-CsNps are released from Hepa1-6 cells through the endosome-mediated and lysosome-mediated endocytosis pathways. (A) The exocytosis kinetics of FITC-CsNps in Hepa1-6 cells with RAW264.7 cells as the control group for comparison (n=6); (B) the effects of various chemical inhibitors on the exocytosis of FITC-CsNps in Hepa1-6 cells observed qualitatively by inverted fluorescence microscopy; (C) the effects of various chemical inhibitors on the exocytosis detected quantitatively using a multi-mode microplate reader, showing the roles of the endosomal and lysosomal recycling pathways in the cellular exocytosis process (n=6); *P<0.05 and **P<0.01. |
The exocytosis pathways of CsNps in Hepa1-6 cells were determined using vacuolin-1, primaquine, golgicide A, wortmannin and nocodazole as chemical inhibitors for the various pathways, as shown in Scheme 1. The results shown in Figure 3B and C revealed that, compared with the negative group that was not treated with a chemical inhibitor, primaquine significantly inhibited the reduction of the intracellular FIs at 12 and 24 hrs. Since primaquine accumulated in endosomes had a strong inhibitory effect on the recycling of endocytosed materials to the plasma membrane,52 it was considered that the endosomal recycling pathway might be a potential mechanism for the exocytosis of CsNps by Hepa1-6 cells.
When Hepa1-6 cells were treated with vacuolin-1, effective inhibition of exocytosis was observed at 24 hrs. Since vacuolin-1 inhibits vacuolar ATPase activity and subsequently blocked the fusion between endosome and lysosome43 (Scheme 1), the lysosomal pathway was found to be a another potential mechanism for CsNps exocytosis, and when this pathway was blocked, the Nps retained rin the cells were thought to accumulate in the late endosomes,43 as shown in Figure 3B.
The functions of recycling endosomes and lysosomes, which mediate the exocytosis of CsNps, are all based on the cellular microtubule system.53,54 However, when the cellular microtubule polymerization was blocked by nocodazole, no significant impact on the exocytosis was observed, indicating that there might be a potential microtubule-independent pathway, which was hypothesized to be the Golgi pathway according to the literature.55,56 To examine this hypothesis, golgicide A was used to inhibit the Golgi Brefeldin A Resistant Guanine Nucleotide Exchange Factor 1 and thus inhibit the Golgi functions.57 The results showed a significant inhibitory effect on exocytosis at 24 hs (P<0.05), indicating that the Golgi pathway is potentially involved in CsNps exocytosis in Hepa1-6 cells. Also, at 6 and 12 hrs, the relative intracellular FIs of Golocide-A group were slightly higher than the negative group but without statistical significance, and this was probably due to the compensatory effect of other pathways, namely the endosomal and the lysosomal recycling pathways.
When the MVBs pathway was inhibited by preventing MVBs biogenesis with wortmannin,58,59 effective exocytosis was still observed, suggesting that the MVBs pathway has no effect on exocytosis.
Co-disposition of CsNps by multiple types of cells
Intercellular transport of CsNps from RAW264.7 to Hepa1-6 cells
After the CsNps were released from the RAW264.7 cells and traveled across the transwell membrane, the reuptake of these Nps by Hepa1-6 cells was detected. The laser confocal microscopy image (Figure 4A) showed no obvious FITC signal at 2 hrs in Hepa1-6 cells, likely due to the release of only a few CsNps by RAW264.7 cells within such time span of 2 hrs, as shown in Figure 3A. At 6 hrs, low but evident FITC signals appeared in the Hepa1-6 cells, and the fluorescence signals increased gradually between the 6- and 24-hr time points, indicating that after being released by the macrophages the CsNps can penetrate the transwell membrane and be effectively taken up by Hepa1-6 cells. The FITC signals were relatively low within 6–12 hrs, showing the duration of time required by the intercellular transport of CsNps.
 |
Figure 4 FTIC-CsNps taken up by RAW264.7 cells can be transferred to Hepa1-6 cells by the clathrin-mediated endocytosis (the main) and the caveolae-mediated pathway. (A) the re-uptake of FITC-CsNps by Hepa1-6 cells after being released from RAW264.7 cells observed by laser confocal microscopy; (B) the acidic subcellular compartments stained with LysoTracker Red DND-99 observed by laser confocal microscopy, showing that a portion of the particles were from the acidic compartments; (C) the effects of chemical inhibitors, showing that the re-uptake of FITC-CsNps by Hepa1-6 cells was mediated through the clathrin- and caveolae-dependent pathways. |
To detect the re-uptake pathways, LysoTracker Red DND-99 was used to label the acidic cellular compartments of Hepa1-6 cells. The results showed that some FITC-CsNps signal did not coincide with the acidic cellular compartments (Figure 4B), suggesting that the caveolae-mediated endocytosis pathway, whereby the Nps did not enter the acidic cellular compartments,60 might be involved in the reuptake of CsNps by Hepa1-6 cells. To verify this suspicion, nystatin was used to inhibit the caveolae-mediated pathway,61 and an obvious inhibitory effect was observed (Figure 4C), thus corroborating the above-mentioned suspicion. To elucidate the involvement of other pathways in the re-uptake of the Nps, sucrose and O-phospho-L-serine were used to inhibit the clathrin-mediated endocytosis and phagocytosis pathways. The results revealed that the most obvious inhibitory effect was achieved in the sucrose-treated group. Accordingly, it could be concluded that the re-uptake of CsNps by Hepa1-6 cells was dependent on the clathrin-mediated endocytosis (the main) and the caveolae-mediated endocytosis, as shown in Scheme 2.
Different from the direct uptake by Hepa1-6 cells alone, which was clathrin-mediated endocytosis, as discussed in section “Intracellular uptake of CsNps”, the CsNps released by RAW264.7 cells were re-taken by Hepa1-6 cells through clathrin- and caveolae-mediated endocytosis. This difference might be attributed to the particle size reduction of CsNps resulting from the corrosion of Nps in RAW264.7 cells, which was demonstrated in our previous study by the resonance energy transfer method,16 and the caveolae-mediated endocytosis mainly contributed to particles with diameter <80 nm.37,38
Exocytosis of CsNps after re-uptake by Hepa1-6 cells
As discussed above, after being exocytosed by RAW264.7 cells, CsNps crossed the transwell membrane and were re-taken by Hepa1-6 cells. The occurrence of exocytosis showed that these Nps could be released from the Hepa1-6 cells again (the negative group in Figure 5). To determine the occurrence of the various exocytosis pathways, vacuolin-1, primaquine, golgicide A, wortmannin and nocodazole were used as inhibitors of the various pathways. The results shown in Figure 5 revealed that when wortmannin, vacuolin-1 and golgicide A were used to treat the cells separately, obvious inhibition of the FIs reduction was observed at 6 and 12 hrs, indicating the involvement of various pathways, including lysosomal, MVBs and Golgi pathways, in the regulation of the exocytosis of these Nps. When the microtubules of Hepa1-6 cells were disturbed by nocodazole, effective exocytosis of Nps still occurred, probably as a result of the contribution of the Golgi pathway, which is independent of the cellular microtubule systems.57 Primaquine clearly inhibited exocytosis, suggesting that the endosomal recycling had no significant effect on cellular exocytosis process. Therefore, the exocytosis mechanisms of the Nps re-taken by Hepa1-6 cells involved the lysosomal, MVBs and Golgi pathways, which were different from those of the fresh Nps taken by Hepa1-6 cells directly (which included the endosomal, the lysosomal and the Golgi recycling pathways), and the difference in the exocytosis pathways was perhaps due to the different uptake pathways for these Nps as discussed above.
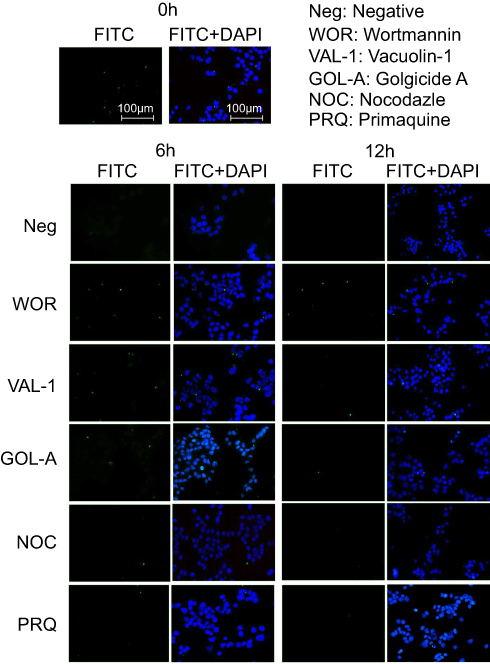 |
Figure 5 The effects of various inhibitors on the exocytosis of FITC-CsNps, which were re-taken by Hepa1-6 cells, showing that these particles can be released from Hepa1-6 cells through the lysosomal, MVBs and Golgi-mediated pathways. |
The chemical inhibition detection showed that the Golgi pathway played an important role in the exocytosis of CsNps in Hepa1-6 cells. As the Golgi apparatus contains vesicles for substances to be excreted in bile,62–64 it is hypothesized that the CsNps in liver might be released into the bile, and this hypothesis will be tested and validated in the subsequent animal studies.
Clearance of CsNps from mouse after intravenous injection
Cellular location of CsNps in mouse liver
The in vitro cellular studies had verified the intercellular transport of CsNps from RAW264.7 cells to Hepa1-6 cells across the transwell membrane. In order to further confirm the intercellular transport of CsNps at the animal level, the cellular location of RBITC-CsNps was examined in mouse liver, by analyzing the immunofluorescence distribution in Kupffer cells and hepatocyte cells. Before the animal tests, the hemolysis of the particles was detected (Supporting Materials), and the results showed within 50–400 μg/mL, no significant hemolysis could be induced by the Nps (Figure S3). After intravenous injection of the RBITC-CsNps as shown in Figure 6, their uptake by Kupffer cells could be observed from 3 hrs to 1 days, which were indicated with white arrows. Over the 3–30-day period, an increasing proportion of Kupffer cells released the Nps from the cells, which were indicated with yellow arrows. In particular, after 5 days, no co-location of Nps with Kupffer cells could be observed, indicating that all the CsNps taken by Kupffer cells had been cleared from the cells.
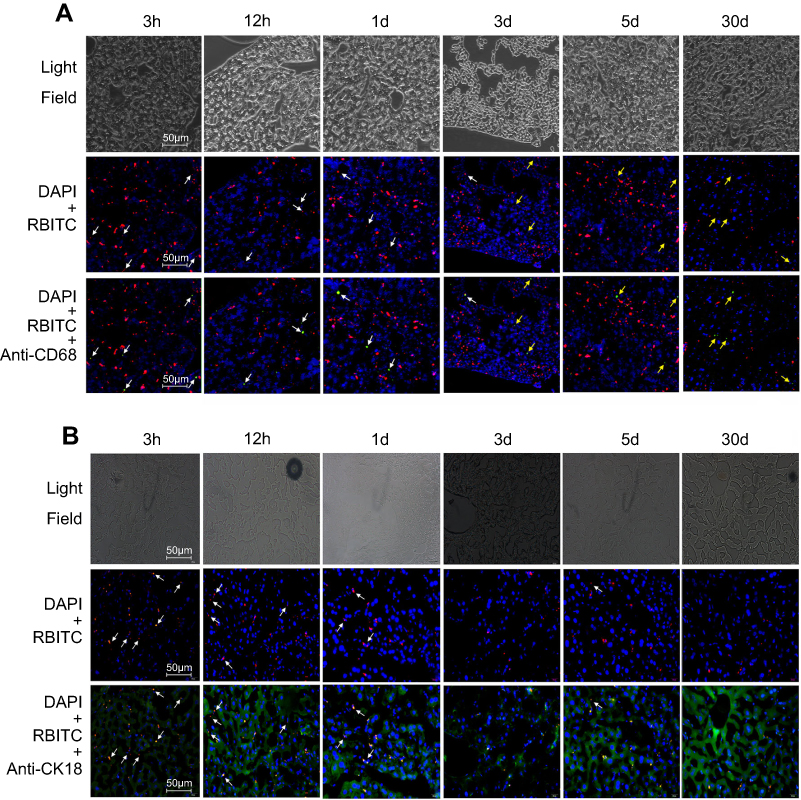 |
Figure 6 RBITC-CsNps can be transferred from Kupffer cells to hepatocytes in the liver of mice after intravenous injection. (A) Kupffer cells were stained with mouse anti-mouse CD68 monoclonal antibody followed by rabbit anti mouse kFlour647-labeled anti IgG antibody. The white arrows indicate the uptake of RBITC-CsNps by Kupffer cells. The yellow arrows indicate: that Kupffer cells released RBITC-CsNps. (B) Hepatocytes were stained with mouse anti-mouse CK18 followed by goat anti-mouse IgG(H+L)/FITC. The white arrows indicate the RBITC-CsNps release from hepatocytes. |
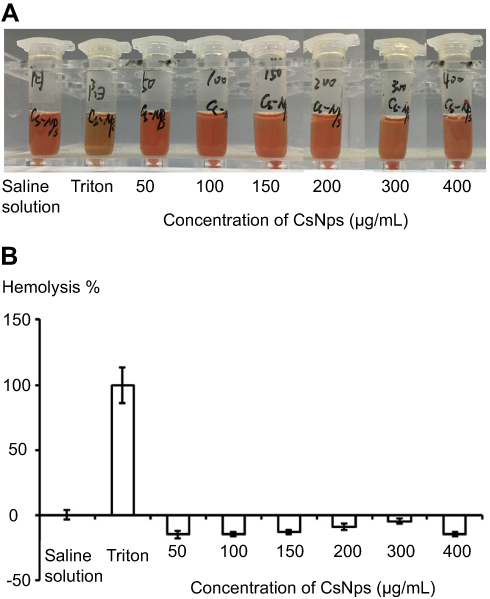 |
Figure S3 The qualitative (A) and quantitative (B) detection of hemolysis of CsNps. The negative values of hemolysis percentage of CsNps might be induced by the binding of proteins with the Nps. (n=6). |
When the immunofluorescence distribution analysis was performed for hepatocytes (Figure 6B), some RBITC-CsNps could be observed out of hepatocytes within 1 day (indicated with white arrows). Since Kupffer cells were considered to be responsible for most of the phagocytic activity in the liver,15 it was assumed that the CsNps out of the hepatocytes were mostly located in Kupffer cells, and this was consistent with the results as shown in Figure 6A. Over the 3–30-day period after injection, the Nps out of the hepatocytes gradually disappeared, and this might be attributed to the re-uptake of CsNps by these cells.
The in vivo immunofluorescence assay results indicated that the CsNps taken up by Kupffer cells could be exocytosed and then be re-taken by hepatocytes in the mouse. The results presented in Figure 6 revealed that even at 3 hrs after the intravenous injection, most Nps localized to hepatocytes. The rapid distribution in hepatocytes might be attributed to the size of the diameter of the Nps, which was smaller than the fenestrations of the sinusoids for mouse (141±5.4 nm),46 and thus could enter the sinusoid and then be taken up directly by hepatocytes.
As reported by Park JK et al,17 the PLGA Nps (271±1.4 nm) were mainly localized to the Kupffer cells rather than hepatocytes. The differences in cellular distribution of PLGA NPs compared with CsNps detected in this study might be due to the different particle characteristics, such as the material, diameters, potentials and adsorption of serum proteins, as reported by Souris J,65 as well as the differences in the cellular distribution, which might determine the different biological fate of the particles.
For the pharmaceutical design, the different hepatic diseases required different cellular targeting. For example, the hepatocyte is the designated target cell for viral hepatitis, steatohepatitis and other metabolic disorders, and Kupffer cell is the key target cell for liver inflammation.66 Therefore, the distribution of carriers in different kinds of cells should be considered when the carriers are designed for various diseased. The re-distribution of CsNps from Kupffer cells to the hepatocytes indicated this kind of material might increase the drug concentration in hepatocytes and it was much suitable for the diseases such as hepatitis and so on.
Elimination routes of CsNps from mouse
The immunofluorescence distribution assay showed that most CsNps distributed in the hepatocytes after being released from Kupffer cells, and the cellular studies showed that CsNps were taken up by Hepa1-6 cells, the model cells of hepatocytes, which could release them by the Golgi-mediated exocytosis pathway. All these findings indicated the possible elimination of the CsNps through biliary excretion. In order to verify this possibility, near-infrared signals of Cy5-CsNps in the feces and urine of mice were measured after the intravenous injection of the Cy5-CsNps. The results showed that compared with the urine most near-infrared signals were present in the feces (Figure 7A and B), suggesting that the biliary excretion was the primary pathway for CsNps elimination. These findings were consistent with the results reported in the literature indicating that polystyrene microspheres67 and mesoporous silica Nps65 were excreted through the biliary (fecal) excretion route after intravenous injection in mice. Besides the biliary excretion, the photon signals could also be observed in the urine samples. As previously reported, only NMs smaller than the renal molecular weight cutoff size (~48 kDa) or 5–6 nm6,13,18 can be eliminated through the renal (urinary) pathway. Accordingly, the photon signal in the urine was supposed to arise from the metabolites of CsNps, which had been verified in vitro using a fluorescence resonance energy transfer technique.16 The excretion of the free fluorescence dye (Cy5-NHS) from the mice was examined as control (Figure 7C and D), showing a relatively rapid clearance within 18 days after injection, and the rapid clearance of free Cy5-NHS thus proved that the slow excretion behaviors observed in Figure 7A and B belonged to the Nps rather than the free dyes.
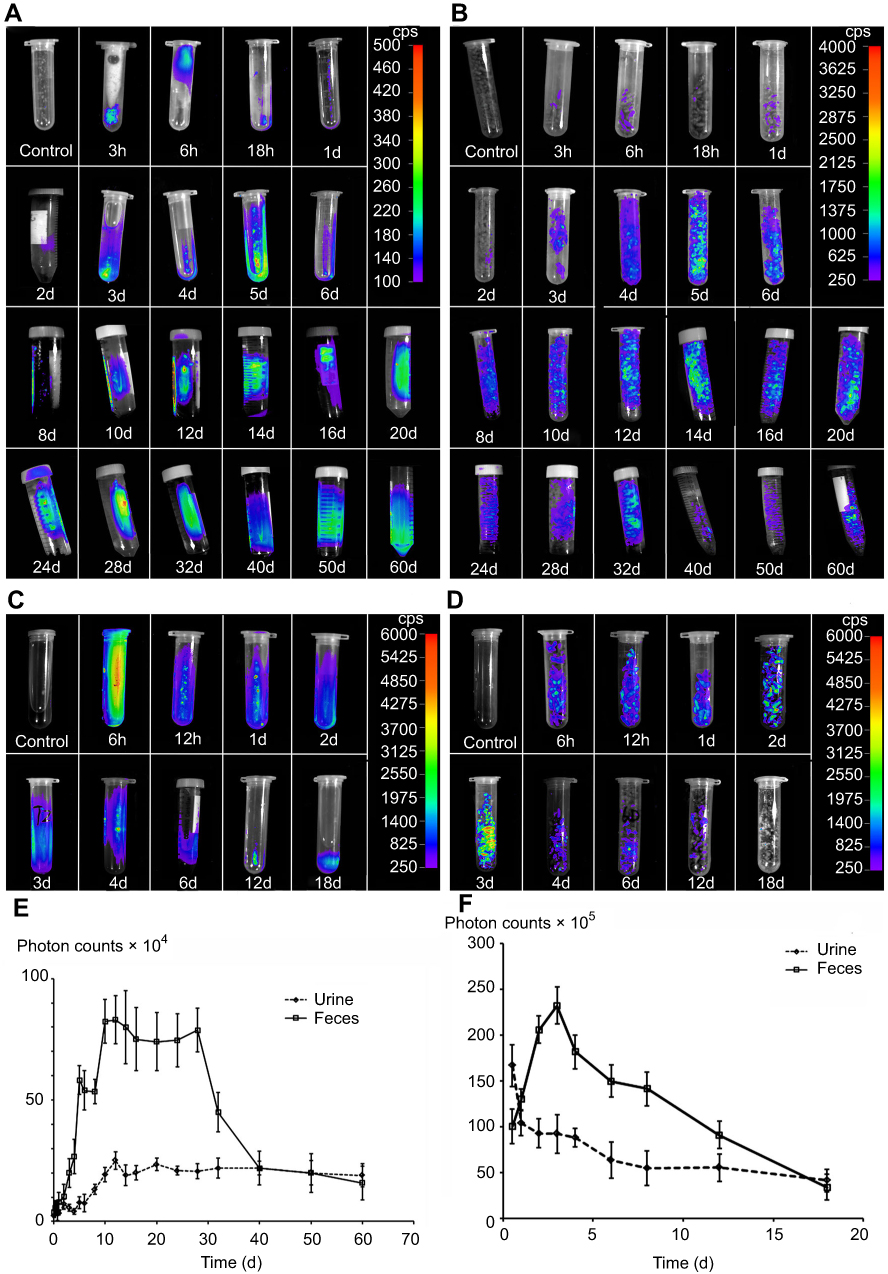 |
Figure 7 Cy5-CsNps were eliminated through the hepatobiliary (fecal) excretion pathway (the main) and the renal (urinary) pathway. (A, B) Photon signals in the urine (A) and feces (B) of the Cy5-CsNps group detected with the NightOWL LB 983 in vivo Imaging System, showing that the Cy5-CsNps were primarily excreted through the hepatobiliary excretion system. (C, D) photon signals in the urine (C) and feces (D) of the free Cy5-NHS group (the control group), showing that the free dye could be excreted much faster than the particles. (E, F) the semiquantitative detection of the photon counts in the urine and feces of the Cy5-CsNps group (E) and Cy5-NHS group (F) using the IndiGO software (n=3). |
The semiquantitative results determined with the IndiGO software are presented in Figure 7E and F, and they showed that excretion kinetics of CsNps in the feces and urine could be reflected by the PCs-time curves. The areas under PCs-time curve (AUC) of the urine and feces samples were calculated using the trapezoidal rule. The results showed that the AUC of the feces samples was 2.36 times higher than that of the urine samples, leading to the conclusion that most CsNps were eliminated through the biliary (fecal) pathway.
The PCs-time curve shown in Figure 7E indicated that the excretion speed of CsNps from feces was relatively slow within 2 days after injection. Also, within 10–30 days, the excretion increased rapidly and maintained its highest level, suggesting that the biliary excretion of CsNps mainly occurred in the first month after intravenous injection. Different from the excretion through the fecal route, the PCs in urine increased slowly after injection and maintained the plateau within 12–60 days, suggesting a uniform excretion of CsNps from kidney. It is noteworthy that even 2 months after injection of the CsNps, they were still detected in urine or feces, indicating the long term required for the total elimination of CsNps from the body.
Elimination kinetics of CsNps in mouse
It has been demonstrated that CsNps were cleared from the body through the biliary (the primary mechanism) and renal pathway, thus to analyze the clearance kinetics, the amounts of Cy5-CsNps in the tissues of mice were analyzed at different periods after intravenous injection. The near-infrared imaging (Figure 8A) analysis showed that CsNps mainly localized to the liver and kidney of the mice, and the Nps were also found in other tissues, eg lung, heart, spleen, and especially in the gallbladder, which was consistent with the biliary excretion of CsNps as demonstrated above.
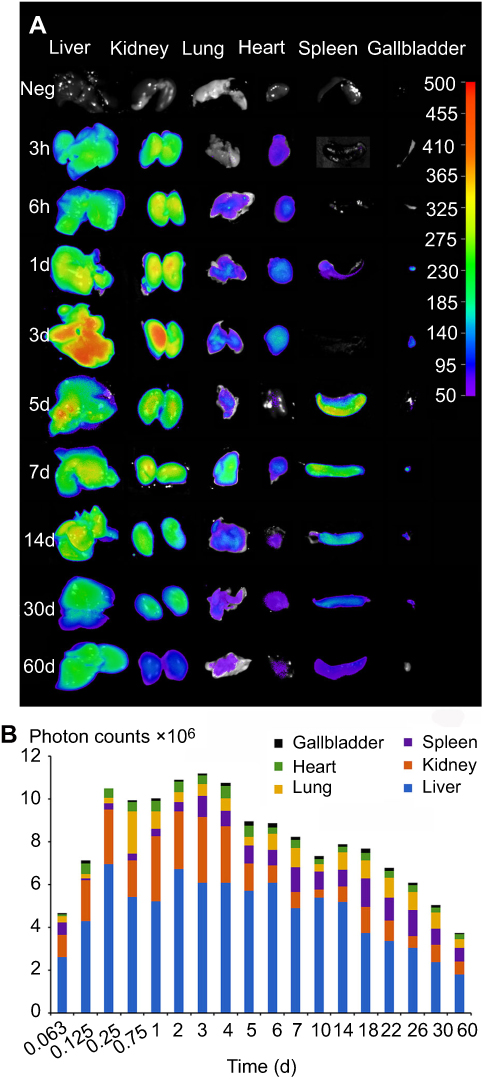 |
Figure 8 The photon signals of Cy5-CsNps in various tissues within 2 months, showing the long term required for the biological elimination of CsNps. (A) The qualitative observation using the NightOWL LB 983 in vivo Imaging System. (B) The semiquantitative detection of photon counts in different tissues using the IndiGO software (n=3). |
The semiquantitative PCs results of the CsNps in various tissues over a 2-month period are shown in Figure 8B. The results showed that within 6 hrs after injection, the total PCs in the tissues increased gradually due to the distribution of CsNps from blood to the tissues within this period. Within the 6-hr to 3-day period, the total PCs in the tissues maintained the plateau, indicating the slow biological disposition behavior. After 3 days, a gradual clearance of CsNps from the body could be observed. The ratios of PCs to the total PCs in each tissue (Figure S4) reached a steady value after about an 18-day period, indicating the dynamic distribution balance of CsNps in the body. When first-order process was used to simulate the elimination kinetics of the PCs, the elimination rate constant (kel) could be calculated by linear regression using the data after 18 days (Figure S5). The kel values determined using the PCs in different tissues were in the range of 0.00969–0.01173 day−1 as shown in Table 2, while the average kel was calculated to be 0.01047±0.00095 day−1 with a half time of 66.7±4.8 days. Considering that the PCs could be increased by the biodegradation of Nps, it was hypothesized that the half time of the CsNps might be overestimated when using the PCs-time curves to reflect the elimination of CsNps, but the elimination of CsNps from mice was still considered to be a protracted process. In this study, the single dosage of 0.04 g/kg was applied for the biological elimination detection. Because the elimination of Nps might be influenced by many factors, eg the dosage injected, the repeated injection, the injection intervals and so on, these factors should be considered in an integrated manner when the CsNps were applied as the drug carriers in clinical in future.
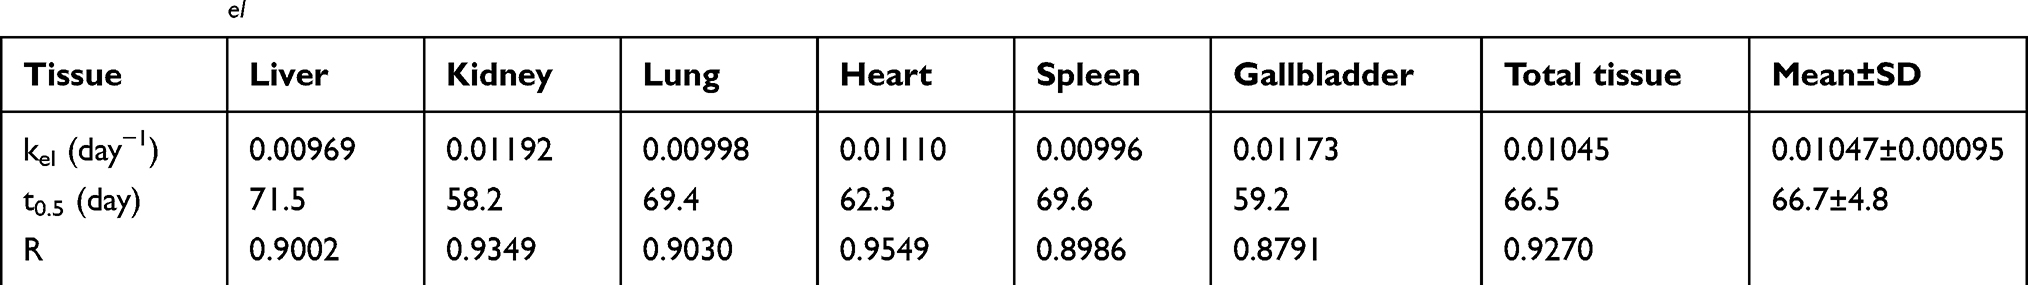 |
Table 2 The kel calculated from PCs in different tissues |
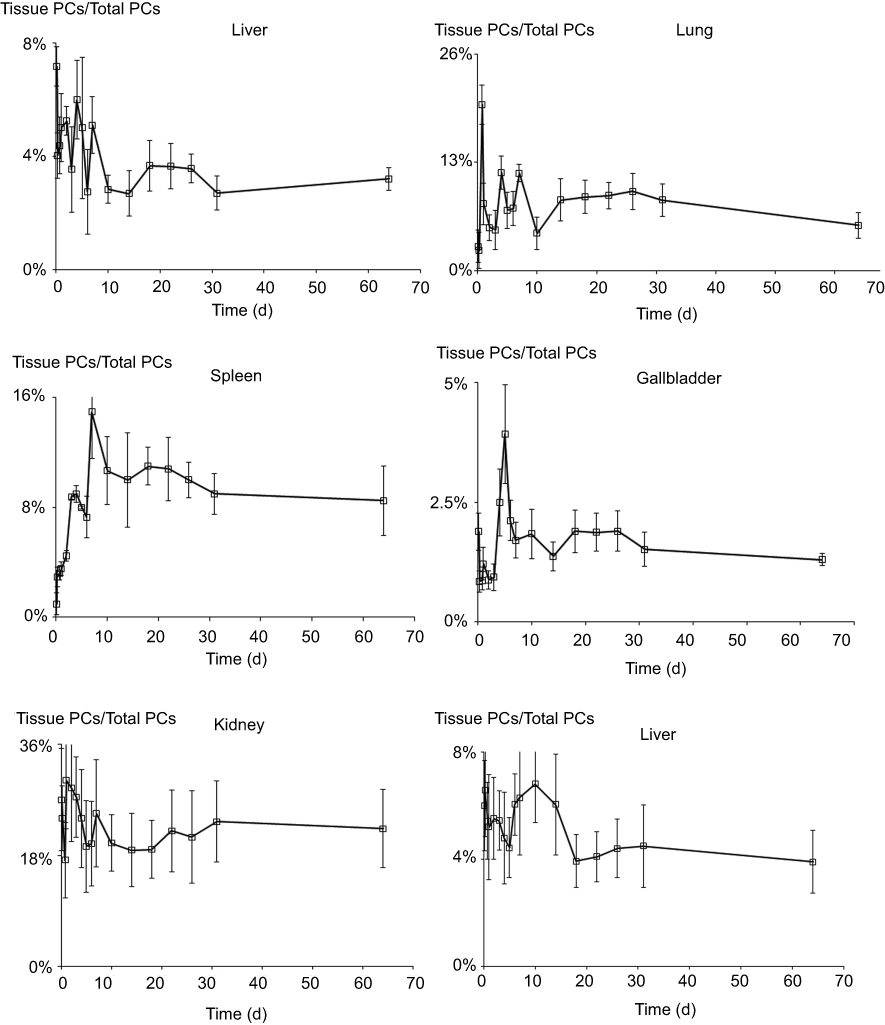 |
Figure S4 The ratios of photon counts in each tissue to the total ones. (n=3). |
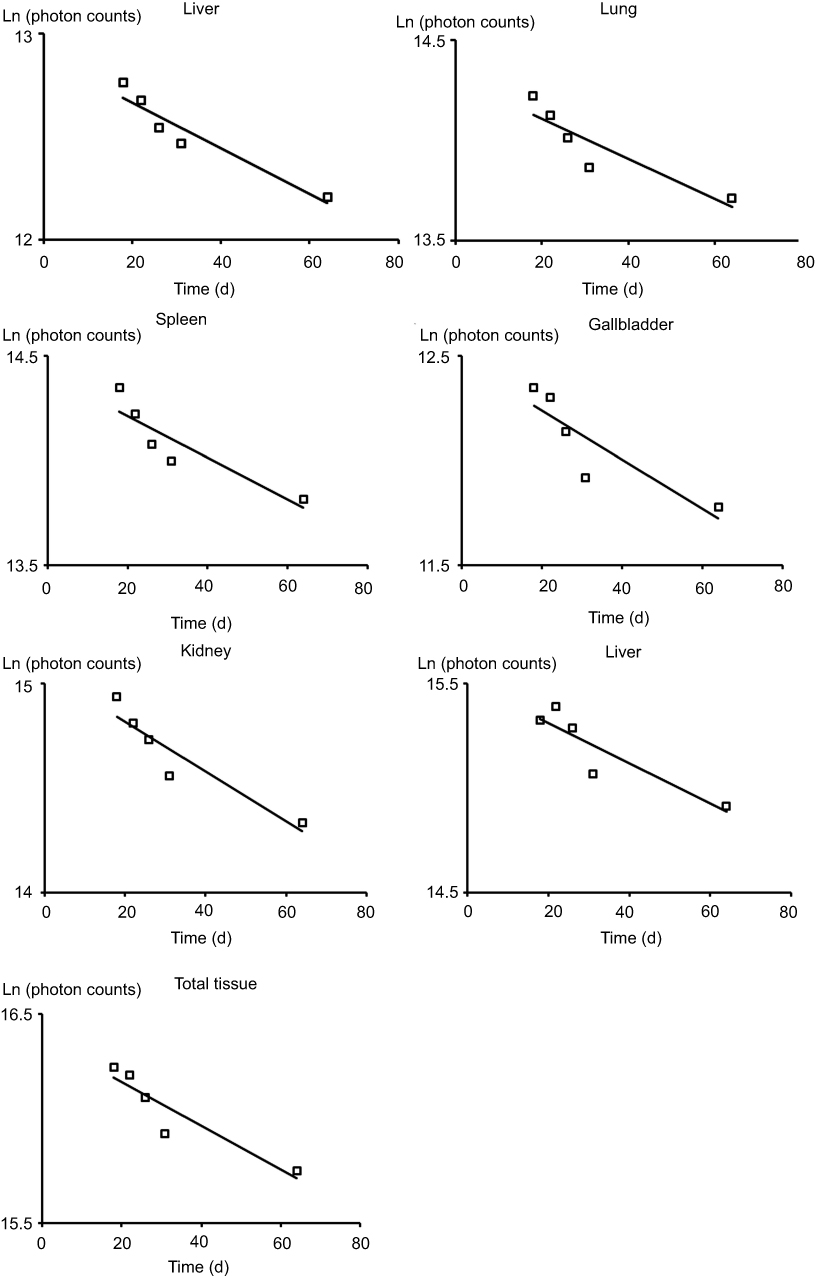 |
Figure S5 The linear regression of Ln(photon counts) to time. |
When the Cy5-NHS free dye was injected as the control, a relatively rapid clearance of Cy5-NHS from the body was observed, as shown in Figure S6, and the semiquantitative results revealed that the kel of Cy5-NHS was 0.55±0.10 day−1 with a half time of 1.31±0.30 day, corroborating the slow elimination observed in Figure 8, which was attributed to the particles but not the free dyes.
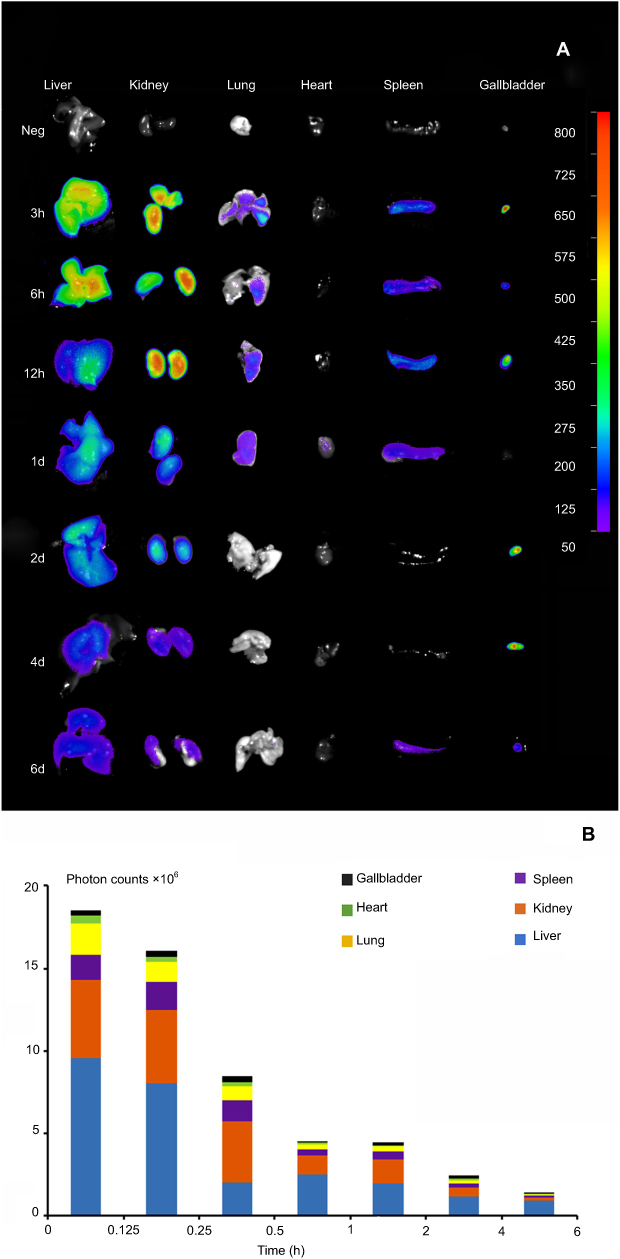 |
Figure S6 The photo signals of free Cy5-NHS in various tissues within 6 d. (A) the qualitative observation using Night OWL LB 983 in vivo Imaging System. (B) the semiquantitative detection of photon counts with the software Indigo. |
Conclusions
The intercellular transport of Cs based NMs from RAW264.7 cells to Hepa1-6 cells was demonstrated in the transwell model. Additionally, the various pathways involved in the co-disposition of CsNps in the two types of hepatic cells were determined as shown in Scheme 3. The in vivo animal experiments proved that after intravenous injection of the NMs, they were transported from Kupffer cells to hepatocytes in mice. It was also found that, besides the renal (urinary) pathway, the hepatobiliary (fecal) excretion system was the main elimination pathway for CsNps. For both the hepatobiliary (fecal) and renal (urinary) pathways, the elimination of CsNps was a protracted process. Accordingly, it is suggested to take into account the long biological retention time t when these NMs are used for clinical purposes in the future.
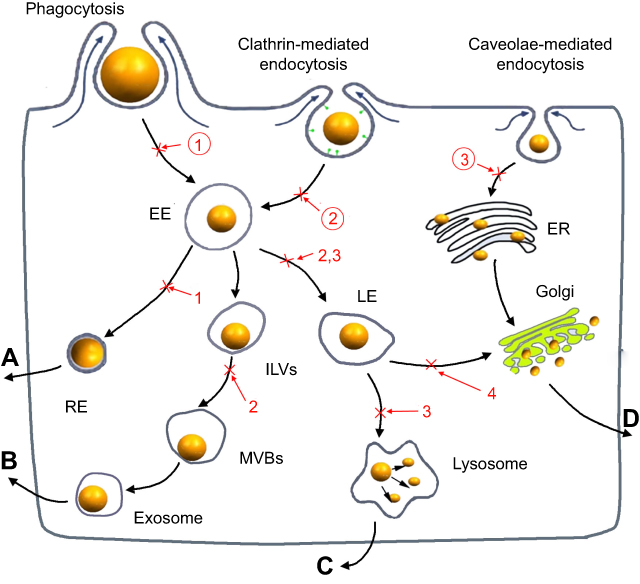 |
Scheme 1 The cellular uptake and exocytosis of NMs and the chemical inhibitors of various pathways. (A) The endosome-mediated exocytosis; (B) the multivesicular bodies (MVBs)-mediated exocytosis; (C) the lysosome-mediated exocytosis; (D) the Golgi-mediated exocytosis; ①: O-phospho-L-serine; ②: sucrose; ③: nystatin; 1: primaquine; 2: wortmannin; 3: vacuolin-1; 4: golgicide A. Abbreviations: EE, early endosomes; LE, late endosomes; RE, recycling endosomes; ILVs, intraluminal vesicles; MVBs, multivesicular bodies; ER, endoplasmic reticulum. |
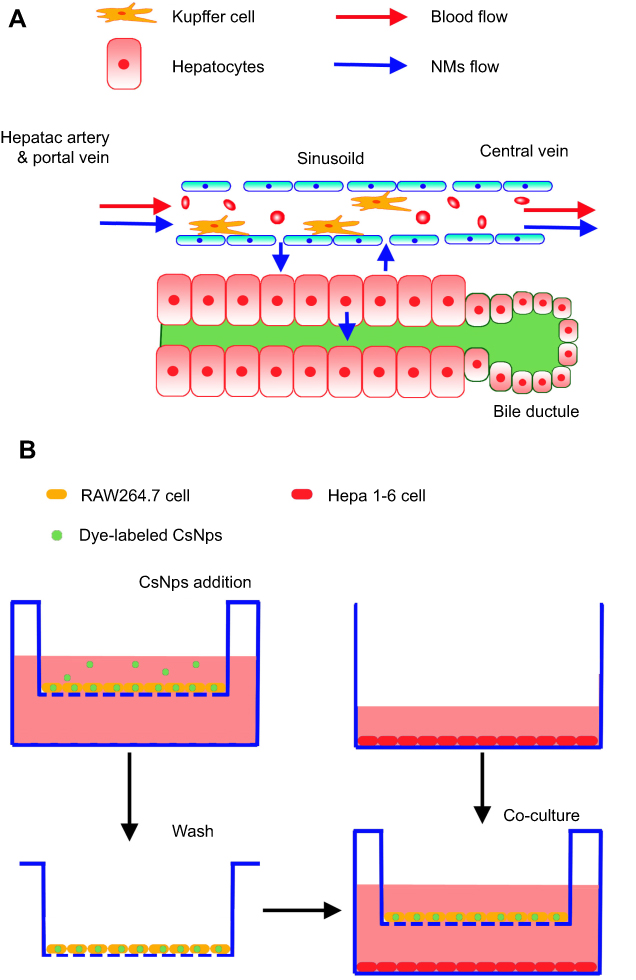 |
Scheme 2 The structure and NMs disposition functions of liver sinus (A) and the treatment of RAW264.7 cells and Hepa1-6 cells in the transwell model (B). |
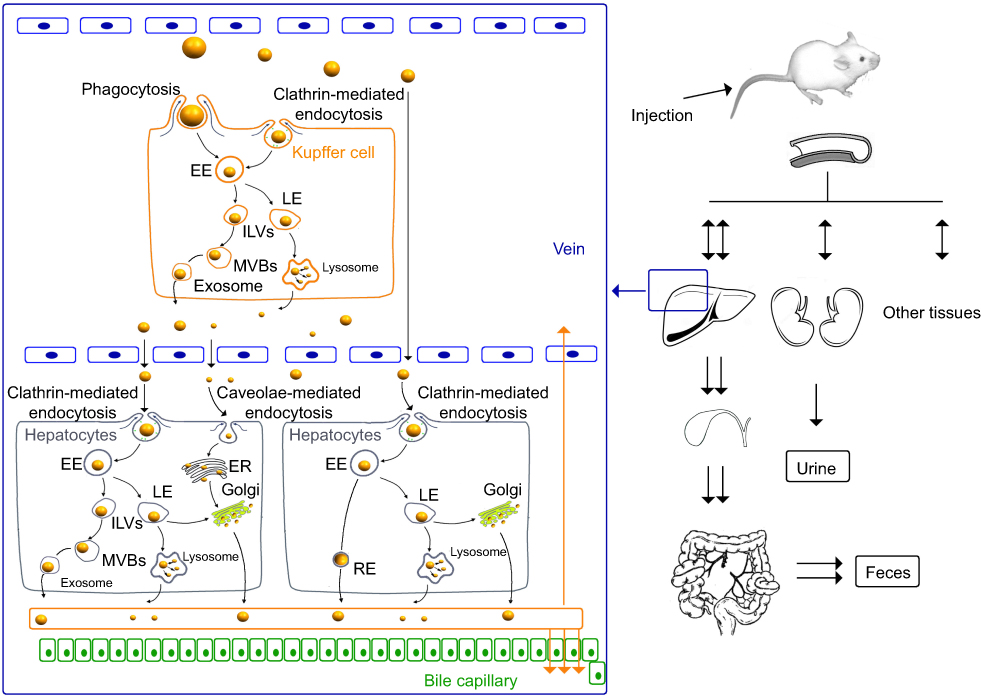 |
Scheme 3 Schematic diagram of the disposition and elimination of CsNps in liver at the animal and cellular levels. Abbreviations: EE, early endosomes; LE, late endosomes; RE, recycling endosomes; ILVs, intraluminal vesicles; MVBs, multivesicular bodies; ER, endoplasmic reticulum. |
Acknowledgments
The authors greatly acknowledge the sharing platform for Public Experimentation Center of Xuzhou Medical University for the help in the confocal microscope detection. This work was supported by the National Natural Science Foundation of China (81502995) and the Natural Science Foundation of Jiangsu Province (BK20140223).
Disclosure
The authors report no conflicts of interest in this work.
References
1. Mou J, Liu Z, Liu J, Lu J, Zhu W, Pei D. Hydrogel containing minocycline and zinc oxide-loaded serum albumin nanopartical for periodontitis application: preparation, characterization and evaluation. Drug Deliv. 2019;26(1):179–187. doi:10.1080/10717544.2019.1571121
2. Yang YH, Wang QQ, Li J, Zhao ZM, Liu Y. Ligustrazine-loaded stealth liposomes: cellular uptake in murine phagocyte cell model and pharmacokinetics in rats. Lat Am J Pharm. 2016;35(1):32–37.
3. Ren J, Fang ZJ, Yao L, et al. A micelle- like structure of poloxamer-methotrexate conjugates as nanocarrier for methotrexate delivery. Int J Pharmaceut. 2015;487(1–2):177–186. doi:10.1016/j.ijpharm.2015.04.014
4. Zhao ZM, Wang Y, Han J, et al. Self-assembled micelles of amphiphilic poly(L-phenylalanine)-b-poly(L-serine) polypeptides for tumor-targeted delivery. Int J Nanomed. 2014;9:5849–5862. doi:10.2147/Ijn.S73111
5. Lin J, Hu W, Gao F, et al. Folic acid-modified diatrizoic acid-linked dendrimer-entrapped gold nanoparticles enable targeted CT imaging of human cervical cancer. J Cancer. 2018;9(3):564–577. doi:10.7150/jca.19786
6. Zhang YN, Poon W, Tavares AJ, Mcgilvray ID, Chan WCW. Nanoparticle-liver interactions: cellular uptake and hepatobiliary elimination. J Control Release. 2016;240:332–348. doi:10.1016/j.jconrel.2016.01.020
7. Walkey CD, Chan WCW. Understanding and controlling the interaction of nanomaterials with proteins in a physiological environment. Chem Soc Rev. 2012;41(7):2780–2799. doi:10.1039/c1cs15233e
8. Walkey CD, Olsen JB, Guo H, Emili A, Chan WC. Nanoparticle size and surface chemistry determine serum protein adsorption and macrophage uptake. J Am Chem Soc. 2012;134(4):2139–2147. doi:10.1021/ja2084338
9. Sadauskas E, Danscher G, Stoltenberg M, Vogel U, Larsen A, Wallin H. Protracted elimination of gold nanoparticles from mouse liver. Nanomedicine. 2009;5(2):162–169. doi:10.1016/j.nano.2008.11.002
10. Lacava LM, Garcia VAP, Kückelhaus S, et al. Long-term retention of dextran-coated magnetite nanoparticles in the liver and spleen. J Magn Magn Mater. 2004;272–276:2434–2435. doi:10.1016/j.jmmm.2003.12.852
11. Levy M, Luciani N, Alloyeau D, et al. Long term in vivo biotransformation of iron oxide nanoparticles. Biomaterials. 2011;32(16):3988–3999. doi:10.1016/j.biomaterials.2011.02.031
12. Lee S, Kim MS, Lee D, et al. The comparative immunotoxicity of mesoporous silica nanoparticles and colloidal silica nanoparticles in mice. Int J Nanomedicine. 2013;8:147–158. doi:10.2147/IJN.S39534
13. Choi HS, Liu W, Misra P, et al. Renal clearance of quantum dots. Nat Biotechnol. 2007;25(10):1165–1170. doi:10.1038/nbt1340
14. Wang H, Thorling CA, Liang X, et al. Diagnostic imaging and therapeutic application of nanoparticles targeting the liver. J Mater Chem B. 2015;3(6):939–958. doi:10.1039/C4TB01611D
15. Bertrand N, Leroux JC. The journey of a drug-carrier in the body: an anatomo-physiological perspective. J Control Release. 2012;161(2):152–163. doi:10.1016/j.jconrel.2011.09.098
16. Jiang LQ, Wang TY, Webster TJ, et al. Intracellular disposition of chitosan nanoparticles in macrophages: intracellular uptake, exocytosis, and intercellular transport. Int J Nanomedicine. 2017;12:6383–6398. doi:10.2147/IJN.S142060
17. Park JK, Utsumi T, Seo YE, et al. Cellular distribution of injected PLGA-nanoparticles in the liver. Nanomedicine. 2016;12(5):1365–1374. doi:10.1016/j.nano.2016.01.013
18. Choi HS, Liu W, Liu F, et al. Design considerations for tumour-targeted nanoparticles. Nat Nanotechnol. 2010;5(1):42–47. doi:10.1038/nnano.2009.314
19. Zhou C, Hao G, Thomas P, et al. Near-infrared emitting radioactive gold nanoparticles with molecular pharmacokinetics. Angewandte Chemie. 2012;51(40):10118–10122. doi:10.1002/anie.201203031
20. Burns AA, Vider J, Ow H, et al. Fluorescent silica nanoparticles with efficient urinary excretion for nanomedicine. Nano Lett. 2009;9(1):442–448. doi:10.1021/nl803405h
21. Krebs NE, Hambidge KM. Zinc metabolism and homeostasis: the application of tracer techniques to human zinc physiology. Biometals. 2001;14(3–4):397–412.
22. Paek HJ, Lee YJ, Chung HE, et al. in vivo. Nanoscale. 2013;5(23):11416–11427. doi:10.1039/c3nr02140h
23. Cho M, Cho WS, Choi M, et al. The impact of size on tissue distribution and elimination by single intravenous injection of silica nanoparticles. Toxicol Lett. 2009;189(3):177–183. doi:10.1016/j.toxlet.2009.04.017
24. Kumar R, Roy I, Ohulchanskky TY, et al. In vivo biodistribution and clearance studies using multimodal organically modified silica nanoparticles. ACS Nano. 2010;4(2):699–708. doi:10.1021/nn901146y
25. Yu M, Zheng J. Clearance pathways and tumor targeting of imaging nanoparticles. ACS Nano. 2015;9(7):6655–6674. doi:10.1021/acsnano.5b01320
26. Mohammad AK, Reineke JJ. Quantitative detection of PLGA nanoparticle degradation in tissues following intravenous administration. Mol Pharm. 2013;10(6):2183–2189. doi:10.1021/mp300559v
27. Woods A, Patel A, Spina D, et al. In vivo biocompatibility, clearance, and biodistribution of albumin vehicles for pulmonary drug delivery. J Control Release. 2015;210:1–9. doi:10.1016/j.jconrel.2015.05.269
28. Zhang Y, Zhu W, Zhang H, et al. Carboxymethyl chitosan/phospholipid bilayer-capped mesoporous carbon nanoparticles with pH-responsive and prolonged release properties for oral delivery of the antitumor drug, Docetaxel. Int J Pharm. 2017;532(1):384–392. doi:10.1016/j.ijpharm.2017.09.023
29. Qi L, Xu Z, Jiang X, Li Y, Wang M. Cytotoxic activities of chitosan nanoparticles and copper-loaded nanoparticles. Bioorg Med Chem Lett. 2005;15(5):1397–1399. doi:10.1016/j.bmcl.2005.01.010
30. Hu YL, Qi W, Han F, Shao JZ, Gao JQ. Toxicity evaluation of biodegradable chitosan nanoparticles using a zebrafish embryo model. Int J Nanomedicine. 2011;6:3351–3359. doi:10.2147/IJN.S25853
31. Calvo P, Remunan-Lopez C, Vila-Jato JL, Alonso MJ. Chitosan and chitosan/ethylene oxide-propylene oxide block copolymer nanoparticles as novel carriers for proteins and vaccines. Pharm Res. 1997;14(10):1431–1436.
32. Jonassen H, Kjoniksen AL, Hiorth M. Stability of chitosan nanoparticles cross-linked with tripolyphosphate. Biomacromolecules. 2012;13(11):3747–3756. doi:10.1021/bm301207a
33. Lopez-Leon T, Carvalho EL, Seijo B, Ortega-Vinuesa JL, Bastos-Gonzalez D. Physicochemical characterization of chitosan nanoparticles: electrokinetic and stability behavior. J Colloid Interface Sci. 2005;283(2):344–351. doi:10.1016/j.jcis.2004.08.186
34. Jiang L, Duan H, Ji X, et al. Application of a simple desolvation method to increase the formation yield, physical stability and hydrophobic drug encapsulation capacity of chitosan-based nanoparticles. Int J Pharm. 2018;545(1–2):117–127. doi:10.1016/j.ijpharm.2018.03.044
35. Shigematsu M, Tomonaga S, Shimokawa F, et al. Regulatory responses of hepatocytes, macrophages and vascular endothelial cells to magnesium deficiency. J Nutr Biochem. 2018;56:35–47. doi:10.1016/j.jnutbio.2018.01.008
36. Li H, Zhuang Q, Wang Y, et al. HBV life cycle is restricted in mouse hepatocytes expressing human NTCP. Cell Mol Immunol. 2014;11(2):175–183. doi:10.1038/cmi.2013.66
37. Bailey TJ, Fossum SL, Fimbel SM, Montgomery JE, Hyde DR. The inhibitor of phagocytosis, O-phospho-L-serine, suppresses Muller glia proliferation and cone cell regeneration in the light-damaged zebrafish retina. Exp Eye Res. 2010;91(5):601–612. doi:10.1016/j.exer.2010.07.017
38. Tait JF, Smith C. Phosphatidylserine receptors: role of CD36 in binding of anionic phospholipid vesicles to monocytic cells. J Biol Chem. 1999;274(5):3048–3054. doi:10.1074/jbc.274.5.3048
39. Antonescu CN, Diaz M, Femia G, Planas JV, Klip A. Clathrin-dependent and independent endocytosis of glucose transporter 4 (GLUT4) in myoblasts: regulation by mitochondrial uncoupling. Traffic. 2008;9(7):1173–1190. doi:10.1111/j.1600-0854.2008.00755.x
40. Chai GH, Hu FQ, Sun J, et al. Transport pathways of solid lipid nanoparticles across Madin-Darby canine kidney epithelial cell monolayer. Mol Pharm. 2014;11(10):3716–3726. doi:10.1021/mp5004674
41. Van Weert AW, Geuze HJ, Groothuis B, Stoorvogel W. Primaquine interferes with membrane recycling from endosomes to the plasma membrane through a direct interaction with endosomes which does not involve neutralisation of endosomal pH nor osmotic swelling of endosomes. Eur J Cell Biol. 2000;79(6):394–399. doi:10.1078/0171-9335-00062
42. Boal F, Guetzoyan L, Sessions RB, et al. LG186: an inhibitor of GBF1 function that causes Golgi disassembly in human and canine cells. Traffic. 2010;11(12):1537–1551. doi:10.1111/j.1600-0854.2010.01122.x
43. Lu Y, Dong S, Hao B, et al. Vacuolin-1 potently and reversibly inhibits autophagosome-lysosome fusion by activating RAB5A. Autophagy. 2014;10(11):1895–1905. doi:10.4161/auto.32200
44. Miao Y, Yan PK, Kim H, Hwang I, Jiang L. Localization of green fluorescent protein fusions with the seven Arabidopsis vacuolar sorting receptors to prevacuolar compartments in tobacco BY-2 cells. Plant Physiol. 2006;142(3):945–962. doi:10.1104/pp.106.083618
45. Jacobs F, Wisse E, De Geest B. The role of liver sinusoidal cells in hepatocyte-directed gene transfer. Am J Pathol. 2010;176(1):14–21. doi:10.2353/ajpath.2010.090136
46. Wisse E, Jacobs F, Topal B, Frederik P, De Geest B. The size of endothelial fenestrae in human liver sinusoids: implications for hepatocyte-directed gene transfer. Gene Ther. 2008;15(17):1193–1199. doi:10.1038/gt.2008.60
47. Vaezifar S, Razavi S, Golozar MA, et al. Effects of some parameters on particle size distribution of chitosan nanoparticles prepared by ionic gelation method. J Clust Sci. 2013;24(3):891–903. doi:10.1007/s10876-013-0583-2
48. Voss EW
49. Hungerford G, Benesch J, Mano JF, Reis RL. Effect of the labelling ratio on the photophysics of fluorescein isothiocyanate (FITC) conjugated to bovine serum albumin. Photochem Photobiol Sci. 2007;6(2):152–158. doi:10.1039/b612870j
50. Heuser JE, Anderson RG. Hypertonic media inhibit receptor-mediated endocytosis by blocking clathrin-coated pit formation. J Cell Biol. 1989;108(2):389–400. doi:10.1083/jcb.108.2.389
51. Stoneham CA, Hollinshead M, Hajitou A. Clathrin-mediated endocytosis and subsequent endo-lysosomal trafficking of adeno-associated virus/phage. J Biol Chem. 2012;287(43):35849–35859. doi:10.1074/jbc.M112.369389
52. Van Weert AW, Dunn KW, Geuze HJ, Maxfield FR, Stoorvogel W. Transport from late endosomes to lysosomes, but not sorting of integral membrane proteins in endosomes, depends on the vacuolar proton pump. J Cell Biol. 1995;130(4):821–834. doi:10.1083/jcb.130.4.821
53. Granger E, Mcnee G, Allan V, Woodman P. The role of the cytoskeleton and molecular motors in endosomal dynamics. Semin Cell Dev Biol. 2014;31:20–29. doi:10.1016/j.semcdb.2014.04.011
54. Delevoye C, Miserey-Lenkei S, Montagnac G, et al. Recycling endosome tubule morphogenesis from sorting endosomes requires the kinesin motor KIF13A. Cell Rep. 2014;6(3):445–454. doi:10.1016/j.celrep.2014.01.002
55. Cole NB, Sciaky N, Marotta A, Song J, Lippincott-Schwartz J. Golgi dispersal during microtubule disruption: regeneration of Golgi stacks at peripheral endoplasmic reticulum exit sites. Mol Biol Cell. 1996;7(4):631–650. doi:10.1091/mbc.7.4.631
56. Fourriere L, Divoux S, Roceri M, Perez F, Boncompain G. Microtubule-independent secretion requires functional maturation of Golgi elements. J Cell Sci. 2016;129(17):3238–3250. doi:10.1242/jcs.188870
57. Van Der Linden L, Van Der Schaar HM, Lanke KH, Neyts J, Van Kuppeveld FJ. Differential effects of the putative GBF1 inhibitors Golgicide A and AG1478 on enterovirus replication. J Virol. 2010;84(15):7535–7542. doi:10.1128/JVI.02684-09
58. Brabec M, Blaas D, Fuchs R. Wortmannin delays transfer of human rhinovirus serotype 2 to late endocytic compartments. Biochem Biophys Res Commun. 2006;348(2):741–749. doi:10.1016/j.bbrc.2006.07.125
59. Fernandez-Borja M, Wubbolts R, Calafat J, et al. Multivesicular body morphogenesis requires phosphatidyl-inositol 3-kinase activity. Curr Biol. 1999;9(1):55–58. doi:10.1016/S0960-9822(99)80048-7
60. Nabi IR, Le PU. Caveolae/raft-dependent endocytosis. J Cell Biol. 2003;161(4):673–677. doi:10.1083/jcb.200302028
61. Matveev S, Li X, Everson W, Smart EJ. The role of caveolae and caveolin in vesicle-dependent and vesicle-independent trafficking. Adv Drug Deliv Rev. 2001;49(3):237–250.
62. Wakabayashi Y, Lippincott-Schwartz J, Arias IM. Intracellular trafficking of bile salt export pump (ABCB11) in polarized hepatic cells: constitutive cycling between the canalicular membrane and rab11-positive endosomes. Mol Biol Cell. 2004;15(7):3485–3496. doi:10.1091/mbc.e03-10-0737
63. Kipp H, Arias IM. Trafficking of canalicular ABC transporters in hepatocytes. Annu Rev Physiol. 2002;64:595–608. doi:10.1146/annurev.physiol.64.081501.155793
64. Esteller A. Physiology of bile secretion. World J Gastroenterol. 2008;14(37):5641–5649. doi:10.3748/wjg.14.5641
65. Souris JS, Lee CH, Cheng SH, et al. Surface charge-mediated rapid hepatobiliary excretion of mesoporous silica nanoparticles. Biomaterials. 2010;31(21):5564–5574. doi:10.1016/j.biomaterials.2010.03.048
66. Wang Y, Du H, Zhai G. Recent advances in active hepatic targeting drug delivery system. Curr Drug Targets. 2014;15(6):573–599.
67. Ogawara K, Yoshida M, Furumoto K, et al. Uptake by hepatocytes and biliary excretion of intravenously administered polystyrene microspheres in rats. J Drug Target. 1999;7(3):213–221. doi:10.3109/10611869909085504
Supplementary materials
Hemolysis assay
The hemolysis test of CsNps was performed to detect the safety of the particles in the animal tests. The red blood cells (RBC) pellets were separated by centrifuging 5 mL rabbit blood at 1,000 rpm for 5 min. The RBC pellets were diluted with 25 mL of normal saline solution. CsNps (50–400 μg/mL) suspended in saline solution (1.5 mL) were added into 1.5 mL of RBC suspension. The samples were incubated at 37 °C. After 3 h the samples were centrifuged at 1,000 rpm for 5 min, and the absorbance of the supernatants were detected at 540 nm. The percentage of hemolysis could be calculated using the following equation.
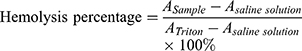
where  is the absorbance of the sample, and
  and
and  are the absorbance of the supernatants of RBC suspensions, which were incubated with Triton (0.1%) and saline solution, respectively.
 © 2019 The Author(s). This work is published and licensed by Dove Medical Press Limited. The full terms of this license are available at https://www.dovepress.com/terms.php and incorporate the Creative Commons Attribution - Non Commercial (unported, v3.0) License.
By accessing the work you hereby accept the Terms. Non-commercial uses of the work are permitted without any further permission from Dove Medical Press Limited, provided the work is properly attributed. For permission for commercial use of this work, please see paragraphs 4.2 and 5 of our Terms.
© 2019 The Author(s). This work is published and licensed by Dove Medical Press Limited. The full terms of this license are available at https://www.dovepress.com/terms.php and incorporate the Creative Commons Attribution - Non Commercial (unported, v3.0) License.
By accessing the work you hereby accept the Terms. Non-commercial uses of the work are permitted without any further permission from Dove Medical Press Limited, provided the work is properly attributed. For permission for commercial use of this work, please see paragraphs 4.2 and 5 of our Terms.