")
Back to Journals » Clinical Interventions in Aging » Volume 9
Can medical insurance coverage reduce disparities of income in elderly patients requiring long-term care? The case of the People’s Republic of China
Authors Zhang Z, Wang J, Jin M, Li M, Zhou L, Jing F, Chen K
Received 5 December 2013
Accepted for publication 20 February 2014
Published 8 May 2014 Volume 2014:9 Pages 771—777
DOI https://doi.org/10.2147/CIA.S58771
Checked for plagiarism Yes
Review by Single anonymous peer review
Peer reviewer comments 3
Zhenyu Zhang,1 Jianbing Wang,1 Mingjuan Jin,1 Mei Li,1 Litao Zhou,2 Fangyuan Jing,1 Kun Chen1
1Department of Epidemiology and Health Statistics, School of Public Health, Zhejiang University, Zhejiang, People’s Republic of China; 2Quality Control Department, Zhejiang Hospital, Zhejiang, People’s Republic of China
Background: The People’s Republic of China’s population is aging rapidly, partly because of the impact of the one-child policy and improvements in the health care system. Caring for bedridden seniors can be a challenge for many families in the People’s Republic of China.
Objective: To identify the inequality of income among different age groups and social statuses, and evaluate the medical burden and health insurance compensation in the People’s Republic of China.
Methods: We measured income inequality and insurance compensation levels among bedridden patients in Zhejiang province, People’s Republic of China. Factor analysis and Gini coefficients were used to evaluate degree of income inequality and insurance compensation level.
Results: We found distinct regional disparities in Zhejiang province, including the aspects of income, expenses, and time. Gini coefficients of older adults with long-term care needs in urban and rural areas were 0.335 and 0.602, respectively. In all age groups, Gini coefficients increased after adjustment for medical expenditures, and the inequality persisted after insurance reimbursement was taken into consideration.
Conclusion: A significant income disparity between rural and urban areas was observed. Inequality increased with age, and medical expenditure is a huge burden for older people with long-term care needs. Health insurance does not play an important role in reducing inequalities among patients who need long-term care services.
Keywords: Gini coefficient, bedridden, long-term care, insurance
Introduction
Population aging has become a challenge in both developed and developing countries.1 The People’s Republic of China has the largest elderly population in the world, which accounts for one fifth of the world’s total aged population. According to the 2010 national census,2 the People’s Republic of China is in a new stage of an aging society, and people older than 60 years of age account for about 13.26% of the total population, with 66.9% of those aged 65 years or older. By 2020, the proportion of people older than 60 years of age is projected to reach 17%. By 2050, the elderly population will increase to 400 million, and nearly one in four Chinese residents will be 80 years of age or older.3 This “gray tsunami” is challenging the country’s care system for senior citizens.
Long-term care mainly concerns individuals with functional limitations such as dementia, hearing loss, eye disorders, osteoarthritis, ischemic heart diseases, and stoke.4 In the People’s Republic of China, the population of disabled elderly (522 million) accounts for 2.95% of senior citizens.2 Nowadays, the People’s Republic of China is facing huge challenges because of the numerous senior citizens who need long-term care services.5 Chinese elders traditionally relied on family members for almost all aspects of elder care. However, the People’s Republic of China’s one-child policy has produced a “4:2:1” family structure (four grandparents, two parents, and one child).6 This raises the question of whether two married children, born in the 1980s without brothers or sisters, could bear the burden of raising one child and caring for both sets of parents when they are 50 years old in the 2030s.7
Health insurance provides financial resources to the health care system and ensures that people have adequate access to public personal health care.8 In the People’s Republic of China, basic health insurance covers specific groups: urban employees under the Urban Employee Basic Medical Insurance Scheme, unemployed urban residents under the Urban Resident Basic Medical Insurance Scheme, and rural residents under the New Rural Cooperative Medical Scheme.9,10 These three schemes function differently in how they are funded and which population they cover. Despite being faced with the heavy burden of an aging society, the People’s Republic of China still does not extend health insurance to long-term care services. In many developed countries, citizens enjoy universal access to a welfare system that ensures assistance for people in need during their lifespans11,12 and insurance programs that cover long-term care services.13
The Gini coefficient is a common index for measuring inequality. If incomes in a population are distributed completely equally, the Gini value is 0, and if they are distributed completely unequally, the Gini value is 1.0.14 The Gini coefficient can also be defined through a Lorenz curve,15,16 which plots the cumulative proportion of the population against cumulative sorted wealth to determine the fairness of income distribution. The Gini coefficient is commonly used to reflect the gap between the wealthy and the poor (GBWP). When the Gini coefficient is below 0.2, the GBWP is in perfect equality, and when the Gini coefficient is over 0.5, the GBWP reflects great income disparity. In general, 0.4 is regarded as the “picket line” of income disparity. If the Gini coefficient is above the “picket line”, polarization of wealthy and poor may easily cause class antagonism and social unrest.
In the People’s Republic of China, rural–urban income differences were greater during the study than when reforms began, with the ratio of average household income per capita in rural areas to that in urban areas being 1 to 3. The uneven distribution of health resources, inadequate government investment in health care, weak government supervision and administration of the health care sector, and marketization of public medical institutions could lead to expensive and unevenly distributed health care.17,18 However, few studies of the inequality among patients with long-term care needs have been conducted in the People’s Republic of China.
The aim of our study was to examine whether inequality among bedridden individuals exists and to identify the determinants of inequality, and also to check whether the insurance reimbursement could reduce this inequality.
Methods
Our data were collected from a cross-sectional survey on the cost of long-term care services for elderly persons conducted from April to May 2012 in Zhejiang, People’s Republic of China. The questionnaire was developed in the Department of Public Health of Zhejiang University and was tested with 30 subjects in a pilot study. Zhejiang province is located in the southern part of the Yangtze River delta on the southeast coast of the People’s Republic of China, and it is renowned for its good living conditions and high-speed economic development. The Human Development Index and Gross Domestic Product in Zhejiang province were 0.841 and US$513 billion, respectively.19 Zhejiang province has a population of 56.14 million, and more than half of the people live in rural areas.
According to economic level and geographical position, multistage, random-cluster sampling was used to select four cities in Zhejiang province,20 including Hangzhou, Ningbo, Wenzhou, and Jinhua. We determined urban and rural areas in each district using a stratified random sampling. Finally, eight areas (one rural county and one urban district in each city) with a total population of 18.2 million were randomly selected for this survey.
Data were collected from 1,100 residents, of whom 800 received home care and 300 received institutional care. The inclusion criteria were as follows: 1) aged 60 years or older; 2) bedridden or having dementia for more than 6 months; 3) able to communicate in Mandarin Chinese with the investigators (either the respondent or his/her caregivers). Respondents or their accompanying persons who could not complete the survey for mental or physical reasons or who refused to participate in this survey were excluded.
Participants were interviewed by local community workers after a brief explanation about the purpose of the study. All respondents gave informed consent. The sociodemographic characteristics (age, sex, place of residence, education level, marital status, living arrangement, source of income), disability status (bedridden, other diseases), care provider’s characteristics (age, sex, time spent on caring every month), purchase/rent of personal hygiene products (wheelchairs, suction devices, nursing beds, diapers, nursing pads, etc), medical care expenditure (out-of-pocket, covered by insurance), cost of caregivers each month, cost of daily supplies, and patients’ economic circumstances (income, source of income, insurance coverage) were obtained. Quality control was conducted by investigators from Zhejiang University.
Statistical analysis
Data were double entered and checked for consistency using EpiData software, version 3.2 (EpiData Association, Odense M, Denmark). Factor analysis was performed to compose an overall index to estimate the level of long-term care services. We used Bartlett’s test of sphericity (BTS) and Kaiser-Meyer-Olkin (KMO) analysis to examine the conditions of factor analysis. Our study was considered to be appropriate for using factor analysis because our dataset met the requirements of BTS <0.05 and KMO >0.6. Factor loadings represent the degree of correlation between the original variables and the factors. We also used varimax rotation with Kaiser normalization to fine tune the model. Then we selected the factors with the highest loading to compose an overall index, and constructed a Lorenz curve to estimate the level of inequity. Gini coefficients, coefficients of variation, and medians were selected to measure the inequality. All statistical analyses were performed using SPSS software, version 20.0 (IBM Corporation, Armonk, NY, USA) and R Software, version 2.15.1 (R Foundation, Vienna, Austria).
Results
We found 991 long-term home-based persons, and 926 agreed to answer the questionnaire. The response rate was 93.44%, and a total of 826 were included in the final analysis, for an effective rate of 83.35%.
Demographic characteristics of the 826 participants are presented in Table 1. More than half (59.9%) were female, 44.2% were currently married, less than 15.5% lived alone, 42.5% graduated from middle school or higher, and 48.3% lived in an urban area. In our study, the mean age was 80.56 years old. Nearly 40% of respondents had a yearly income of less than 5,000 yuan (US $820), while 45% of subjects reported their health care expenditure was more than 3,000 yuan (US $490).
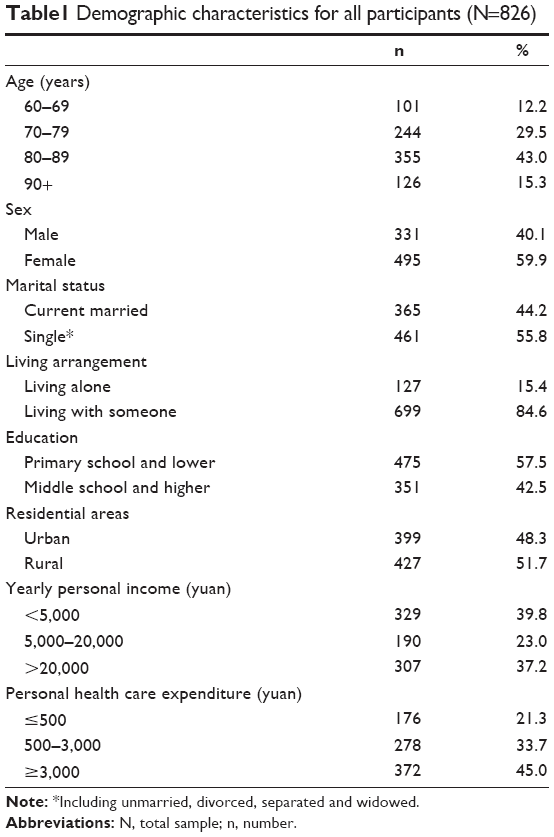 | Table1 Demographic characteristics for all participants (N=826) |
The dataset was suitable for factor analysis, with six caring-related indicators having a KMO index of 0.69 and BTS (χ2=25.02, P<0.05). Using factor analysis, we generated two public factors with a cumulative loading of 84.96%, reflecting that most of the observed indicators in our dataset could be explained by these two factors. Factor one explained 48.57% of the observed variance, named “Income and Expenses”, as it loaded heavily (with factor loadings >0.87) on the items of income, medical expenditure, and living expenditure. Factor two explained 36.39% of the observed variance, named “Time”, as it loaded heavily and exclusively (with factor loadings >0.81) on the items disability duration and care time. According to the factor scores we obtained, the overall care index could be modeled with two main public factors using the following formula: F =48.57% F1 +36.39% F2.
Lorenz curves were drawn using the overall care index and two main factors, which directly indicated inequality in bedridden patients who needed long-term care services (Figure 1). There were significant deviations between the curves and diagonal line, and the “Income and Expenses” factor was closer to the diagonal line than others (Gini coefficient 0.325). The biggest inequality in health care appeared in the overall care index (Gini coefficient 0.419). The Gini coefficient of “Time” was 0.334.
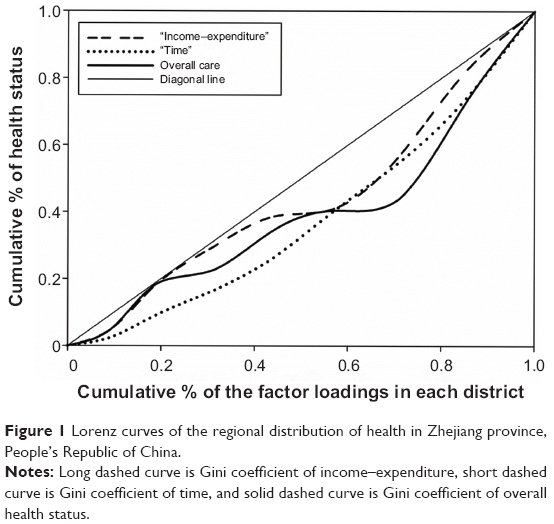 | Figure 1 Lorenz curves of the regional distribution of health in Zhejiang province, People’s Republic of China. |
Stratified by urban and rural areas, the median income of all age groups in urban areas was nearly 2,000 yuan (US $328), while it was less than 110 yuan (US $18) in rural areas. The Gini coefficient of income and medical expenditure increased with age in urban areas (Table 2). Although no similar trends were found in rural areas, the Gini coefficients were all at high levels that were above the international “picket line” of 0.4. Means of living expenses in each age group were similar, but urban patients had nearly three-fold higher average costs than rural patients. Inequalities existed in each age group, on the basis of Gini coefficients and coefficients of variation.
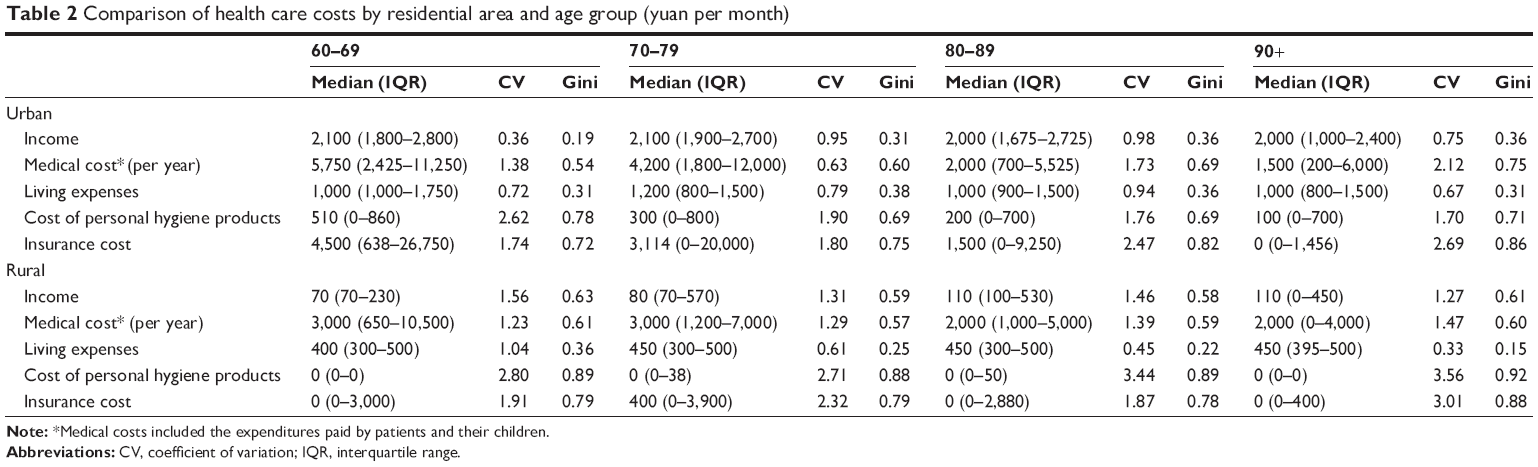 | Table 2 Comparison of health care costs by residential area and age group (yuan per month) |
A significant difference was observed for Gini coefficients of income between urban and rural areas (Table 3), and the Gini coefficient increased with age except for the group aged 60–69 years. We calculated the influence of medical expenditure, insurance compensation, personal hygiene product cost, and living cost on the Gini coefficient of income. The Gini coefficient increased after considering medical expenditure, and the level of inequality also increased after adjusting for insurance reimbursement. The Gini coefficient for cost of personal hygiene product in rural areas was almost two times higher than that in urban areas, and no disparities were observed in all age groups.
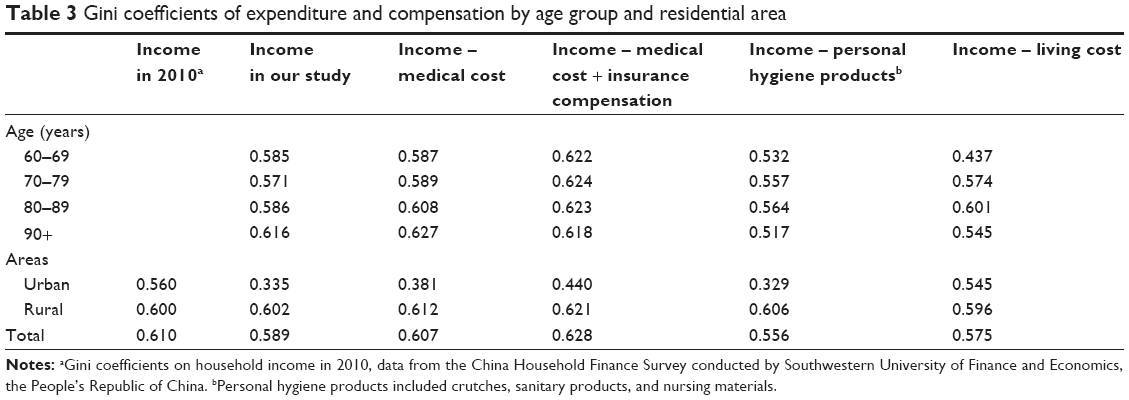 | Table 3 Gini coefficients of expenditure and compensation by age group and residential area |
Discussion
The People’s Republic of China now faces rapid growth in its aging population. The number of patients with partial or total disability reached 33 million in the People’s Republic of China at the end of 2010.21 Therefore, long-term care services for the disabled elderly are particularly important. In this study, we assessed the inequality among the disabled individuals who lived in urban and rural areas in the People’s Republic of China and provided two determinant factors of inequality.
The China Household Finance Survey Report (CHFS study) showed that the Gini coefficient of households in the People’s Republic of China was 0.61 (urban: 0.335, rural: 0.602) in 2010 and that the total income of all households in the eastern provinces was about 2.7 times that of the western and central regions.22 In our study, we selected some composite indexes to estimate regional inequalities among bedridden patients and found significant regional income and medical-expense inequalities in different age groups, with Gini coefficients in urban and rural areas of 0.56 and 0.60, respectively. Reasons for the discrepancy may be: firstly, in our study we included bedridden patients aged 60 years or older, and most patients were retired and supported by pensions or their families. However, participants in the CHFS study included residents of all ages, and most subjects were not retired. Secondly, methods of data collection and Gini coefficient estimation in these two studies were different. In our study we collected income information from all participants, but the corresponding information in the CHFS study was from all included households.
In this study, we found a big income gap between urban and rural areas, suggesting that long-term care for the elders is highly unfair in the aspects of medical care and income. Possible explanations for the phenomenon could be: firstly, in our study, most senior citizens older than 80 years of age had experienced the Great Cultural Revolution, characterized as the stagnation of economic level, which could be one of the reasons for lower income levels in this group. Secondly, the Chinese government offers living allowances of less than US $20 every month to older people. Therefore, in most cases the elderly still rely on their children because they cannot keep a normal life with that amount of living allowance. Thirdly, income differences between rural and urban areas are mainly due to various sources of income. In urban areas, primary income sources include taxable wages and salaries, while land revenue is the main income source in rural areas. Moreover, urban older residents could rely on their retirement benefits while most rural elders can only rely on their children.
In the People’s Republic of China, low-income individuals have limited or no formal health care, and many families were driven into poverty because of high medical expenses.9 About 70% of patients who should be hospitalized were not, because of economic problems. Additionally, 54.5% of hospitalized patients discharged themselves against medical advice because of running out of money.23 According to the Chinese National Health Survey, 10% of the rural population fell below the Government’s poverty line in 1998 after considering the out-of-pocket expenses.24 In this study, we found that Gini coefficients increased after considering the medical expenditures, and a big gap between urban and rural areas was observed. Commercialization of health care has increased costs of medical care,25 which can lead to Chinese patients paying a lot more in out-of-pocket payments than patients in other countries with similar or higher gross domestic products,26 and this is especially true for older adults.27 Medical expenses for bedridden patients increased rapidly at the beginning, but the expenses became stable or showed a downward trend as their conditions gradually became steady. In the People’s Republic of China, some adult children can expect their elderly patients to maintain their current disease status, because most chronic illnesses cannot be cured completely. These reasons may explain why younger bedridden patients spend a lot more money on health care and the Gini coefficient is much higher among senior patients.
The national bureau of statistics reported that the enrollment rate of the New Rural Cooperative Medical Scheme reached 96% in 2010.28 However, health insurance did not eliminate the inequality of individuals with long-term care needs in our study. Similar studies have reported that the current health insurance system provided little benefit for lower-income individuals.29,30 However, other studies have indicated opposite results for the relationship between income-related inequality and insurance coverage.31 Reasons for the discrepancy are as follows: firstly, it is difficult to effectively provide catastrophic insurance coverage for all residents because of insufficient funds, which leads to high out-of-pocket expenses for patients with catastrophic illness. Also, many catastrophic events are not covered under the current programs. Secondly, relatively low reimbursement rates and high deductibles and co-payments may promote overdiagnosis. Therefore, medical bills could increase sharply for some insured patients in the People’s Republic of China. Thirdly, a vulnerable group of rural–urban migrants and their families remain outside of the formal insurance systems. Several studies have documented serious health problems among migrant families, including low immunization rates, high infectious disease rates, occupational health problems, and high maternal mortality. In our study, a number of bedridden patients were moved to the city when their children migrated there to work.
People with poor socioeconomic status are at a disadvantage in accessing better health services.32 The elderly bedridden patients, often considered to be a vulnerable group, should receive more attention and care in their final stages of life. Besides the one-child policy, low fertility rates and smaller family sizes could also weaken the ability of families’ pensions to cover costs. To meet growing demand of medical services, the national government needs to reallocate health resources to long-term care. In many developed countries, governments have set up long-term care insurance systems to comprehensively support the elderly to maintain their normal life, which could alleviate the problems associated with population aging.
This study has several strengths, including focusing on a vulnerable group of bedridden patients and evaluating the insurance reimbursement level using Gini coefficients. However, several limitations need to be considered. First, self-reported data may be subject to recall basis because we collected data from the caregivers for some patients who were unable to communicate normally. Second, we could not get access to the health insurance system to obtain all participants’ medical expenditure and insurance reimbursement records, so we calculated medical expenditure on the basis of the reimbursement ratio. Finally, our sample size was limited for examining stratifications.
Conclusion
Our study found a big inequality between urban and rural areas. This distinct income inequality had an adverse effect on the care quality of bedridden individuals in the People’s Republic of China, and inequality among bedridden patients cannot be reduced by health insurance. Our findings may help to identify bedridden patients’ needs and provide a basis for making policy actions. Further studies are needed to concentrate on how to set up a suitable long-term care insurance system in the People’s Republic of China.
Acknowledgments
We would like to thank Zhejiang Provincial Working Committee on Aging for providing the list of residents’ names. This study was supported by grant 13&ZD163 from the National Social Science Foundation of China.
Disclosure
The authors report no conflicts of interest in this work.
References
Du P, Yang H. Comparative study on population ageing between China and Asian countries. Sociology Study. 2011;1(2):96–100. | ||
National Bureau of Statistics of China [homepage on the Internet]. Communiqué of the National Bureau of Statistics Of the People’s Republic of China on Major Figures of the 2010 Population Census. Available from: http://www.stats.gov.cn/english/NewsEvents/201104/t20110428_26449.html. Accessed April 16, 2014. | ||
Mu GZ, Zhang T. Development trend of China’s aging population and its strategic response. J Huazhong Normal Univ. (Humanities and Social Sciences). 2011;50(5). | ||
Gasior K, Huber M, Lamura G, Lelkes O, Marin B, Rodrigues R, Schmidt A, Zólyomi E. Facts and Figures on Healthy Ageing and Long-term Care: Europe and North America. Rodrigues R, Huber M, Lamura G, editors. Vienna, Austria: European Centre for Social Welfare Policy and Research; 2012. | ||
Feng Z, Liu C, Guan X, Mor V. China’s rapidly aging population creates policy challenges in shaping a viable long-term care system. Health Aff (Millwood). 2012;31(12):2764–2773. | ||
Flaherty JH, Liu ML, Ding L, et al. China: the aging giant. J Am Geriatr Soc. 2007;55(8):1295–1300. | ||
Sun F. Ageing of the population in China: trends and implications. Asia Pac Popul J. 1998;13(4):75–92. | ||
Liu Y. Reforming China’s urban health insurance system. Health Policy. 2002;60(2):133–150. | ||
Yip W, Hsiao WC. The Chinese health system at a crossroads. Health Aff (Millwood). 2008;27(2):460–468. | ||
Ma Y, Zhang L, Chen Q. China’s new cooperative medical scheme for rural residents: popularity of broad coverage poses challenges for costs. Health Aff (Millwood). 2012;31(5):1058–1064. | ||
Ashton T. New Zealand: long-term care in a decade of change. Health Aff (Millwood). 2000;19(3):72–85. | ||
Cuellar AE, Wiener JM. Can social insurance for long-term care work? The experience of Germany. Health Aff (Millwood). 2000;19(3):8–25. | ||
Campbell JC, Ikegami N. Long-term care insurance comes to Japan. Health Aff (Millwood). 2000;19(3):26–39. | ||
Subramanian SV, Kawachi I. Income inequality and health: what have we learned so far? Epidemiol Rev. 2004;26:78–91. | ||
Lorenz MO. Methods of Measuring the Concentration of Wealth. J AM Stat Assoc. 1905;9(70):209–219. | ||
Fellner W, Haley BF, editors. Readings in the Theory of Income Distribution. Vol 3. Richard D. Irwin Inc.; 1951. | ||
Wu XL, Rao KQ. The brief development status of health resources in China since 1980s. Chin Health Econ. 2001;20(11):38–41. | ||
Yu D. [Analysis of the increment of China’s healthcare expenditures]. Chin Health Econ. 2005;24(3):5–7. Chinese. | ||
United Nations Development Programme. Human Development Report 2010. [homepage on the Internet]. New York, NY: United Nations Development Programme; 2010. Available from: http://hdr.undp.org/sites/default/files/reports/270/hdr_2010_en_complete_reprint.pdf. Accessed November, 2010. | ||
Li M, Zhang Y, Zhang Z, Zhang Y, Zhou L, Chen K. Rural-urban differences in the long-term care of the disabled elderly in China. Plos One. 2013;8(11):e79955. | ||
Force CRCoAT. The Situtation of the Disable Elderly in Urban and Rural Areas in China. Disability Reasearch. 2011(2)11–16. | ||
Gan L. China Household Finance Survey Report. Southwest University of Finance and Economics University Press; 2012. | ||
Center for Health Statistics and Information MOH China. Analysis Report of National Health Services Survey in China, 2008. Beijing; 2009. Available from: http://www.nhfpc.gov.cn/cmsresources/mohwsbwstjxxzx/cmsrsdocument/doc9912.pdf. Accessed April 8, 2014. | ||
Liu A, Zhao L, Yu D, Yu W. [Study on malnutrition status and changing trend of children under 5 years old in China]. Wei Sheng Yan Jiu. 2008;37(3):324–326. Chinese. | ||
Ling RE, Liu F, Lu XQ, Wang W. Emerging issues in public health: a perspective on China’s healthcare system. Public Health. 2011;125(1):9–14. | ||
Claeson M, Wang H, Hu S. A Critical Review of Public Health in China. Washington, DC: The World Bank Group; 2004. Available from: http://siteresources.worldbank.org/INTEAPREGTOPHEANUT/Resources/publichealth,09-13-04.pdf. Accessed March 12, 2014. | ||
Yan P. Study on medical expenditure burden of older people in China. Sociology Study. 2011;1(7):505–514. | ||
National Bureau of Statistics of China. China Social Statistical Yearbook. Beijing, People’s Republic of China: China Statistics Press; 2011. | ||
Fang H, Rizzo JA. Does inequality in China affect health differently in high- versus low-income households? Appl Econ. 2012;44(9):1081–1090. | ||
Yui Leung CK. Productivity growth, increasing income inequality and social insurance: the case of China? J Econ Behav Organ. 2001;46(4):395–408. | ||
Liu J, Shi L, Meng Q, Khan MM. Income-related inequality in health insurance coverage: analysis of China Health and Nutrition Survey of 2006 and 2009. Int J Equity Health. 2012;11:42. | ||
Liu GG, Zhao Z, Cai R, Yamada T, Yamada T. Equity in health care access to: assessing the urban health insurance reform in China. Soc Sci Med. 2002;55(10):1779–1794. |
 © 2014 The Author(s). This work is published and licensed by Dove Medical Press Limited. The full terms of this license are available at https://www.dovepress.com/terms.php and incorporate the Creative Commons Attribution - Non Commercial (unported, v3.0) License.
By accessing the work you hereby accept the Terms. Non-commercial uses of the work are permitted without any further permission from Dove Medical Press Limited, provided the work is properly attributed. For permission for commercial use of this work, please see paragraphs 4.2 and 5 of our Terms.
© 2014 The Author(s). This work is published and licensed by Dove Medical Press Limited. The full terms of this license are available at https://www.dovepress.com/terms.php and incorporate the Creative Commons Attribution - Non Commercial (unported, v3.0) License.
By accessing the work you hereby accept the Terms. Non-commercial uses of the work are permitted without any further permission from Dove Medical Press Limited, provided the work is properly attributed. For permission for commercial use of this work, please see paragraphs 4.2 and 5 of our Terms.