")
Back to Journals » International Journal of Nanomedicine » Volume 14
Biocompatibility studies of fluorescent diamond particles-(NV)∼800nm (part V): in vitro kinetics and in vivo localization in rat liver following long-term exposure
Authors Gerstenhaber JA , Marcinkiewicz C, Barone FC , Sternberg M, D’Andrea MR, Lelkes PI , Feuerstein GZ
Received 22 March 2019
Accepted for publication 9 July 2019
Published 12 August 2019 Volume 2019:14 Pages 6451—6464
DOI https://doi.org/10.2147/IJN.S209663
Checked for plagiarism Yes
Review by Single anonymous peer review
Peer reviewer comments 2
Editor who approved publication: Dr Thomas Webster
Jonathan A Gerstenhaber,1,* Cezary Marcinkiewicz,1,2,* Frank C Barone,3 Mark Sternberg,2 Michael R D’Andrea,4 Peter I Lelkes,1 Giora Z Feuerstein2
1Department of Bioengineering, College of Engineering, Temple University, Philadelphia, PA, USA; 2Debina Diagnostic Inc., Newtown Square, PA, USA; 3SUNY Downstate Medical Center, Department of Neurology, Brooklyn, NY, USA; 4Analytical Biological Services Inc., Wilmington, DE, USA
*These authors contributed equally to this work
Background: We recently reported on long-term comprehensive biocompatibility and biodistribution study of fluorescent nanodiamond particles (NV)-Z-average 800nm (FNDP-(NV)) in rats. FNDP-(NV) primary deposition was found in the liver, yet liver function tests remained normal.
Purpose: The present study aimed to gain preliminary insights on discrete localization of FNDP-(NV) in liver cells of the hepatic lobule unit and venous micro-vasculature. Kinetics of FDNP-(NV) uptake into liver cells surrogates in culture was conducted along with cell cytokinesis as markers of cells’ viability.
Methods: Preserved liver specimens from a pilot consisting of two animals which were stained for cytoskeletal elements (fluorescein-isothiocyanate-phalloidin) were examined for distribution of FNDP-(NV) by fluorescent microscopy (FM) and Confocal-FM (CFM) using near infra-red fluorescence (NIR). Hepatocellular carcinoma cells (HepG-2) and human umbilical vein endothelial cells (HUVEC) were cultured with FNDP-(NV) and assayed for particle uptake and location using spectrophotometric technology and microscopy.
Results: HepG-2 and HUVEC displayed rapid (<30 mins) onset and concentration-dependent FNDP-(NV) internalization and formation of peri-nuclear corona. FM/CFM of liver sections revealed FNDP-(NV) presence throughout the hepatic lobules structures marked by spatial distribution, venous microvascular spaces and parenchyma and non-parenchyma cells.
Conclusion: The robust presence of FNDP-(NV) throughout the hepatic lobules including those internalized within parenchyma cells and agglomerates in the liver venous micro-circulation were not associated with macro or micro histopathological signs nor vascular lesions. Cells cultures indicated normal cytokinesis in cells containing FNDP-(NV) agglomerates. Liver parenchyma cells and the liver microcirculation remain agnostic to presence of FNDP-(NV) in the sinusoids or internalized in the hepatic cells.
Keywords: carbon nanoparticles, HepG-2 cells, HUVEC, subcellular distribution, cytokinesis, cellular uptake of nanodiamonds
Introduction
The use of nanomaterials for novel diagnostics and therapeutic purposes is a fast progressing scientific discipline that builds on the bioengineering of biological and pharmaceutical entities in combinations with physical materials.1–4 Recently, we reported on bioengineered fluorescent nanodiamonds particles (FNDP-(NV)) linked to bitistatin (Bit),5 which is a naturally occurring ligand of the platelet fibrinogen receptor (PFR), αIIbβ3 integrin. Since the αIIbβ3 integrin serves as an adhesion receptor that mediates platelet binding to fibrin/fibrinogen in the process of blood clot formation, the construct, FNDP-(NV)-Bit, has the propensity to be incorporated into platelet-rich blood clots. The presence of “color centers” in the FDNP-(NV) allows for the detection of the localized particles by recording near infra-red (NIR) fluorescence induced by an external light source. We established “proof of concept” (POC) in a rodent model ex-vivo, where iatrogenic carotid artery blood clots were successfully visualized following FNDP-(NV)-Bit administration into the rat’s systemic circulation and NIR detected by extra-corporeal whole body imaging using an In Vivo Imaging System (IVIS).6
Our subsequent rodent POC (efficacy) studies raised an important caveat, ie, anatomical considerations suggest that recording NIR from locales within the body pose challenges associated with opacity and auto-fluorescence in an organ- and tissue-dependent manner.7 To optimize NIR signal captured from within the body in a location such as the carotid artery (in humans, 15–20 mm from skin surface), we have selected larger nanodiamond particles: FNDP-(NV)-Z-average~800 nm, a strain of particles that possess superior NIR emission (650~720 nm) over smaller particles of the same strain as well as over the NVN “color center” strain.5,6 Since the particles are expected to “home” to the target (intra-vascular blood clots) shortly after infusion (envisioning the targeted clinical procedure) and considering the rapid clearance of FNDP-(NV) from the circulation (50% clearance from serum within 4 mins),8 likely via rapid uptake by the reticuloendothelial system of the liver,9–12 the loading dose of the FDNP-(NV) could be extensive to afford target imaging.
The likely requirement to administer particles of the size chosen (Z-average~800 nm) directly into the systemic circulation may result in prolonged, if not indefinite, particles' residency within organs due to unlikely excretion routes (urinary system or the hepatobiliary system).8 Such concerns are supported by in vitro studies where extended residency of particles in cells (in culture) suggested interference with biological functions and viability.13–15
Our pilot studies, designed to explore FDNP-(NV) distribution in rat organs upon both short- and long-term exposure,7,8 demonstrated principle deposition of particles in the liver with secondary deposition to the spleen while other organs shared only a minor fraction. Interestingly, the large deposit of FDNP-(NV) in the liver 5 days after exposure remained unchanged in the 14-days and 12-weeks post-exposure studies.7,8
Taken together, the prospect of developing FNDP-(NV)-Bitistatin for the intended imaging of carotid artery blood clots in patients at high risk for Thrombo-Embolic Events (TEE) requires intense evaluation of the biocompatibility of FNDP-(NV), with special focus on liver cells' structure and function.
In our earlier studies, the burden of FNDP-(NV) deposition in whole organs was assessed by IVIS (using NIR as a surrogate biomarker for the presence of the particles), as well as extraction of particles from whole organs and their quantification by photometric quantitation.7,8 However, both techniques fall short of detailing particles location at the hepatic-lobules, the parenchyma (hepatocytes) and non-parenchyma (endothelial) cells, as well as in the micro-venous circulation (sinusoids).
The present investigation on the intra-hepatic topological distribution of FNDP-(NV) was carried out by conventional fluorescent microscopy (FM) and confocal fluorescent microscopy (CFM) of in situ liver slices. To supplement the limited and chronic nature of the in vivo analysis, we included an acute in vitro investigation on the kinetics of FNDP-(NV) uptake into cells, such as human hepatic carcinoma cells (HepG2) and human umbilical vein endothelial cells (HUVEC) commonly used as proxies for hepatocytes and vascular endothelium, respectively. In vitro results supplement in the vivo data to illustrate acute uptake dynamics of liver cells in a controlled environment. The results recapitulated our in vivo findings on the capacity of liver cells to incorporate, retain and distribute FDNP-(NV) within subcellular locations.
Materials and methods
FNDP-(NV)-Z-average~800nm: source and functionalization
FNDP-(NV)-Z-average~800 nm functionalized with carboxyl moieties were purchased from ADAMAS Nanotechnologies (Raleigh, NC, USA). The physical properties of the FNDP-(NV) were determined by dynamic light scattering on a Zetasizer Nano (Malvern) as having an average diameter of 858±47 nm and Z-potential of −56 mV, as reported previously.7,8 Sterile and BSA blocked FNDP-(NV) were used in the cell-based studies.7,8
Liver specimens: source and processing
All specimens have been obtained from animals subject to procedures performed according to the guidelines of the US Animal Welfare Act and approved by the Institutional Animal Care and Use Committee at SUNY Downstate Medical Center, NYC.6 Liver specimens were saved from a long-term (12 weeks) study as previously described.7 Briefly, Sprague-Dawley rats were injected into the femoral vein at 60 mg/Kg of FNDP-(NV) suspension in 2 mL PBS over 2–3 mins. After 12 weeks, the animals were sacrificed by exsanguination while under deep (5% isoflurane) anesthesia, perfused with 10 mL sterile saline to minimize residual blood in the organs’ vasculature and further by perfusion of 4% paraformaldehyde in saline for organ preservation. Organs were carefully dissected, suspended in excess of 10% neutral buffered formaldehyde (10% NBF). Liver specimens were then processed and embedded in paraffin for sectioning into 5 or 50 µm slices for analysis by FM or CFM, respectively. Serial sagittal sections were taken from a single lobe per animal. In each animal, a different lobe was taken to diversify the anatomical landscape. The liver specimens evaluated in this study were discrete and holistic lobes were dissected after whole organ imaging by IVIS, as described previously.7 For histopathology examination, 5-µm sections of liver specimens were stained with Hematoxylin and Eosin (H&E) and Masson’s trichrome by independent histopathology evaluation (see Supplementary materials).
Fluorescence microscopy of preserved liver slices
Rat liver specimens were embedded in paraffin and sectioned at 5 or 50 µm thickness as described previously.7 In brief, slides were de-paraffinized by three consecutive rinses (5 mins each) with xylene (ThermoFisher Scientific, Waltham, MA, USA) followed by two consecutive rinses (10 mins each) of 100%, 95%, 70% and 50% ethanol and two final washes with deionized water. Cellular actin filaments were stained with FITC-phalloidin (ThermoFisher Scientific). Briefly, slides were permeabilized by incubation with 0.4% Triton X-100 in PBS on ice for 10 mins. The slides were then washed 3 times with PBS at room temperature and immersed in FITC-phalloidin (6 µM in PBS) for 1 hr. The slides were washed three times with PBS and mounted with mounting buffer containing DAPI (Vectashield, Vector Labs Burlingame CA, USA) to stain nuclei. The 5-µm thick slices were analyzed in a fluorescence microscopy (Olympus IX81, Olympus, Tokyo, Japan) using 10x and 40x (oil immersion) objectives. The green fluorescence filter set was used to detect the FITC-phalloidin-stained microfilaments, the red fluorescent filter to was used to detect FNDP-(NV) and the blue fluorescent filters to detect DAPI-stained cell nuclei.
Total panoramic views of sagittal sections of the liver were constructed by “stitching” 4x images using an FSX100 microscopy (Olympus Tokyo Japan). 50 µm sections were stained with FITC-phalloidin for visualization of actin filaments imaged in the green channel, and sections were imaged in the red channel for visualization of FNDP-(NV). Images were collected digitally and further processed with ImageJ 1.51e (NIH, Bethesda MD, USA). In order to improve visualization of FNDP-(NV), which were only a few pixels in size at the ultra-low magnification, particles were magnified by thresholding the red channel using the Maximum Entropy method and dilating the result three times.
FNDP-(NV) presence in cells after thresholding, but not dilating, was also quantified using the Analyze Particles function in ImageJ. Groups of FNDP-(NV), detected as a single continuous mass (agglomerate) at 4x, were counted and sized. The size distribution by number histogram was constructed to demonstrate the distribution of FNDP-(NV) agglomeration sizes detected within the micrographs, where line height corresponds to the portion of particles detected by diameter. As large numbers of small agglomerations can account for a small number of total particle mass, size distribution by number can be considered biased to magnify the prevalence of small particle sizes. To reduce this bias, a second histogram of the size distribution by cross-section area was also constructed where line height correlates with portion of total NIR fluorescing area.
Confocal fluorescent microscopy
Confocal images of liver slices (10–50 µm) were taken using an FV1000 scanning confocal microscopy (Olympus, Tokyo, Japan) and imaged in Fluoview software (v4.2.2.9 Olympus) using a 60x oil immersion objective. For 3D reconstruction, confocal stacks were taken with an image every 0.5 µm through the thickness of the tissue. Nuclei were visualized by DAPI staining with a 405-nm excitation and 425–460-nm emission; the actin cytoskeleton was visualized by FITC-phalloidin with a 488-nm excitation and 400–500-nm emission. The NIR fluorescence emitted from FNDP-(NV) was visualized with an excitation of 543 nm and an emission of 655–755 nm. 2D maximum intensity projection and cross-sectional views were prepared in Fluoview. Three-dimensional views were reconstructed in ImageJ via the Volume Viewer plugin (v2.0, KU Barthel).
Kinetics of FNDP-(NV) uptake into cultured HUVEC and HepG-2 cells
The HepG-2 (human liver hepatocellular carcinoma) cell line was purchased from American Type Culture Collection (ATTC) (Manassas, VA, USA) and cultured in Eagle’s Minimum Essential Medium (EMEM, ThermoFisher Scientific) containing 10% fetal bovine serum (FBS). Primary human umbilical vein endothelial cells (HUVEC) were purchased from Lonza (Basel, Switzerland) and cultured in EGM-2 MV media. HUVEC were used for experiments in passages 5–8. Uptake of FNDP-(NV) by either cell line was performed according to previously published protocols16,17 with some modifications, as illustrated in Figure 1. Briefly, cells were seeded into 2 96-well plates (2 x 10⁴ cells per well), and allowed to grow to 90% confluence. Media was removed from one plate (background control) and 100 µL of 4% paraformaldehyde (PFA) in PBS was added to fix the cells. The control plate was then incubated for 20 mins at room temperature and washed 3 times with cell culture media. Subsequently, media was removed from each well in both plates (fixed control and live sample), replaced with 100 µL of media containing FNDP-(NV) at 0.025, 0.05 and 0.1 mg/mL as indicated, and allowed to incubate for 0.5–20 hrs. Both plates were washed 3 times with Hanks’ balanced salt solution (HBSS, ThermoFisher, and Waltham, MA, USA) containing calcium and magnesium to remove excess particles. Cells were then lysed by addition of 100 µL of 0.5% Triton X-100 and overnight incubation at room temperature on orbital shaker. Plates were read using spectrophotometer (Infinite M200 Pro, Tecan AG, Männedorf, Switzerland) for FNDP-(NV)-associated NIR signal (excitation 570 nm, emission 670 nm). Fluorescence obtained from FNDP-(NV) attached to the control plate with PFA fixed cells was deducted from fluorescence measured from live (active) cells.
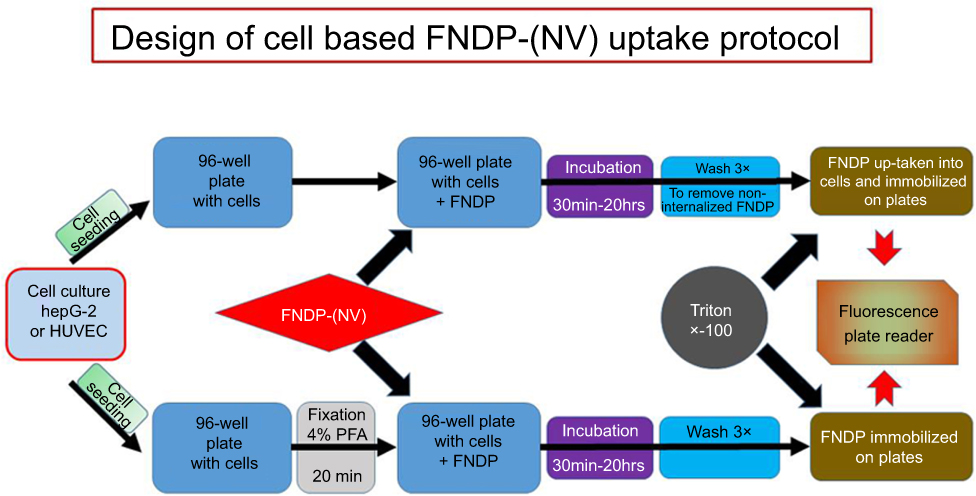 |
Figure 1 Schematic presentation of method used for quantification of FNDP-(NV) uptake into cells. Abbreviations: FNDP-(NV), fluorescence nanodiamond particles (NV); HepG-2, liver hepatocellular carcinoma; HUVEC, human umbilical vein endothelial cell; PFA, paraformaldehyde. |
Fluorescence microscopy analysis of FNDP-(NV) uptake by HUVEC and HepG-2 cells in culture
Cells were grown in 8-well chambers slides (ThermoFisher) up to 70% confluence. Cells were treated with FNDP-(NV) at 0.05 mg/mL, incubated for 2 or 20 hrs and fixed in 4% PFA as described above. Following cell fixation and permeabilization, cells were stained with FITC-Phalloidin as described above. Chambers were removed from the slide, and mounting was completed using buffer containing DAPI (Vectashield) and cover glass affixed by nail polish. Slides were then analyzed on the FM Olympus IX81 at 10x or 40x, using the green, red and blue filter cubes as described in FM of preserved liver slices.
Statistical analyses
Data are presented as mean ± SD. Statistical analyses were done by ANOVA (where appropriate) and Student’s t-test using SigmaPlot software (SigmaPlot® 12 SPSS; Systat Software Inc., San Jose CA, USA). Statistical significance was established at P<0.05 for the number of independent studies performed.
Results
Fluorescence microscopic (FM) and panoramic analysis of preserved liver slices
Figure 2 illustrates the distribution of FNDP-(NV) within a 5-µm slice of liver tissue imaged at 160x and 400x magnifications. Two representative regions have been selected; one (Figure 2A) where vascular elements are present, second (Figure 2B) an area of parenchyma cells only. The upper panels represent tissue obtained from animals 12 weeks after intravenous (i.v.) administration of FNDP-(NV) and the lower panel from a vehicle (PBS) control animal. FNDP-(NV) (imaged in red) can be visualized over the DAPI counter stain in the right panel as identified by white arrows. Large agglomerations of 5–10 µm are clearly noted, as well as particles of very small size. To assess distribution within or between cells, the sections were stained with FITC-phalloidin as shown in the left panels. The corresponding yellow (red-over-green) can be visualized for larger aggregates, indicating possibility of particle endocytosis (left panels (Figure 2A and B)). In Figure 2A, red fluorescence of very small aggregates can be spotted in proximity of nuclei that possibly represent portal vein (PV) endothelium but most are distributed in the parenchyma where it is rather difficult to discern venous space from parenchyma cells location.
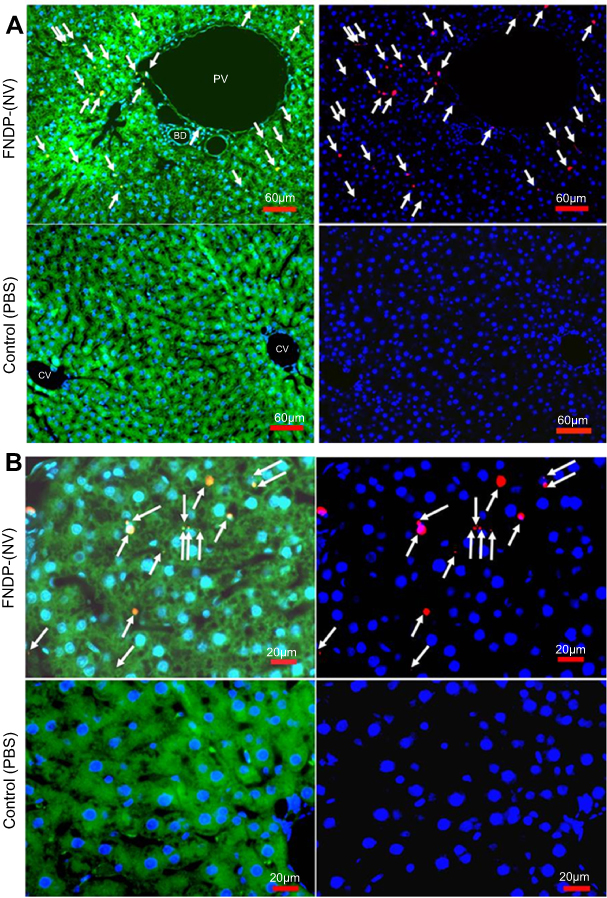 |
Figure 2 Fluorescence microscopy images of paraffin sections (5 µm) of liver obtained from rats treated or not with FNDP-(NV). Notes: (A) Images of tissue sections analyzed with 10x objective with 1.6x extension. (B) Images of tissue sections analyzed with oil 40x objective. Left images show overlapped three colors: red (FNDP-(NV)), blue (DAPI-nuclei), green (phalloidin –cytoskeleton). Right images accordingly show overlapped two colors: red (FNDP-(NV)), blue (DAPI-nuclei). Upper images in each panel represent FNDP-(NV)-treated rats, lower images in each panel control (PBS-treated rats). Areas occupied by the particles are indicated by white arrows.Abbreviations: FNDP-(NV), fluorescence nanodiamond particles with NV active centers; PBS, phosphate-buffered saline; FITC, fluorescein isothiocyanate; DAPI, 4ʹ,6-diamidino-2-phenylindole; PV, portal vein; CV, central vein; BD, bile duct. |
Figure 3 presents an analysis at multiple magnifications of a complete sagittal section from 2 different FNDP-(NV) treated rats. Due to the very low effective magnification of the “stitched” image, the red channel, sensitive to the NIR fluorescence of FNDP-(NV), has been magnified by binary thresholding and dilating as indicated in methods. This allows qualitative visualization of even single pixel FNDP-(NV). Figure 3A and B depicts particles scattered across the complete “panoramic landscape” yet with apparent differential densities in their distribution within the core hepatic lobule unit. For ease of visualization, a select number of hepatic lobules are indicated by “hexagons”. Particles can also be easily spotted in the venous system (yellow boxes). A magnified view, suitable for visualization without enhancement, of a set of four hepatic lobules (region indicated by blue-dotted rectangle in Figure 3B), is presented in Figure 3C, which illustrates apparent heterogeneity of particle distribution within the hepatic lobule. A higher magnification of a single lobule (yellow hexagon from Figure 3A) is presented in Figure 3D. To enhance visualization, a higher magnification of one representative lobule from each animal (as indicated by yellow hexagon in Figure 3A and B) is presented in Figure 3E and F. After thresholding and dilating, better illustration of the uneven distribution of particles across the “hexagon” formation of the hepatic lobule is easily noticed. Particle presence appears enriched at the “hexagonal” periphery (for landmarks, red arrows mark central veins), though some particles are clearly present even beside the central vein. Figure 3G and H depicts venous systems (yellow squares in Figure 3A) with large aggregation of particles (white arrow) that are attached to the wall but protrudes significantly into the vessel lumen (visualized by the yellow-red transition) accounting for 35% and 48% of the vessel cross-sectional areas in the 2 examples, respectively. Figure 3I provides a scheme of the general orientation of the structure of the hepatic lobule including the primary metabolic zones.
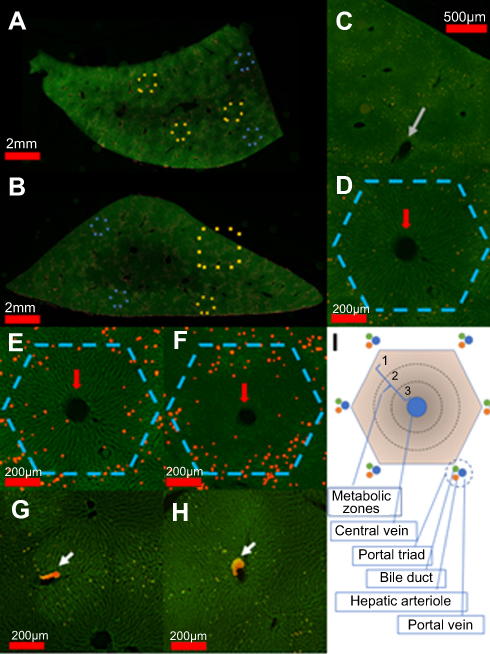 |
Figure 3 “Panoramic” images of hepatic lobes demonstrate intra-lobule heterogeneity of particles distribution. Notes: (A, B) Total panoramic view of a sagittal section from representative hepatic lobes from two animals. Figures were constructed by “stitching” 4x images using FSX100 microscopy. Phalloidin-stained sections (5 µm) are imaged in the green channel, and presence of FNDP-(NV) imaged in the red channel. Particles in the image have been magnified by thresholding and repeated dilations for visualization at very low resolution. Hexagons are overlaid in the figure to indicate example hepatic lobules. Areas indicated in gold are magnified in other panels. (C) Four liver lobules (area indicated by yellow square in B) demonstrating preferential particle distribution at the boundaries of the “hexagonal” lobules format. (D) 10x image of a single hepatic lobule showing preferential FNDP-(NV) deposition. Large FNDP-(NV) aggregates are seen distributed non-uniformly. Hepatic lobule is indicated by dashed hexagon. (E, F) 10x image of a single hepatic lobule after thresholding and dilating to improve visibility of very small aggregates, to demonstrate zonal deposition. (G, H) Magnified images of areas of vasculature from panel (A) indicated by gold dashed square. (I) Schematic illustration of hepatic lobule that demarcates the various metabolic zones.Abbreviation: FNDP-(NV), fluorescence nanodiamond particles with NV active centers. |
The size of FNDP-NV positive regions in the liver “panoramic” view is highly variable as indicated above. To quantify this distribution, a histogram of FNDP-NV positive regions is presented in Figure 4. The distribution of the regions by number in Figure 4A demonstrates large numbers of FNDP-NV positive areas from a single pixel, up to an area of 20 µm in diameter. Although few, hardly visible in Figure 4A, large agglomerates (Figure 3G and H) would represent a disproportionate mass of total particles detected in the liver section. To represent the percent of total particle mass, the distribution of the total FNDP-(NV) positive area is presented in Figure 4B. By area, the modal diameter of particle agglomeration is roughly 14 µm. In one animal, large agglomerations 40–100 µm in diameter can be found in the venous system that accounts for as much as 20% of the FNDP-(NV) positive area, though agglomerates of this size were not found in the second animal.
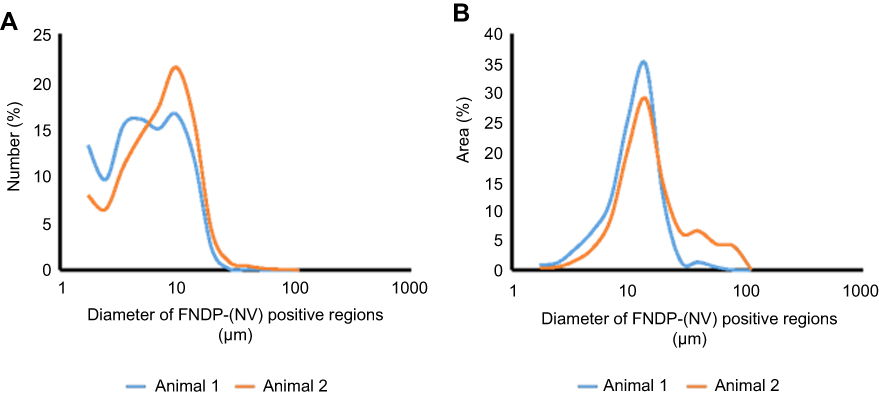 |
Figure 4 Size distribution of FNDP-(NV) aggregates in liver lobules. Notes: Figures of one entirely liver lobule from two animals were stitched from 10x images on an FSX100 microscopy. Stitched figures were thresholded using Maximum Entropy criteria in ImageJ and the resulting detected FNDP-(NV) assemblies were sized and counted. (A) Distribution of FNDP-(NV) assembly sizes; (B) distribution of total particle mass estimated by the area of each assembly.Abbreviation: FNDP-(NV), fluorescence nanodiamond particles with NV active centers. |
Confocal fluorescent microscopy of preserved liver slices
Figure 5 presents four different topographical segments studied by CFM on liver sections (10–50 µm). In Figure 5A, several peri-nuclear particles' agglomerates of about 5–10 µm are visible (yellow circles and arrows), yet definite intra-cellular location cannot be established. Figure 5B presents intercellular spaces likely representing portal sinusoid of which some contain large agglomerates of FNDP-(NV) at 10–30 µm (yellow circles and arrows). The intense red coloring suggests location sufficiently remote from the internal milieu of the parenchyma cells (stained green), though some yellow, indicating potential for at least partial internalization, is present as well. Figure 5C and D presents several non-parenchyma structures (surrounded by parenchyma cells) such as venous, arterial, portal vein and likely a bile duct. In Figure 5C and D, several small particle agglomerates (white circles) are located in the sub-endothelial zone of the vessel intima while some agglomerates residing inside parenchymal cell (yellow circles) are also noted.
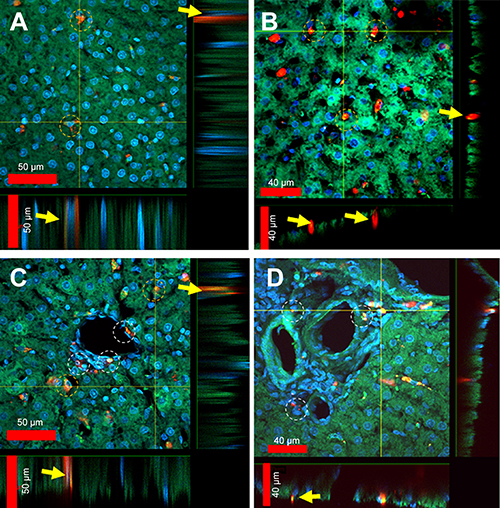 |
Figure 5 Laser scanning confocal microscopy images of liver section sections (50 µm) obtained from rats treated with FNDP-(NV). Notes: (A) Parenchymal area of liver with indicated cells in yellow circles with up-taken particles. Inserts on the bottom and on the right of the photo represent vertical projection of images performed along the yellow lines. Yellow arrows indicate location of particles. (B) Parenchymal area of liver where yellow circles suggest aggregates of particles within liver sinusoids/venues. Inserts on the bottom and on the right represent vertical projection of images performed along the yellow lines. Yellow arrows indicate particles localized in sinusoids/venules. (C) Area of abundantly vascularized segment of the hepatic lobule where white circles particles suggest sub-endothelial and adventitial location of particles. Parenchymal cells with supposedly internalized particles are indicated in yellow circles. Inserts on the bottom and on the right represent vertical projection of images performed along the yellow lines. Yellow arrows indicate particles internalized in parenchymal cells. (D) Area of the liver hilum where white circles indicate particles associated with adventitial cellular elements. Inserts on the bottom and on the right represent vertical projection of images performed along the yellow lines. Yellow arrows indicate internalized particles into the vascular cells.Abbreviation: FNDP-(NV), fluorescence nanodiamond particles with NV active centers. |
Figure 6 illustrates confocal 3D reconstruction of hepatocytes with differing amount of incorporated FNDP-(NV). Two areas are presented which differ in the mass of particles; the cells in the center panel acquired few while the cells in the right panel appear to have been amassed very large particles agglomerates. The left panel represents the vehicle-treated rats; no particles have been identified there. In all of the examples provided, the nucleus and nucleoli of these cells present same and normal phenotype.
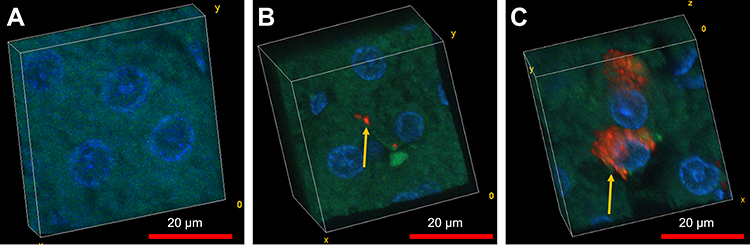 |
Figure 6 Confocal 3D reconstruction of hepatocytes with differing amount of incorporated FNDP-(NV). Notes: (A-C) Confocal image stacks from 50 μm sections stained with DAPI (blue) and phalloidin (green) with incorporated nanodiamonds (red). Image stacks were taken on a Fluoview F1000 confocal microscopy and reconstructed using volume viewer in ImageJ. Particles' inclusion within these cells (indicated by yellow arrow) includes both sparse and dense FNDP-(NV) collections internalized in the cells. Left panel represents vehicle control. Middle panel represents low load particle and right panel represents high load particle in 2 separate cells.Abbreviations: FNDP-(NV), fluorescence nanodiamond particles with NV active centers; DAPI, 4ʹ,6-diamidino-2-phenylindole. |
Kinetics of FNDP-(NV) uptake into cultured HUVEC and HepG-2 cells
Figure 7 depicts the kinetics of FNDP-(NV) uptake into HUVEC and HEPG-2 cells under various concentrations and time course conditions. Figure 7A and C represent the time course at three different exposure levels of FNDP-(NV). Each of the exposed dose demonstrated same pattern of rapid uptake of particles into the cell body. The rapid uptake phase is attenuated within 1–2 hrs reaching a plateau proportional to the amount of FNDP-(NV) exposure. Figure 7D represents the quantitative accumulation of FNDP-(NV) monitored by NIR fluorescence for each of the cell lines at the three concentrations of FNDP-(NV). The difference in total accumulated FNDP-(NV) is statistically significant between exposure levels, but is similar between cell lines.
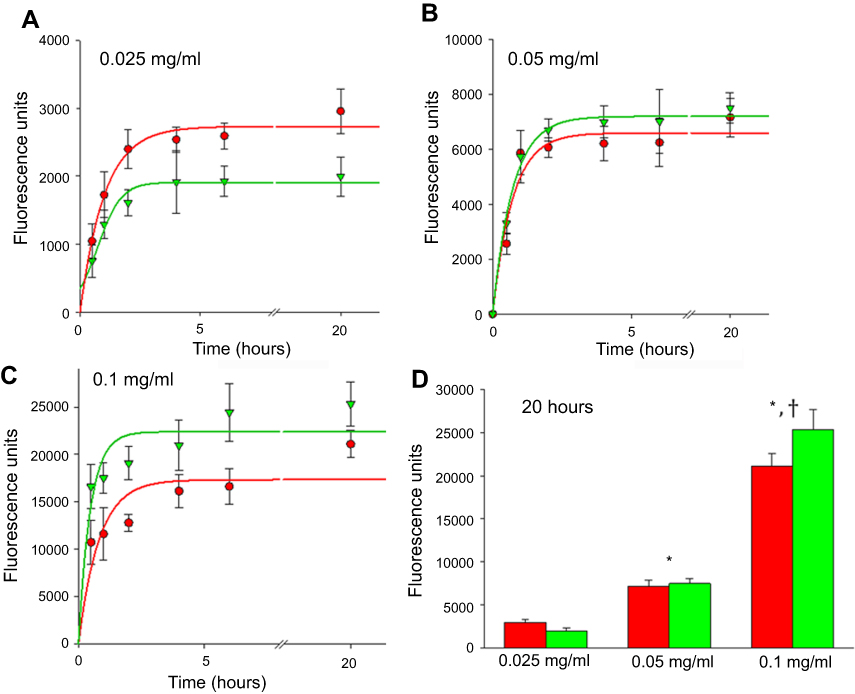 |
Figure 7 Internalization of different concentrations of FNDP-(NV) into HepG-2 and HUVEC cells over time. Notes: (A–C) Dose- and time-dependent uptake of FNDP by HepG-2 cells (red) and HUVEC (green) exposed to various concentrations of FNDP-(NV). Exponential curves were fitted for all three doses (high-dose 0.1 mg/mL; medium-dose 0.05 mg/mL, low-dose 0.025 mg/mL) of particles. (D) Total uptake of FNDP after 20 hrs by HepG-2 cells and HUVEC exposed to various concentrations of FNDP. Error bars for all panels represent SD from quadruplicated samples. (*) P<0.001 compared to 0.025 mg/mL by two-tailed Student’s t-test; (†) P<0.001 compared to 0.05 mg/mL by two-tailed Student’s t-test.Abbreviations: FNDP-(NV), fluorescence nanodiamond particles with NV active centers; HepG-2, liver hepatocellular carcinoma; HUVEC, human umbilical vein endothelial cell; SD, standard deviation. |
Figure 8A and B is FM micrograph of FNDP-(NV) accumulation at an early and late stage of the in vitro experiment. The early phases (up to 2 hrs) demonstrate particles largely in the cytoplasm while the terminal time point (20 hrs) reveals heavy agglomeration in the form of a peri-nuclear corona. Such a pattern was also documented in the preserved liver slices (12 weeks post exposure), as seen in Figure 6C.
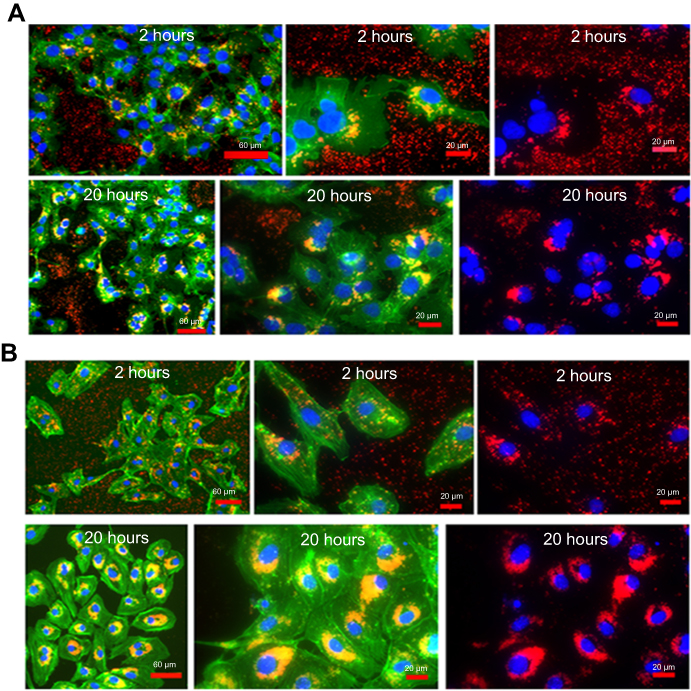 |
Figure 8 Fluorescence microscopy of images of HepG-2 cell and HUVEC obtained after 2 and 20 hours incubation with FNDP-(NV). Notes: Images of HepG-2 cells (A) and HUVEC (B) obtained from fluorescence microscopy analysis using 160x and 400x magnification after 2 or 20 hrs of exposure to FNDP-(NV). Images of 160x magnification are presented in overlapped three colors fluorescence (green – FITC-phalloidin, red – FNDP-(NV), blue – DAPI). Images of 400x magnification are presented in overlapped three colors fluorescence (green, red, blue) (left panels), and two colors fluorescence (red and blue) (right panels). Abbreviations: FNDP-(NV), fluorescence nanodiamond particles with NV active centers; HepG-2, liver hepatocellular carcinoma; HUVEC, human umbilical vein endothelial cell; FITC, fluorescein isothiocyanate; DAPI, 4ʹ,6-diamidino-2-phenylindole. |
The images of HUVEC in the early mitosis through the end of cytokinesis are presented in Figure 9A for cells treated with FNDP-(NV) for 20 hrs, and in Figure 9B for untreated, control cells. All treated cells display heavy peri-nuclear FNDP-(NV) accumulation, including in late-stage cytokinesis and cell separation. Similar observation has been made in the control group.
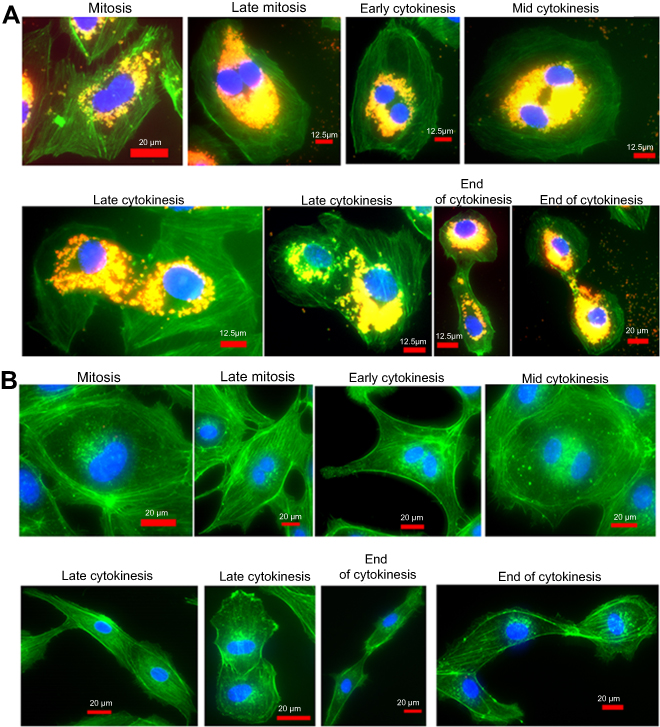 |
Figure 9 Images representing various stages of HUVEC division in the presence of FNDP-(NV). Notes: HUVEC were treated (A) or not (B) in the culture with 0.05 mg/mL of FNDP-(NV) for 20 hrs. Images of 400x or 640x magnifications are presented in overlapped three colors fluorescence (green – FITC-phalloidin, red – FNDP-(NV), blue – DAPI). Titles of the various phases noted are visual images of the predicted cell replication mechanism.Abbreviations: FNDP-(NV), fluorescence nanodiamond particles with NV active centers; HepG-2, liver hepatocellular carcinoma; HUVEC, human umbilical vein endothelial cell; FITC, fluorescein isothiocyanate; DAPI, 4ʹ,6-diamidino-2-phenylindole. |
Discussion
The present study is a direct extension of our recently published reports on the safety, tolerability, biodistribution, pharmacokinetics and biocompatibility of FNDP-(NV)-Z-average~800 nm (FNDP-(NV) in rats.7,8 In these studies, we have characterized the gross distribution of a high dose (60 mg/Kg) of FNDP-(NV) infused to intact rats and followed their dispositions acutely (90 min), sub-acute (5 or 14 days) and long term (12 weeks) post FNDP-(NV) exposure. Analysis of particle distribution across 6 organs (liver, spleen, lung, kidney, heart and brain) confirmed the liver as the primary repository organ for these particles. Organ histology evaluation7,8 did not reveal any FNDP-(NV)-related gross or histopathology adverse effects. The lack of adverse effects related to FNDP-(NV) is in accord with reported normal liver function tests.7,8 In this context, our recent reports are in line with similar findings of other studies conducted with various nanodiamonds particles.18–20 However, none of the published reports examined particles of similar strain, size, dose, long-term post-exposure, nor did any of these studies provide a detailed analysis of cellular and sub-cellular depositions under similar conditions.
As mentioned, the persistence of large numbers of FNDP-(NV) particles in the liver must raise concerns about potential negative impacts, especially in the context of long-term residency, possibly indefinite presence. Such a prospect might raise regulatory hurdles and potentially impact the GLP (Good Laboratory Practice) pre-clinical development for human use. While the aforementioned certified pathology report confirmed the lack of histopathological findings, the methods used in our previous studies did not provide sufficient information on the more discrete distribution of FNDP-(NV) in the hepatic lobules, the micro-circulation and cellular internalization by parenchymal and non-parenchymal cells.
In the present investigation, we aimed to address distribution of FNDP-(NV) within the liver in both a pilot in-vivo analysis as well as in a proxy cell culture model in anticipation of expanded studies in future GLP preclinical development. This included analysis of the distribution of FNDP-(NV) in the liver, including intra-cellular location in hepatocytes and the localization of FNDP-(NV) within the microvascular system of the hepatic lobule. We also explore the kinetics of FNDP-(NV) particle uptake into cultured liver cells and their intracellular distribution using surrogate (proxy) cell cultures such as HUVEC (endothelium) and HepG-2 (human liver carcinoma) cells.
Pilot analysis of whole-lobe cross-sections from animals revealed a unique pattern of spatial distribution of FNDP-(NV) in the hepatic lobules, including parenchymal cells (hepatocytes), non-parenchymal cells (vascular endothelium and adventitia cells) and the venous supply (portal vein) and drainage (central vein) system. At a cellular level, we have also demonstrated the intracellular uptake and compartmentalization of FNDP-(NV) in liver cells both in vivo and in vitro. We have also affirmed the preservation of normal macro and micro morphological phenotypes of liver cells including cells with large coronas of particles in the peri-nuclear space, and the preservation of viable cytokinesis processes, from late mitosis to completion of cytokinesis to cell replication including cells with extensive peri-nuclear coronas.
The distribution of FNDP-(NV) across the complete “panoramic” display (Figure 3A and B) revealed a repetitive pattern prevalent in the hepatic “hexagonal” lobules at large (see Figure 3D–F). Particle aggregates were more prevalent at the periphery of the hepatic lobule, surrounding the “portal triads” (PT), yet rather scarce in regions more proximal in the vicinity of the CV. While the mechanism(s) for such distribution are currently not clear, we speculate that this kind of spatial distribution of FNDP-(NV) across the hepatic lobule could be the result of several converging factors.
First, FNDP-(NV) delivery via the PVs often presented aggregated particles at sizes that could barely fit the sinusoid diameter or even exceed it. As shown in Figure 4A, 30–40% of the detected FNDP-(NV) agglomerates were in excess of 7 µm, making them prone to mechanical capture at the more proximal part of the sinusoids.21 While this does not account for the majority of FNDP-(NV)-positive regions by number, these particles account for 75–85% of the total FNDP-(NV)-positive area (Figure 4B), which may account for the strong fluorescence bias within the lobule, despite the significant number of smaller aggregates (individual or limited replicates) which could travel further down the sinusoid, transverse the sinusoids and recycle into the systemic circulation. The presence of small particles at the entry port of the sinusoid into the central vein (CV) supports this possibility (see Figure 3D and G).
Second, Kupffer cells that serve the scavenging function of the liver (the Reticulo-Endothelial System, RES) are abundant in the sinusoids22 and more so at the proximal zone of the sinusoids exiting from the PV.23 These macrophage-like cells rapidly scavenge particles with preferential kinetics for the larger over smaller particles, which in the case of the FNDP-(NV) will augment their deposition more proximal to the PV over the CV zone, as demonstrated by our data.
Third, the terminal zone of the sinusoid/venule is reportedly more “spacious” than the port of exit of the sinusoid from the PV.21,23,24 Such anatomy could support hemodynamic conditions, which facilitate clearance of particles into the CV, and further down into the systemic circulation, thereby contributing to the relative paucity of particles in vicinity of the CV.
Fourth, the venous microcirculatory system is a critical element in securing the hepatic lobule’s most delicate biochemical functions. Our data clearly indicate the presence of large particle aggregates in the PV and possibly CV along with enhanced presence in the outer circumference of the hepatic lobules (peri PT), and scant but notable small particles throughout the lobule (see Figure 3E). Particles within these spaces could interfere with the delicate balance of blood flow in the sinusoids, causing hemodynamic disturbances (eg, turbulence flow) and congestions that obstructs the flow. Disruption of flow could bear on oxygen delivery as well as distribution of nutrients to the parenchymal cells, thereby negatively affecting synthetic and catabolic functions of the liver.25–27 While we cannot directly rule out micro-hemodynamic disturbances in the sinusoids, we wish to point out that our detailed histological analysis (Supplementary Materials) failed to observe areas of blood congestions (due to partial blood flow blockage), thrombosis (due to stasis) or ischemic consequences at a microscopic level, as previously reported.7
Nevertheless, the topographical inhomogeneity of FNDP-(NV) distribution could still carry physiological implications by virtue of particles mass or size, intra-cellular location localization and micro-hemodynamics factors not yet matured (at the time of the study termination) to manifest aberrant consequences on the anatomy and physiology of the hepatic unit at large. The peripheral zone of the hepatic lobules, where larger aggregates of particles were most prevalent (see zone 1 in Figure 3I), is the locale for many important and critical biochemical and cell survival functions in the liver (eg, fatty acid oxidation, gluconeogenesis, bile production, xenobiotics metabolism and regenerative cell replenishment28–30). Exploration of whether or not some of these functions have been modified in the presence of FNDP-(NV) is beyond the scope of this study. Future studies, using proper biochemical and molecular techniques, will be required to address these issues. At this point, we conclude that no histopathological markers of aberrant morphology or liver functions were identified.
Support for the likely preservation of liver morphology at the micro-environment is presented in Figure 6A and B. The topological survey across the panoramic field of the whole liver surface suggests that percent of particles and the area that they occupy are only a small (or moderate) fraction of the total. Since the data presented in this manuscript evaluated a situation generated 12 weeks earlier, acute post FNDP-(NV) exposure cannot be rejected.
Lastly, we included cell culture studies to gain insights on the direct interactions of liver cells with FNDP-(NV) in an isolated system to explore the kinetic of particle internalization, compartmentalization and viability of cytokinesis capability in the presence of particles. The two different cell types, used as surrogate for the respective human hepatocytes17 and endothelial cells,31 have already been utilized in studying cellular uptake of nanoparticles.32,33 However, none of the previous studies reported results derived from the same cell types and particle strain, in respect to size, kinetics and physiological cytokinesis preservation (Figure 9). Our data (Figure 8) indicated rapid initial uptake of FNDP-(NV) into the cells in time- and concentration-dependent, manner. This in vitro study supports the in vivo observations of intracellular uptake of FNDP-(NV) into non-scavenging liver cells (hepatocytes).
Summary
In this work, we studied the interactions of FNDP-(NV)-Z-800 nm with liver cells in vitro and in vivo. The motivation for our study originates in the well-established data pointing the liver as a major repository of FNDP-(NV) with prolonged (if not permanent) hepatic retention. Our studies addressed the scale and extent of FNDP-(NV) deposition in terms of their cellular and sub-cellular resolution, their presence in parenchymal and non-parenchymal cells, as well as in the micro-circulation. Pilot in vivo data were complemented by studies conducted in vitro (HUVEC, HepG-2 cells), where direct kinetic studies of particle uptake and assembly in these surrogate liver cells supported the results obtained from whole animal exposure study. Taken together, our data strongly suggest liver bio-compatibility of the FNDP-(NV), as no aberrant consequences could be identified in terms of preservation of cellular phenotypes, cytoskeletal, nuclear structure, as well as unabated cytokinesis and cell replication. We conclude that FNDP-(NV) could potentially be well tolerated by humans exposed FNDP-(NV) by intravenous route of exposure.
Acknowledgment
This study was supported in part by Debina Diagnostics Inc.
Disclosure
The authors report no conflicts of interest in this work.
References
1. van der Laan KJ, Hasani M, Zheng T, Schirhagl R. Nanodiamonds for in vivo applications. Small. 2018;14(19):e1703838. doi:10.1002/smll.v14.19
2. Torelli MD, Rickard AG, Backer MV, et al. Targeting fluorescent nanodiamonds to vascular endothelial growth factor receptors in tumor. Bioconjug Chem. 2019. (in press). doi:10.1021/acs.bioconjchem.8b00803
3. Ho D, Wang CH, Chow EK. Nanodiamonds: the intersection of nanotechnology, drug development, and personalized medicine. Sci Adv. 2015;1(7):e1500439. doi:10.1126/sciadv.1500439
4. Perevedentseva E, Lin YC, Jani M, Cheng CL. Biomedical applications of nanodiamonds in imaging and therapy. Nanomedicine (Lond). 2013;8(12):2041–2060. doi:10.2217/nnm.13.183
5. Marcinkiewicz C, Gerstenhaber JA, Sternberg M, Lelkes PI, Feuerstein GZ. Bitistatin-functionalized fluorescent nanodiamond particles specifically bind to purified human platelet integrin receptor αIIbβ3 and activated platelets. Int J Nanomedicine. 2017;12:8471–8482. doi:10.2147/IJN.S134128
6. Gerstenhaber JA, Barone FC, Marcinkiewicz C, et al. Vascular thrombus imaging in vivo via near-infrared fluorescent nanodiamond particles bioengineered with the disintegrin bitistatin (part II). Int J Nanomedicine. 2017;12:8471–8482. doi:10.2147/IJN.S146946
7. Barone FC, Marcinkiewicz C, Li J, et al. Long-term bio-compatibility of fluorescent diamonds-(NV)-Z~800nm in rats: survival, morbidity, histopathology and particles distribution and excretion studies (part IV). Int J Nanomedicine. 2019;14:1163–1175. doi:10.2147/IJN.S198376
8. Barone FC, Marcinkiewicz CM, Li J, et al. Pilot study on biocompatibility of fluorescent nanodiamond-(NV)-Z~800 particles in rats: safety, pharmacokinetics, and bio-distribution (part III). Int J Nanomedicine. 2018;13:5449–5468. doi:10.2147/IJN.S171117
9. Zhang YN, Poon W, Tavares AJ, McGilvray ID, Chan WCW. Nanodiamond–liver interaction: cellular and hepatobiliary elimination. J Control Release. 2016;240:332–348. doi:10.1016/j.jconrel.2016.01.020
10. Moore L, Yang J, Lan TT, et al. Biocompatibility assessment of detonation nanodiamond in non-human primates and rats using histological, hematologic, and urine analysis. ACS Nano. 2016;10(8):7385–7400. doi:10.1021/acsnano.6b00839
11. Jiao M, Zhang P, Meng J, et al. Recent advancements in biocompatible inorganic nanoparticles towards biomedical applications. Biomater Sci. 2018;6(4):726–745. doi:10.1039/c8bm00675j
12. Pombo García K, Zarschler K, Barbaro L, et al. Zwitterionic-coated “stealth” nanoparticles for biomedical applications: recent advances in countering biomolecular corona formation and uptake by the mononuclear phagocyte system. Small. 2014;9:2516–2529. doi:10.1002/smll.201303540
13. Su LJ, Wu MS, Hui YY, et al. Fluorescent nanodiamonds enable quantitative tracking of human mesenchymal stem cells in miniature pigs. Sci Rep. 2017;7:45607. doi:10.1038/srep45607
14. Hsiao WW, Hui YY, Tsai PC, Chang HC. Fluorescent nanodiamond: a versatile tool for long-term cell tracking, super-resolution imaging, and nanoscale temperature sensing. Acc Chem Res. 2016;49(3):400–407. doi:10.1021/acs.accounts.5b00484
15. Brož A, Bačáková L, Štenclová P, Kromka A, Potocký Š. Uptake and intracellular accumulation of diamond nanoparticles – a metabolic and cytotoxic study. Beilstein J Nanotechnol. 2017;8:1649–1657. doi:10.3762/bjnano.8.165
16. Barua S, Yoo JW, Kolhar P, Wakankar A, Gokarn YR, Mitragotri S. Particle shape enhances specificity of antibody-displaying nanoparticles. Proc Natl Acad Sci U S A. 2013;110(9):3270–3275. doi:10.1073/pnas.1216893110
17. Zhang B, Feng X, Yin H, et al. Anchored but not internalized: shape dependent endocytosis of nano diamonds. Sci Rep. 2017;7:46462. doi:10.1038/srep46462
18. Rojas S, Gispert JD, Martín R, et al. Biodistribution of amino-functionalized diamond nanoparticles. In vivo studies based on 18F radionuclide emission. ACS Nano. 2011;5(7):5552–5559. doi:10.1021/nn202666w
19. Purtov K, Petunin A, Inzhevatkin E, et al. Biodistribution of different sized nanodiamonds in mice. J Nanosci Nanotechnol. 2015;15(2):1070–1075. doi:10.1166/jnn.2015.9746
20. Tsoi KM, MacParland SA, Ma XZ, et al. Mechanism of hard-nanomaterial clearance by the liver. Nat Mater. 2016;15(11):1212–1221. doi:10.1038/nmat4718
21. Vollmar B, Menger MD. The hepatic microcirculation: mechanistic contributions and therapeutic targets in liver injury and repair. Physiol Rev. 2009;89:1269–1339.
22. Cha JY, Kim DH, Chun KH. The role of hepatic macrophages in nonalcoholic fatty liver disease and nonalcoholic steatohepatitis. Lab Anim Res. 2018;34(4):133–139. doi:10.5625/lar.2018.34.4.133
23. Soto-Gutierrez A, Gough A, Vernetti LA, Taylor DL, Monga SP. Pre-clinical and clinical investigations of metabolic zonation in liver diseases: the potential of microphysiology systems. Exp Biol Med (Maywood). 2017;242(16):1605–1616. doi:10.1177/1535370217707731
24. Yoon YJ, Chang S, Kim OY, et al. Three-dimensional imaging of hepatic sinusoids in mice using synchrotron radiation micro-computed tomography. PLoS One. 2013;7(7):e68600. doi:10.1371/journal.pone.0068600
25. Lee-Montiel FT, George SM, Gough AH, et al. Control of oxygen tension recapitulates zone-specific functions in human liver microphysiology systems. Exp Biol Med (Maywood). 2017;242(16):1617–1632. doi:10.1177/1535370217703978
26. Fu X, Sluka JP, Clendenon SG, et al. Modeling of xenobiotic transport and metabolism in virtual hepatic lobule models. PLoS One. 2018;13(9):e0198060. doi:10.1371/journal.pone.0198060
27. Gebhardt R. Metabolic zonation of the liver: regulation and implications for liver function. Pharmac Ther. 1992;53:275–354. doi:10.1016/0163-7258(92)90055-5
28. Kang LI, Mars WM, Michalopoulos GK. Signals and cells involved in regulating liver regeneration. Cells. 2012;1(4):1261–1292. doi:10.3390/cells1041261
29. Katz NR, Fischer W, Giffhorn S. Distribution of enzymes of fatty acid and ketone body metabolism in periportal and perivenous rat-liver tissue. Eur J Biochem. 1983;135:103–107. doi:10.1111/ejb.1983.135.issue-1
30. Torre C, Perret C, Colnot S. Transcription dynamics in a physiological process: β-catenin signaling directs liver metabolic zonation. Int J Biochem Cell Biol. 2011;43(2):271–278. doi:10.1016/j.biocel.2010.11.015
31. Solarska-Ściuk K, Gajewska A, Glińska S, et al. Intracellular transport of nanodiamond particles in human endothelial and epithelial cells. Chem Biol Interact. 2014;219:90–100. doi:10.1016/j.cbi.2014.05.013
32. Schrand AM, Lin JB, Hens SC, Hussain SM. Temporal and mechanistic tracking of cellular uptake dynamics with novel surface fluorophore-bound nanodiamonds. Nanoscale. 2011;3(2):435–445. doi:10.1039/c0nr00408a
33. Schleicher J, Dahmen U, Guthke R, Schuster S. Zonation of hepatic fat accumulation: insights from mathematical modelling of nutrient gradients and fatty acid uptake. J R Soc Interface. 2017;133:20170443. doi:10.1098/rsif.2017.0443
 © 2019 The Author(s). This work is published and licensed by Dove Medical Press Limited. The full terms of this license are available at https://www.dovepress.com/terms.php and incorporate the Creative Commons Attribution - Non Commercial (unported, v3.0) License.
By accessing the work you hereby accept the Terms. Non-commercial uses of the work are permitted without any further permission from Dove Medical Press Limited, provided the work is properly attributed. For permission for commercial use of this work, please see paragraphs 4.2 and 5 of our Terms.
© 2019 The Author(s). This work is published and licensed by Dove Medical Press Limited. The full terms of this license are available at https://www.dovepress.com/terms.php and incorporate the Creative Commons Attribution - Non Commercial (unported, v3.0) License.
By accessing the work you hereby accept the Terms. Non-commercial uses of the work are permitted without any further permission from Dove Medical Press Limited, provided the work is properly attributed. For permission for commercial use of this work, please see paragraphs 4.2 and 5 of our Terms.