")
Back to Journals » Clinical Interventions in Aging » Volume 11
BFH-OST, a new predictive screening tool for identifying osteoporosis in postmenopausal Han Chinese women
Authors Ma Z, YANG Y, Lin J, Zhang X , Meng Q, WANG B, Fei Q
Received 3 March 2016
Accepted for publication 15 May 2016
Published 4 August 2016 Volume 2016:11 Pages 1051—1059
DOI https://doi.org/10.2147/CIA.S107675
Checked for plagiarism Yes
Review by Single anonymous peer review
Peer reviewer comments 3
Editor who approved publication: Dr Zhi-Ying Wu
Zhao Ma, Yong Yang,* JiSheng Lin, XiaoDong Zhang, Qian Meng, BingQiang Wang, Qi Fei*
Department of Orthopedics, Beijing Friendship Hospital, Capital Medical University, Beijing, People’s Republic of China
*These authors contributed equally to this work
Purpose: To develop a simple new clinical screening tool to identify primary osteoporosis by dual-energy X-ray absorptiometry (DXA) in postmenopausal women and to compare its validity with the Osteoporosis Self-Assessment Tool for Asians (OSTA) in a Han Chinese population.
Methods: A cross-sectional study was conducted, enrolling 1,721 community-dwelling postmenopausal Han Chinese women. All the subjects completed a structured questionnaire and had their bone mineral density measured using DXA. Using logistic regression analysis, we assessed the ability of numerous potential risk factors examined in the questionnaire to identify women with osteoporosis. Based on this analysis, we build a new predictive model, the Beijing Friendship Hospital Osteoporosis Self-Assessment Tool (BFH-OST). Receiver operating characteristic curves were generated to compare the validity of the new model and OSTA in identifying postmenopausal women at increased risk of primary osteoporosis as defined according to the World Health Organization criteria.
Results: At screening, it was found that of the 1,721 subjects with DXA, 22.66% had osteoporosis and a further 47.36% had osteopenia. Of the items screened in the questionnaire, it was found that age, weight, height, body mass index, personal history of fracture after the age of 45 years, history of fragility fracture in either parent, current smoking, and consumption of three of more alcoholic drinks per day were all predictive of osteoporosis. However, age at menarche and menopause, years since menopause, and number of pregnancies and live births were irrelevant in this study. The logistic regression analysis and item reduction yielded a final tool (BFH-OST) based on age, body weight, height, and history of fracture after the age of 45 years. The BFH-OST index (cutoff =9.1), which performed better than OSTA, had a sensitivity of 73.6% and a specificity of 72.7% for identifying osteoporosis, with an area under the receiver operating characteristic curve of 0.797.
Conclusion: BFH-OST may be a powerful and cost-effective new clinical risk assessment tool for prescreening postmenopausal women at increased risk for osteoporosis by DXA, especially for Han Chinese women.
Keywords: women, osteoporosis, osteoporosis screening tool, validation
Introduction
Effective and early therapy for osteoporosis can reduce the risk of primary fragility fractures by approximately half.1–3 However, once a patient develops osteoporosis, it is nearly impossible to completely restore bone strength, since the loss of bone microarchitecture mass becomes irreversible.4 Currently, the diagnosis of primary osteoporosis without fragility fracture is based on bone mineral density (BMD) measurement by dual-energy X-ray absorptiometry (DXA). Osteoporosis is defined by the World Health Organization (WHO) criteria as having BMD values at any site 2.5 standard deviations or more below normal values for healthy young individuals.5 According to the National Osteoporosis Foundation (NOF) guidelines, patients should accept pharmacologic treatment when they have T-scores ≤−2.5 in the femoral neck, hip, or lumbar spine as measured by DXA.6 BMD values can be measured conveniently and noninvasively by DXA, though not all physicians have access to this equipment. Due to the high price of DXA equipment, this service is not widely available in most developing countries, including the People’s Republic of China, where only major hospitals have the equipment. DXA examinations are also time consuming. The cost of DXA and lack of instruments may limit its widespread use in some communities; hence, complementary approaches are required in developing prescreening tools to better identify patients at risk for primary osteoporosis and to help decide whether patients need a further DXA examination.
Therefore, it is essential to find a better osteoporosis detection methodology for use in the People’s Republic of China. Multiple organizations have developed evidence-based osteoporosis screening recommendations, such as the Osteoporosis Self-Assessment Tool for Asians (OSTA), fracture risk assessment tool and weight-based criterion,7 but the rationale used to create these recommendations is based largely on indirect evidence. Furthermore, these recommendations do not reflect the variation in fracture probability for the Chinese population and therefore must not be viewed as the “gold standard” but rather as a tool to enhance patient assessment.8 Among these tools, OSTA is a free and effective method for identifying subjects at increased risk of osteoporosis, and the population used to develop this screening test included Chinese women. Its use could facilitate appropriate and more cost-effective use of bone densitometry in developing countries.9 OSTA has performed well and has been found to be cost-effective for Asians in many studies.10–12 However, some studies reported poor results when validating OSTA’s effectiveness in identifying postmenopausal osteoporosis in a Chinese cohort.13,14 Thus, we were motivated to develop a new screening tool for postmenopausal Chinese women to assess the risk of DXA-determined primary osteoporosis and chose OSTA as a comparison.
This study aimed to develop a new prediction model for DXA-determined primary osteoporosis, and to compare its performance with that of OSTA in identifying patients at increased risk of primary osteoporosis by DXA in a population of healthy Chinese women.
Methods
Study population
We conducted a cross-sectional study, recruiting consecutive subjects from communities in downtown Beijing. The study population included healthy postmenopausal Chinese women who came for health examinations at the osteoporosis clinic in Beijing Friendship Hospital from March 2011 to September 2014 without interruption. The inclusion and exclusion criteria are presented in Table 1. Subjects with painful fragility fracture and abnormal biochemistry, including tests for renal and liver function, as well as serum levels of phosphate, total alkaline phosphatase, calcium, and thyroid-stimulating hormone, were also excluded. The subjects had never been diagnosed with primary or secondary osteoporosis, had never been treated for osteoporosis, and were without any recent painful bone symptoms. All the subjects provided written informed consent. The study was approved by the Ethics Committee of Beijing Friendship Hospital, Capital Medical University.
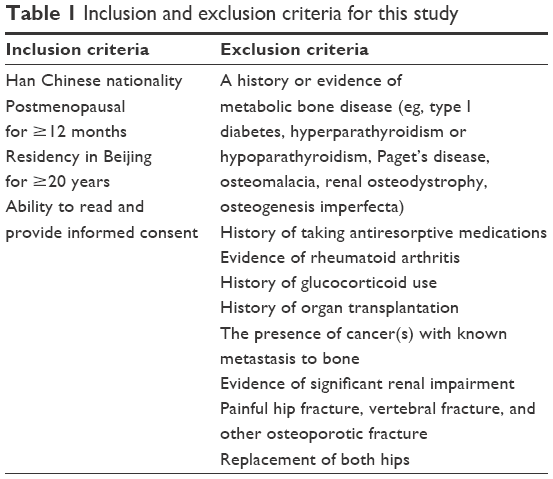 | Table 1 Inclusion and exclusion criteria for this study |
BMD measurements and data obtained via questionnaire
All the women came to the osteoporosis clinic in Beijing Friendship Hospital for DXA BMD measurements of the hip and spine, and were required to fill in a questionnaire, aided by a trained interviewer. The subjects provided information regarding demographic variables and clinical risk factors for osteoporosis using a structured table, and potential risk factors used in the questionnaire were identified from previous publications. These factors included age, weight, height, body mass index (BMI), personal history of fracture after the age of 45 years, history of fragility fracture in either parent, current smoking, consumption of three of more alcoholic drinks per day, age at menarche and menopause, years since menopause, and number of pregnancies and live births.9,15,16 History of fracture means any fracture after the age of 45 years with or without low-energy trauma history. Height was measured using a stadiometer, and weight was measured using an electronic balance scale (accuracy, 0.1 kg) without shoes.
The left femoral neck and the lumbar spine (L1–L4) BMDs were measured using the Hologic Discovery QDR Wi densitometer (Hologic Inc., Bedford, MA, USA). The in vivo short-term reproducibility values were all <1% for all measurements of the lumbar spine, femoral neck, and total hip BMDs. The mean values from young Chinese women were used to calculate the T-scores: L1–L4 BMD 0.967±0.11 g/cm2, femoral neck 0.803±0.10 g/cm2, and total hip BMD 0.864±0.11 g/cm2. All DXA measurements were performed by an experienced technician.
According to the WHO and NOF diagnostic classifications, osteoporosis is defined arbitrarily to be present when any T-score (lumbar spine, femoral neck, or total hip) is ≥2.5 standard deviations below the average for young adults.5,6
OSTA score
OSTA was calculated based on age and body weight, using the following formula: [Body weight (kg) – age (years)] ×0.29.
The decimal digits were then disregarded, as described in the original report.9 For example, a 60-year-old woman whose body weight was 51 kg would have an OSTA index of: (51–60) ×0.2=−1.8. The decimal digit (0.8) was then disregarded, and the OSTA index was equal to the integer −1.
Statistical analysis
Each risk factor was evaluated as a predictor in univariate analysis. Statistically significant variables were included in the multivariate models. All statistical tests were two-sided. The statistical model was constructed by using logistic regression analysis, using SPSS 19.0 (SPSS Inc., Chicago, IL, USA). The regression coefficients for age and body weight were stratified by increments of 10 years and 10 kg, respectively, because the BMDs differed significantly between strata. Smoking was answered “yes” or “no” based on whether the subject currently smoked. Alcohol consumption was scored “yes” if the subject consumed three or more drinks of alcohol daily. A drink of alcohol varies slightly in different countries from 8 to 10 g of alcohol. This is equivalent to a standard glass of beer (285 mL), a single measure of spirits (30 mL), a medium-sized glass of wine (120 mL), or 1 measure of an aperitif (60 mL). Statistical weights used in calculating the index were based on the regression coefficient for body mass (per 10 kg). Values were then multiplied by two and rounded off to yield integers. To calculate the index for each person, the statistical weight for each variable was multiplied by the patient’s response (no =0, yes =1) and added to the total.
The validity of the new model and OSTA for identifying osteoporosis was evaluated through receiver operating characteristic (ROC) curve analysis, which plots sensitivity against (1 – specificity). The predictive value of the tools was determined according to the area under the ROC curve (AUC) as follows: non-predictive (AUC <0.5), less predictive (0.5< AUC <0.7), moderately predictive (0.7< AUC <0.9), highly predictive (0.9< AUC <1), and perfect prediction (AUC =1).17,18 AUC values >0.75 are generally considered to represent good performance.17,18 The ROC curve was constructed, and AUC and its 95% confidence interval (95% CI) were estimated using MedCalc v11.5.0.0 software (MedCalc Software, Ostend, Belgium). A P-value <0.05 was considered statistically significant.
Construction of the final model
The final multivariate regression model included the following variables: age, weight, height, BMI, parent history of fractured hip, current smoking, consumption of three or more drinks/day of alcohol, and history of fracture after the age of 45 years. The regression coefficient and standard error for each variable are shown in Table 2, along with the index weights, which were calculated as described in the “Methods” section. The final model variables were used to calculate a single value (risk index) for each person by adding the index weights for each variable, eg, 1 point would be subtracted if the person had fracture after the age of 45 years. For age and weight, the coefficients correspond to increases of 10 years and 10 kg, respectively. Age (per 10 years) was multiplied by the index weight of −5, and the number was truncated to one digit by dropping the last digit before adding to the index. For example, if the person was 70 years old, [70/10×(−5)]=−35 would be added to the index. The same process was applied to body weight and height.
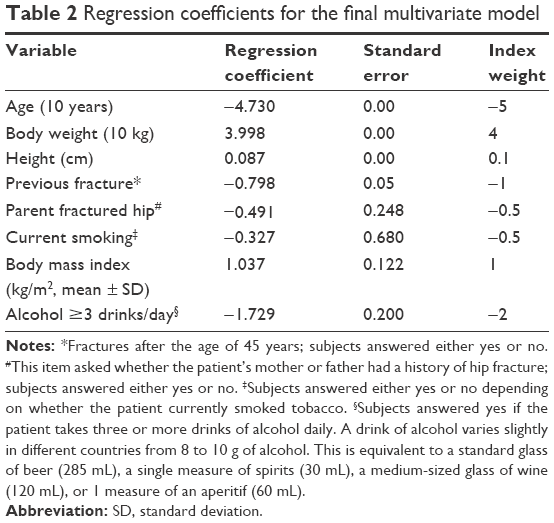 | Table 2 Regression coefficients for the final multivariate model |
Excluding parental history of a fractured hip, current smoking, BMI, and alcohol consumption ≥3 drinks/day yielded a model containing only age, weight, height, and history of previous fracture. Women with higher index values tended to have higher BMD at both the hip and spine. The best cutoff index value was 9.1, which giving both high sensitivity and specificity. This value was chosen by optimizing sensitivity and specificity together in a single curve, as shown in Figure 1. The new model has been named the Beijing Friendship Hospital Osteoporosis Self-Assessment Tool (BFH-OST).
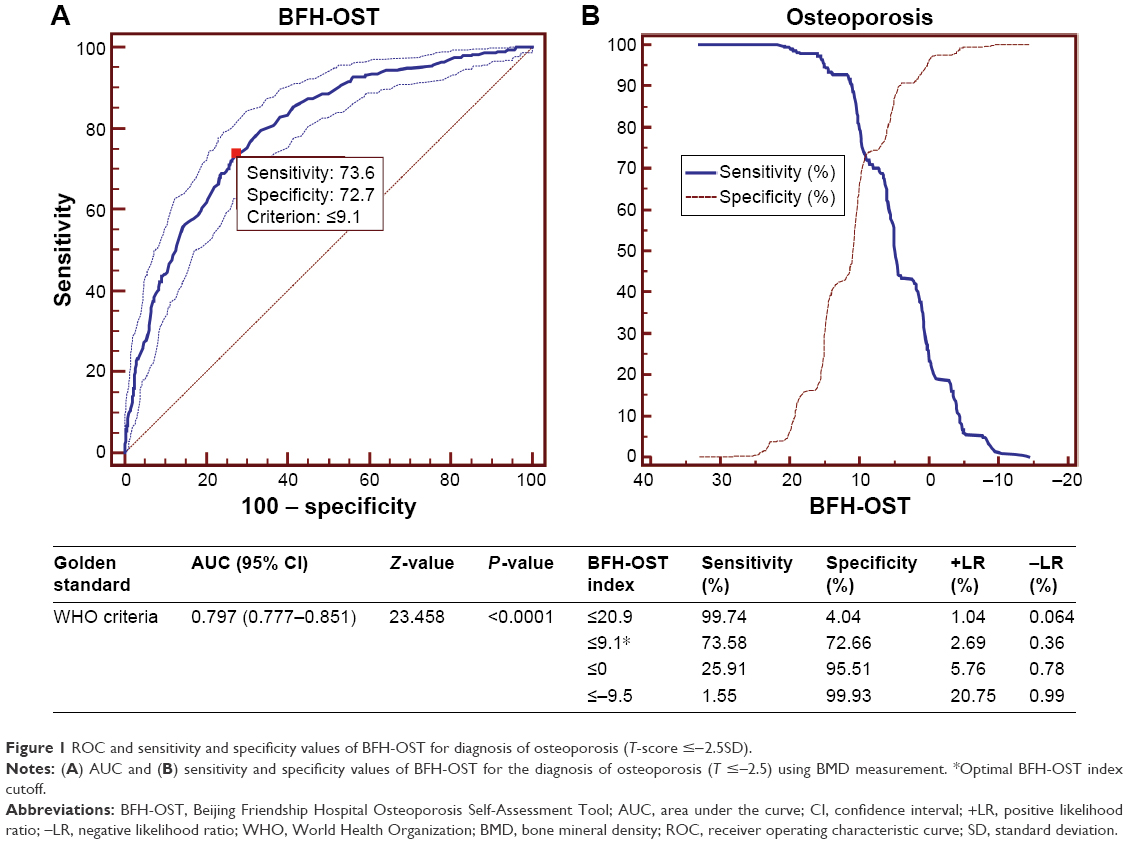 | Figure 1 ROC and sensitivity and specificity values of BFH-OST for diagnosis of osteoporosis (T-score ≤−2.5SD). |
Results
Study population
A total of 2,602 potentially eligible postmenopausal healthy women in Beijing were considered for participation in this study. Patients with a history of having taken antiresorptive medications or glucocorticoids, evidence of rheumatoid arthritis, a history or evidence of metabolic bone disease, or a painful hip fracture were excluded. More detailed exclusion criteria are shown in Table 1. A total of 881 subjects were excluded, leaving a total of 1,721 individuals eligible for the analysis. All the eligible participants were postmenopausal for more than 12 months, had resided in Beijing for more than 20 years, and had the ability to read and provide informed consent. Participant characteristics are shown in Table 3. The prevalence of osteopenia (47.36%) and osteoporosis (22.66%) were both high in the studied population.
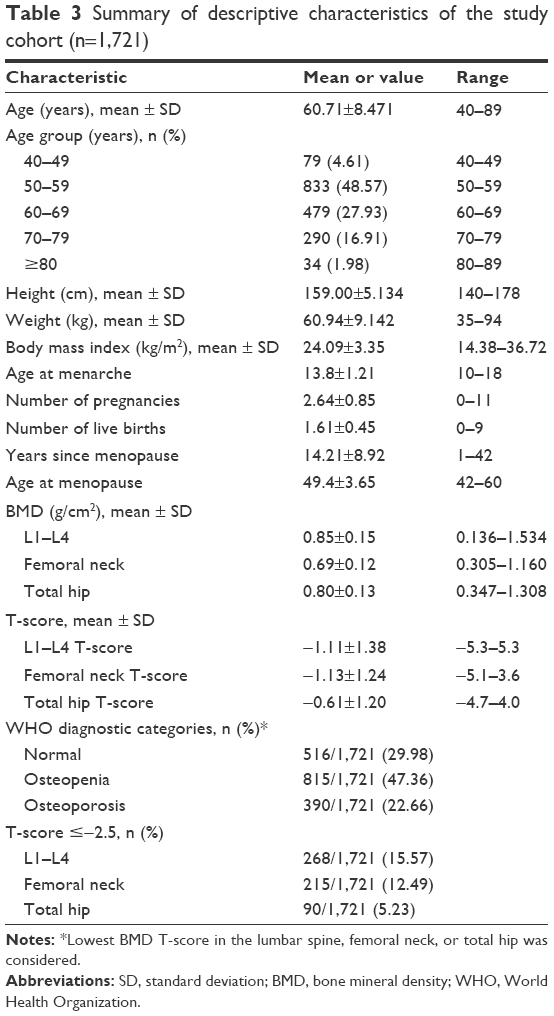 | Table 3 Summary of descriptive characteristics of the study cohort (n=1,721) |
Distribution of T-scores of different sites by BFH-OST
Figure 2 shows the distribution of T-scores at different sites by the BFH-OST index values. There was a moderate positive correlation between BFH-OST index values and BMD T-scores at different sites (femoral neck: r=0.366, P<0.001; total hip: r=0.439, P<0.001; L1–L4: r=0.303, P<0.001). This result indicates that women with higher index values tended to have higher T-scores.
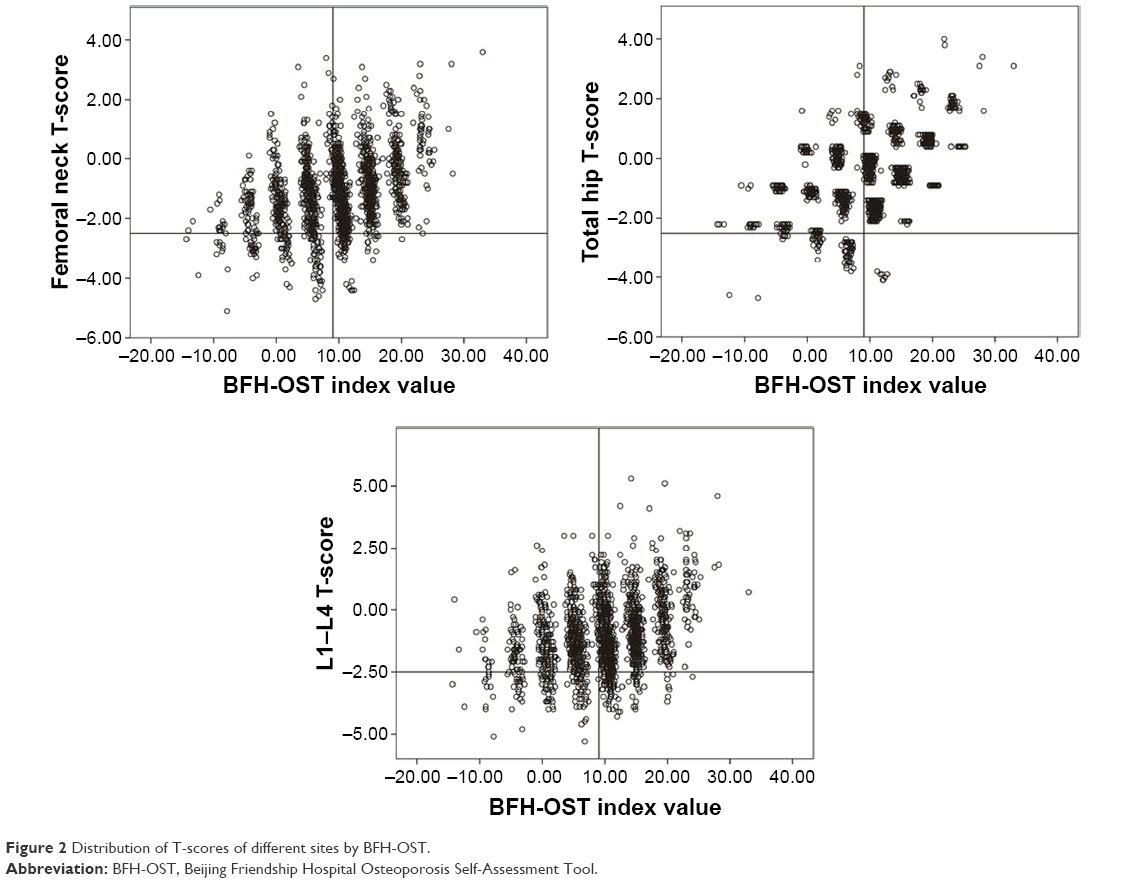 | Figure 2 Distribution of T-scores of different sites by BFH-OST. |
Evaluation and comparison of BFH-OST and OSTA
BFH-OST was finally calculated using the following formula: [Body weight (kg) – age (years)] ×0.5+0.1× height (cm) – [previous fracture (0/1)].
For example, a 60-year-old woman whose body weight was 45 kg and height was 160 cm with a previous fracture would have a BFH-OST index of: (45–60) ×0.5+0.1×160–1=7.5.
As shown in Figure 1, a cutoff of BFH-OST of 9.1, the value at which the curves of sensitivity and specificity cross, achieved a sensitivity of 73.6% and a specificity of 72.7%. Figure 3 shows the comparison of ROC curves between OSTA and BFH-OST. AUC relating OSTA to osteoporosis was 0.782 (95% CI: 0.762–0.801, Z=22.359, P<0.001) with the optimal cutoff (OSTA ≤−1). AUC of BFH-OST was 0.797 (95% CI: 0.777–0.851, Z=23.458, P<0.001) with the optimal cutoff (BFH-OST ≤9.1), which is better than that of OSTA (P<0.05).
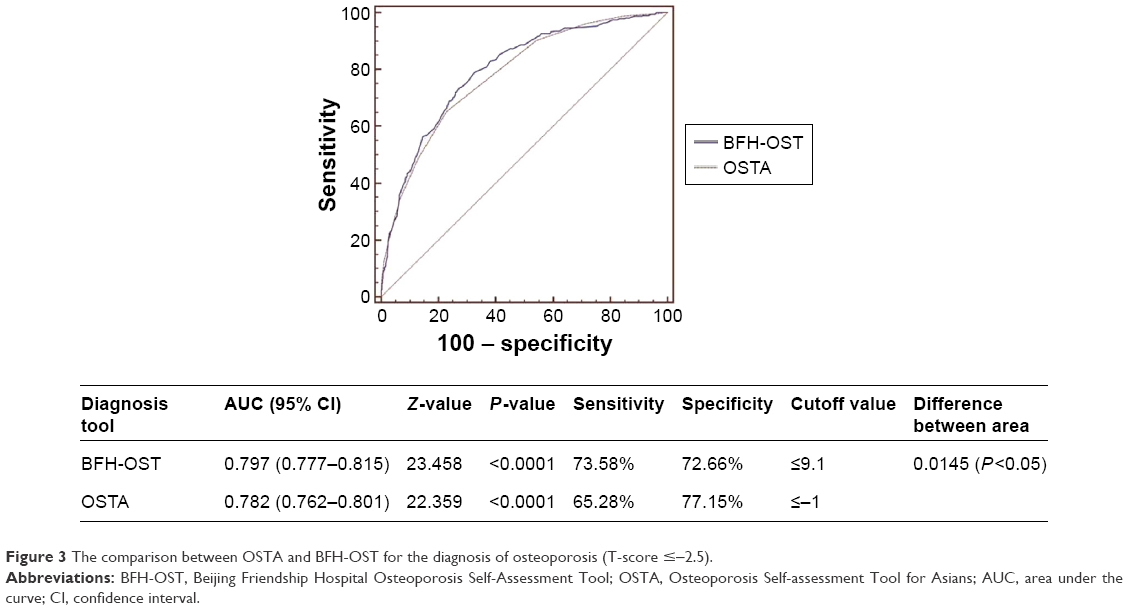 | Figure 3 The comparison between OSTA and BFH-OST for the diagnosis of osteoporosis (T-score ≤−2.5). |
As reported in detail in Table 4, we found that 649 women had a BFH-OST index ≤9.1 (increased risk category), and 284 (43.76%) of these had osteoporosis. The remaining 1,072 women belonged to the low-risk category, with BFH-OST index values above 9.1, and only 102 (9.51%) of these women had osteoporosis. The sensitivity, specificity, positive predictive value (PPV), and negative predictive value (NPV) of the OSTA index for detecting osteoporosis were calculated for the overall population and by age groups. Among these women who presented for routine screenings, the sensitivity was 73.58 % (284/386; 95% CI: 68.9–77.9), specificity was 72.66% (970/1,335; 95% CI: 70.2–75.0), PPV was 43.8% (284/649; 95% CI: 39.9–47.7), and NPV was 90.5 (970/1072; 95% CI: 88.6–92.2). When analyzed by age groups, the sensitivity and PPV increased with age, while the specificity and NPV decreased with age.
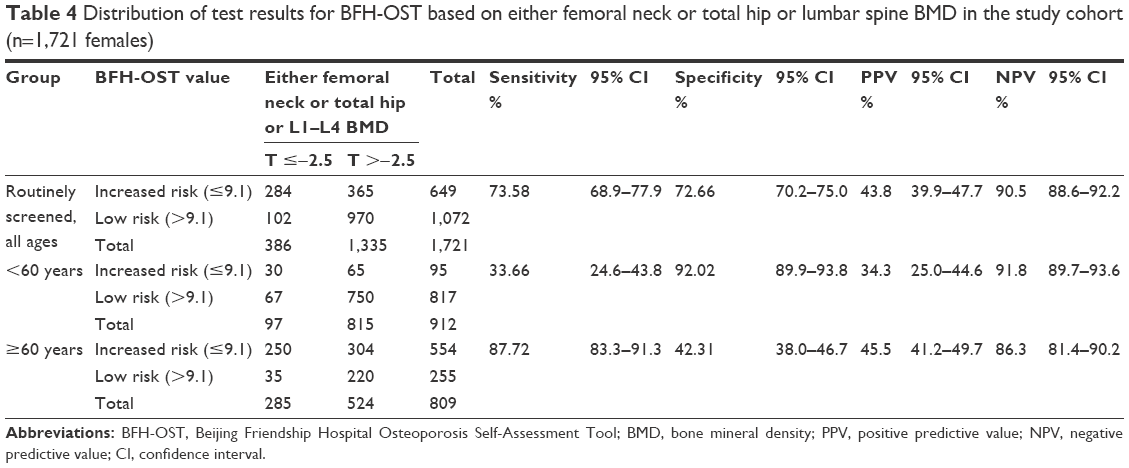 | Table 4 Distribution of test results for BFH-OST based on either femoral neck or total hip or lumbar spine BMD in the study cohort (n=1,721 females) |
Discussion
A simple and accurate tool to identify the risk of osteoporosis is very important in developing countries such as the People’s Republic of China. In this study population, the prevalence of osteopenia and osteoporosis was very high (osteopenia: 47.36%, osteoporosis: 22.66%). This high prevalence highlights the need for reliable screening tools to identify women at risk for fractures.
By evaluating many possible risk factors, we developed a clinical risk assessment tool for identifying DXA-determined osteoporosis in a Han Chinese population. The final index, based on age, weight, height, and fracture after the age of 45 years, was compared favorably with OSTA. Based on age and body weight alone, OSTA has been found in previous studies to be a good and simple tool with high sensitivity and acceptable specificity for identifying women at risk for osteoporosis.19–22 However, another study reported poor results when attempting to validate the use of OSTA for identifying postmenopausal osteoporosis in a Chinese cohort as diagnosed with lumbar spine DXA BMD measurements.13 In our study, OSTA performed well to identify BMD loss with an AUC of 0.782. However, BFH-OST was modestly superior to OSTA, with an AUC =0.797 (95% CI: 0.777–0.851), and the difference was statistically significant (P<0.05). Furthermore, for the 49–59 year-old group, the performance was better than for the 60–89 year-old group or for the total population.
BFH-OST has higher sensitivity and similar specificity to OSTA, which means that in contrast to OSTA, it may be more useful in screening for osteoporosis, because osteoporosis is asymptomatic in most patients. The high sensitivity of BFH-OST may allow it to become a simple tool in screening for osteoporosis, reducing missed diagnoses. It may help us to screen for patients with a high risk of osteoporosis who need a further DXA examination. The optimal value for BFH-OST of 9.1 was defined in this data set by optimizing the sensitivity and specificity, as shown in Figure 1B. However, it will be important to validate this cutoff in additional data sets. It will also be important to see if the BFH-OST screening tool accurately identifies women with osteoporosis in populations other than Han Chinese women.
Previous investigations indicated that advanced age and low body weight are strongly associated with low BMD and with increased fracture risk.23 In our study, age and body weight also displayed a strong correlation with osteoporosis. However, height also correlated with osteoporosis, though it usually has been considered an irrelevant factor.9,16,24 In fact, both a patient’s weight and height should be considered when assessing the patient’s degree of obesity, which is traditionally thought to be beneficial to bone and a protective factor against osteoporosis.25 BMI uses the combination of weight and height, which has been shown to be associated with BMD.26 In a cross-sectional study of 60 women between 10 and 19 years of age, the percent of body fat was linked to suboptimal attainment of peak bone mass.27 We also found that BMI was associated with BMD, but it was not included in BFH-OST during logistic regression analysis.
Increased adiposity may also be linked to elevated risk of fractures. In a case–control study of 100 patients with fractures and 100 age-matched, fracture-free control subjects aged 3–19 years, high adiposity was associated with increased risk of distal forearm fractures.28 In that study, BMI of the study population was over 30 kg/m2. In our study, the average BMI was 24 kg/m2, and the distribution of BMI values was normal. Despite this fact, body weight remained a protective factor. In a study by Lloyd et al, every unit increase in BMI was associated with an increase of 0.0082 g/cm2 in BMD (P<0.001), and this relationship did not differ by age, sex, or race.29 Therefore, height and weight should both be examined to assess the risk of osteoporosis because they are both relevant for evaluating the nutrient status of patients, which affects the risk of osteoporosis.
We added previous, self-described fracture history after the age of 45 years to the model as a risk factor, since it has a significant relationship with osteoporosis. Patients could not tell whether it was a fragility fracture. Previous fracture was also considered as a risk factor for osteoporosis in previous studies.9,16,24 We believe that a history of fracture after the age of 45 years may reflect bone strength.
This study is community-based and cross-sectional but not retrospective, which distinguishes it from previous studies. The statistics were obtained simultaneously with the BMD measurement. Furthermore, the inclusion and exclusion criteria very strictly excluded the effects of secondary osteoporosis, nationality, and any antiresorptives or anabolic medications. All the subjects were long-term residents of Beijing, and the subjects were enrolled consecutively. Furthermore, this analysis proposed a new method for identifying osteoporosis based on the WHO and NOF diagnostic classification (T-score ≤−2.5 at the femoral neck, total hip, or lumbar spine) for patients needing treatment.
Limitations
This study also has some limitations. All the subjects were recruited from the community health clinic population, but patients were mostly located nearby the study hospital. So the study population may not fully represent the actual female population in Beijing. A larger sample of the community is necessary in future studies. The population structure of this study also differed from the actual demographic mix in Beijing, which could affect the results. Our results should be confirmed in other cohorts.
Conclusion
In conclusion, our study developed a new osteoporosis self-assessment tool (BFH-OST), which may be a simple and cost-effective prescreening tool for identifying postmenopausal women at increased risk for osteoporosis.
Acknowledgment
The study was funded by the Capital Health Project (Z131100006813040), Beijing, People’s Republic of China.
Disclosure
The authors report no conflicts of interest in this work.
References
Hochberg M. Preventing fractures in postmenopausal women with osteoporosis. Drugs Aging. 2000;17(4):317–330. | ||
Stafford RS, Drieling RL, Hersh AL. National trends in osteoporosis visits and osteoporosis treatment. Arch Intern Med. 2004;164(14):1525–1530. | ||
Vestergaard P, Rejnmark L, Mosekilde L. Osteoporosis is markedly underdiagnosed: a nationwide study from Denmark. Osteoporosis Int. 2005;16(2):134–141. | ||
Siris E. Alendronate in the treatment of osteoporosis: a review of the clinical trials. J Womens Health Gend Based Medic. 2000;9(6):599–606. | ||
[No authors listed]. Assessment of fracture risk and its application to screening for postmenopausal osteoporosis. Report of a WHO Study Group. World Health Organ Tech Rep Ser. 1994;843:1–129. | ||
Cosman F, de Beur SJ, LeBoff MS, et al. Clinician’s guide to prevention and treatment of osteoporosis. Osteoporosis Int. 2014;25(10):2359–2381. | ||
Kling JM, Clarke BL, Sandhu NP. Osteoporosis prevention, screening, and treatment: a review. J Womens Health. 2014;23(7):563–572. | ||
Abrahamsen B. Screening: FRAX in clinical practice. Nat Rev Rheumatol. 2011;7(12):686–688. | ||
Koh LK, Sedrine WB, Torralba TP, et al. A simple tool to identify Asian women at increased risk of osteoporosis. Osteoporosis Int. 2001;12(8):699–705. | ||
Rud B, Hilden J, Hyldstrup L, Hróbjartsson A. Performance of the Osteoporosis Self-Assessment Tool in ruling out low bone mineral density in postmenopausal women: a systematic review. Osteoporosis Int. 2007;18(9):1177–1187. | ||
Oh SM, Nam BH, Rhee Y, et al. Development and validation of osteoporosis risk-assessment model for Korean postmenopausal women. J Bone Miner Metab. 2013;31(4):423–432. | ||
Su FM, Liu DH, Chen JF, et al. Development and validation of an osteoporosis self-assessment tool for Taiwan (OSTAi) postmenopausal women-a sub-study of the Taiwan OsteoPorosis Survey (TOPS). Plos One. 2015;10(6):e013071. | ||
Zha XY, Hu Y, Pang XN, Chang GL, Li L. Diagnostic value of Osteoporosis Self-Assessment Tool for Asians (OSTA) and quantitative bone ultrasound (QUS) in detecting high-risk populations for osteoporosis among elderly Chinese men. J Bone Miner Metab. 2014;33(2):230–238. | ||
Yang Y, Wang B, Fei Q, et al. Validation of an osteoporosis self-assessment tool to identify primary osteoporosis and new osteoporotic vertebral fractures in postmenopausal Chinese women in Beijing. BMC Musculoskelet Disord. 2013;14:271. doi:10.1186/1471-2474-14-271. | ||
Slemenda CW, Hui SL, Longcope C, Wellman H, Johnston CC Jr. Predictors of bone mass in perimenopausal women. A prospective study of clinical data using photon absorptiometry. Ann Intern Med. 1990;112(2):96–101. | ||
Lydick E, Cook K, Turpin J, Melton M, Stine R, Byrnes C. Development and validation of a simple questionnaire to facilitate identification of women likely to have low bone density. Am J Manag Care. 1998;4(1):37–48. | ||
Greiner M, Pfeiffer D, Smith RD. Principles and practical application of the receiver-operating characteristic analysis for diagnostic tests. Prev Vet Med. 2000;45(1–2):23–41. | ||
Swets JA. Measuring the accuracy of diagnostic systems. Science. 1988;240(4857):1285–1293. | ||
Rud B, Hilden J, Hyldstrup L, Hróbjartsson A. The Osteoporosis Self-Assessment Tool versus alternative tests for selecting postmenopausal women for bone mineral density assessment: a comparative systematic review of accuracy. Osteoporosis Int. 2009;20(4):599–607. | ||
Li-Yu JT, Llamado LJ, Torralba TP. Validation of OSTA among Filipinos. Osteoporosis Int. 2005;16(12):1789–1793. | ||
Wallace LS, Ballard JE, Holiday D, Turner LW, Keenum AJ, Pearman CM. Evaluation of decision rules for identifying low bone density in postmenopausal African-American women. J Natl Med Assoc. 2004;96(3):290–296. | ||
Park HM, Sedrine WB, Reginster JY, Ross PD; OSTA. Korean experience with the OSTA risk index for osteoporosis: a validation study. J Clin Densitom. 2003;6(3):247–250. | ||
Demir B, Haberal A, Geyik P, et al. Identification of the risk factors for osteoporosis among postmenopausal women. Maturitas. 2008;60(3–4):253–256. | ||
Cadarette SM, Jaglal SB, Kreiger N, McIsaac WJ, Darlington GA, Tu JV. Development and validation of the Osteoporosis Risk Assessment Instrument to facilitate selection of women for bone densitometry. CMAJ. 2000;162(9):1289–1294. | ||
Cao JJ. Effects of obesity on bone metabolism. J Orthop Surg Res. 2011;6:30. | ||
Johansson H, Kanis JA, Odén A, et al. A meta-analysis of the association of fracture risk and body mass index in women. J Bone Miner Res. 2014;29(1):223–233. | ||
Weiler HA, Janzen L, Green K, Grabowski J, Seshia MM, Yuen KC. Percent body fat and bone mass in healthy Canadian females 10 to 19 years of age. Bone. 2000;27(2):203–207. | ||
Goulding A, Jones IE, Taylor RW, Williams SM, Manning PJ. Bone mineral density and body composition in boys with distal forearm fractures: a dual-energy x-ray absorptiometry study. J Pediatr. 2001;139(4):509–515. | ||
Lloyd JT, Alley DE, Hawkes WG, Hochberg MC, Waldstein SR, Orwig DL. Body mass index is positively associated with bone mineral density in US older adults. Arch Osteoporos. 2014;9:175. |
 © 2016 The Author(s). This work is published and licensed by Dove Medical Press Limited. The full terms of this license are available at https://www.dovepress.com/terms.php and incorporate the Creative Commons Attribution - Non Commercial (unported, v3.0) License.
By accessing the work you hereby accept the Terms. Non-commercial uses of the work are permitted without any further permission from Dove Medical Press Limited, provided the work is properly attributed. For permission for commercial use of this work, please see paragraphs 4.2 and 5 of our Terms.
© 2016 The Author(s). This work is published and licensed by Dove Medical Press Limited. The full terms of this license are available at https://www.dovepress.com/terms.php and incorporate the Creative Commons Attribution - Non Commercial (unported, v3.0) License.
By accessing the work you hereby accept the Terms. Non-commercial uses of the work are permitted without any further permission from Dove Medical Press Limited, provided the work is properly attributed. For permission for commercial use of this work, please see paragraphs 4.2 and 5 of our Terms.