")
Back to Journals » Clinical Interventions in Aging » Volume 10
Association between muscle mass and adipo-metabolic profile: a cross-sectional study in older subjects
Authors Perna S, Guido D, Grassi M, Rondanelli M
Received 10 June 2014
Accepted for publication 30 July 2014
Published 26 February 2015 Volume 2015:10 Pages 499—504
DOI https://doi.org/10.2147/CIA.S67872
Checked for plagiarism Yes
Review by Single anonymous peer review
Peer reviewer comments 3
Editor who approved publication: Dr Richard Walker
Simone Perna,1,* Davide Guido,2,* Mario Grassi,2 Mariangela Rondanelli1
1Department of Public Health, Experimental and Forensic Medicine, School of Medicine, Endocrinology and Nutrition Unit, University of Pavia, Azienda di Servizi alla Persona di Pavia, Pavia, Italy; 2Medical and Genomic Statistics Unit, Department of Brain and Behavioral Sciences, University of Pavia, Pavia, Italy
*These authors contributed equally to this work
Background: Sarcopenia, the decrease in muscle mass and function, may lead to various negative health outcomes in elderly. The association among sarcopenia with adiposity and metabolic markers has rarely been studied in the elderly population, with controversial results. The aim of this study is to evaluate this relationship in older subjects.
Methods: A cross-sectional study was conducted in 290 elderly patients, focusing on the possible association between muscle mass loss, assessed by relative skeletal muscle mass (RSMM), and an adipo-metabolic profile (AMP) defined by adiposity and metabolic biochemical markers. Measurements of body composition were assessed by dual energy X-ray absorptiometry. Biochemical parameters, such as albumin, low-density lipoprotein cholesterol, high-density lipoprotein cholesterol, total cholesterol, triglycerides, C-reactive protein, and homocysteine and its related markers (folate and vitamin B12) were measured. Using canonical correlation analysis and structural equation modeling, an individual score of AMP was created and correlated with RSMM.
Results: The AMP–RSMM correlation was equal to +0.642 (95% confidence interval, +0.512 to +0.773; P<0.001). Hence, a negative association between sarcopenia severity and adiposity/metabolic biochemical markers was highlighted.
Conclusion: This study contained a novel way to examine the relationship between the variables of interest based on a composite index of adiposity and metabolic conditions. Results shed light on the orientation and magnitude of adiposity and metabolic markers in preventing muscle mass loss. There might be a protective effect of adiposity, compatible with the “obesity paradox.”
Keywords: muscle mass loss, dual energy X-ray absorptiometry, elderly, metabolic risk markers
Introduction
Lean muscle mass declines with aging to 25% at 75–80 years old, and it is typically offset by gains in fat mass; in addition, there is a relatively greater decrease in peripheral fat mass compared with the central one.1 These age-related body composition changes are associated with negative health outcomes in elderly.2,3 In particular, the association between loss of muscle mass with various metabolic disorders has been reported.4,5 At present, no study has systematically explored the complex interactions between these metabolic disorders and muscle mass loss. The studies performed to date have always evaluated the correlations between body mass index (BMI) and metabolic disorders, and not between body muscle, fat mass and metabolic disorders.
The increase of BMI has already been recognized as one of the well-known risk factors for many diseases, including metabolic disorders.6 However, in elderly patients with various diseases, data from a large number of studies show that comparing patients with different weights, overweight and obesity have led to a better clinical prognosis: this phenomenon is named “obesity paradox.”7,8 Yet, high BMI is a poor discriminator of total body fatness,9 particularly in the elderly population.10 Since BMI does not directly measure the amount of adipose and muscle tissue and cannot distinguish between fat mass and lean mass, its validity has been questioned.11
BMI is the cornerstone of the current classification system for obesity, and its advantages are widely exploited across disciplines ranging from international surveillance to individual patient assessment. BMI continues to be useful for many purposes, such as all those mentioned above. Nevertheless, the scientific community is now experiencing a gradual evolution from BMI toward other standards based on actual measurements of body muscle, fat mass, and age-related metabolism; particularly when a study evaluates the correlations between age-related changes in body composition and metabolic disorders. Therefore, it would be useful to identify a composite variable that considers both body composition parameters measured by dual energy X-ray absorptiometry (DXA) and indicators of metabolic status. Concerning the metabolic markers, it is useful to choose the following: albumin, as an indicator of protein malnutrition that is common in elderly people and might be expected to exacerbate the physiological age-related muscle mass decline;12 low-density lipoprotein cholesterol (LDL-C), high-density lipoprotein cholesterol (HDL-C), total cholesterol, and triglycerides, because if increased, are well-established cardiovascular disease risk markers; C-reactive protein, because it is an indicator of inflammation and several lines of evidence suggest inflammation might be associated with loss of muscle mass with aging;13,14 homocysteine and its related markers (folate and vitamin B12), because decreases in vitamin B12 and folic acid intake may impair muscle function through their action on homocysteine.15 Concerning the body composition parameters, assessed by DXA, the gold standard for measuring body composition,16 it is useful to select fat mass, fat-free mass, gynoid fat and android fat because body composition and fat distribution may be important in determining risk of cardiovascular and metabolic disease. An android fat pattern with excess fat in the upper (central) body region, particularly the abdomen, has been associated with increased risk compared with the gynoid pattern, with increased fat in the lower body segment, particularly the hips and thighs.17–19
Given this background, the aim of the study was to evaluate the cross-sectional relationships between muscle mass loss – evaluated as relative skeletal muscle mass (RSMM) by DXA – with the previous adiposity and metabolic related markers. We planned our study to understand, through the formulation of a new composite variable, how moderate extents of adiposity and metabolic biochemical markers may be protective toward muscle mass loss.
Materials and methods
Subjects
We evaluated white male and female elderly subjects consecutively admitted to a physical medicine and rehabilitation division (Istituto Santa Margherita, Azienda di Servizi alla Persona di Pavia, Pavia, Italy). Eligible patients were aged 65 years or older. Subjects not affected by acute illness, severe liver, heart, or kidney dysfunction, severe dementia (Mini Mental State Examination <16), and had a bodyweight that had been stable for 6 months were included in the study. Moreover, subjects with uncontrolled diabetes, dysthyroidism and other endocrinopathies, neoplasia, as well as patients treated with steroids, or with total walking incapacity, were excluded. The selected patients had to also have a BMI between 18 and 35 kg/m2. The study design was approved by the ethics committee of the University of Pavia, and an individual written informed consent was obtained from each subject. Data were gathered from the end of January 2011 to the end of June 2013.
Observed variables
Body composition measurements
Body composition measurement was assessed using DXA (Lunar Prodigy DXA; GE Medical Systems, Waukesha, WI, USA). The in vivo coefficients of variation were 4.20% and 0.48% for fat and muscle mass, respectively. All measurements for each given parameter were carried out by the same investigator. Evaluation of fat mass “total body” was obtained by whole body scan. RSMM was derived as the sum of fat-free soft tissue mass of arms and legs.20
Bodyweight was measured to the nearest 0.1 kg by using a precision scale, with the subjects wearing light clothing and without shoes, using standardized technique,21 and BMI was calculated (kg/m2).
Blood sample measurements
Fasting venous blood samples were drawn between 8 am and 10 am, with the subjects in a sitting position. Blood handling and collection were carried out under strictly standardized conditions and in line with manufacturers’ recommendations. The levels of serum folate and vitamin B12 were determined using an immunoassay, and high performance liquid chromatography was used to measure total plasma homocysteine levels. Serum albumin was also analyzed using a nephelometric method (Behring nephelometric analyzer II; Behring Diagnostics GmbH, Marburg, Germany), with a 2% coefficient of variation. Fasting blood total cholesterol, LDL-C, HDL-C, and triglyceride levels were measured by automatic biochemical analyzer (Hitachi 747; Hitachi Ltd., Tokyo, Japan). High-sensitivity C-reactive protein was also assessed.
Cognitive assessment
Participants underwent a detailed cognitive assessment that included the Mini Mental State Examination (MMSE), adjusted for socio-educational level of the individual.22
Statistical analysis
We outline a correlation analysis of an adipo-metabolic composite variable of the DXA and metabolic indicators with RSMM, an index of muscle mass loss, by canonical correlation analysis (CCA)23/structural equation model (SEM)24 according to the strategy by Treiblmaier et al.25 The procedure was built in two steps. In the CCA step, the collection of observed biomarkers were divided into two sets by clinical tests: in the first one, there were the DXA body composition variables; in the second one, the hematochemical variables. CCA provided a pair of canonical variates maximally correlated (DXA variate and hematochemical variate) built on a weighted sum of observed variables for each set. In the SEM step, an overall composite variable, ie the adipo-metabolic profile (AMP), based on the canonical variates pair and maximum canonical correlation, was derived and correlated with the RSMM index, adjusting for demographic and cognitive variables (sex, age, and MMSE).
In the CCA step, canonical loadings r>0.10 (ie, the correlations between observed variables and canonical variates) were chosen for variable selection. This cutoff is the Pearson’s correlation value that returned a P=0.05 from a one-sided test with sample size of the current study, n=290. In the SEM step, standardized root mean square residual (SRMR) <0.10, a measure of the deviation of the observed covariance matrix from the expected (model-based) covariance matrix, was considered for an “adequate approximation.” Partial correlation of AMP with RSMM was computed by maximum likelihood estimation, and evaluated by z-test (= estimate/ standard error), considering P<0.05, in a two-sided test, statistically significant. Data analysis was performed with R v3.0.2 software using the CCA26 and lavaan27 packages.
Results
Subject characteristics
All 680 elderly subjects admitted to our physical medicine and rehabilitation division from the end of January 2011 to the end of June 2013 were assessed for eligibility: 356 were eligible participants. A total of 290 subjects were enrolled. Fifty-five cases were excluded because they refused to participate, and eleven had laboratory abnormalities (uncontrolled diabetes in two cases, hypertension not properly controlled by pharmacological treatment at the observation time in two cases, and creatinine outlier values in three cases). All subjects came from their house, for a hospital stay of 3 months. Moreover, all the patients were sedentary at the time of the study.
General characteristics of the studied population, stratified by sex, and the statistical difference between males and females, are given in Table 1. Concerning the most frequently employed drugs, 89% of patients were receiving antihypertensive drugs, 49% drugs for the treatment of osteoporosis (bisphosphonates or denosumab), 52% drugs for the treatment of dyslipidemia (statins), and 39% oral hypoglycemic drugs.
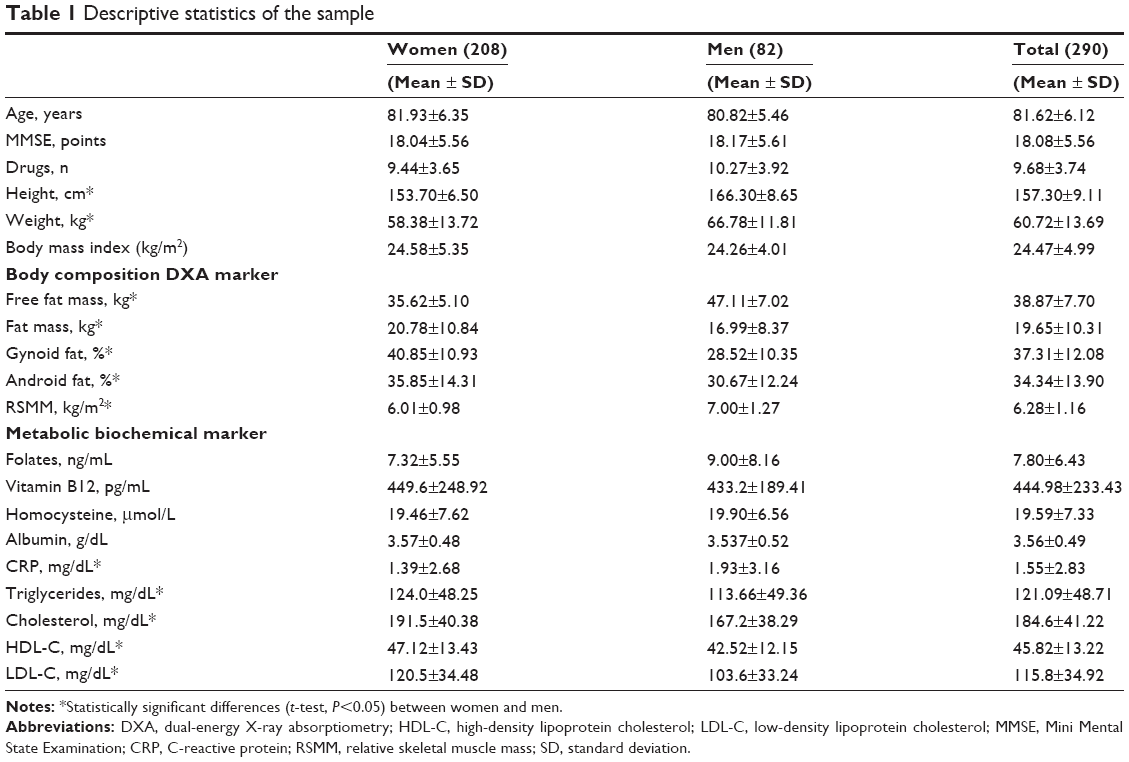 | Table 1 Descriptive statistics of the sample |
Canonical correlation analysis
Table 2 displays the output of CCA. The canonical correlation coefficient was equal to +0.445. The canonical loadings for the DXA set were ordered as follows: android fat (+0.406), fat mass (+0.384), gynoid fat (+0.221), and lean mass (-0.812); these straight relationships define the “adiposity” canonical variate interpretation – when the “adiposity” canonical variate increases the adiposity status increases. For the metabolic set, instead, the highest canonical loadings are positive: albumin (+0.695), triglycerides (+0.282), homocysteine (+0.193), and folates (+0.154); however, we referred to strong albumin and moderate triglycerides and homocysteine canonical loadings to orientate the second canonical variate reading. Hence, when this canonical variate increases, the metabolic biochemical compound level increases.
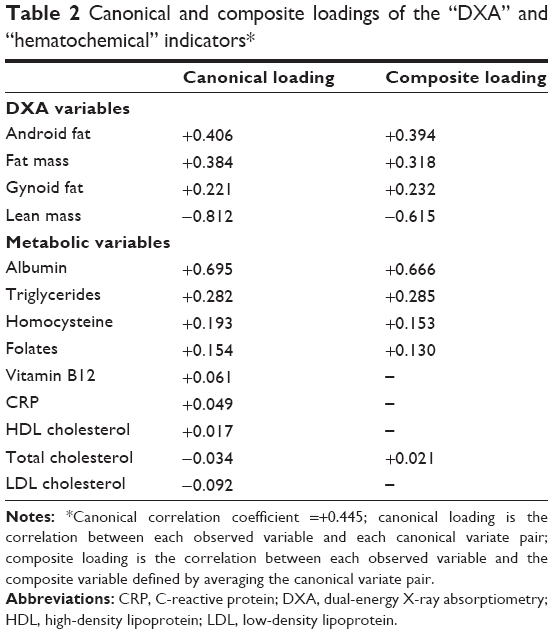 | Table 2 Canonical and composite loadings of the “DXA” and “hematochemical” indicators* |
The composite loadings (ie, the correlation of each variable with the composite score defined by averaging the canonical variate pair) are also shown in Table 2. They have shown similar values as the canonical loadings. Consequently, the parameters assessed by DXA, albumin, and triglycerides were more influential on AMP. C-reactive protein, vitamin B12, HDL, and LDL had non-significant canonical/composite loadings (r<0.10), and they were not included in the successive SEM analysis. However, the cholesterol was kept to improve metabolic interpretation of the individual profile.
Structural equation model analysis
The partial correlation of AMP with RSMM adjusting for demo-cognitive variables via SEM, was equal to +0.642 (95% confidence interval, +0.512 to +0.773; P<0.001). The goodness-of-fit statistic (SRMR =0.076) gave evidence of the model appropriateness. Figure 1 displays the scatterplot of the overall composite AMP (defined as the average of the canonical variate pair) and RSMM. To evaluate the “rank” position of the AMP–RSMM correlation, we also computed the bivariate partial correlations between RSMM and each other indicator, including BMI, used as benchmark for correlation ranking. These correlations ranged from -0.20 to 0.375. Only BMI–RSMM correlation (0.538) had a comparable, but lower, rank as AMP–RSMM correlation, confirming the gain of the composite markers profile compared with the single marker.
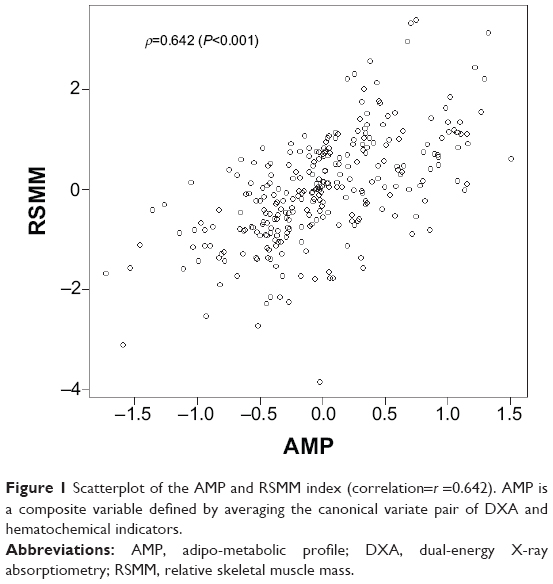 | Figure 1 Scatterplot of the AMP and RSMM index (correlation=r =0.642). AMP is a composite variable defined by averaging the canonical variate pair of DXA and hematochemical indicators. |
Discussion
The present research contained a novel way to examine the relationship between the variable of interest in predicting muscle mass loss, assessed by DXA, and metabolic biochemical measures as components of an AMP. This study, conducted in a group of elderly, using a composite variable model, demonstrated that an increase of adiposity and levels of metabolic parameters, within normal appropriate reference ranges, can be protective respect to muscle loss. We have chosen to create a composite variable AMP to be considered as a synthetic variable of multidimensional adiposity and metabolic components. AMP was correlated with muscle mass loss, assessed by RSMM: if AMP increased, RSMM increased. Moreover, the present study can shed light on the orientation and magnitude of adipo-metabolic markers in preventing muscle mass loss.
Muscle mass loss represents a critical topic in elderly: in a study including 1,396 men and women aged 70 years and older, low arm muscle area was associated with an elevated mortality rate during an 8-year follow-up period.28 Moreover, Heitmann et al29 reported that lower levels of fat-free mass were associated with an increased risk of mortality among 787 men aged 60 years and older who were followed for 22 years.
An important key point of the study regards the establishment of measurement for adiposity and metabolic conditions. As previously underlined,30 adiposity (although evaluated with BMI only), is linked to metabolic status in elderly: normal and moderately high levels of BMI (range from 24 to 30 kg/m2) favor an improvement of metabolic outcome (malnutrition, sarcopenia, and cardiovascular diseases).
In this study, we included four indicators of body composition (lean mass, fat mass, android fat, and gynoid fat measured by DXA), because BMI alone has been suggested to be inappropriate for this purpose in the elderly,10 and five indicators of metabolic status (albumin, triglycerides, homocysteine, folate, and total cholesterol). We derived the composite variable AMP, as a synthesis of adiposity and metabolic-related variables. In this way, we summarized all variables in a single profile, and the results showed that this profile has a greater performance with RSMM (r=0.642) compared with its individual components (r: from -0.20 to 0.375), and BMI (r=0.538).
The increase of BMI has already been recognized as one of the risk factors for many diseases; however, in patients with various diseases, data from a large number of studies show that when comparing patients with different weights, overweight and obesity have led to a better clinical prognosis, named “obesity paradox.”31 As illustrated by Hamer and Stamatakis32 and Coutinho et al33 in the “obesity paradox” condition, mortality due to coronary artery disease, congestive heart failure, and hypertension have shown an inverse relationship with obesity (only BMI-based). The present study might be put in this framework. The results of this research are in agreement with our previous study that demonstrated how adiposity has a role as a mediator of the effect of malnutrition on muscle mass loss.34
The major limitation of this study was the cross-sectional design that precluded addressing the issue of causation.
Conclusion
In conclusion, this study suggests a good (cross-sectional) linear relationship between muscle mass loss with a composite profile of adiposity and metabolic related markers. Considering that the age-related loss in skeletal muscle mass is associated with 1) substantial social and economic costs, 2) impairments in strength, 3) limitations in function, and ultimately, 4) physical disability and institutionalization, this work suggests that the assessment of body composition by DXA and routine metabolic biochemical markers, combined together in the AMP, could enter in the multidimensional geriatric approach to prevent muscle mass loss. Further studies, conducted with a larger number of subjects, are needed to confirm the findings of our study. In particular, additional experimental research will be required to test the effects of interventions to improve adiposity and to stop muscle mass loss.
Acknowledgments
We are especially grateful to our volunteers and their families for their unconditional participation in the study.
Disclosure
The authors report no conflicts of interest in this work.
References
Short KR, Nair KS. The effect of age on protein metabolism. Curr Opin Clin Nutr Metab Care. 2000;3:39–44. | ||
Cesari M, Kritchevsky SB, Baumgartner RN, et al. Sarcopenia, obesity, and inflammation results from the Trial of Angiotensin Converting Enzyme Inhibition and Novel Cardiovascular Risk Factors study. Am J Clin Nutr. 2005;82:428–434. | ||
Chin KY, Soelaiman IN, Mohamed IN, Ibrahim S, Wan Ngah WZ. The effects of age, physical activity level, and body anthropometry on calcaneal speed of sound value in men. Arch Osteoporos. 2012;7:135–145. | ||
Goodpaster BH, Park Sw, Harris TB, et al. The loss of skeletal muscle strength, mass, and quality in older adults: the health, aging and body composition study. J Gerontol A Biol Sci Med Sci. 2006;61:1059–1064. | ||
Karakelides H, Nair KS. Sarcopenia of aging and its metabolic impact. Curr Top Dev Biol. 2005;68:123–148. | ||
Michalakis K, Goulis DG, Vazaiou A, Mintziori G, Polymeris A, Abrahamian-Michalakis A. Obesity in the ageing man. Metabolism. 2013;62:1341–1349. | ||
Zhu YB. [“Obesity paradox” – a phenomenon based upon the health-related outcome on quality of life]. Zhonghua Liu Xing Bing Xue Za Zhi. 2013;34:294–296. Chinese. | ||
Zafrir B, Adir Y, Shehadieh W, Shteinberg M, Salman N, Amir O. The association between obesity, mortality and filling pressures in pulmonary hypertension patients; the “obesity paradox”. Respir Med. 2013;107:139–146. | ||
Chrysant SG, Chrysant GS. New insights into the true nature of the obesity paradox and the lower cardiovascular risk. J Am Soc Hypertens. 2013;7:85–94. | ||
Han TS, Tajar A, Lean ME. Obesity and weight management in the elderly. Br Med Bull. 2011;97:169–196. | ||
Prentice AM, Jebb SA. Beyond body mass index. Obes Rev. 2001;2:141–147. | ||
Ilich JZ, Brownbill RA, Tamborini L. Bone and nutrition in elderly women: protein, energy, and calcium as main determinants of bone mineral density. Eur J Clin Nutr. 2003;57:554–565. | ||
Bolton CE, Ionescu AA, Shiels KM, et al. Associated loss of fat-free mass and bone mineral density in chronic obstructive pulmonary disease. Am J Resp Care Med. 2004;170:1286–1293. | ||
Schaap LA, Pluijm SM, Deeg DJ, Visser M. Inflammatory markers and loss of muscle mass (sarcopenia) and strength. Am J Med. 2006;119:526. | ||
Mithal A, Bonjour JP, Boonen S, et al. Impact of nutrition on muscle mass, strength, and performance in older adults. Osteoporos Int. 2013;24:1555–1566. | ||
Garcia AL, Wagner K, Einig C, Trippo U, Koebnick C, Zunft HJ. Evaluation of body fat changes during weight loss by using improved anthropometric predictive equations. Ann Nutr Metab. 2006;50:297–304. | ||
Daniels SR, Morrison JA, Sprecher DL, Khoury P, Kimball TR. Association of body fat distribution and cardiovascular risk factors in children and adolescents. Circulation. 1999;99:541–545. | ||
Hartz A, Grubb B, Wild R. The association of waist-hip ratio and angiographically determined coronary artery disease. Int J Obes Relat Metab Disord. 1990;14:657–665. | ||
Donahue RP, Abbott RD, Bloom E, Reed DM, Yano K. Central obesity and coronary heart disease in men. Lancet. 1987;332:821–824. | ||
Baumgartner RN, Koehler KM, Gallagher D, et al. Epidemiology of sarcopenia among the elderly in New Mexico. Am J Epidemiol. 1998;147:755. | ||
Frisancho AR. New standards of weight and body composition by frame size and height for assessment of nutritional status of adults and the elderly. Am J Clin Nutr. 1984;40:808–819. | ||
Folstein MF, Folstein SE, McHugh PR. “Mini-mental state”. A practical method for grading the cognitive state of patients for the clinician. J Psychiatr Res. 1975;12:189–198. | ||
Thompson B. Canonical Correlation Analysis: uses and interpretation. Newbury Park, CA: Sage; 1984. | ||
Bollen KA. Structural Equations with Latent Variables. New York: Wiley; 1989. | ||
Treiblmaier H, Bentler PM, Mair P. Formative constructs implemented via common factors. Struct Equ Modeling. 2011;18:1–17. | ||
González I, Déjean S. CCA: canonical correlation analysis. R package version 1.2. 2012. | ||
Rosseel Y. lavaan: An R package for structural equation modeling. J Stat Softw. 2012;48:1–36. | ||
Miller MD, Crotty M, Giles LC, et al. Corrected arm muscle area: an independent predictor of long-term mortality in community-dwelling older adults? J Am Geriatr Soc. 2002;50:1272–1277. | ||
Heitmann BL, Erikson H, Ellsinger BM, Mikkelsen KL, Larsson B. Mortality associated with body fat, fat-free mass and body mass index among 60-year-old swedish men-a 22-year follow-up. The study of men born in 1913. Int J Obes Relat Metab Disord. 2000;24:33–37. | ||
Zamboni M, Mazzali G, Zoico E. Health consequences of obesity in the elderly: a review of four unresolved questions. Int J Obes. 2005;29:1011–1029. | ||
Oreopoulos A, Kalantar-Zadeh K, Sharma AM, Fonarow GC. The obesity paradox in the elderly: potential mechanisms and clinical implications. Clin Geriatr Med. 2009;25:643 – 659. | ||
Hamer M, Stamatakis E. Overweight and obese cardiac patients have better prognosis despite reporting worse perceived health and more conventional risk factors. Prev Med. 2013;57:12–16. | ||
Coutinho T, Goel K, Correa de Sa D, et al. Combining body mass index with measures of central obesity in the assessment of mortality in subject with coronary disease: role of “normal weight central obesity”. J Am Coll Cardiol. 2013;61:553–560. | ||
Rondanelli M, Guido D, Opizzi A, Faliva MA, Perna S, Grassi M. A path model of sarcopenia on bone mass loss in elderly subjects. J Nutr Health Aging. 2013;8:15–21. |
 © 2015 The Author(s). This work is published and licensed by Dove Medical Press Limited. The full terms of this license are available at https://www.dovepress.com/terms.php and incorporate the Creative Commons Attribution - Non Commercial (unported, v3.0) License.
By accessing the work you hereby accept the Terms. Non-commercial uses of the work are permitted without any further permission from Dove Medical Press Limited, provided the work is properly attributed. For permission for commercial use of this work, please see paragraphs 4.2 and 5 of our Terms.
© 2015 The Author(s). This work is published and licensed by Dove Medical Press Limited. The full terms of this license are available at https://www.dovepress.com/terms.php and incorporate the Creative Commons Attribution - Non Commercial (unported, v3.0) License.
By accessing the work you hereby accept the Terms. Non-commercial uses of the work are permitted without any further permission from Dove Medical Press Limited, provided the work is properly attributed. For permission for commercial use of this work, please see paragraphs 4.2 and 5 of our Terms.