")
Back to Journals » Drug Design, Development and Therapy » Volume 14
Applying Different Techniques to Improve the Bioavailability of Candesartan Cilexetil Antihypertensive Drug
Authors Aly UF, Sarhan HA, Ali TFS , Sharkawy HAEB
Received 5 February 2020
Accepted for publication 27 April 2020
Published 14 May 2020 Volume 2020:14 Pages 1851—1865
DOI https://doi.org/10.2147/DDDT.S248511
Checked for plagiarism Yes
Review by Single anonymous peer review
Peer reviewer comments 2
Editor who approved publication: Dr Qiongyu Guo
Usama Farghaly Aly,1 Hatem Abdel-monsef Sarhan,1 Taha FS Ali,2 Hosny Abd El-Bakey Sharkawy1
1Department of Pharmaceutics, Faculty of Pharmacy, Minia University, Minia, Egypt; 2Department of Medicinal Chemistry, Faculty of Pharmacy, Minia University, Minia, Egypt
Correspondence: Usama Farghaly Aly
Department of Pharmaceutics, Faculty of Pharmacy, Minia University, Assuit Agriculture Road, P.O: 61519, Minia, Egypt
Tel +20 100110868
Fax +20 862369075
Email [email protected]
Purpose: The objective of this study was to compare different techniques to enhance the solubility and dissolution rate, and hence the bioavailability of candesartan cilexetil.
Methods: To achieve this target, various techniques were employed such as solid dispersions, inclusion complexes, and preparation of candesartan nanoparticles. Following the preparations, all samples were characterized for their physicochemical properties, and the samples of the best results were subjected to further bioavailability studies.
Results: Results of dissolution studies revealed an increase in the dissolution rate of all samples. The highest dissolution rate was achieved using solid dispersion of the drug with PVP K-90 (1:4). Physicochemical investigations (XR, DSC, and FT-IR) suggested formation of hydrogen bonding and changing in the crystalline structure of the drug. Regarding the inclusion complexes, more stable complex was formed between HP-β-CD and CC compared to β-CD, as indicated by phase solubility diagrams. Antisolvent method resulted in the preparation of stable nanoparticles, as indicated by ζ potential, with average particle size of 238.9 ± 19.25 nm using PVP K-90 as a hydrophilic polymer. The best sample that gave the highest dissolution rate (CC/PVP K-90 1:4) was allowed for further pharmacokinetic studies using UPLC MS/MS assay of rabbit plasma. Results showed a significant increase in the bioavailability of CC from ∼ 15% to ∼ 48%.
Conclusion: The bioavailability of CC was significantly improved from ∼ 15% to ∼ 48% when formulated as SDs with PVP K-90 with 1:4 drug:polymer ratio.
Keywords: solid dispersion, inclusion complex, nanoparticles, pharmacokinetics, UPLC MS/MS
Introduction
Hypertension is one of the most prevalent cardiovascular disorders that affect millions of peoples around the world. Growing evidences indicated the strong relationship between hypertension and increasing the risk of coronary heart diseases and the incidence of stroke.1
Candesartan cilexetil (CC) is an angiotensin II receptor blocker and one of the most prevalent antihypertensive drugs. It is also indicated in the management of other cardiovascular disorders as congestive heart failure.2–6 Chemically, it is a tetrazole derivative which is clinically used in the form of an ester prodrug (Figure 1). During the absorption from GIT, CC is bioactivated by ester hydrolysis and liberates the free drug.7 It is characterized by poor aqueous solubility and low dissolution rate which resulted in a very low bioavailability, only 15%.5,8,9
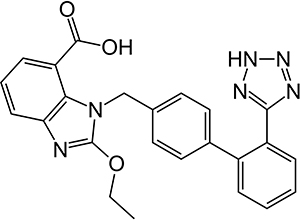 |
Figure 1 Structure of candesartan. |
In order to improve the solubility of such drugs, many scientists employed different techniques; among them, solid dispersions, inclusion complexations, and recently nanotechnology are efficient and most widely used. Solid dispersions are traditionally defined as dispersion of a hydrophobic drug or active ingredients in an inert hydrophilic carrier at solid state. This technique was developed in 1961 when Sekiguchi and Obi enhanced the rate and the extent of absorption of sulfathiazole by using solid dispersion.10 Since this year and up till now, the solubility of many drugs was improved.11–13 Solid dispersions can improve the dissolution rate mainly by two ways: reducing the size and, hence, increasing the surface area of the drug particle subjected to the dissolution medium.7 The second is through improving the wettability of the particles under the influence of the hydrophilic polymer.5,14 In addition, solid dispersion may present drugs as supersaturated solutions which are considered to be metastable polymorphic form. Thus, it increases the solubility of the particles by presenting the drug in an amorphous form.14,15
Another technique is the inclusion complexation with β-cyclodextrin (β-CD) or its derivatives; it increases the aqueous solubility of many water-insoluble drugs and increases the bioavailability and the pharmacological effect.16–18 This increase in the pharmacological effect resulted in reducing the administered dose of the drug.7 Studies reported that the release of enthalpy-rich water molecules from the CD’s cavity is the driving force for the insertion of the guest molecule into the internal cavity.19 The attraction forces between the guest molecule and CD may include hydrogen bonds, hydrophobic interactions, van der Waals forces, and charge-transfer interactions. For inhibiting polymorphic transitions and crystallization rates during storage, hydroxypropyl-β-cyclodextrin (HP-β-CD) is useful. This is very important to maintain higher dissolution characteristics of water-insoluble drugs with storage.20 Many evaluating parameters were employed to assess the quality of the formed inclusion complex. Among these parameters, stability constant (Kc) is crucial for determining the degree of complex stability. Contrary to what is believed, very stable complexes represent great obstacle against the absorption of drugs from GIT,21,22 while complexes with lower values of Kc are unstable, and both of them have limited industrial applications.
Recently, nanotechnology has been introduced to improve the solubility and the dissolution velocity of water-insoluble drugs. There are two main approaches for the preparation of drug nanoparticles: the first is a top-down process which includes comminution of particles to smaller size and the second is bottom-up processes that involve nucleation of particles from the molecular state.23 However, aggregation of particles is still the major disadvantage due to the small size and large surface area which make laboratory and industrial handling of nanoparticles difficult in either liquid or dry forms.24 Newer biocompatible nanocomposites, such as nanoparticles and nanocapsules, were developed and may overcome this problem.
Many researchers tried to overcome the low solubility problem of CC. But limited numbers of polymers were employed with limited selected polymer ratios. Some of them are unsuitable for industrial applications. In addition, no comparisons were made between the different techniques which are very important for selecting the most appropriate one. In addition, some studies carried out in vitro investigations only, while pharmacokinetic evaluations of the selected formulations were not touched.
So, this work aimed to improve the dissolution velocity of CC via preparation of solid dispersions using different polymers by solvent evaporation method and fusion method. Also, inclusion complexation with β-CD and HP-β-CD was prepared by co-evaporation and evaluated for industrial applications. Finally, nanoparticles of CC were prepared by solvent evaporation method using various polymers. The prepared samples were physicochemically evaluated, and those that gave the highest dissolution rate were further investigated for their bioavailability enhancements.
Materials and Methods
Materials
Candesartan cilexetil is a gift sample provided by Pharaonia Pharmaceuticals, Egypt. Polyvinylpyrrolidone K-30 (PVP K-30), polyvinylpyrrolidone K-90 (PVP K-90), sodium laurylsulphate (SLS), pitavastatin, polyethylene glycol (PEG), β-cyclodextrin (β-CD), and hydroxypropyl-β-cyclodextrin (HP-β-CD) were purchased from Sigma-Aldrich Chemical Co., USA.
Preparation of CC Solid Dispersion
Solvent Evaporation Method
Specified amounts of CC with each polymer were dissolved in ethanol with continuous stirring. The solution was rotary-evaporated at 50ºC and 80 rpm using rotary evaporator (Heidolph, Germany). The dried mass was pulverized, sieved, and kept in desiccator pending further studies.25 This method was carried out using PVP K-30 and PVP K-90 at 1:1, 1:2, and 1:4 drug:polymer weight ratios as presented in Table 1.
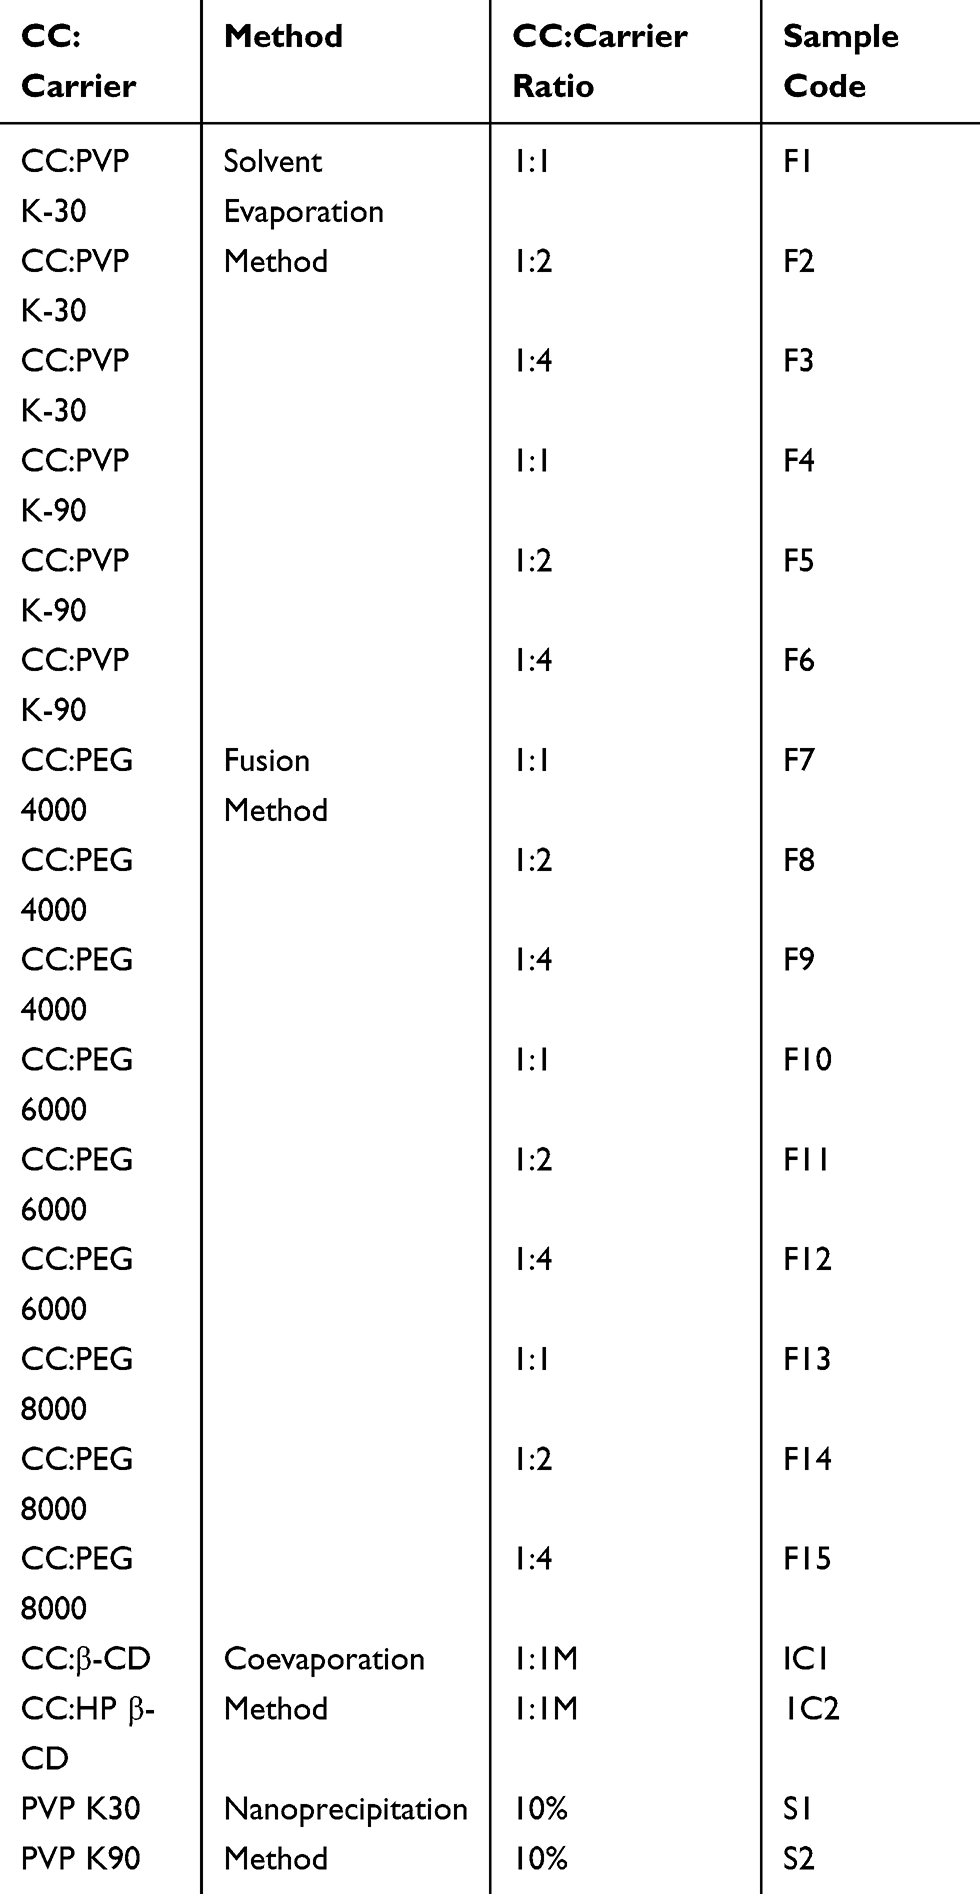 |
Table 1 Methods and Polymers Used in Preparation of Solid Dispersions, Inclusion Complexes and Nanoparticles of CC |
Fusion Method
The solid dispersions of CC with PEGs with different weight ratios (1:1, 1:2, and 1:4) were prepared by the fusion method according to the method described by Dasharath et al.26 This method is more suitable for the preparation of solid dispersions of the drug with PEGs. Accurately weighed amount of each carrier was melted at 55–63°C. To this, calculated amount of CC was mixed thoroughly for 20–30 s followed by quick cooling to 4°C. The dried mass was then pulverized, passed through 44-mesh sieve, and stored in desiccators until used. This process is carried out using PEG 4000, PEG 6000, and PEG 8000 with 1:1, 1:2, and 1:4 drug:polymer weight ratio as presented in Table 1.
Inclusion Complexation
Phase Solubility Studies of CC with β-CD and HP-β-CD
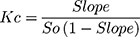
Phase solubility diagrams were carried out according to the procedures that are first described by Higuchi and Connor.27 Excess amounts of candesartan cilexetil were placed into stoppered flasks. To the flasks, 20 mL of distilled water containing different concentrations of β-CD or HP-β-CD was added. To form complexes, these stoppered flasks were placed in a thermally controlled shaker at 25°C for 72 hrs. The samples were filtered using filter disc of 45 µm, the filtrates were analyzed spectrophotometrically at λmax of 256 nm against suitable blanks prepared in the same concentrations of β-CD or HP-β-CD. The solubility constant (Kc) was calculated using the following equation:
(1)
Preparation of Candesartan Cilexetil Inclusion Complex (IC) Using Co-Evaporation Method
This method was carried out as previously described by several workers with modifications.28–30 Briefly, equimolar quantities of β-CD or HP-β-CD and CC were dissolved in 100 mL of 50% ethanol in water with the aid of bath-sonicator. The solvent was evaporated at 55°C using rotary evaporator. The obtained solid was pulverized, sieved through 44-mesh sieve, and stored in airtight containers. This process was carried out with 1:1 molar ratio of drug:CDs as obtained from phase solubility diagram (Table 1).
Molecular Docking Study
To get deep insights into the consistency of CC-β-CD and CC-HP-β-CD inclusion complexes, molecular simulations were performed using Molecular Operating Environment (MOE) 2019.01 software (Chemical Computing Group, Montreal, QC, Canada). The crystal structure of β-CD was downloaded from the Protein Data Bank (PDB) (PDB code: 5E6Z).31 On the other hand, there is no crystal structure for HP-β-CD in PDB or other structural databases. Therefore, the 3D structure of HP-β-CD was built using the crystal structure of β-CD (PDB Code: 5E6Z) as a template as described before.32 The 3D crystal structure of CC was downloaded from crystallographic data found in the Cambridge structural database (Reference Code: FETWEH).33 The applied docking method was the induced fit protocol. All other parameters were left to their MOE default settings. Finally, the resulting docking conformations were visually reviewed, and the pose with the lowest binding-free energy for each type of the two CC-CD inclusion complexes was described.
Preparation of CC Nanoparticles
Preparation of CC Nanoparticles (NP) Using Nanoprecipitation Method
Nanosuspensions were developed according to the nanoprecipitation method.34,35 In brief, each polymer (PVP K-30, PVP K-90, PEG 8000, PEG 4000, or HPMC) was dissolved in aqueous solution containing SLS, as a stabilizer, by the aid of a magnetic stirrer at 750 rpm (Table 1). Candesartan cilexetil was dissolved in the organic solvent, acetone, and injected at a very slow rate (1 mL/min) by the help of syringe to the antisolvent (aqueous solution, containing SLS and the polymer) under high-speed mechanical agitation of 5000 rpm using Probe Sonicator (Sonica, Vibracell, USA) at ultrasonic power input of 300 W for 8 mins time length to get the desired nanosuspension. To control the particle size, cooling was maintained throughout the process using ice-water. The suspensions were kept under vacuum at 25°C for 2 hrs to remove organic solvents. Finally, the system was dried by freeze dryer (Free-Zone 180, Labconco Corporation, Missouri, USA) for further characterization.36
Characterization of the Prepared Samples
The production yield of the prepared samples was determined by dividing the last weight of the samples on the initial weight of the raw materials. Data represent the mean of three determinations ± SEM.
Percent Drug Contents (%DC)
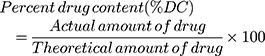
An accurately weighed 50 mg of the prepared samples were placed in a 100 mL volumetric flask, completed to the volume with ethanol, and sonicated in an ultrasonic bath for 30 mins. The sample was filtered, and the drug contents were determined. The absorbance was measured spectrophotometrically at 256 nm, as previously mentioned, against a suitable blank. Percent drug contents were calculated from the following equation:
(2)
Particle Size and Surface Charge Determination
The mean particle size and particle size distribution of CC nanoparticles were determined by Nanosizer (Quantachrome CLIAS00, France) at ambient temperature. In order to get appropriate concentrations for measuring the particle size, samples were diluted with double-distilled water. Data are presented as mean of three determinations ± SEM. Zeta potential (ζ) of the prepared nanoparticles was measured by the same apparatus. Results were calculated automatically using Smoluchowski equation:
(3)
where ζ is the zeta potential, M is the mobility, e is the dielectric constant, and h is the absolute viscosity of electrolyte solution.
Transmittance Electron Microscope (TEM)
In order to investigate the morphology of nanoparticles, selected samples of nanoparticles were examined under TEM (JEM100 CX 11, Japan). The nanosuspension sample was diluted, and a drop was left for 30 into the copper mesh grids prior to staining process. Staining was carried out using potassium phosphotungstate dye.37
Physicochemical Studies
Powder X-Ray Diffraction (PXD)
The X-ray diffractogram was obtained using X-Ray apparatus (Joel XR diffractometer). The source of radiation was CuKα radiation operated at 35 KV and a current of 15 mA. The diffractograms were obtained using continuous mode with 2θ values ranging from 4 to 100 at a rate of 2 degrees/min.
Fourier Transform Infrared (FT-IR) Spectroscopy
FT-IR spectroscopy was carried out using potassium bromide (KBr) method. Typically, 1–4 mg of each sample was mixed with KBr and compressed into discs. Scanning was carried out using NICOLET 6700 FT-IR spectrophotometer over the range of 600–4000 Cm−1. A blank KBr pellet was used as a reference.
Differential Scanning Calorimetry (DSC)
Thermal investigations of CC, polymer, physical mixture (PM) of CC with polymer, and different prepared samples were measured using differential scanning calorimetry (PerkinElmer, 2-C, NY, USA). Procedures were done as previously described by several workers.5,13 The sample was heated from 30°C to 300°C at a rate of 10°C/min.
Dissolution Rate Studies
Dissolution of CC and the prepared samples was carried out according to USP40 using USP dissolution test apparatus II (Hanson Research, California, USA).38 Briefly, 16 mg of raw CC, or its equivalent of the prepared samples, were placed in 900 mL 0.05 M phosphate buffer (pH 6.5) containing 0.35% polysorbate 20. The temperature was maintained at 37°C ± 0.5°C with the paddles being kept rotating at 50 rpm. At specified time intervals, 5 mL samples were withdrawn, filtered, and assayed spectrophotometrically at 256 nm against a suitable blank. The withdrawn samples were replaced with the same volume of fresh dissolution medium maintained at the same temperature. The experiment was carried out in triplicate, and each point represents mean concentration ± SEM.
Statistical Analysis
All values were expressed as mean ± SEM. Kolmogorov–Smirnov. Tests were employed for estimating the normality of distribution. Statistical analysis was performed using one-way analysis of variance (ANOVA). The value of P less than 0.05 was considered statistically significant.
Pharmacokinetic Studies
Among the tested samples, formula F6 (CC:PVP K-90 1:4) was selected for the pharmacokinetic studies. This formula produced the highest dissolution rate; in addition, preparation of CC as SD with PVP K-90 is simple, fast, and economic.
The pharmacokinetic studies were conducted on healthy male New Zealand rabbits weighing 2.5–3 kg. In order to avoid the effect of food, animals were fasted overnight with free access to water. Animals are allocated into two groups, each consisting of 6 rabbits.
- The first group received untreated CC in a dose level of 10 mg/kg.
- The second group received formula F6 in a dose equivalent to 10 mg/kg.
The doses were given orally and suspended in starch mucilage, as a single dose via feeding tubes. For blood sampling, a cannula was inserted into the marginal ear vein. Blood samples (2.5 mL) were withdrawn periodically at specified time interval into heparinized tubes. Once withdrawn, the samples were centrifuged at 5000 rpm and 4°C for 10 mins to separate plasma which is kept at −80°C pending analysis. The guidelines followed for the welfare of the animals are described in the National Institutes of Health Guide for the Care and Use of Laboratory Animals.39 All the experiments were also approved by the commission on the ethics of scientific research, faculty of pharmacy, Minia University (Code number of the Project is 39/2019).
Plasma Extraction
Four hundred and fifty µL of plasma, 50 µL of I.S. (Pitavastatin), and 100 µL of (0.1%) formic acid were added to glass tube and vortexed for 30 s. Then, 0.5 mL of extraction solvent (diethyl ether:dichloromethane, 4:1) was added and vortexed for 2 mins. Samples were centrifuged (3000 rpm for 10 mins), and the extraction solvent was evaporated at 40ºC and finally reconstituted by adding specified volume of the mobile phase.
Analysis of Plasma Samples
Plasma samples were analyzed for the drug using Agilent UHPLC unit (Agilent Corporation, MA, USA) with a ZORBAX Eclipse Plus C18 column (1.8 μm, 2.1 × 50 mm, I.D. Agilent Corporation, MA, USA) maintained at 30°C. The mobile phase consisted of acetonitrile:distilled water (85:15). The flow rate was adjusted at 0.2 mL/min. The mass spectrometric detection was performed on Agilent 6420 triple-quadrupole mass spectrometer equipped with an electrospray ionization source (Agilent Corporation, MA, USA) in a positive mode. Quantitative analysis was performed in the multiple reaction monitoring (MRM) mode.
Pharmacokinetics Analysis
Data obtained from UHPLC experiments were utilized to establish plasma concentrations-time curve. In addition, PK solver program was used to calculate the pharmacokinetic parameters.40 All data are presented as mean ± SD.
Results and Discussion
Phase Solubility Studies
Phase solubility diagrams are shown in Figure 2. It was observed that the solubility of CC was increased as the concentration of complexing agents increased. The plot was found to be linear of A L type, indicating the formation of complexes with stoichiometric ratio of 1:1. Slopes were found to be less than unity. Stability constants of the drug (Kc) with β-CD and HP-β-CD showed values of 0.1352 mM−1 and 3.201 mM−1, respectively. According to literatures,21,22 being in the range of 0.1 and 2 mol.L−1, β-CD may have industrial application, but the ability of the complex to improve the solubility and the dissolution remains limited, while HP-β-CD may form a very stable complex which is unsuitable for industrial application. In other words, their abilities to improve the solubility, and hence the dissolution, varied. β-CD produced a limited improvement in the dissolution rate and is expected not to significantly improve the bioavailability of CC. Statistical analysis confirmed this suggestion (P>0.05). While HP-β-CD can theoretically improve the solubility (P<0.001) but may also result in forming a very stable complex, as discussed above, that may affect its liberation in blood and exertion of its pharmacological effect.
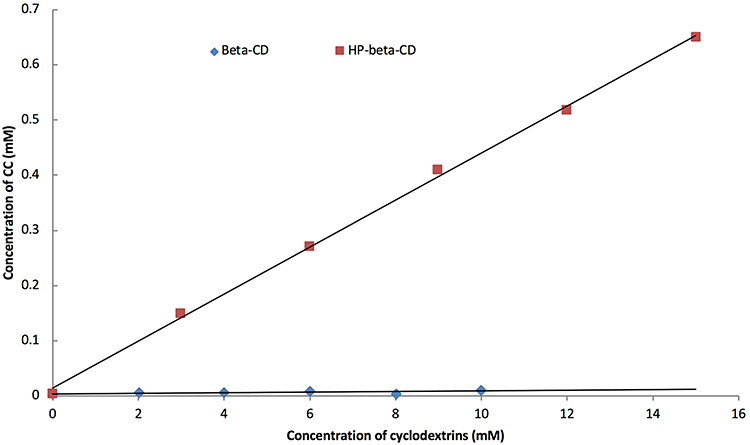 |
Figure 2 Phase solubility diagram of CC/β-CD and CC/HP-β-CD in water at 250°C. |
Drug Contents and Particle Size Analysis of the Prepared Nanoparticles
The production yields for the two samples (S1 and S2) were 94.3% ± 2.6 and 95.2% ± 3.2. The drug contents for both samples were 99.4% ± 1.2 and 98.6% ± 1.8, respectively. The average particle sizes of the two samples are recorded in Table 2. It was noticed that the smallest particle size was achieved with formulations S1 and S2 that were prepared using PVP K-30 and PVP K-90, respectively, with acceptable PDI values. Other polymers failed to produce nanosized particles of the drug (Data are shown for both S1 and S2 only). It is needless to say that the reduction in particle sizes may provide larger surface area for rapid dissolution of the drug.41 Zeta potentials (ζ) of S1 and S2, Figure 3, were found to be −43 (mV) and −23 (mV), respectively, reflecting the relative stability of the prepared nanoparticles as surface charges may prevent the aggregation and the agglomeration of the prepared particles.23 It is important to mention that zeta potential is not a direct measure of the surface charge; however, it was calculated mathematically from the electrostatic potential at the imaginary surface of hydrodynamic shear. Studies demonstrated that values of zeta potential above ±30 mV were preferred to exert repulsive forces that prevent aggregation of particles.42 TEM images, Figure 4, showed uniform size of both S1 and S2 nanoparticles that are approximately spherical in shape.
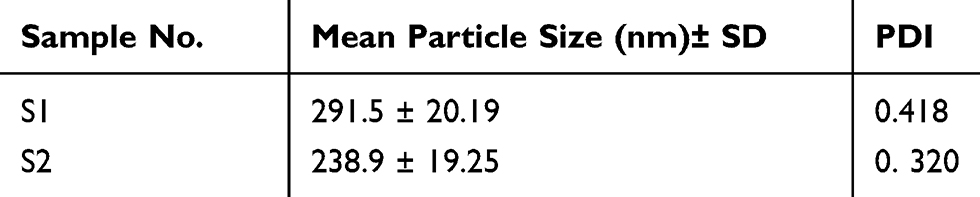 |
Table 2 Average Particle Size of CC Nanoparticles |
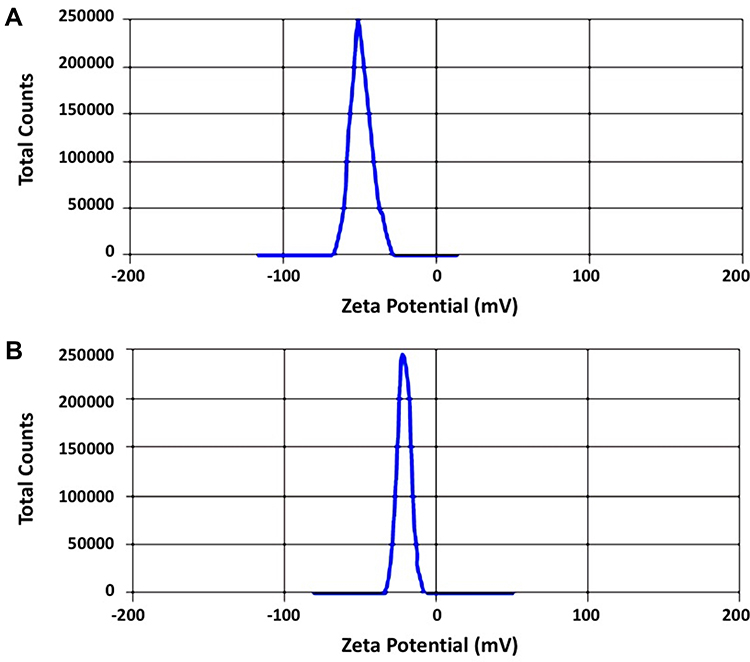 |
Figure 3 Zeta potential (ζ) of the prepared nanoparticles: (A) S1 and (B) S2. |
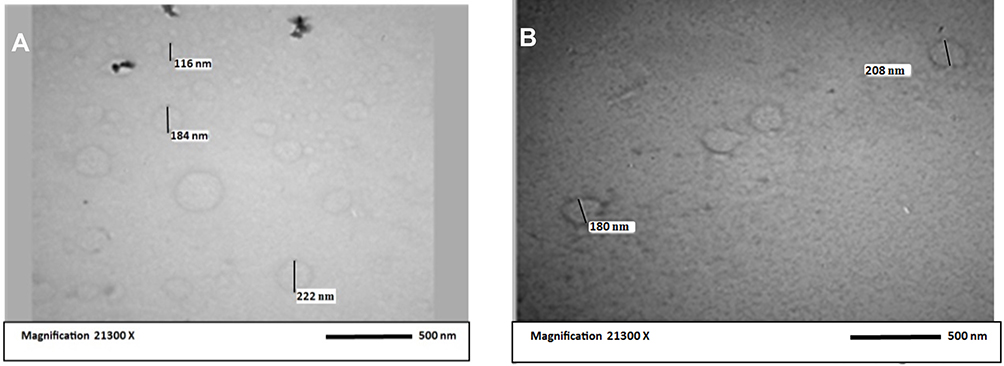 |
Figure 4 TEM images of the prepared nanoparticles: (A) S1 and (B) S2. |
Physicochemical Studies
Physicochemical characterizations were carried out for all of the investigated polymers. The data was displayed for polymers that produced higher dissolution rate only. Among the tested PVP and PEG prepared samples, PVP K-90 (1:4) and PEG 8000 (1:4) drug:polymer ratios were selected for testing their physicochemical properties, as these two samples produced higher dissolution rate than other prepared PVPs and PEGs samples. In addition, HP-β-CD gave higher dissolution rate than did β-CD. In case of NP, the two prepared samples were physicochemically investigated.
Powder X-Ray Diffraction (PXD) Patterns
X-ray diffraction patterns of CC, polymers, PM, and the prepared samples are displayed in Figure 5. The X-ray diffraction pattern of CC/PVP K-90 showed that CC exhibits major crystalline peaks at 2θ values of ~10, 17, 20, and 24 in addition to other smaller peaks, indicating the high crystallinity of the drug. PVP K-90 diffractogram showed an amorphous hump without any characteristic peaks. PM diffractogram showed the major characteristic peaks of the drug at their proper position but with lower intensity, while the SD diffractograms showed complete disappearance of CC peaks, suggesting that the drug did not recrystallize during the preparation of SDs subsequent to the evaporation of the solvent. These results suggested the presence of intermolecular interactions between the functional groups of the PVP and the drug that resulted in the presence of CC in an amorphous form in the SDs. For CC/PEG 8000, PEG 8000 diffractogram showed major crystalline peaks at 2θ values of ~19 and 27. The solid dispersion diffractogram differed from its corresponding PM, and some of the characteristic peaks of the drug either disappeared or appeared with lower intensity, indicating the presence of the drug in less crystalline state within the solid dispersion.
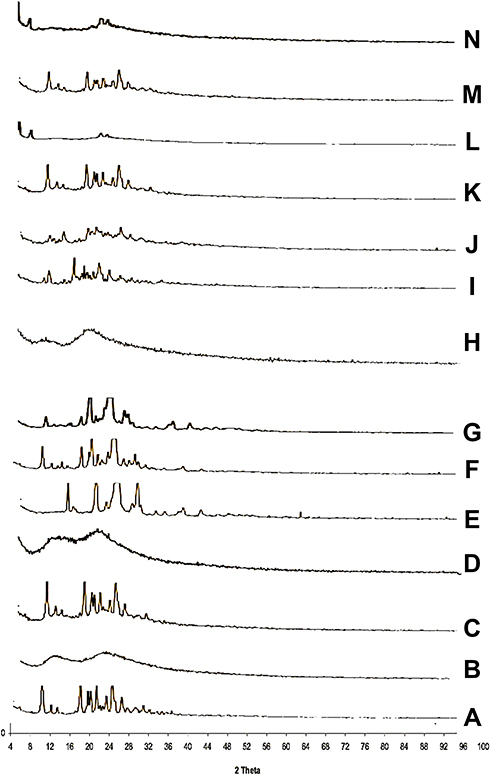 |
Figure 5 X-ray diffraction patterns of (A) CC, (B) PVP-K90, (C) PM with PVP-K90, (D) SD with PVP-K90, (E) PEG8000, (F) PM with PEG 8000, (G) SD with PEG 8000, (H) HP-β-CD, (I) PM with HP β-CD, (J) IC with HP β-CD, (K) PM with PVP-K30, (L) nano with PVP-K30, (M) PM with PVP-K90, and (N) nanoparticles with PVP-K90. |
In case of inclusion complexes, HP-β-CD diffractogram showed that an amorphous hump indicated an amorphous structure of HP-β-CD. In the ICs, the peaks intensities of the drug were markedly decreased, indicating partial inclusion of the drug within the cavity of the CDs.
Regarding the prepared nanoparticles, NP diffractogram showed complete disappearance of the major peaks of drug in both samples, indicating the presence of CC in the amorphous form within the prepared NP.
Fourier Transforms Infrared (FT-IR) Spectroscopy
In order to investigate the intermolecular interactions, FT-IR spectra for CC, polymers, and different samples were studied. The PMs were included for comparisons with the SDs. Results are shown in Figure 6. Candesartan cilexetil displayed a characteristic peak for the N-H stretching vibration at 3406.9 cm−1 and a band with strong intensity at 1752.5 cm−1 indicative of the C=O stretching of the ester group. The methyl group, CH3, showed a peak at 2940.1 cm−143 For PVP K-90 system, FT-IR spectrum of SD displayed differences in the shape and position of the above-mentioned bands. The presence of hydrogen bonding is indicated from band shifts associated with the potential hydrogen bond donating group N-H on CC and the strong hydrogen bonding accepting group –OH on polymer carrier. The PM showed the peaks of CC in their proper wave number, without significant band shifts. FT-IR spectrum of PEG 8000 showed a characteristic band at 3426 cm−1 due to –OH group, and another band appeared at 2888 cm−1 due to -CH. All bands of CC appear in PM at their proper position. However, a change in their shapes and positions occurs in SD suggesting the formation of hydrogen bond between –OH of PEG and C=O group of CC as indicated by broad band in the region 3200–3600 cm−1.
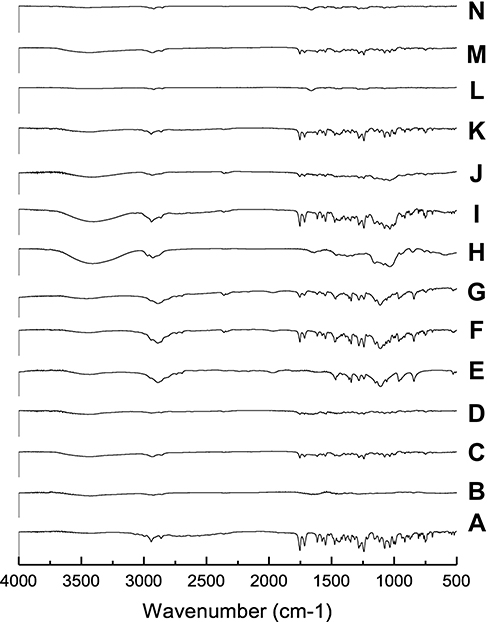 |
Figure 6 FT-IR of (A) CC, (B) PVP-K90, (C) PM with PVP-K90, (D) SD with PVP-K90, (E) PEG8000, (F) PM with PEG 8000, (G) SD with PEG 8000, (H) HP-β-CD, (I) PM with HP β-CD, (J) IC with HP β-CD, (K) PM with PVP-K30, (L) Nano with PVP-K30, (M) PM with PVP-K90, and (N) nanoparticles with PVP-K90. |
IR spectrum of CD was characterized by intense bands at 3300–3500 cm−1 due to –OH groups of CD. In addition, two bands appeared at 2925 cm−1 and 1640 cm−1 due to -CH and C=O, respectively.44 In contrary to PM, IR spectrum of the prepared samples indicated that most of the absorption bands in the region 2500–3500 cm−1 were masked by the bands of CDs, with complete disappearance of CC bands in this region. The broad band at 3000–3500 cm−1 may indicate the possibility of hydrogen bonding of carbonyl C=O group of CC with –OH of HP-β-CD.
IR spectrum of CC nanoparticles with PVP K-90 was discussed above.
Differential Scanning Calorimetry (DSC)
DSC thermograms of CC, polymers, PM, and the prepared samples are displayed in Figure 7. It could be observed from Figure 7A that CC has a sharp endothermic peak at 171ºC corresponding to its melting point followed by an exothermal peak, may be ascribed to decomposition of the drug. Concerning PVP K-90 thermogram, Figure 7B shows a broad endotherm over the temperature range from 80°C to 115ºC, which attributed to the loss of residual moisture present in PVP K-90.43 DSC thermogram of PM showed a small shift of the drug peak that disappeared in SD confirming the presence of interaction between the drug and the polymer. With regard to CC/PEG 8000 system, Figure 7E, PEG showed a sharp endothermic peak at 65ºC corresponding to its melting point. The DSC thermograms of both PM and SD showed disappearance of the peak of CC that may suggest possible solubility of CC within PEG. Figure 7H (HP-β-CD) showed a broad endotherm in the region of 70–120 ºC that could be attributed to the release of water molecules from the cavity of CD. While DSC thermogram of PM showed the two characteristic peaks for both CC and polymer at their proper position, the DSC thermogram of IC showed disappearance of CC band, suggesting the formation of inclusion complex between CC and polymer.
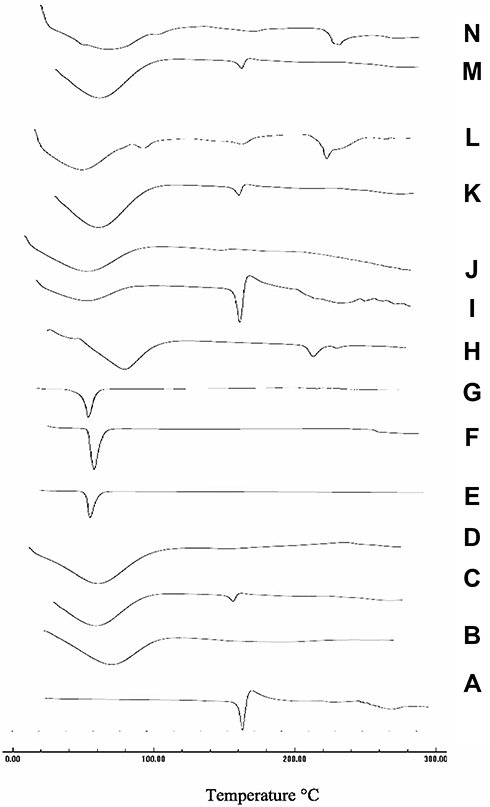 |
Figure 7 DSC thermograms of (A) CC, (B) PVP-K90, (C) PM with PVP-K90, (D) SD with PVP-K90, (E) PEG8000, (F) PM with PEG 8000, (G) SD with PEG 8000, (H) HP-β-CD, (I) PM with HP β-CD, (J) IC with HP β-CD, (K) PM with PVP-K30, (L) Nano with PVP-K30, (M) PM with PVP-K90, and (N) nanoparticles with PVP-K90. |
DSC thermogram of nanoparticles, Figure 7K and N, showed a small shift in the position of CC peak and decrease in its intensity in the PM that nearly disappeared in the prepared nanoparticles.
Molecular Docking Study
Molecular modeling is one of the finest techniques to calculate the drug orientations and interactions, at the molecular level, within cyclodextrins hydrophobic cavity and their hydrophilic edges.45 Therefore, molecular docking simulation of CC-β-CD and CC-HP-β-CD complexes was performed via MOE program. The molecular docking results are summarized in Figure 8. The binding energies calculated for CC-β-CD and CC-HP-β-CD inclusion complexes were −8.4 kcal/mol and −9.2 kcal/mol, respectively. The size of HP-β-CD cavity is larger than β-CD cavity, because it has an extra extension result from the hydroxypropyl replacement in comparison with β-CD. As depicted in Figure 8A, the cavity size of β-CD was small for hosting CC with only one hydrophobic (CH-) interaction resulting in a less stable complex with binding constant of −8.4 kcal/mol (Figure 8C). Conversely, the candesartan moiety was completely buried in HP-β-CD (Figure 8B) in addition to electrostatic interaction (H-bonding) between carboxylate group (C=O) of CC and the hydroxyl (OH) group of the 2-hydroxypropyl radical of HP-β-CD (Figure 8D). This interaction results in a very stable complex with a binding energy of −9.2 kcal/mol. These results allied well with FT-IR and DSC results (Figures 6 and 7), where a band at 3000–3500 cm−1 appeared more broad and the CC melting peak disappeared with the processed mixture of CC and HP-β-CD, demonstrating a strong physicochemical interaction. Similar results of the CC docking pose with HP-β-CD have been reported recently.46 To sum up, the differences observed in the binding energy, as well as the number and the type of interactions between CC-β-CD and CC-HP-β-CD complexes, approve the higher affinity of CC towards HP-β-CD rather than β-CD. This calculation associated well with the experimental stability constants values of CC with β-CD and HP-β-CD.
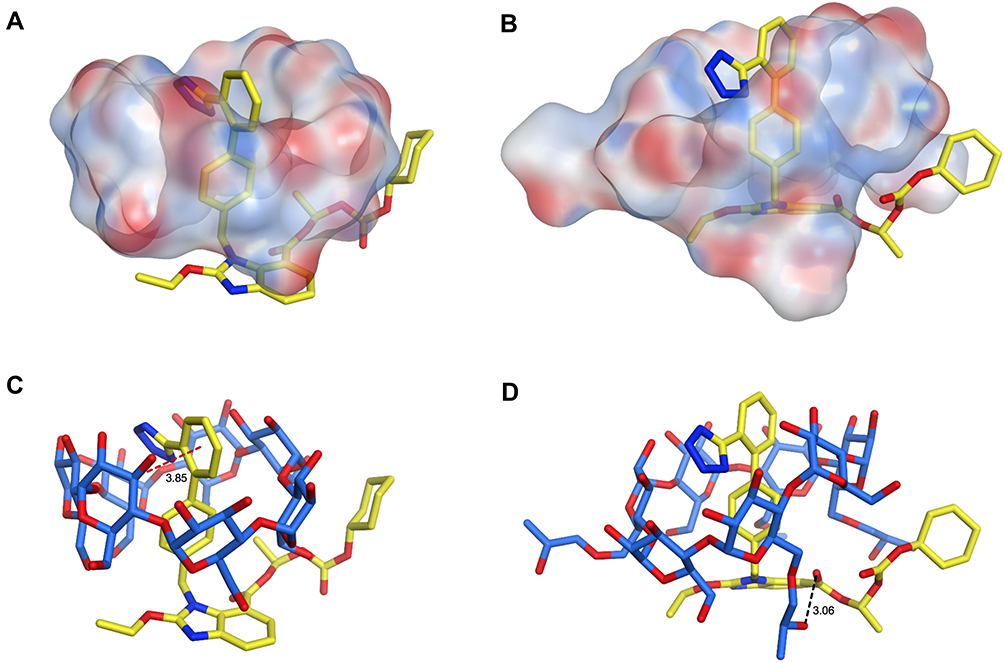 |
Figure 8 The 3D structures of CC and two cyclodextrins (β-CD and HP-β-CD), showing the predicted orientations of CC within the hydrophobic cavity of β-CD (A) and HP-β-CD (B) from the side view as well as its binding interactions with the hydrophilic edges of β-CD (C) and HP-β-CD (D) as stick molecular depiction. Hydrogen bonds and hydrophobic interactions are demonstrated as black and red dashed lines, respectively. |
Dissolution Rate Studies
Figure 9A displays the dissolution rate of CC/PVP K-30 system. Both 1:1 and 1:2 CC:polymer weight ratio did not produce significant increases in the dissolution rate (P>0.05). However, 1:4 drug:polymer ratio produced a significant (P<0.01) increase in the dissolution velocity. Regarding PVP K-90, Figure 9B, the polymer increased the dissolution rate significantly even at 1:1 ratio. Nearly 95% of the drug was dissolved by the end of the first hour of the experiment. This could be attributed to the formation of hydrogen bonding and the presence of the drug in less crystalline or amorphous form, as illustrated by the physicochemical investigations. Regarding PEGs, PEG 8000 increased the dissolution rate insignificantly (P>0.05) at 1:1 and 1:2 drug:polymer ratios, Figure 9E. PEG 4000 and PEG 6000 produced significant increases in dissolution rate at the same ratios (P<0.05), Figure 9C and D. All PEGs produced significant differences (P<0.01) at 1:4 drug:polymer ratios. The improvement of dissolution rate in SD could be generally ascribed to higher wettability, and dispersibility of drug with hydrophilic carrier resulted in greater wetting and increased surface available for dissolution.36
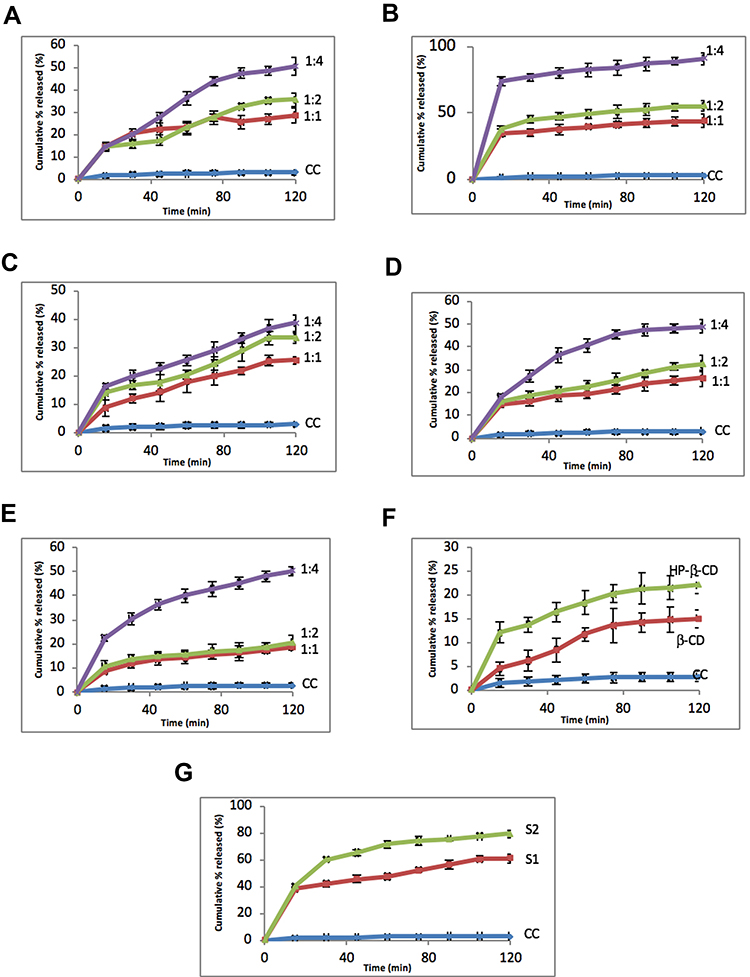 |
Figure 9 Issolution rate of (A) CC/PVP-K30, (B) CC/PVP-K90, (C) CC/PEG4000, (D) CC/PEG6000, (E) CC/PEG8000, (F) CC/CD, and (G) CC/NP. Data represent mean cumulative % released ± SEM. |
Insignificant increase in the dissolution rate of CC was produced by β-CD, while HP-β-CD improved the dissolution velocity in a significant manner (P<0.05), Figure 9F. Results of dissolution with cyclodextrins are somewhat expected. β-CD poorly interacted with the drug as indicated by physicochemical and docking studies.
The dissolution rate of CC in the nanoparticles was significantly (P<0.001) increased. After 2 hrs, ~63% and ~77% of the drug were dissolved from S1 and S2, respectively, Figure 9G. The reductions in particle size combined with the interaction between CC and the polymers may explain this higher dissolution rate.
Pharmacokinetic Studies
Figure 10 shows UPLC mass spectra for the solid dispersions of the drug obtained after oral administration of CC. The retention times were 2.1 mins for the internal standard (Pitavastatin) and 2.9 min for CC.
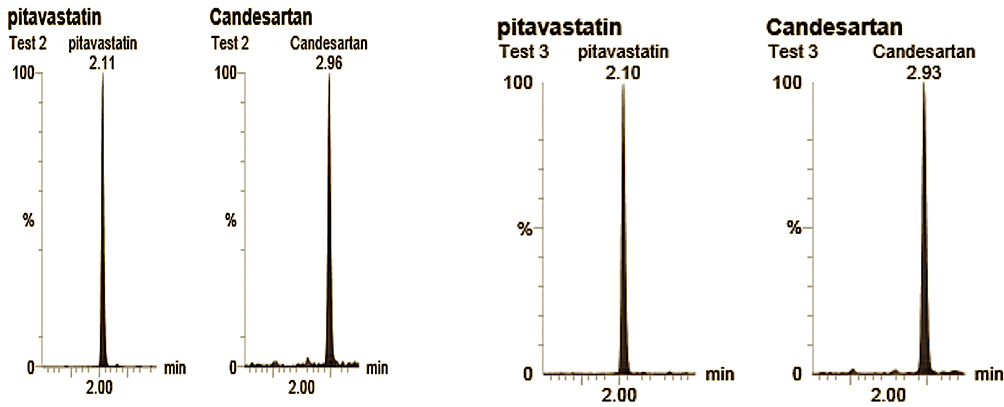 |
Figure 10 UPLC MS/MS spectrum of Candesartan and the I.S. (Pitavatatin) showing the retention time of CC and I.S. |
Candesartan plasma concentration versus time data after oral administration of 20 mg of CC as SD could be best described by a one-compartment model with first-order absorption and elimination. The results obtained are reported in Table 3 and depicted in Figure 11, and the AUC0-∞ obtained for SD was 342.06 ± 13.57 ng/mL·h which is approximately twofold and significantly higher than that obtained by CC alone (159.93 ± 12.74 ng/mL·h). These results could be attributed to the higher dissolution rate of the SD and the lower solubility of untreated CC. This higher AUC is combined with a pronounced, statistically significant (P>0.01) elevation in Cmax and slight lowering of Tmax values. Cmax of the prepared SD was 135.32 ± 2.11 ng/mL which is three times higher than that produced by CC alone. The area under first moment curve (AUMC) is ordinarily obtained by plotting plasma concentration multiplied by time against time of sampling. So it is not surprising that AUMC of the SD (1217.8 ± 25.46 ng/mL·h2) was numerically and statistically higher than the drug alone (570.23 ± 19.11 ng/mL·h2). Mean residence time, in turn, remained nearly constant. It could be also noticed that the solid dispersions resulted in faster absorption rate than the drug alone as illustrated from the figure, while the elimination rate constant (K) remained unchanged in both samples. The enhancement of the bioavailability produced by the SD will, of course, be reflected on the pharmacological action of CC. It would perform its antihypertensive action more efficiently or even lower doses of the drug will be needed to exert the same pharmacological action.
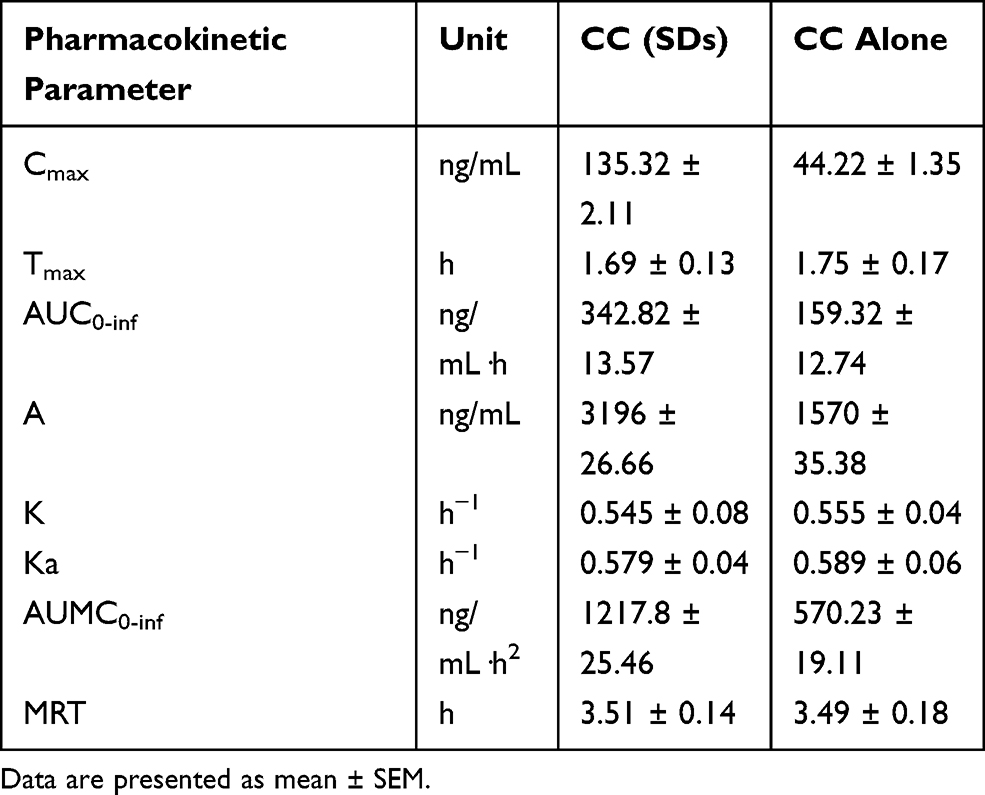 |
Table 3 Pharmacokinetic Parameters of Candesartan in Plasma of Rabbit After Oral Administration of 20 Mg of CC as a Solid Dispersion and CC Alone. |
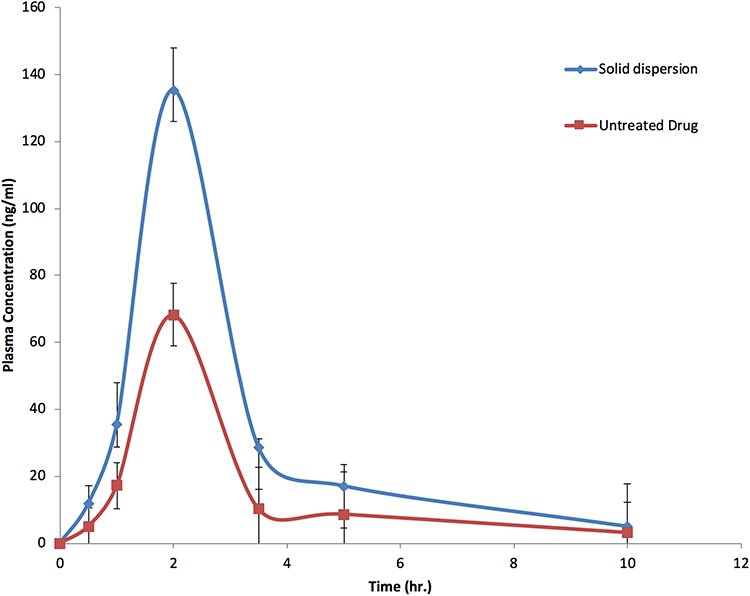 |
Figure 11 Concentration-time profiles of CC alone and in SDs with PVP K-90 (data displayed±SEM). |
Conclusions
It was concluded that the dissolution rate of CC was significantly improved when formulated as SDs. Physicochemical evaluations revealed the presence of interaction, may be hydrogen bonding, between the drug and the investigated polymers. Animal studies confirmed that the bioavailability of CC was significantly improved when formulated as SDs with PVP K-90 with 1:4 drug:polymer ratio.
Data Sharing Statement
All the data supporting the results of this study are included in the article.
Disclosure
The authors report no conflicts of interest in this work.
References
1. Siddiqui N, Husain A, Chaudhry L, Alam MS, Mitra M, Bhasin PS. Pharmacological and pharmaceutical profile of valsartan: a review. J Appl Pharm Sci. 2011;8.
2. Israili ZH. Clinical pharmacokinetics of angiotensin II (AT1) receptor blockers in hypertension. J Hum Hypertens. 2000;14 Suppl 1:S73–86. doi:10.1038/sj.jhh.1000991
3. Meredith PA. Candesartan cilexetil–a review of effects on cardiovascular complications in hypertension and chronic heart failure. Curr Med Res Opin. 2007;23(7):1693–1705. doi:10.1185/030079907x210723
4. Ostergren J. Candesartan for the treatment of hypertension and heart failure. Expert Opin Pharmacother. 2004;5(7):1589–1597. doi:10.1517/14656566.5.7.1589
5. Ross A, Papademetriou V. Candesartan cilexetil in cardiovascular disease. Expert Rev Cardiovasc Ther. 2004;2(6):829–835. doi:10.1586/14779072.2.6.829
6. Rossi S. Australian Medicines Handbook 2006. Australian Medicines Handbook; 2006.
7. Husain A, Azim M, Mitra M, Bhasin P. A review on candesartan: pharmacological and pharmaceutical profile. J Appl Pharm Sci. 2011;01:12–17.
8. Vasconcelos T, Sarmento B, Costa P. Solid dispersions as strategy to improve oral bioavailability of poor water soluble drugs. Drug Discov Today. 2007;12(23–24):1068–1075. doi:10.1016/j.drudis.2007.09.005
9. Cagigal E, González L, Alonso RM, Jiménez RM. pK(a) determination of angiotensin II receptor antagonists (ARA II) by spectrofluorimetry. J Pharm Biomed Anal. 2001;26(3):477–486. doi:10.1016/s0731-7085(01)00413-7
10. Sekiguchi K, Obi N. Studies on absorption of eutectic mixture. I. A comparison of the behavior of eutectic mixture of sulfathiazole and that of ordinary sulfathiazole in man. Chem Pharm Bull (Tokyo). 1961;9(11):866–872. doi:10.1248/cpb.9.866
11. Fathanah A, Setyawan D, Sari R. Improving solubility and dissolution of meloxicam by solid dispersion using hydroxypropyl methylcellulose 2910 3 cps and nicotinamide. J Basic Clin Physiol Pharmacol. 2019;30. doi:10.1515/jbcpp-2019-0249.
12. Febriyenti F, Rahmi S, Halim A. Study of gliclazide solid dispersion systems using PVP K-30 and PEG 6000 by solvent method. J Pharm Bioallied Sci. 2019;11(3):262–267. doi:10.4103/jpbs.JPBS_87_18
13. Real D, Orzan L, Leonardi D, Salomon CJ. Improving the dissolution of triclabendazole from stable crystalline solid dispersions formulated for oral delivery. AAPS PharmSciTech. 2019;21(1):16. doi:10.1208/s12249-019-1551-4
14. Damodharan N. Preparation and evaluation of solid dispersion of candesartan cilexetil. J Pharm Res. 2012;1:5.
15. Schönbeck C, Gaardahl K, Houston B. Drug solubilization by mixtures of cyclodextrins: additive and synergistic effects. Mol Pharm. 2019;16(2):648–654. doi:10.1021/acs.molpharmaceut.8b00953
16. Mohamed Ameen H, Kunsági-Máté S, Bognár B, Szente L, Poór M, Lemli B. Thermodynamic characterization of the interaction between the antimicrobial drug sulfamethazine and two selected cyclodextrins. Molecules. 2019;24(24):4565. doi:10.3390/molecules24244565
17. Yousaf AM, Qadeer A, Raza SA, et al. Influence of levodropropizine and hydroxypropyl-β-cyclodextrin association on the physicochemical characteristics of levodropropizine loaded in hydroxypropyl-β-cyclodextrin microcontainers: formulation and in vitro characterization. Polim Med. 2019;49(1):35–43. doi:10.17219/pim/111887
18. Ma Z, Wang N, He H, Tang X. Pharmaceutical strategies of improving oral systemic bioavailability of curcumin for clinical application. J Control Release. 2019;316:359–380. doi:10.1016/j.jconrel.2019.10.053
19. Jyothi SA, Reddy BS, Navatha A. Enhancing the solubility of candesartan cilexetil-inclusion complexation using β-CD. Int J Drug Deliv. 2013;5(1):88–93.
20. Uekama K, Hirayama F, Arima H. Pharmaceutical applications of cyclodextrins and their derivatives. In: Dodziuk H, editor. Cyclodextrins and Their Complexes. John Wiley & Sons, Ltd; 2006:381–422. doi:10.1002/3527608982.ch14.
21. Carrier RL, Miller LA, Ahmed I. The utility of cyclodextrins for enhancing oral bioavailability. J Control Release. 2007;123(2):78–99. doi:10.1016/j.jconrel.2007.07.018
22. Rama A, Veiga F, Figueiredo I, Sousa A, Caramona M. Biopharmaceutical aspects of formulation of medicines for neonates. Basics of Indomethacin complexation with hydroxypropyl-β-cyclodextrin for oral treatment of ductus arteriosus closure. Braz J Pharm Sci. 2005;41:281.
23. Müller RH, Jacobs C, Kayser O. Nanosuspensions as particulate drug formulations in therapy: rationale for development and what we can expect for the future. Adv Drug Deliv Rev. 2001;47(1):3–19. doi:10.1016/S0169-409X(00)00118-6
24. Mohanraj VJ, Chen Y. Nanoparticles - A review. Tropical J Pharm Res. 2006;5(1):561–573. doi:10.4314/tjpr.v5i1.14634
25. Franco M, Trapani G, Latrofa A, et al. Dissolution properties and anticonvulsant activity of phenytoin-polyethylene glycol 6000 and -polyvinylpyrrolidone K-30 solid dispersions. Int J Pharm. 2001;225(1–2):63–73. doi:10.1016/s0378-5173(01)00751-7
26. Patel DM, Patel SP, Patel CN. Formulation and evaluation of fast dissolving tablet containing domperidone ternary solid dispersion. Int J Pharm Investig. 2014;4(4):174–182. doi:10.4103/2230-973X.143116
27. HIGUCHI T. A phase solubility technique. Adv Anal Chem Instrum. 1965;4:117–211.
28. Reddy MN, Rehana T, Ramakrishna S, Chowdhary KPR, Diwan PV. Beta-cyclodextrin complexes of celecoxib: molecular-modeling, characterization, and dissolution studies. AAPS PharmSci. 2004;6(1):E7. doi:10.1208/ps060107
29. Grillo R, de Melo NFS, Moraes CM, et al. Study of the interaction between hydroxymethylnitrofurazone and 2-hydroxypropyl-β-cyclodextrin. J Pharm Biomed Anal. 2008;47(2):295–302. doi:10.1016/j.jpba.2008.01.010
30. Mennini N, Maestrelli F, Cirri M, Mura P. Analysis of physicochemical properties of ternary systems of oxaprozin with randomly methylated-ß-cyclodextrin and l-arginine aimed to improve the drug solubility. J Pharm Biomed Anal. 2016;129:350–358. doi:10.1016/j.jpba.2016.07.024
31. Feng L, Fawaz R, Hovde S, Sheng F, Nosrati M, Geiger JH. Crystal structures of Escherichia coli branching enzyme in complex with cyclodextrins. Acta Crystallogr D Struct Biol. 2016;72(Pt 5):641–647. doi:10.1107/S2059798316003272
32. Abdelkader H, Fathalla Z, Moharram H, Ali TFS, Pierscionek B. Cyclodextrin enhances corneal tolerability and reduces ocular toxicity caused by diclofenac. Oxid Med Cell Longev. 2018;2018. doi:10.1155/2018/5260976
33. Fernandez D, Vega D, Ellena J. Candesartan cilexetil, an antihypertensive agent containing an extended double ester chain. Acta Crystallogr Sect E Struct Rep Online. 2005;61. doi:10.1107/S1600536805000097/cv6437Isup2.hkl.
34. Suri SS, Fenniri H, Singh B. Nanotechnology-based drug delivery systems. J Occup Med Toxicol. 2007;2:16. doi:10.1186/1745-6673-2-16
35. Devalapally H, Chakilam A, Amiji MM. Role of nanotechnology in pharmaceutical product development. J Pharm Sci. 2007;96(10):2547–2565. doi:10.1002/jps.20875
36. Raval A, Patel M. Preparation and characterization of nanoparticles for solubility and dissolution rate enhancement of meloxicam. Intl R J of Pharm. 2011;1(2):42–49.
37. Liu T, Guo R. Investigation of PEG 6000/Tween 80/Span 80/H2O niosome microstructure. Colloid Polym Sci. 2007;285(6):711–713. doi:10.1007/s00396-006-1627-z
38. Amer AM, Allam AN, Abdallah OY. Evaluation of the discriminatory power of USP dissolution method for candesartan cilexetil tablets through testing of marketed products in Egypt. Dissolution Technol. 2018;25(4):40–46. doi:10.14227/DT250418P40
39. National Research Council. Guide for the Care and Use of Laboratory Animals.
40. Zhang Y, Huo M, Zhou J, Xie S. PKSolver: an add-in program for pharmacokinetic and pharmacodynamic data analysis in microsoft excel. Comput Methods Programs Biomed. 2010;99(3):306–314. doi:10.1016/j.cmpb.2010.01.007
41. Hattori Y, Haruna Y, Otsuka M. Dissolution process analysis using model-free Noyes-Whitney integral equation. Colloids Surf B Biointerfaces. 2013;102:227–231. doi:10.1016/j.colsurfb.2012.08.017
42. Hunter R. Zeta Potential in Colloid Science: Principles and Applications. Academic Press; 1988.
43. Katti V, Kadam A, Honmane S, Patil S, Patil S, Bhamare K. Improvement of solubility and dissolution rate of candesartan cilexetil by solid dispersion in polyvinyl pyrrolidone. Int J Pharm Sci Res. 2014;5:1550–1556. doi:10.13040/IJPSR.0975-8232.5(4).1550-56
44. Mady FM, Aly UF. Experimental, molecular docking investigations and bioavailability study on the inclusion complexes of finasteride and cyclodextrins. Drug Des Devel Ther. 2017;11:1681. doi:10.2147/DDDT.S135084
45. Li J, Jiang Q, Deng P, et al. The formation of a host-guest inclusion complex system between β-cyclodextrin and baicalin and its dissolution characteristics. J Pharm Pharmacol. 2017;69(6):663–674. doi:10.1111/jphp.12708
46. Ntountaniotis D, Andreadelis I, Kellici TF, et al. Host-guest interactions between candesartan and its prodrug candesartan cilexetil in complex with 2-hydroxypropyl-β-cyclodextrin: on the biological potency for angiotensin II antagonism. Mol Pharm. 2019;16(3):1255–1271. doi:10.1021/acs.molpharmaceut.8b01212
 © 2020 The Author(s). This work is published and licensed by Dove Medical Press Limited. The full terms of this license are available at https://www.dovepress.com/terms.php and incorporate the Creative Commons Attribution - Non Commercial (unported, v3.0) License.
By accessing the work you hereby accept the Terms. Non-commercial uses of the work are permitted without any further permission from Dove Medical Press Limited, provided the work is properly attributed. For permission for commercial use of this work, please see paragraphs 4.2 and 5 of our Terms.
© 2020 The Author(s). This work is published and licensed by Dove Medical Press Limited. The full terms of this license are available at https://www.dovepress.com/terms.php and incorporate the Creative Commons Attribution - Non Commercial (unported, v3.0) License.
By accessing the work you hereby accept the Terms. Non-commercial uses of the work are permitted without any further permission from Dove Medical Press Limited, provided the work is properly attributed. For permission for commercial use of this work, please see paragraphs 4.2 and 5 of our Terms.