")
Back to Journals » Drug Design, Development and Therapy » Volume 9
Antihypercholesterolemic and antioxidant efficacies of zerumbone on the formation, development, and establishment of atherosclerosis in cholesterol-fed rabbits
Authors Hemn HO, Noordin M, Rahman H , Hazilawati H, Zuki A, Chartrand M
Received 22 October 2014
Accepted for publication 7 January 2015
Published 3 August 2015 Volume 2015:9 Pages 4173—4208
DOI https://doi.org/10.2147/DDDT.S76225
Checked for plagiarism Yes
Review by Single anonymous peer review
Peer reviewer comments 3
Editor who approved publication: Professor Min Li
Hassan Othman Hemn,1,2 Muhammad Mustapha Noordin,1 Heshu Sulaiman Rahman,1,2 Hamza Hazilawati,1 Abubakr Zuki,1 Max Stanley Chartrand3
1Department of Pathology and Microbiology, Faculty of Veterinary Medicine, Universiti Putra Malaysia, Serdang, Selangor, Malaysia; 2College of Veterinary Medicine, University of Sulaimani, Sulaimani City, Kurdistan, Republic of Iraq; 3DigiCare, Behavioral Research, Casa Grande, AZ, USA
Abstract: Owing to the high incidence of cholesterol-induced cardiovascular disease, particularly atherosclerosis, the current study was designed to investigate the preventive and therapeutic efficacies of dietary zerumbone (ZER) supplementation on the formation and development of atherosclerosis in rabbits fed with a high cholesterol diet. A total of 72 New Zealand white rabbits were divided randomly on two experimental studies carried out 8 weeks apart. The first experiment was designed to investigate the prophylactic efficacy of ZER in preventing early developed atheromatous lesion. The second experimental trial was aimed at investigating the therapeutic effect of ZER in reducing the atherosclerotic lesion progression and establishment. Sudanophilia, histopathological, and ultrastructural changes showed pronounced reduction in the plaque size in ZER-medicated aortas. On the other hand, dietary supplementation of ZER for almost 10 weeks as a prophylactic measure indicated substantially decreasing lipid profile values, and similarly, plaque size in comparison with high-cholesterol non-supplemented rabbits. Furthermore, the results of oxidative stress and antioxidant biomarker evaluation indicated that ZER is a potent antioxidant in suppressing the generation of free radicals in terms of atherosclerosis prevention and treatment. ZER significantly reduced the value of malondialdehyde and augmented the value of superoxide dismutase. In conclusion, our data indicated that dietary supplementation of ZER at doses of 8, 16, and 20 mg/kg alone as a prophylactic measure, and as a supplementary treatment with simvastatin, significantly reduced early plague formation, development, and establishment via significant reduction in serum lipid profile, together with suppression of oxidative damage, and therefore alleviated atherosclerosis lesions.
Keywords: zerumbone, antihypercholesterolemic, antioxidant, atherosclerosis, rabbit model
Introduction
Hypercholesterolemia refers to elevated levels of cholesterol in the blood and is considered to be a critical step in the initiation and development of atherosclerosis.1 In hypercholesterolemia, elevated levels of plasma low-density lipoprotein (LDL) will contribute to the development of circulating oxidized LDL (oxLDL), which is considered a useful marker to identify patients with acute coronary heart disease (CHD).2,3 In fact, oxLDL is thought to play a key role in the pathogenesis of atherosclerosis.4 Zingiber zerumbet (Linnaeus) Smith, belonging to the family Zingiberaceae, is an edible ginger originating in South-East Asia.5 This herbal plant is believed to possess high medical prominence.6 A recent investigation revealed that supplementary treatment with Z. zerumbet rhizome’s ethanolic extract (EE) can suppress body weight gain and reduce fat accumulation in high-fat diet-induced rats via upregulation of hepatic peroxisome proliferator-activated receptor alpha, thus modulating lipid metabolism.7
Different from other substances extracted from the essential oil of Z. zerumbet rhizomes, zerumbone (ZER) is a crystalline, monocyclic, sesquiterpene, phytochemical substance that was first isolated as a major natural compound in 1960 from the essential volatile oil of rhizomes of Z. zerumbet.8,9 Several studies have shown that ZER exerts a broad spectrum of pharmacological activities, and more importantly, is an effective antioxidant in suppressing the generation of free radicals;10 this is especially important because oxidative stress plays a key role in the process of atherogenesis.11 Furthermore, ZER attenuates free radical generation by chronic inflammatory cells (macrophages and lymphocytes) as an antioxidant, cancer-preventive agent.12 It is a known fact that these cells have a pivotal role in fatty streaks formation, plaque accumulation, and in early lesion development.13,14
The most substantial and remarkable in vitro findings proposed that ZER has a distinct ability to suppress the expression of multiple scavenger receptors on human leukocytes, via downregulation of nuclear factor kappa beta (NF-κB), which in turn blocks the uptake of oxLDL by macrophages, and, as a result, reduces foam cell formation.15 NF-κB activation is possibly induced by tumor necrosis factor alpha, which is involved in various pathological mechanisms associated with the development of atherosclerosis.16 As a result, from that point of view, ZER is expected to have a significant antiatherogenic effect via its antihypercholesterolemic property. On the other hand, the search for nutraceutical compounds that reduce serum cholesterol and prevent hypercholesterolemic atherosclerosis would be an even more important achievement.
Therefore, the purpose of the present study is to evaluate the antihypercholesterolemic effects of dietary ZER supplementation on the initiation and propagation of atherosclerosis in cholesterol-fed rabbits as a preventive and therapeutic measure, through assessment of serum lipid profiles, and histopathological, ultrastructural, and gross evaluation of atherosclerotic lesions in the aorta.
Materials and methods
ZER extraction
ZER was extracted using the hydrodistillation (steam distillation) method according to a previously described protocol.17 In brief, fresh rhizomes of Z. zerumbet were obtained from a local market in Kuala Lumpur, Malaysia. Initially, the rhizomes were cleaned, washed, sliced, and later placed in a steam distiller containing tap water and heated immediately using a heating mantel. The channel of the device was connected to a special container in order to collect the steamed volatile oil mixed with water. The collected solution was mixed with absolute hexane (100%) (Sigma-Aldrich Co, St Louis, MO, USA) in a separator funnel to separate water from volatile oil. Later, the oil–hexane solution was placed in a glass baker and left standing in a fume hood to allow hexane evaporation and ZER crystallization. The crystals were collected and used. To obtain highly pure ZER, recrystallization was performed using hexane, and the solution was left standing to evaporate overnight. Crystals of ZER were kept at 4°C until further use. We could extract 1.3 g of ZER crystal from one kg of ginger rhizome.
Preparation of ZER solution
ZER solution was prepared fresh every day by dissolving pure ZER crystals with the appropriate amount of corn oil in a glass container (McCartney tube) by the aid of a sonicator (Emerson Industrial Group, Danbury, CT, USA), through induction of ultrasonic vibrating movement for 15 minutes with 40°C heat. The 0.4% (8 mg/kg bodyweight), 0.8% (16 mg/kg bodyweight), and 1% (20 mg/kg bodyweight) ZER solutions were prepared by dissolving 100, 200, and 250 mg ZER crystals in 25 mL corn oil. The protocol used was described previously.18
Preparation of simvastatin solution
Simvastatin (SIM) solution was prepared fresh every day by dissolving one tablet with 15 mg SIM (Zocor®; Merck & Co, Inc, Whitehouse Station, NJ, USA) per one rabbit with 2 mL of sterilized distilled water in a Bijou bottle. The solution was obtained via gentle shaking at room temperature for a few minutes. Similarly, to get 5 mg SIM solution, one tablet of 5 mg SIM was dissolved in 2 mL sterilized distilled water. Dosages were calculated according to a previous study for the 15 mg regimen dose,19 whereas for the 5 mg regimen dose, calculations were done according to earlier research.20–22
Preparation of 1% high-cholesterol diet
The 1% high-cholesterol diet was designed as an atherogenic diet for induction of experimental atherosclerosis following previous investigations,23 and prepared according to methods described earlier but with slight modifications.24,25 Hypercholesterolemic diets (HCDs) were prepared initially by dissolving pure cholesterol powder isolated from sheep wool (Sigma-Aldrich) in chloroform (Avantor Performance Materials, Center Valley, PA, USA). Briefly, 1.0 g cholesterol was added to 100 g of rabbit pellets; therefore, for every 1,000 g pellets, we utilized 10 g cholesterol. Furthermore, 10 g of cholesterol was suspended in 100 mL of chloroform, equivalent to 1 g in 10 mL; the mixture was stirred with the aid of a magnetic stirrer (LabTech Software, Tampa, FL, USA) for 30 minutes at room temperature. Subsequently, the 100 mL solution of cholesterol was mixed evenly with 1,000 g standard laboratory rabbit pellets in a special tray inside a fume hood (Frontier™; ESCO Corporation, Portland, OR, USA).
Then, the mixture was placed overnight in an air-ventilated oven at 40°C (Sheldon Manufacturing, Inc, Cornelius, OR, USA), allowing the chloroform to evaporate and the pellets to be soaked with cholesterol completely. The cholesterol-rich diets were prepared fresh every day. Rabbits were given access to 100 g rabbit chow diet and water daily, and 1% cholesterol-rich diet was given as a diet/head/day according to a previous study.26 Any remaining pellets in the feeding pots were collected the next day, weighed, then discarded. The feeding pots together with the water bottles were washed and refilled again every day throughout the experimental period.
Animals and management
The experimental protocols were reviewed and approved by the Animal Care and Use Committee (ACUC) for the ethics of animal care, and experiments were assigned with a reference number (UPM/FPV/PS/3.2.1.551/AUP) from the Faculty of Veterinary Medicine, Universiti Putra Malaysia, Serdang, Selangor. The New Zealand white (NZW) rabbit is the strain commonly used as an animal model for spontaneous, as well as diet-induced atherosclerosis.27 Healthy male NZW albino rabbits 10–12 weeks old weighing 1.5–2 kg were used in the current investigation. Animals were purchased from A-Sapphire Enterprise (Selangor, Malaysia) and placed at the Experimental Animal Research Unit, Faculty of Veterinary Medicine, Universiti Putra Malaysia, Serdang, Selangor. Upon receipt, rabbits were acclimatized in an air-conditioned room at 22°C–25°C for 7 days and were provided with free access to food and water. All animals were individually caged under normal experimental laboratory conditions in a 12-hour-light/12-hour-dark cycle, and received 100 g rabbit chow diet and water ad libitum.
Experimental design
A total of 72 NZW rabbits were divided randomly between two experimental studies carried out according to a diversified timeline. The interval between the two experiments was at least 8 weeks. The first experiment was designed to investigate the prophylactic efficacy of ZER in preventing early development of atheromatous lesion. Thirty rabbits were equally allotted into five groups, namely control (CN), HCD, and three ZER preventive groups (ZPI, ZPII, and ZPIII). Those in the HCD, ZPI, ZPII, and ZPII groups received a 1% high cholesterol diet. However, rabbits in the ZPI, ZPII, and ZPII groups were given ZER at a dose of 8, 16 and 20 mg, respectively. The second experimental study was aimed at investigating the therapeutic effect of ZER in reducing atherosclerotic lesion progression and establishment, wherein 42 rabbits were assigned in equal numbers to seven groups, namely CN, HCD, ZER treatment groups (ZI, ZII, and ZIII), SIM group (SG), and a ZER-SIM combination group (ZSG). All rabbits, except those in the CN group, received the HCD (1%) for a period of 10 weeks. Following this 10-week period of feeding, the therapeutic regime was initiated for an additional period of 4 weeks. Six rabbits each were assigned to the ZI, ZII, and ZIII groups, which received ZER at the dose of 8, 16, and 20 mg, respectively. Likewise, another six rabbits each were assigned to the SG and ZSG groups that received 15 mg SIM or 5 mg SIM plus 8 mg ZER, respectively.
Body weight and feed intake
The body weight of all rabbits was recorded before the commencement of the experiments and weekly thereafter until the end of the trials by using a commercial weight scale. Leftover rabbit food was collected at the end of each day and also weighed.
Clinical signs
Rabbits were observed twice daily (morning and afternoon) for signs of aspiration pneumonia, oral gavage injuries, hypercholesterolemia, and also for ZER and SIM toxicity.
Blood sampling
Approximately 3–5 mL of blood was sampled via ear lobe vein using a 21G hypodermic needle, while the rabbits fasting for the previous 12 hours were placed in a restrainer. The sampling was done at week 0 (W0), week 5 (W5), and week 10 (W10) in both experiments, and also at week 14 (W14) in the therapeutic trial. The collected blood was put into either heparinized or plain vacutainer tubes placed on ice. All blood samples were processed within 2–4 hours post-collection.
Serum lipid profile analysis
The degree of hypercholesterolemia in all rabbits was measured at W0, W5, and W10 in all experiments, with an additional point of collection at W14 in the therapeutic experiment. Animals fasted for approximately 12 hours prior to blood collection. The collected blood from each rabbit was centrifuged at 3,500 rpm, 4°C for 10 minutes (Hettich GmbH & Co, Tuttlingen, Germany). The total cholesterol (TC), triglyceride (TG), low-density lipoprotein cholesterol (LDL-C), and high-density lipoprotein cholesterol (HDL-C) were then analyzed in an automated biochemical analyzer (Hitachi 902; Hitachi Ltd, Tokyo, Japan). All serum lipid profiles were estimated spectrophotometrically using a commercial rapid test kit (Hoffman-La Roche Ltd, Basel, Switzerland).
Histopathology
The collected organs including, aorta, liver, kidneys, spleen, adrenals, and brain samples were sliced into small sections of about 0.5–2 cm thickness and were fixed in 10% formalin for at least 48 hours. The fixed samples were placed in plastic cassettes and dehydrated using an automated tissue processor (ASP300; Leica Microsystems, Wetzlar, Germany). The tissues were embedded in paraffin wax (EG1160; Leica Microsystems), and the blocks were trimmed and sectioned to 4 μm using a semiautomated microtome (RM2155; Leica Microsystems). Then, the tissue sections were mounted on glass slides using a hot plate (HI1220; Leica Microsystems).
Subsequently, the tissue sections were deparafinized by two changes of xylene for 5 minutes each and rehydrated by three changes of different graded ethanol dilution (100%, 90%, and 70%) for 5 minutes each, respectively. Afterward, the sections were stained with Harris’s hematoxylin and eosin (HE) method, as described previously.28 Finally, tissue sections were mounted with glass cover slips using mounting medium distyrene-plasticizer xylene and were examined using a light microscope image analyzer (BX51TF; Olympus Corporation, Tokyo, Japan).
Assessment of atherosclerotic plaques (sudanophilia)
Macroscopic assessment of atherosclerotic plaque distribution was estimated and calculated according to previous published works within the same field.26,29 After dissection, the ascending parts, including the aortic arch (first experiment) and thoracic-abdominal aorta (second experiment), were removed with any remaining blood rinsed away with ice-cold physiological saline, cut, and opened longitudinally, and were fixed in 10% formalin for 24 hours at room temperature. Then, a sample was prepared for detection and quantification of the sudanophilic lesion area.30
Thereafter, the fixating aortic strips were pinned in a tissue-embedding cassette and enclosed with a plastic lid to avoid sample movement. Then, the aortas were rinsed briefly in 70% ethyl alcohol and immersed in for 20 minutes at room temperature in Herxheimer’s solution that contained 5 g Sudan IV dye, 500 mL of 70% ethyl alcohol, and 500 mL acetone. The aortas were then transferred to 80% alcohol for 20 minutes for de-staining. Thereafter, the segments were consecutively washed in running tap water for 1 hour. The strength of the running water stream was noted to avoid tissue damage. The Sudan IV stain is lipophilic; therefore, it will stain the lipid deposition on the inner surface of the aorta a deep red color, allowing a clear illustration of the plaques.31
Macroscopic atheromatous plaque quantification
The inner surface of the aorta segments were flattened, and pinned on a green rubber cobble to provide high-quality contrast. The images of the aortas were photographed using a notebook (iPad 3; Apple, Inc, Cupertino, CA, USA). The extent of aortic atherosclerosis was evaluated as a lesion area relative to the total inner surface and was measured in mm2 using graph paper. The severity of atheromatous plaque was expressed as a percentage of the luminal surface that was covered by macroscopic atherosclerotic lesion.
Atheromatous lesions were graded semiquantitatively,32 based on a 4-point measuring scale (0, absent 0%–10%; 1, mild 10%–25%; 2, moderate 25%–50%; 3, severe 50%–75%; and 4, critical >75%), using the following formula as previously described.33
|
|

Semiquantitative evaluation of microscopic atherosclerotic lesions
Morphometric analysis of the histological sections from aorta was performed according to a previous study.34 Briefly, for each rabbit, four segments of 0.5–1.0 cm length from the aortic arch and thoracic aorta were fixed in 10% formalin for at least 48 hours at room temperature. Paraffin-embedded tissue sections (4–5 mm thick) were stained with HE. Tissue slides were examined under a light microscope with the aided image analyzer (BX51TF) for evaluation of the severity of the atherosclerosis. This evaluation was based on the presence of fatty streaks and atheromatous-fibrous plaques via estimation of intimal thickness, which was measured in μm and statistically expressed as a mean percentage. The following morphometric scales were considered for the semiquantitative evaluation of aortic histological sections: scale 0, scale +, scale ++, scale +++, and scale ++++. Finally, scoring of the lesion severity was graded, according to the percentage of intimal plaque thickness, as follows: 0%–10%, no lesion; 10%–25%, mild; 25%–50%, moderate; 50%–75%, severe; 75%–100%, highly severe.
Transmission electron microscopy
The harvested aortic tissue slices (1–3 mm2) were immediately fixed in 4% glutaraldehyde in 0.2 M cacodylate buffer 50 mL, 25% glutaraldehyde 16 mL, and 34 mL distilled water (pH 7.2–7.4) at 4°C for 24 hours. Then, the samples were washed with 0.1 M sodium cacodylate buffer for three changes of 15 minutes each, post-fixed in 1% freshly prepared osmium tetroxide for 2 hours at 4°C, and were subsequently dehydrated through a graded series of acetone solutions (35%, 50%, 70%, 95%, and 100%) for 15 minutes for each sample.
Aortic sections were cleared with propylene oxide and infiltrated with an acetone and resin mixture at a ratio of 1:1 for 2 hours and then were infiltrated with an acetone and resin mixture at a ratio of 1:3 overnight. Later, infiltration was done with 100% resin for an additional 2 hours, and sections were embedded in epoxy resin medium (dodecenyl succinic anhydride R1051, 7 mL; agar 100 resin R1034, 10 mL; methyl nadic anhydride R1081, 5 mL; and benzyl dimethyl aminutese, 0.5 mL) (all supplied by TAAB Laboratories Equipment Ltd, Aldermaston, UK). Polymerization was accomplished in an oven (Memmert GmbH & Co, Schalksmühle, Germany) at 60°C for 48 hours. Plastic blocks were sectioned by ultramicrotome (Ultracut UCT M26; Leica Microsystems) into (1 μm) thick sections for orientation. The sections were stained by 1% toluidine blue in 1% borax for light microscopy. Ultrathin sections were collected on copper grids, and double-contrast staining was applied with uranyl acetate (100 mL methanol and 5 g uranyl acetate) and Reynold’s lead nitrate solution (1.76 g sodium citrate, 1.33 g lead nitrate, 50 mL distilled water, and 8 mL 1N NaOH). Thin sections were examined under a transmission electron microscope (H7100 transmission electron microscope; Hitachi).
Scanning electron microscopy
Following the same primary fixation, washing, and post-fixation protocol used for transmission electron microscopy, aortic samples (0.5–1.0 cm2) were dehydrated through a gradually increasing acetone series (35%, 50%, 70%, 95%, and 100%) for 15 minutes per sample. The specimens were placed into a specimen basket and maintain in amyl acetate for critical point drying (Critical point dryer 030, BalTec, GmbH, Schalksmühle, Germany) for about 1.5 hours. Tissues were coated with gold-palladium particles with a sputter coater (sputter coating device 005; Baltec, Japan) and examined by scanning electron microscopy (SEM) (XL30 ESEM; Philips, Amsterdam, the Netherlands).
Estimation of plasma malondialdehyde concentration
Sample data of plasma malondialdehyde (MDA) were estimated in triplicates. Plasma MDA concentration was calculated by thiobarbituric acid reactive substances manual method as described in previous research,35 with slight modification. Briefly, 0.5 mL of plasma was added to a reaction mixture containing 2.0 mL of 1% phosphoric acid (pH 2.0), 2.5 mM butylated hydroxytoluene in absolute ethanol, 0.1 mL of 8.1% sodium dodecyl sulfate, and 1.0 mL aqueous solution of 0.6% thiobarbituric acid. The reactive mixture was mixed by slight vortexing in a Pyrex® centrifuge tube. The pH value of the analytical reactive mixture was about 0.9. Then, the reactive mixture was heated for 30 minutes at 95°C in boiling water inside a water bath (Sheldon Manufacturing, Inc). After cooling at room temperature, 5.0 mL of n-butanol was added to the mixture and homogenized by vortexing, followed by centrifugation at 3,500 rpm for 15 minutes (Hettich GmbH & Co). The n-butanol supernatant layer was collected in a plastic cuvette for fluorometric measurement at 532 nm using an electronic spectrophotometer (APEC-VC Korea, Daejeon, Republic of Korea).
The concentration of MDA was expressed as nmol/mL of plasma. The concentration of MDA was calculated by the following equation:36
MDA concentration (nmol/mL) = (As/Ab)/(Vs/VT) | (2) |
where As is the absorbance of the sample, Ab is the absorbance of the blank, Vs is the volume of plasma sample, and VT is the volume of the total reactive mixture (mL) in the cuvette.
Estimation of erythrocyte-superoxide dismutase activity
All data were subjected to statistical analysis in triplicates. The erythrocyte-superoxide dismutase (E-SOD) activity was measured by pyrogallol oxidation inhibition assay as described earlier,37 with slight modification. Initially, 500 μL hemolysate (that was previously prepared by mixing with 3 parts of isotonic saline) was thawed at 25°C and added to 1.5 mL of ice-cold distilled water, followed by the addition of 0.5 mL ethanol, and then 0.3 mL chloroform. The solution was mixed after each addition, and finally, shaken vigorously for 1 minute by vortexing (Sheldon Manufacturing, Inc). The well-mixed solution was centrifuged for 10 minutes at 3,000 rpm. The clear top supernatant layer was collected and stored at −20°C. Following an addition of 2.0 mL of deionized water into the mixture, a reactive solution was prepared by adding 75 μL chloroform-ethanol extract to 2.25 mL Tris-HCl (pH 8.0). The mixture was then kept and pre-warmed at 25°C in a water bath for 10 minutes; then, 0.15 mL of 3 mM pyrogallol solution was added. The rate of spontaneous oxidation was measured immediately and spectrophotometrically at 420 nm. Standard controls were measured following the same procedure, but the sample was replaced with 20% ethanol. The enzyme activity was defined as unit per mL of hemolysate, following this equation:
U = [{(BΔA – SΔA)/BΔA}/50%]/Ve/Vs | (3) |
where BΔA is the rate of spontaneous oxidation of blank control, SΔA is the rate of spontaneous oxidation of the sample, Ve is the final volume of extract, and Vs is the amount of the sample in the extract.
Statistical analysis
All descriptive statistical analysis was performed using SPSS (Statistical Package Social Sciences) version 15.0 (SPSS Inc, Chicago, IL, USA). The data were analyzed and presented as mean ± standard errors (MSE) of six animals. Means of multiple groups were compared by Tukey’s HSD (honestly significant difference) post-hoc test, and only values of P<0.05 were considered as significant. Statistical differences between the groups were evaluated using one-way analysis of variance (ANOVA).
Results
ZER extraction and characterization
Pure colorless crystalline ZER compound (Figure 1) was isolated from fresh Z. zerumbet rhizome by steam hydrodistillation method at a yield ratio of 1.0 kg rhizome:1.3 g ZER, rhizome-extraction: ZER-crystallization. The purity of ZER was 99.31% using a reverse phase high-performance liquid chromatography validating system (Waters Corporation, Milford, MA, USA) that was calibrated with standard solutions of 2.5–40.0 μg/mL of ZER. The retention times of ZER were eluted for 5.347 minutes (Figure S1), from which a calibration curve was plotted. A good linear relationship was observed between the concentration of ZER and the peak area of ZER, with an acceptable correlation coefficient (r2=0.998) for quantitative analysis.
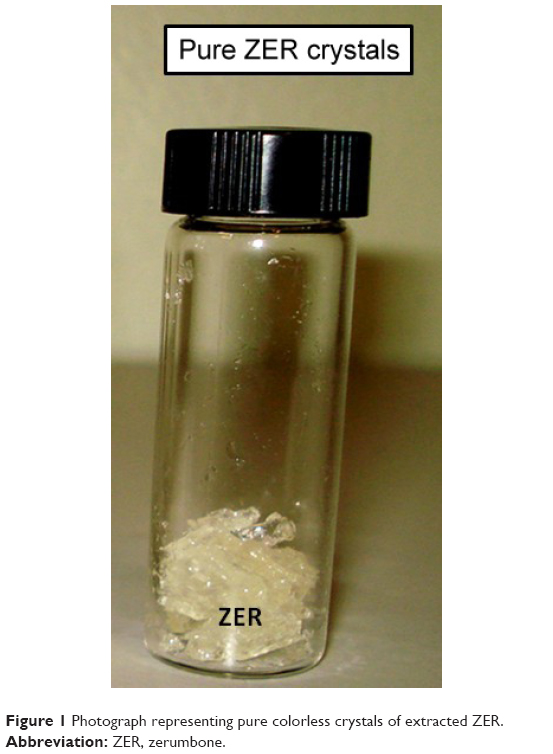 | Figure 1 Photograph representing pure colorless crystals of extracted ZER. |
Clinical observations
The most notable clinical abnormalities observed in four rabbits, mainly those of the HCD group and particularly at the end stage of the experiments, were depression with droop ear and signs of liver lipotoxicity, which manifested as yellow mucous membrane and/or jaundice. In addition to these results, one rabbit each from ZER-supplemented groups ZPI and ZPIII showed some hair losses (alopecia) beneath the lower jaw (Figure 2).
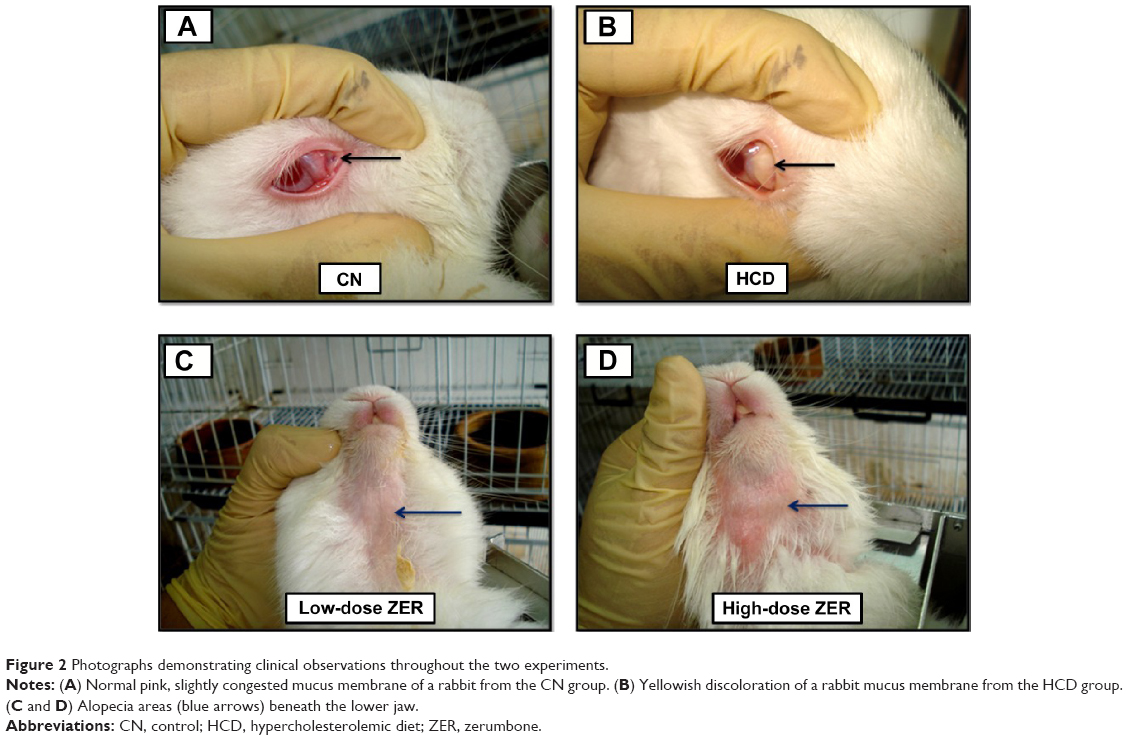 | Figure 2 Photographs demonstrating clinical observations throughout the two experiments. |
Gross pathology
Significant lesions comprising enlarged oily icteric liver in the HCD group, however, evidenced similar gross changes in the liver that were also seen in the ZER-supplemented groups in both experiments, but of a lesser severity. Similarly, the kidneys also appeared yellowish and enlarged in comparison to the CN group (Figure 3). Other internal organs including spleen and testis, particularly in the HCD group, looked obviously smaller and much paler compared to the CN group (Figure 4).
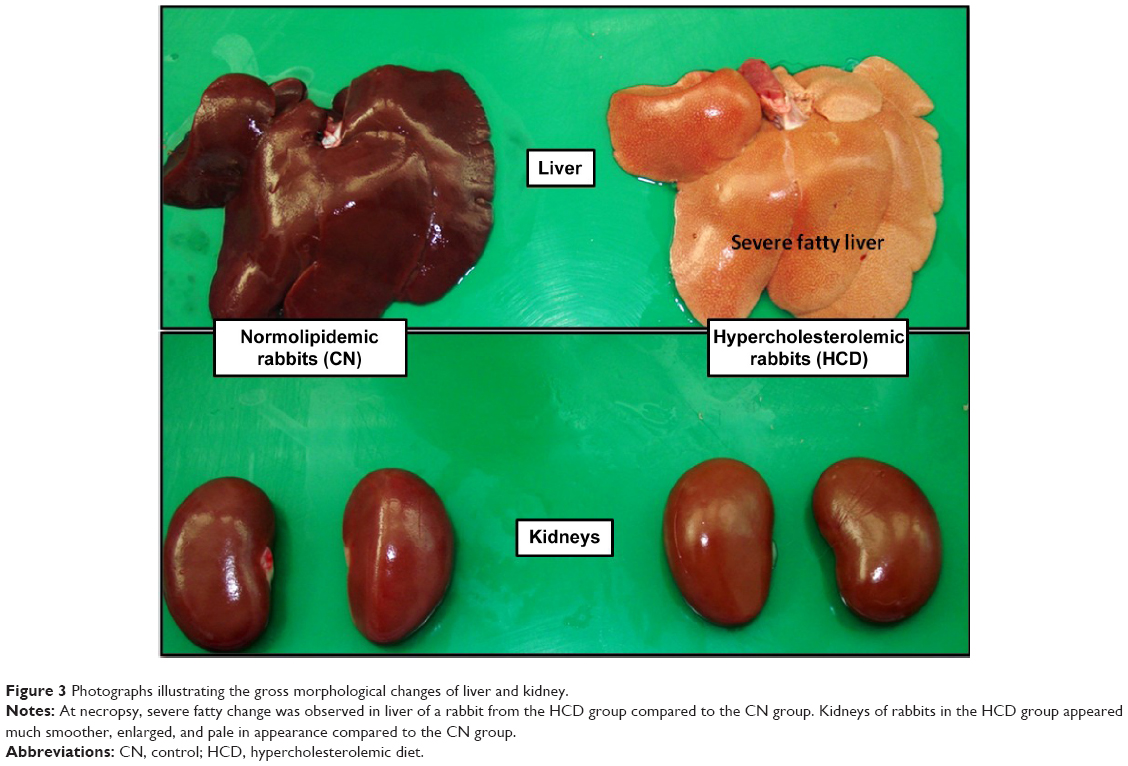 | Figure 3 Photographs illustrating the gross morphological changes of liver and kidney. |
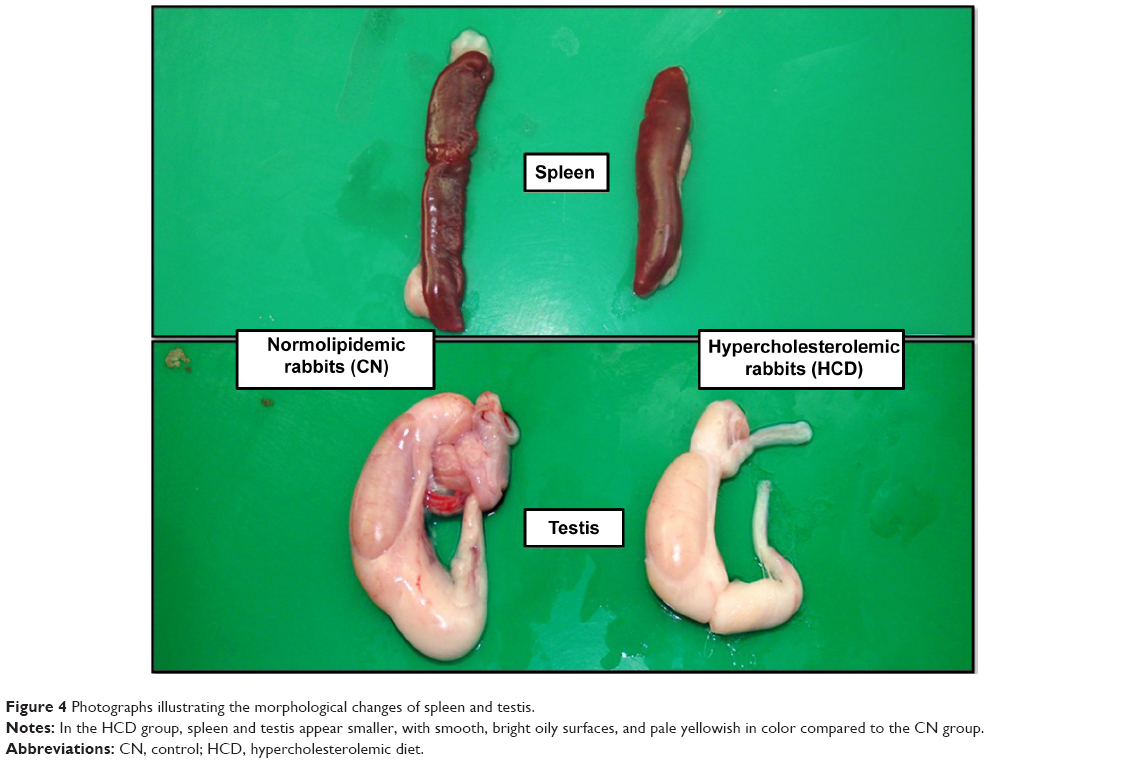 | Figure 4 Photographs illustrating the morphological changes of spleen and testis. |
The hearts from the HCD group depicted evidence in a few rabbits of necropsy findings that showed lesions indicative of congestive heart failure manifested by severe congestion of the epicardium and myocardium, and hydropericardium that was concomitant with fibrinous pericarditis. In a rare case of a hyperlipidemic rabbit, focal myocardial infarction was observed in the apex of the heart, described as focal gray–pale coagulative necrosis (Figure 5). Generally, there were observed variable degrees of enlarged fatty liver change and a pale-colored, necrotic, enlarged spleen in the HCD group (Figure 6).
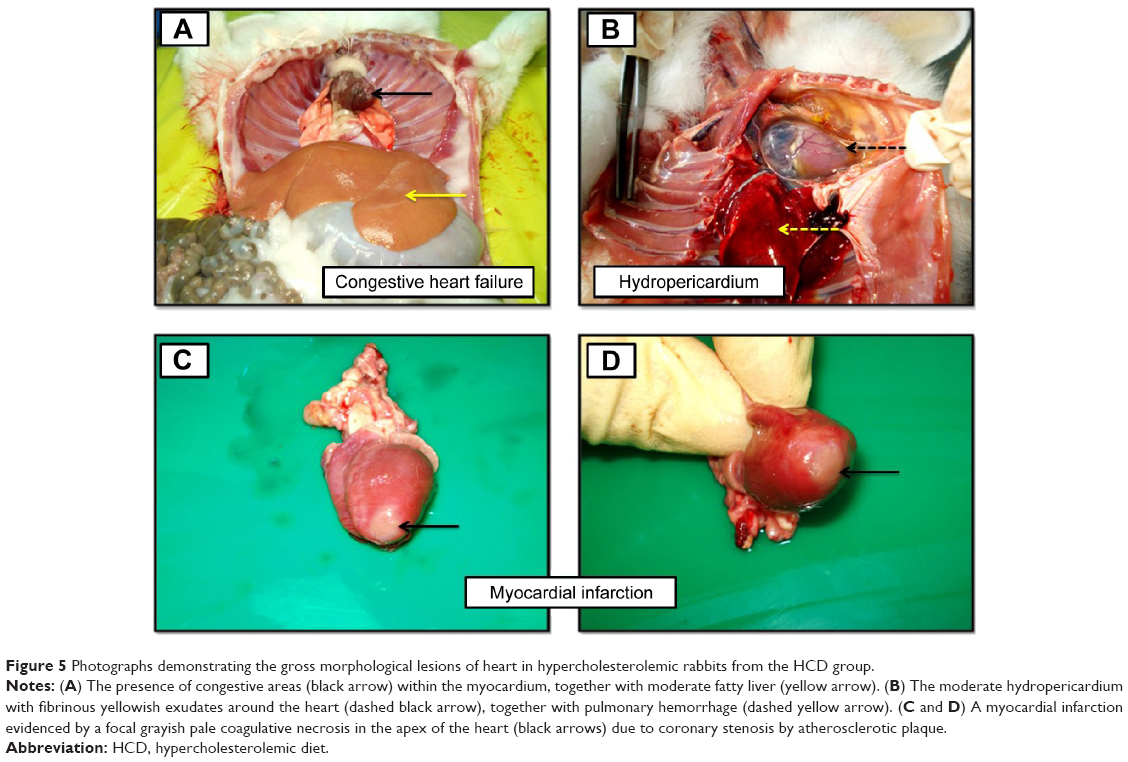 | Figure 5 Photographs demonstrating the gross morphological lesions of heart in hypercholesterolemic rabbits from the HCD group. |
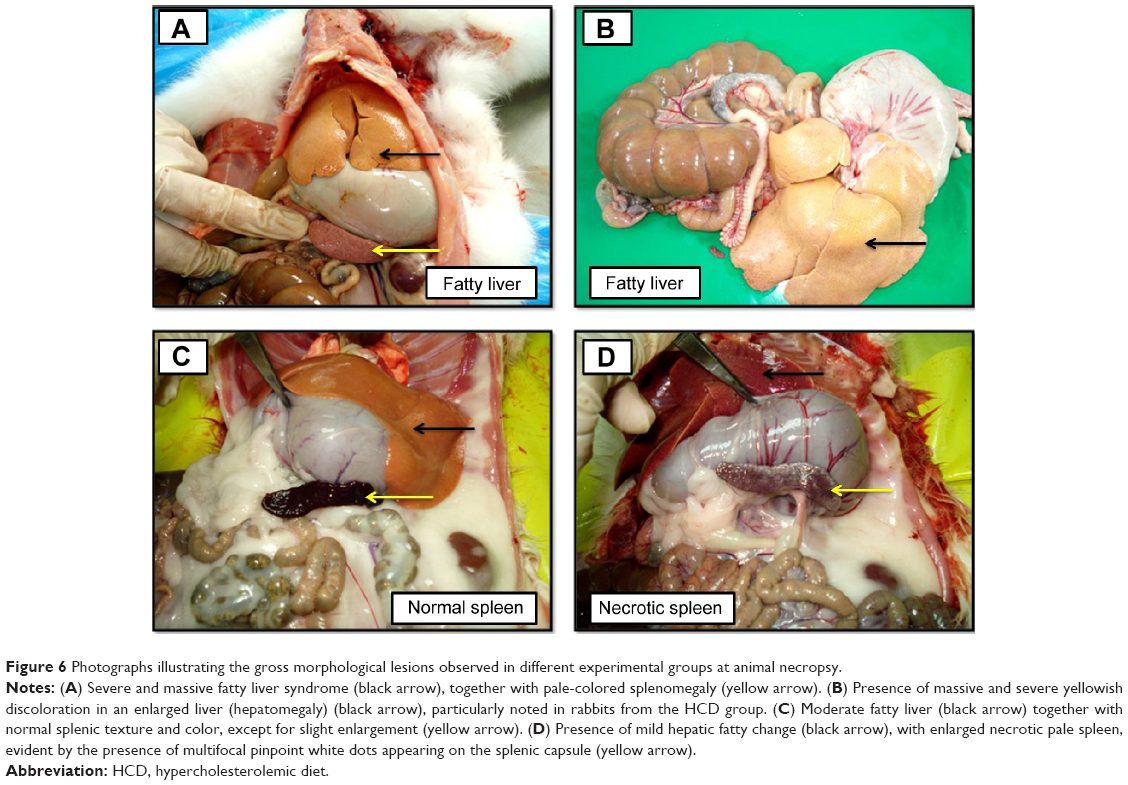 | Figure 6 Photographs illustrating the gross morphological lesions observed in different experimental groups at animal necropsy. |
ZER toxicity assay
Table 1 shows the results of the ZER toxicity assay on liver and kidney function. In general, ZER supplementation in three different concentration (8, 16, and 20 mg/kg) for 8 weeks showed no significant (P<0.05) signs, nor lesions in the liver or kidney malfunction. However, rabbits in the ZIII group showed some elevated values of aspartate aminotransferase as compared to the CN group; the histopathological evaluation revealed no significant morphological changes within hepatic and renal tissues, using the evidence of no hepatocellular or glomerular necrosis (Figures 7 and 8).
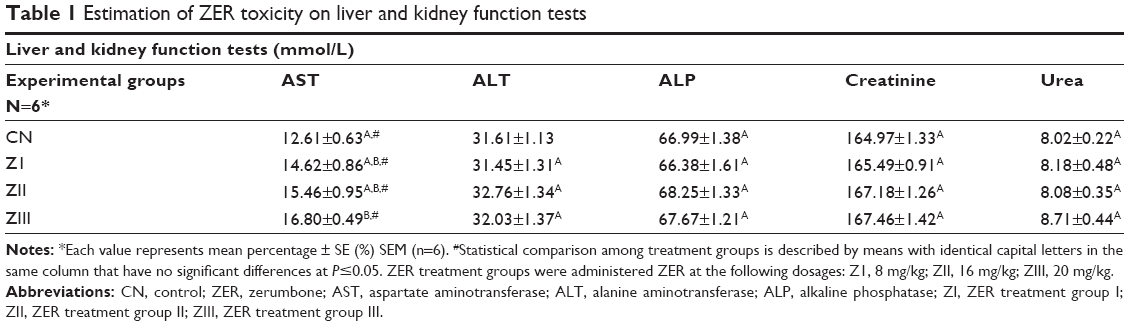 | Table 1 Estimation of ZER toxicity on liver and kidney function tests |
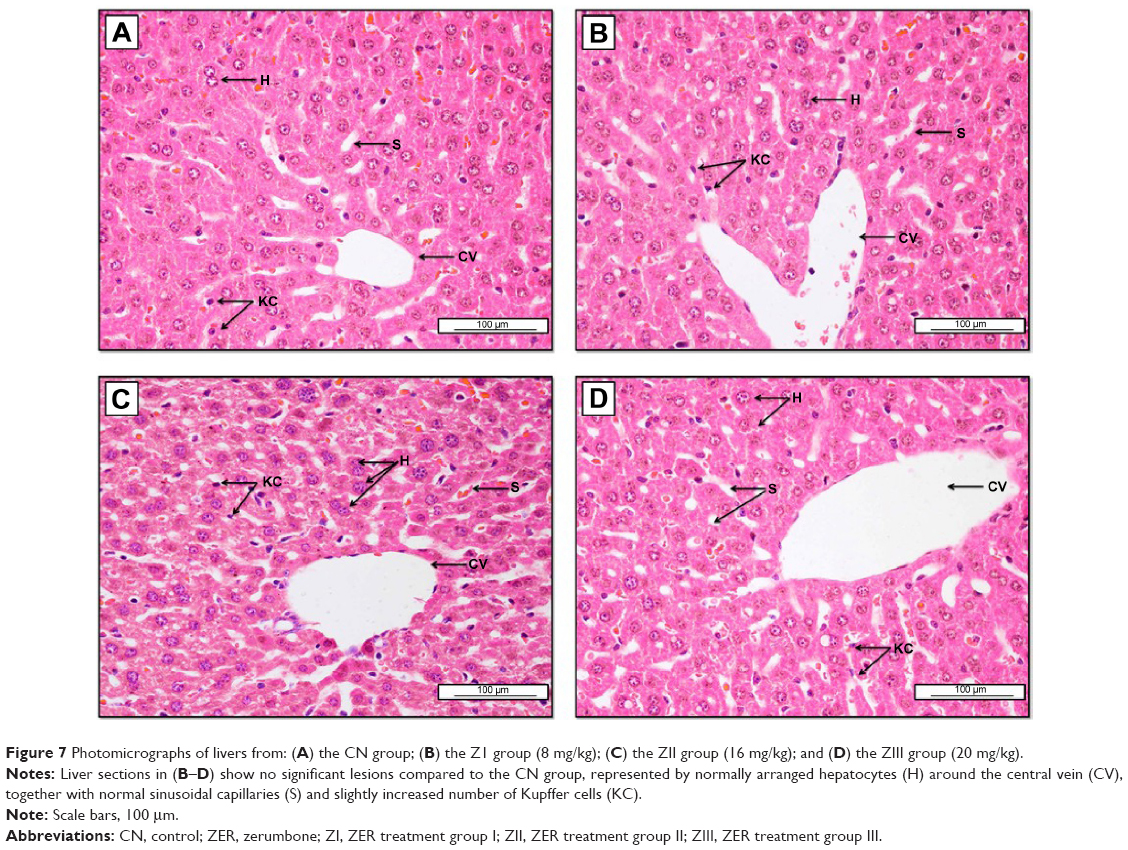 | Figure 7 Photomicrographs of livers from: (A) the CN group; (B) the Z1 group (8 mg/kg); (C) the ZII group (16 mg/kg); and (D) the ZIII group (20 mg/kg). |
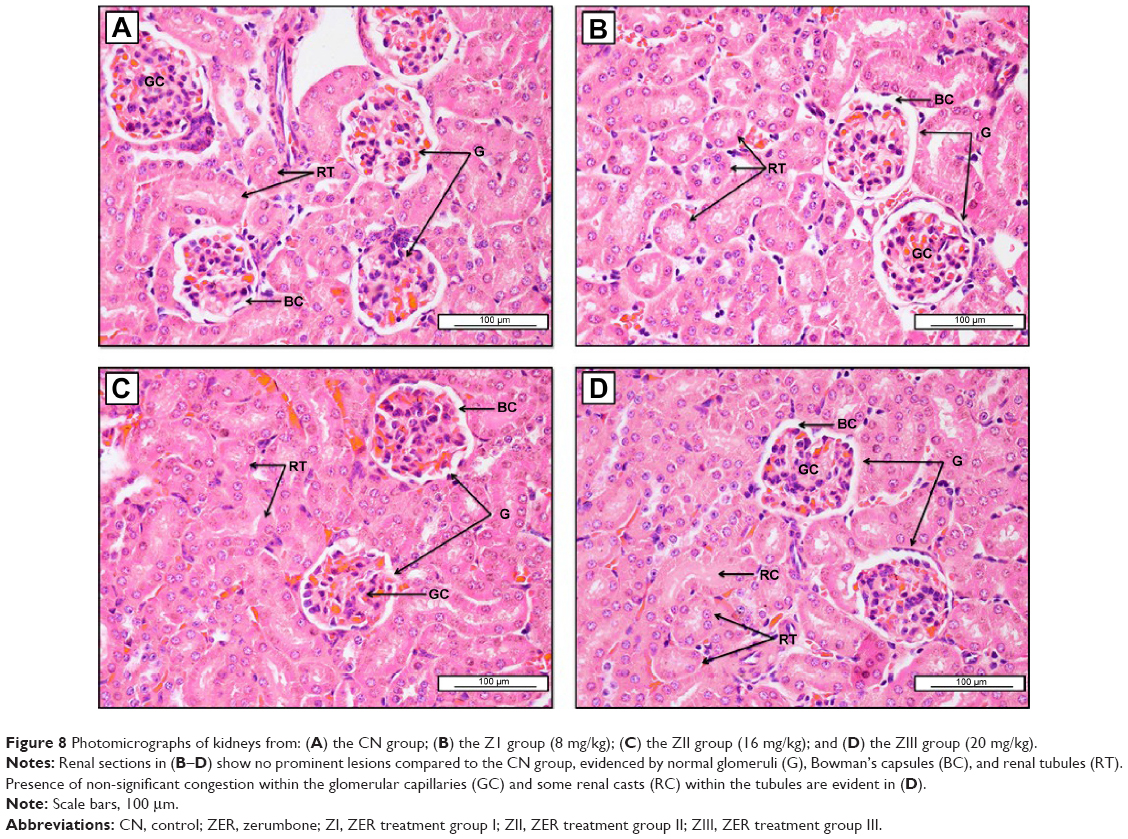 | Figure 8 Photomicrographs of kidneys from: (A) the CN group; (B) the Z1 group (8 mg/kg); (C) the ZII group (16 mg/kg); and (D) the ZIII group (20 mg/kg). |
Preventive trial
Body weight
Figure S2 shows the body weight changes in the rabbits during the experimental period. Initially, the means of body weights in all experimental groups were at baseline, or W0, without significant differences. However, at W5, the rabbits in the HCD group had a higher (P<0.05) mean body weight than those in the ZPIII group. Similarly, the more pronounced reduction (P<0.05) in body weight was observed in the ZPIII group at W10.
Feed intake
Figure S3 shows rabbit feed intake during the experimental period. Significant changes in feed intake (P<0.05) were highest in the HCD group only as compared to other groups at W5 and W10.
Organ weight
Figure S4A and B illustrates the organ weight changes in rabbits at the end of the prophylactic experiment. Liver, fat, heart, kidneys, and spleen weights in the CN group were the lowest, while organ weights in the other groups remained comparable.
Serum lipid profiles
Figure S5A–D shows the serum profile of TC, TG, LDL-C, and HDL-C. The HCD group shows the highest level of TC compared to the CN group at W5 and W10. However, the ZER groups demonstrated a significant reduction in TC values compared to the HCD group at W5 and W10 (Figure S5A). In Figure S5B, at W5 and W10 significant differences in TG concentrations (P<0.05) can be seen between all groups, with the lowest and highest differences evident in the CN and HCD groups, respectively.
In Figure S5C and D at W5 and W10, the concentrations of LDL-C and HDL-C were at their highest and lowest values in the HCD and CN groups, respectively. At W5 and W10, the concentrations of LDL-C and HDL-C in the ZPIII group was suppressed (P<0.05), as were the concentrations of LDL-C and HDL-C in the ZPI and ZPII groups. However, significant (P<0.05) differences in LDL-C and HDL-C concentrations between the ZPI and ZPII groups were only seen at W10.
Assessment of atherosclerotic plaque lesion area (sudanophilia)
Table 2 demonstrates the semiquantitative grading and scaling of intimal atherosclerotic lesion area via Sudan IV staining technique. Figure 9 shows the gross vertical dissection to the aortic arch and thoracic aorta, which reveals the intimal fatty streaks before and post-Sudan IV staining, in which the lesions appeared as elevated, irregular, chalky-white (without Sudan stain), rigid, sluggish, red-to-orange deposits (with Sudan stain). These elevated intimal, red fatty streaks are sharply demarcated in the sudanophilic area and were denser in the aortic arch, which diminished gradually (Figure 10).
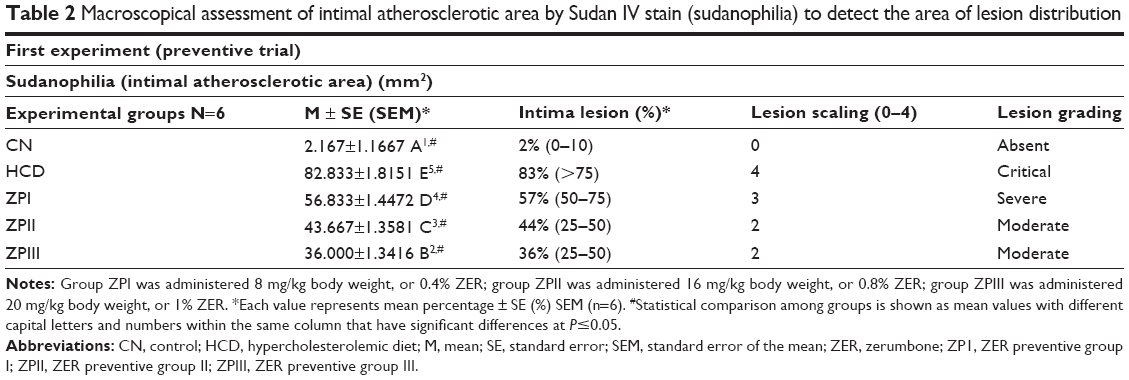 | Table 2 Macroscopical assessment of intimal atherosclerotic area by Sudan IV stain (sudanophilia) to detect the area of lesion distribution |
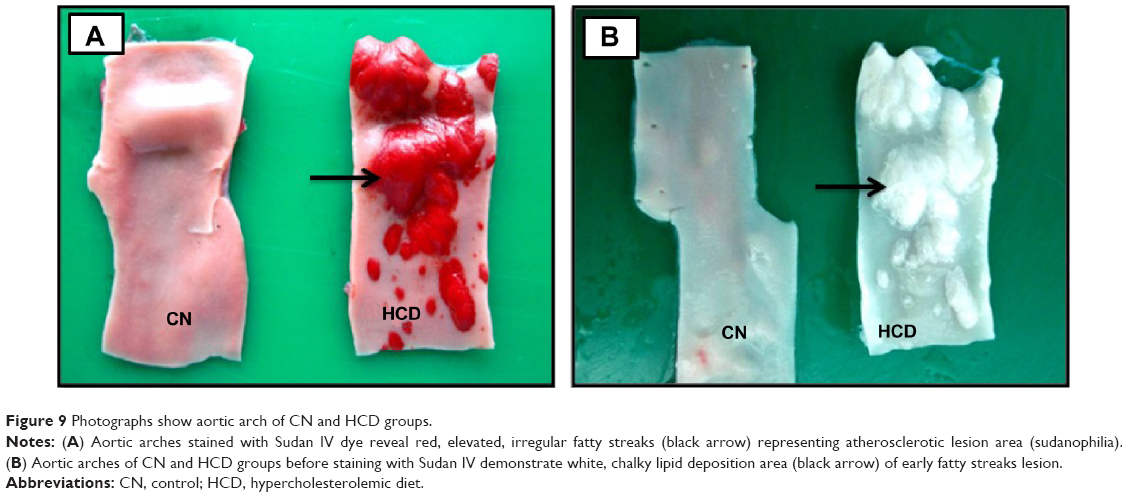 | Figure 9 Photographs show aortic arch of CN and HCD groups. |
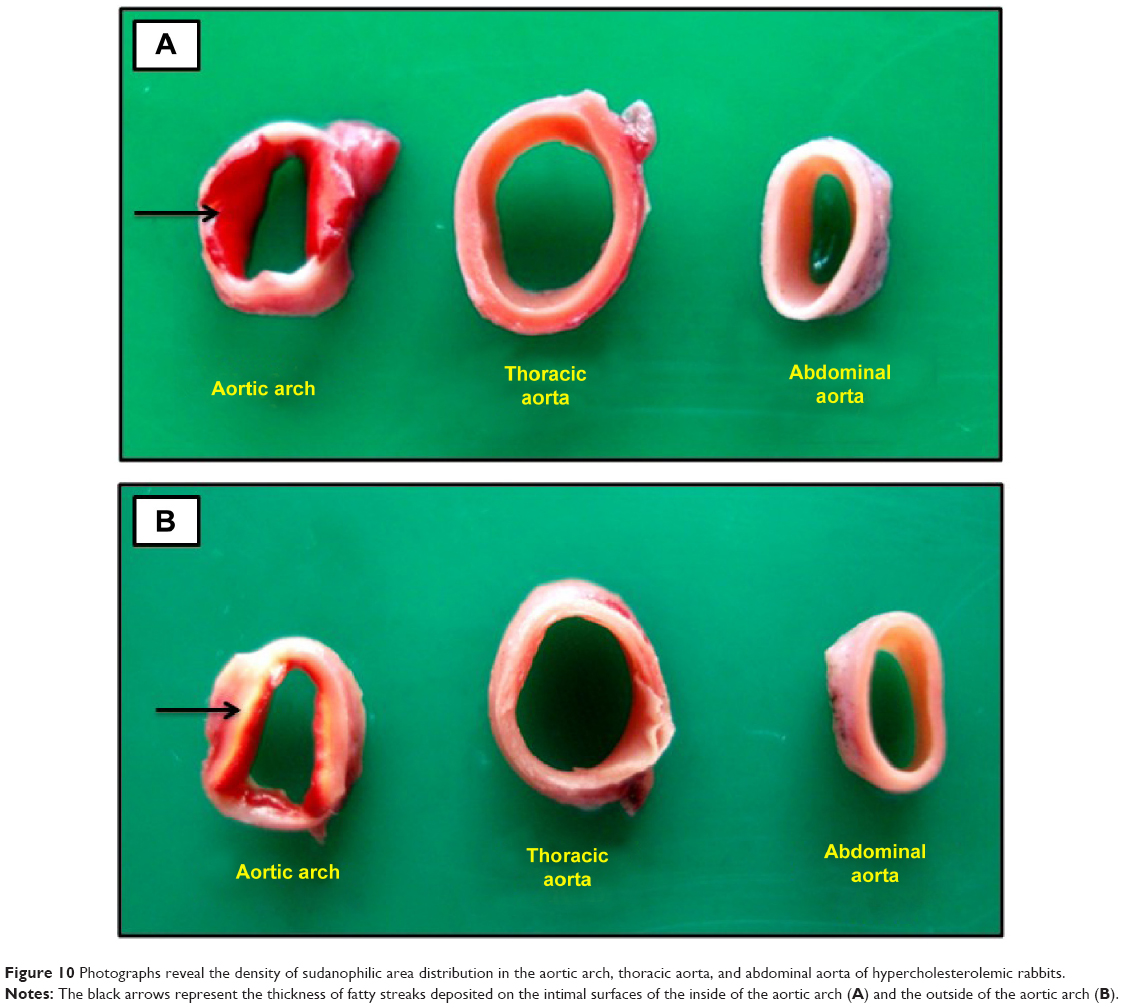 | Figure 10 Photographs reveal the density of sudanophilic area distribution in the aortic arch, thoracic aorta, and abdominal aorta of hypercholesterolemic rabbits. |
At the end of experimental period, W10, atherosclerotic lesions showed significant reduction in the area of sudanophilia in ZER-supplemented groups in a dose-dependent manner (Figure 11). The reduction in lesion area distribution was more statistically significant in ZPIII aortas, since the lesion area was minimized by 35%–40% from critical lesions with four-degree scores to moderate lesions with a two-degree scale. On the other hand, no lesions were detected in the CN aortas compared to the HCD subjects (Figure 12).
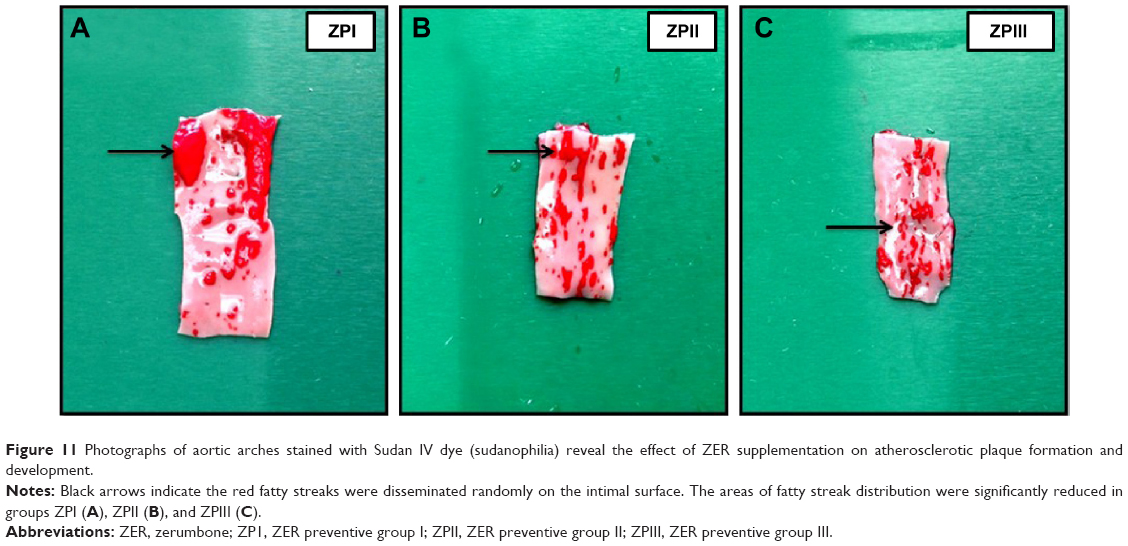 | Figure 11 Photographs of aortic arches stained with Sudan IV dye (sudanophilia) reveal the effect of ZER supplementation on atherosclerotic plaque formation and development. |
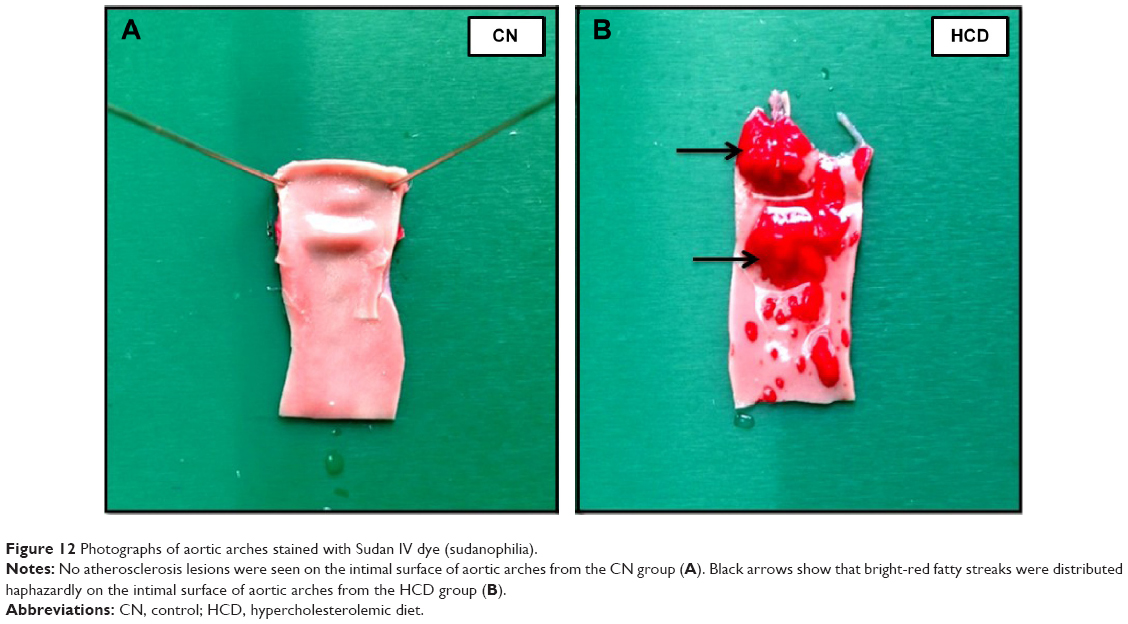 | Figure 12 Photographs of aortic arches stained with Sudan IV dye (sudanophilia). |
Histopathological evaluation
Table 3 illustrates the morphometric semiquantitative evaluation of histological sections and lesion-scoring indexes. In the HCD group, all rabbits developed thick fatty streaks, some of them interlaced with proliferative fibrous connective tissue (fibrous plaque) compared to the CN aortas (Figure 13). Lipid deposition formed a nearly complete ring, and the tunica intima layers were totally occupied with atherosclerotic plaque that was elevated toward the lumen, consisting mainly of lipid-filled mononuclear inflammatory cells (foam cells), which resulted in stenotic lumens. However, in the ZPI, ZPII, and ZPIII groups, in a concentration-dependent manner, there was clear prevention of atherosclerosis formation and development, evidenced by significant reduction of the intimal plaque thickness (Figure 14).
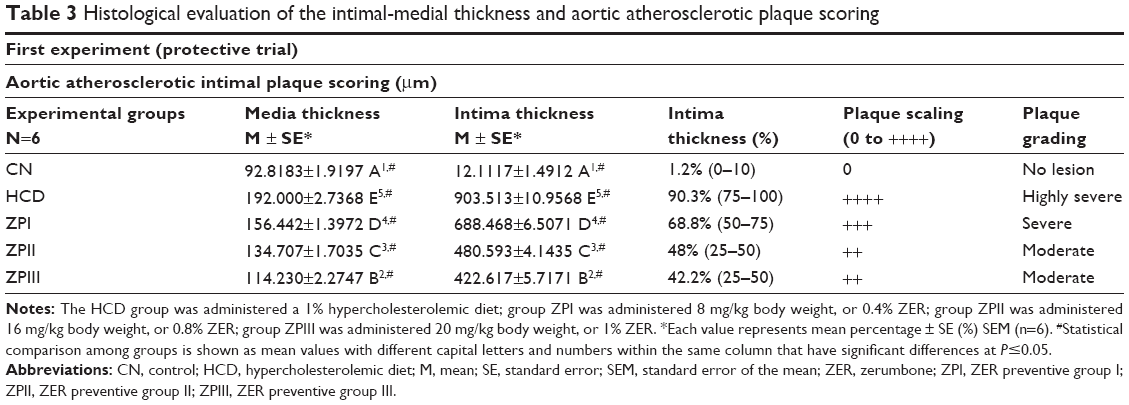 | Table 3 Histological evaluation of the intimal-medial thickness and aortic atherosclerotic plaque scoring |
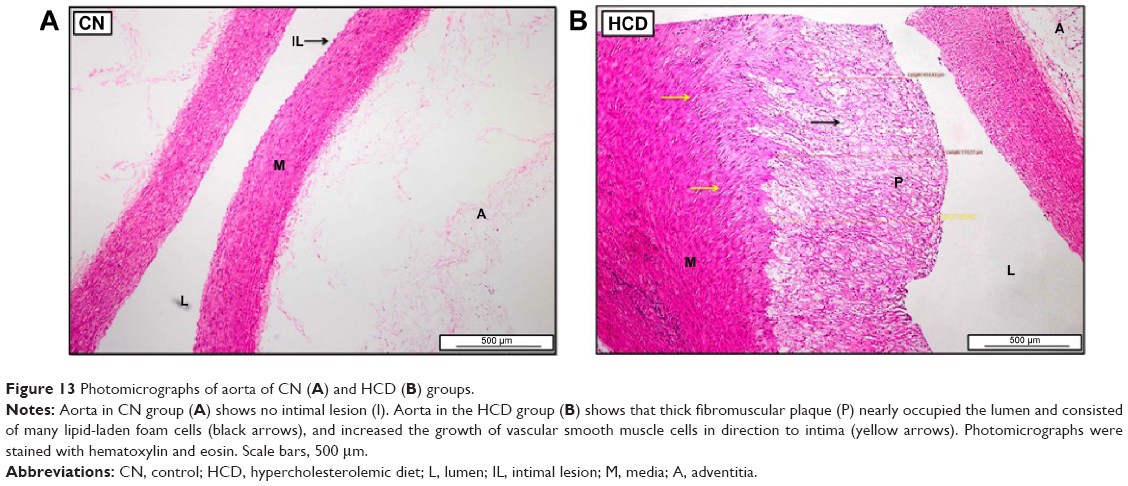 | Figure 13 Photomicrographs of aorta of CN (A) and HCD (B) groups. |
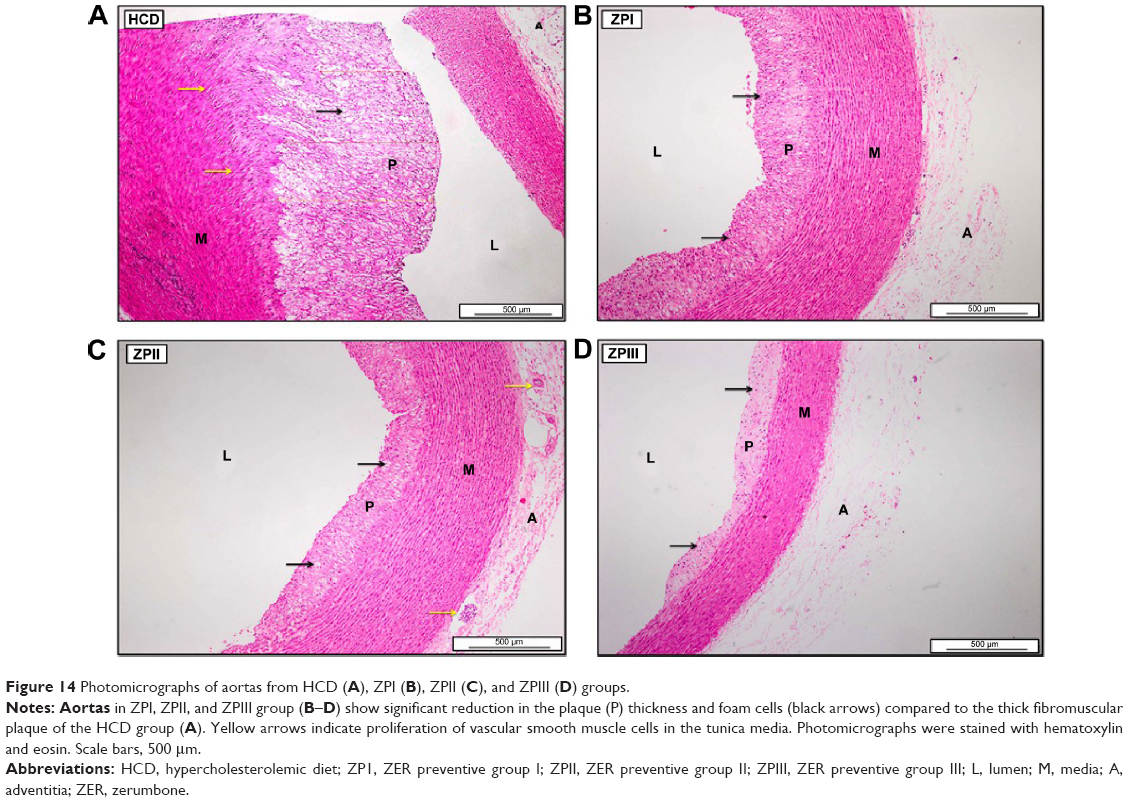 | Figure 14 Photomicrographs of aortas from HCD (A), ZPI (B), ZPII (C), and ZPIII (D) groups. |
SEM evaluation
In the CN group, the vascular endothelium and fine structure appeared normal, with no apparent damage to the endothelial surface and no plaque formation. In between the vascular wall tonics, definitive elastic lamellae were observed in regular rotation and orientation of the endothelial lining. No pathological separation was observed between the layers. In contrast, in the HCD group, the endothelial layer of the aorta was severely damaged, together with multifocal plaque formations evidenced by different-sized spherical lesions that were elevated from the intima and had irregular surfaces (Figure 15). However, there was a corresponding remarkable decrease in the plaque size and lesion surface area distribution that was observed in the ZER-supplemented groups (Figure 16). These were more pronounced in the ZPIII group.
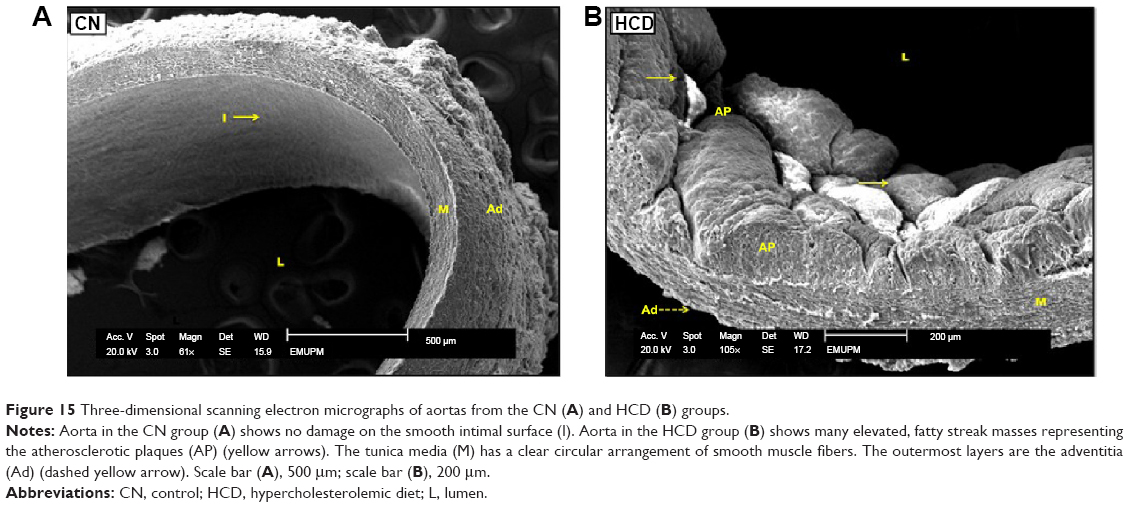 | Figure 15 Three-dimensional scanning electron micrographs of aortas from the CN (A) and HCD (B) groups. |
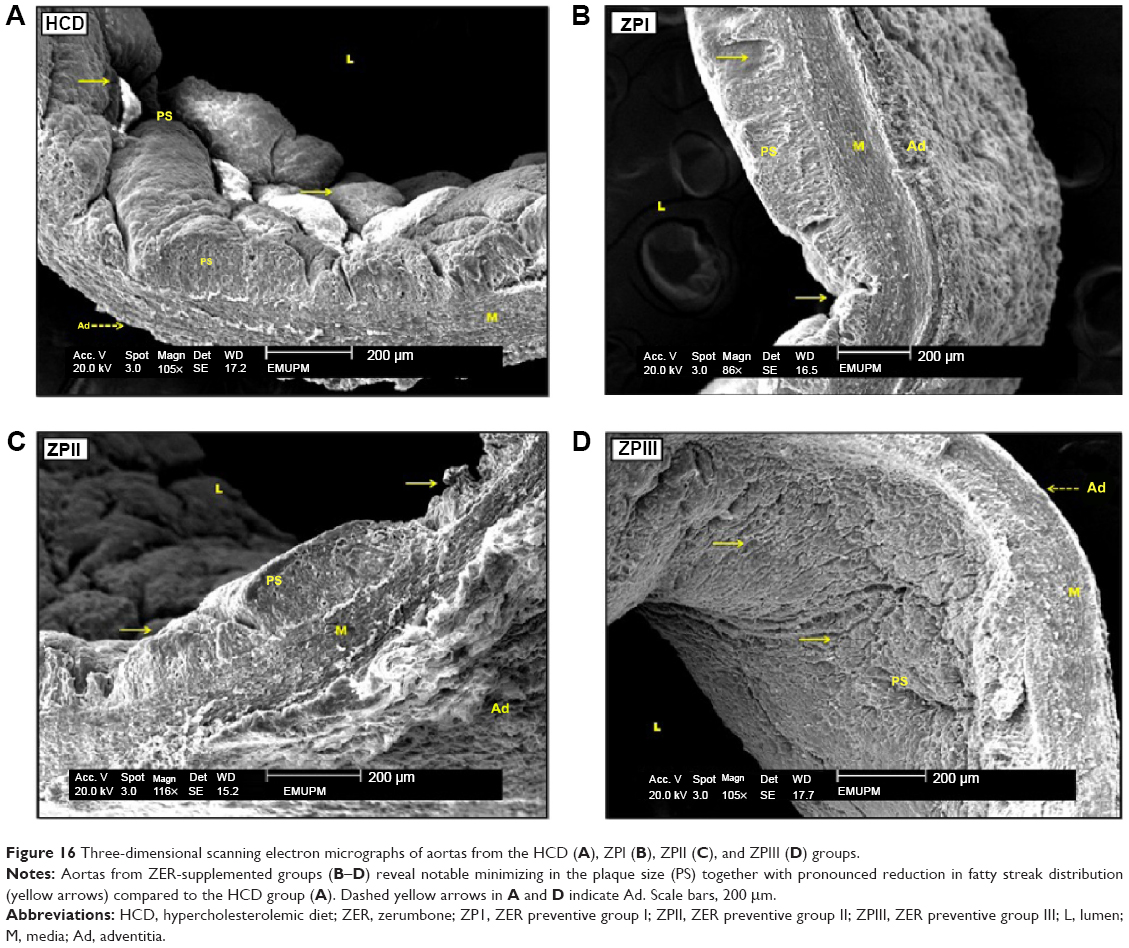 | Figure 16 Three-dimensional scanning electron micrographs of aortas from the HCD (A), ZPI (B), ZPII (C), and ZPIII (D) groups. |
TEM evaluation
Individual endothelial cells in the CN group demonstrated typical orientation on the normal basal lamina and regular internal elastic lamella. In contrast, the HCD group showed a diffused multi-layer lipid deposition, residual foam cell fragments, and considerable accumulations of electron-dense substance that were situated near the disrupted internal elastic membrane on the intimal layer (Figure 17).
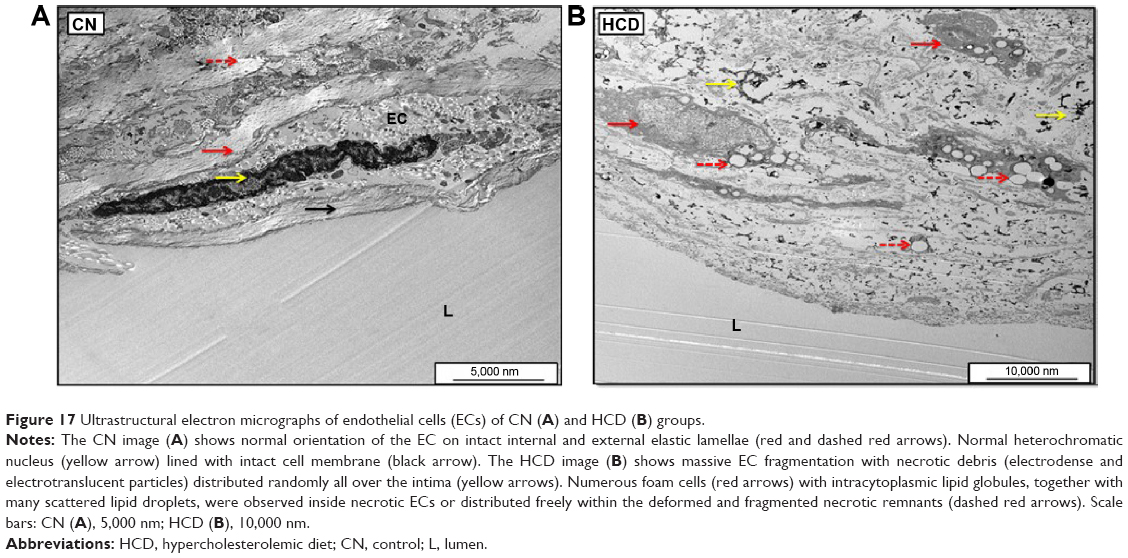 | Figure 17 Ultrastructural electron micrographs of endothelial cells (ECs) of CN (A) and HCD (B) groups. |
Figure 18A shows variable size and defines the edge lipid droplet accumulation within the cytoplasm of myofibril cells in the HCD group. In contrast, Figure 18B shows the effect of ZER supplementation in reducing these lipid droplets. However, deformation and degeneration were remarkably decreased on the endothelial surface of aortas in the ZPI, ZPII, and ZPIII groups compared to the HCD group. Moreover, partial repair to endothelial cells was noted in the ZPII and ZPIII groups (Figure 19).
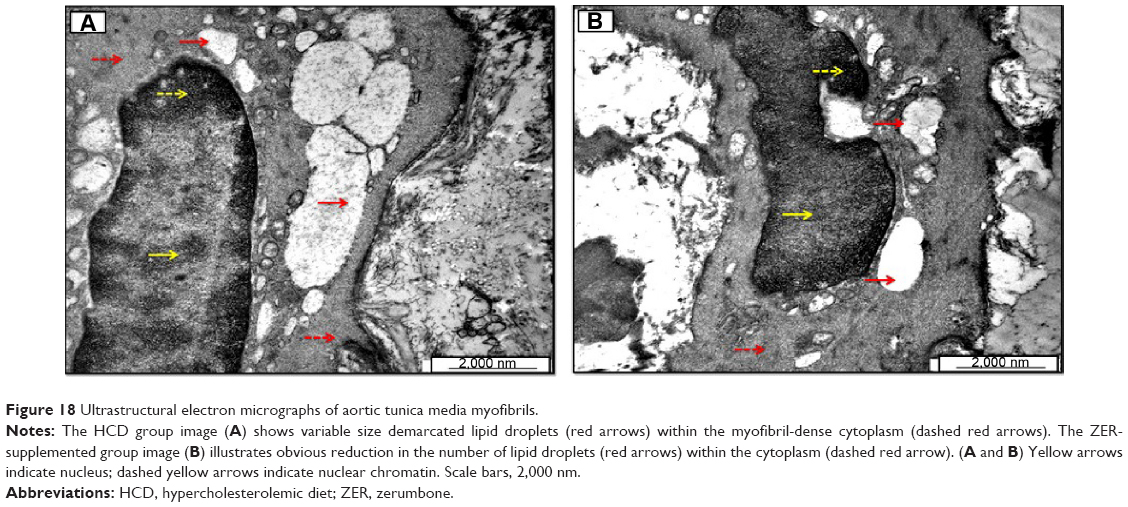 | Figure 18 Ultrastructural electron micrographs of aortic tunica media myofibrils. |
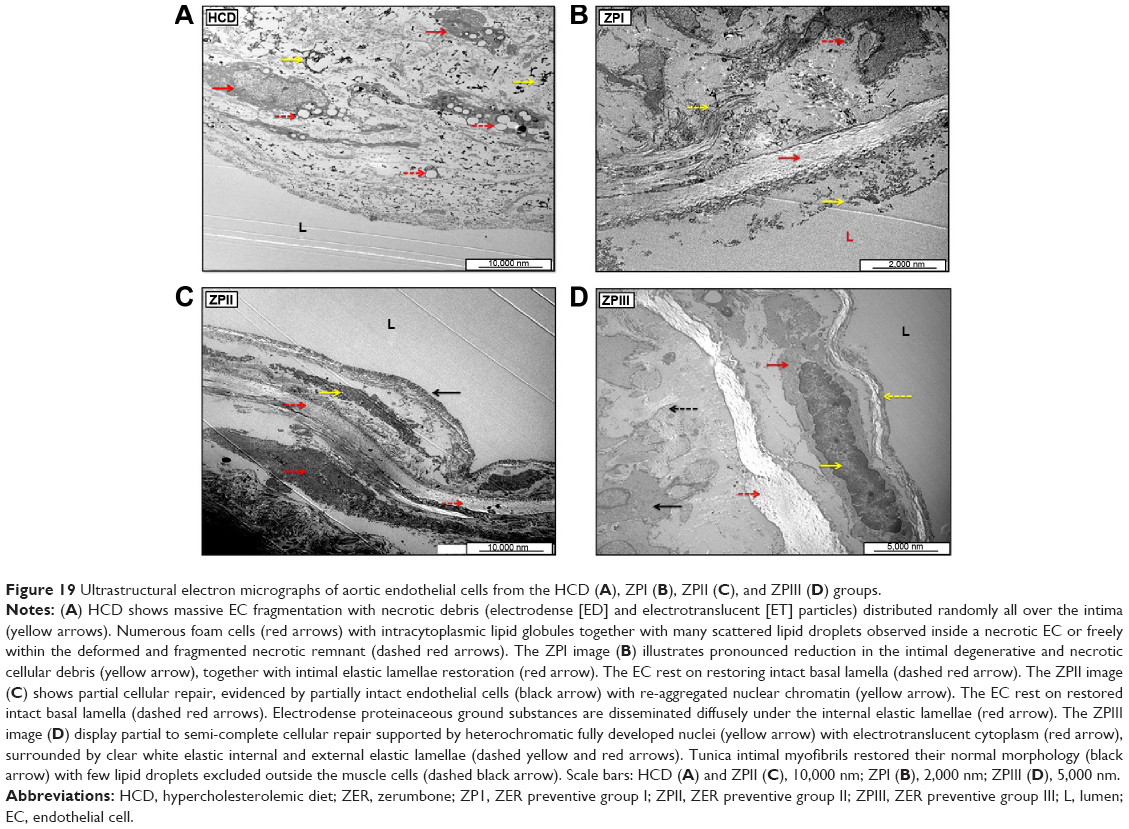 | Figure 19 Ultrastructural electron micrographs of aortic endothelial cells from the HCD (A), ZPI (B), ZPII (C), and ZPIII (D) groups. |
Lipid peroxidation and antioxidant status
Figure S6 illustrates the effect of ZER on MDA levels at W0, W5, and W10 timepoints. Feeding high cholesterol diet to the rabbits for 10 weeks resulted in a significant increase (P<0.05) in MDA levels in the HCD group compared to CN groups. However, at W5 and W10, ZER supplementation showed a significant reduction (P<0.05) of MDA levels in a dose-dependent manner compared to the HCD group. Moreover, the values were more significant in the ZPII and ZPIII groups at W10.
On the other hand, Figure S7 reveals the antioxidant effect of ZER, represented by SOD activity at W5 and W10 timepoints. Supplementation of ZER showed a significant (P<0.05) increase in SOD activity at W5 and W10 compared to the HCD group. SOD activity was higher in the ZPIII group at W10. However, no significant differences in SOD activity could be seen between the groups at the W0 baseline.
Therapeutic trial
In the current experiment, the protocol of treatment with ZER and SIM was introduced following the cessation of cholesterolemia induction at the 10th week and beyond, until the end of second experimental period at the 14th week. The rabbits received treatment for 4 weeks via force-feeding. The gavage time for ZER medication was regular, in the morning on an empty stomach; in contrast, SIM was given in the evening.
Body weight and feed intake
Figure S8A and B shows the mean body weight and feed intake values in all experimental groups that revealed incremental increase throughout the hypercholesterolemia induction period, which lasted for 10 weeks. Body weight and feed intake data were statistically not significantly different P<0.05 in all groups at W0 and W10. However, higher body weight and feed intake data were documented at W10. Following 4 weeks of treatment by W14, feed intake was reduced significantly (P<0.05) in all treatment groups; however, reduction in body weight was still not significant.
Organ weight
Figure S9A and B demonstrates the effect of ZER and SIM medication on the liver, abdominal fat, heart, kidneys, and spleen weights. The highest organ weight gain was documented in the HCD group, and the lowest gain was in the CN group. However, organ weights were remarkably reduced in all treatment groups compared to those in the HCD group, differences that were more significant in the ZIII and ZSG groups.
Serum lipid profiles
Therapeutic effect of ZER on serum lipid profiles is illustrated in Figure S10A–D. Generally, all groups at W0 showed no significant changes in serum TC, TG, LDL-C, and HDL-L. However, at W10, the lipid profile displayed significant augmentation in all experimental groups except for the CN group. Interestingly, following 4 weeks’ therapy with ZER and SIM, at W14 all treatment groups illustrated an impressive reduction in lipid profile, which was more significant in the SG and ZSG groups, particularly for TC, TG, and LDL-C. Furthermore, medication with SIM at a dose of 15 mg/kg/day revealed significant reduction in TC, LDL-C, and TG.
Assessment of atherosclerotic lesion area (sudanophilia)
Table 4 illustrates the semiquantitative atherosclerotic lesion area scoring. In general, treatment with ZER alone and together with SIM revealed a significant reduction in fatty streak development (area of sudanophilia) in a dose-dependent manner. Figure 20 displays bright red fatty streak lesion distribution in the HCD group compared to the CN group. Figure 21 shows the effect of ZER therapy on plaque development and establishment, in which ZER apparently reduced the size of the atherosclerotic lesion areas, since the value for size of the atherosclerotic lesion areas was more significant (P<0.05) in the ZIII group by 45% compared to the HCD group (at 96%). On the other hand, lesion reduction was statistically more significant in the SG and ZSG groups by 20% and 15%, respectively (Figure 22).
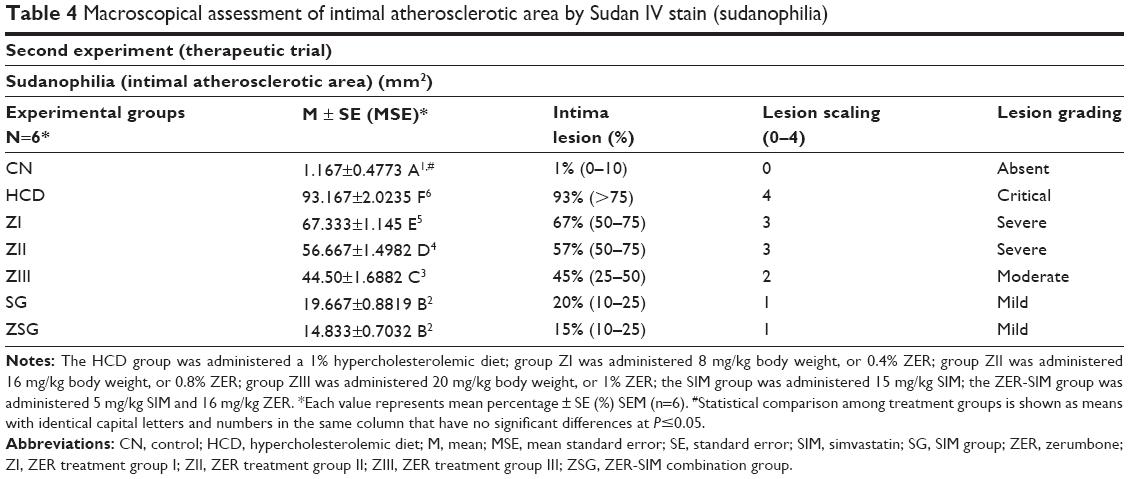 | Table 4 Macroscopical assessment of intimal atherosclerotic area by Sudan IV stain (sudanophilia) |
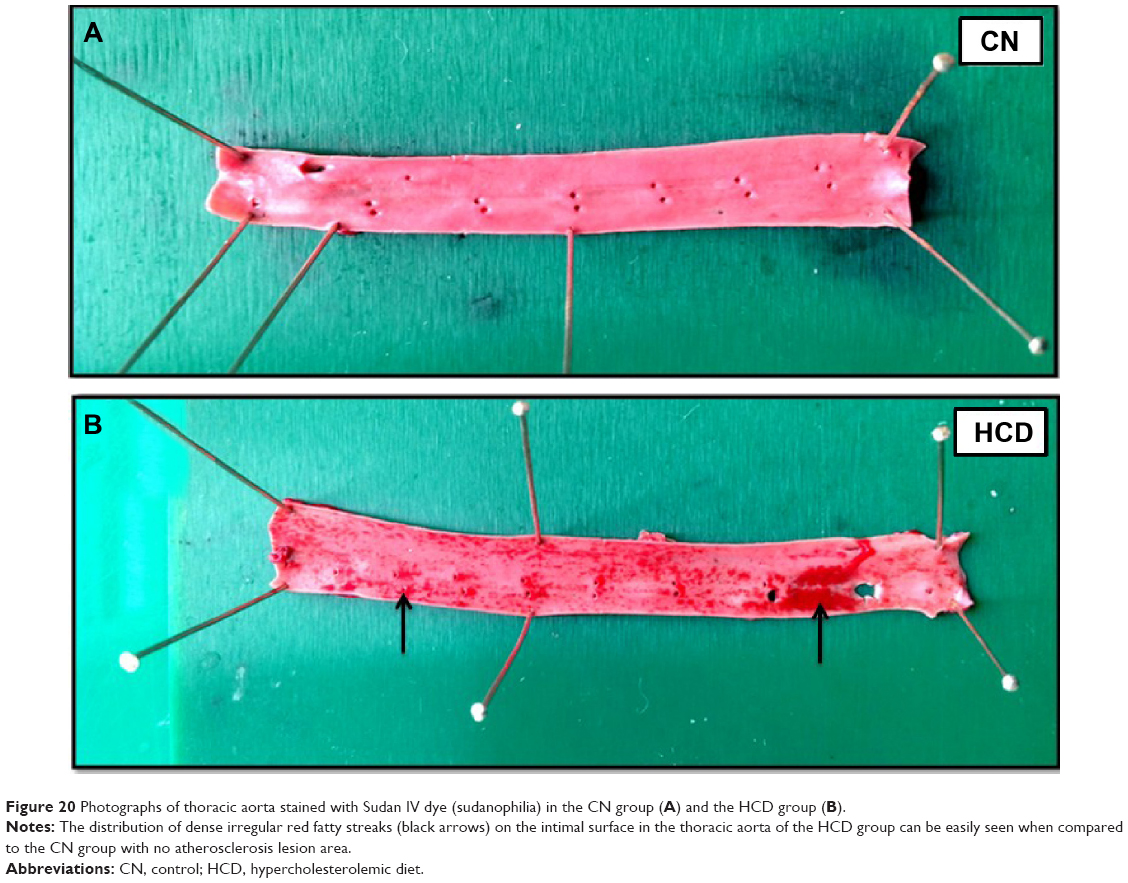 | Figure 20 Photographs of thoracic aorta stained with Sudan IV dye (sudanophilia) in the CN group (A) and the HCD group (B). |
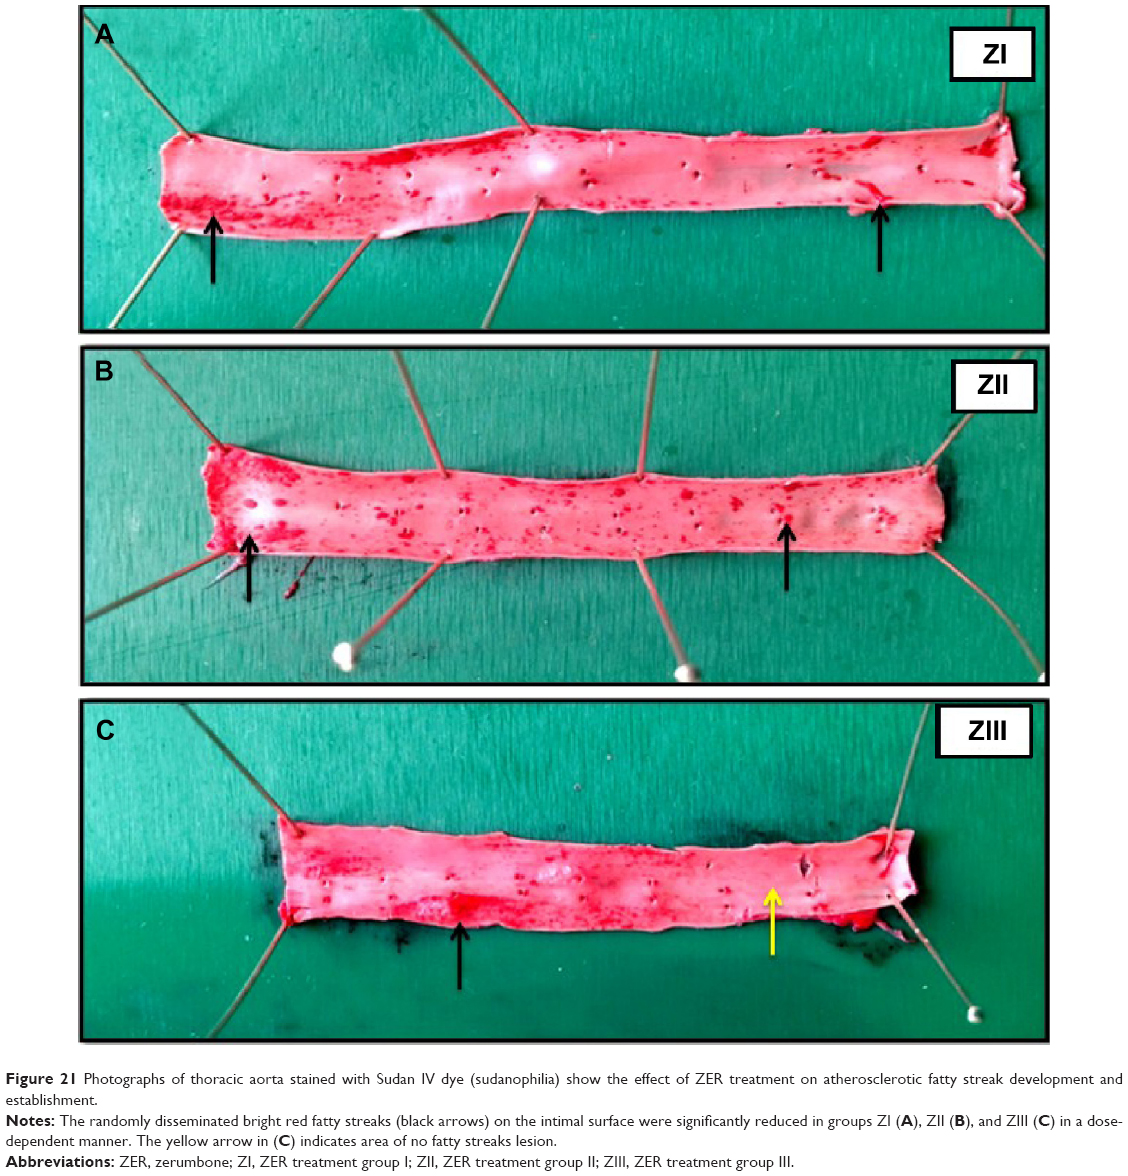 | Figure 21 Photographs of thoracic aorta stained with Sudan IV dye (sudanophilia) show the effect of ZER treatment on atherosclerotic fatty streak development and establishment. |
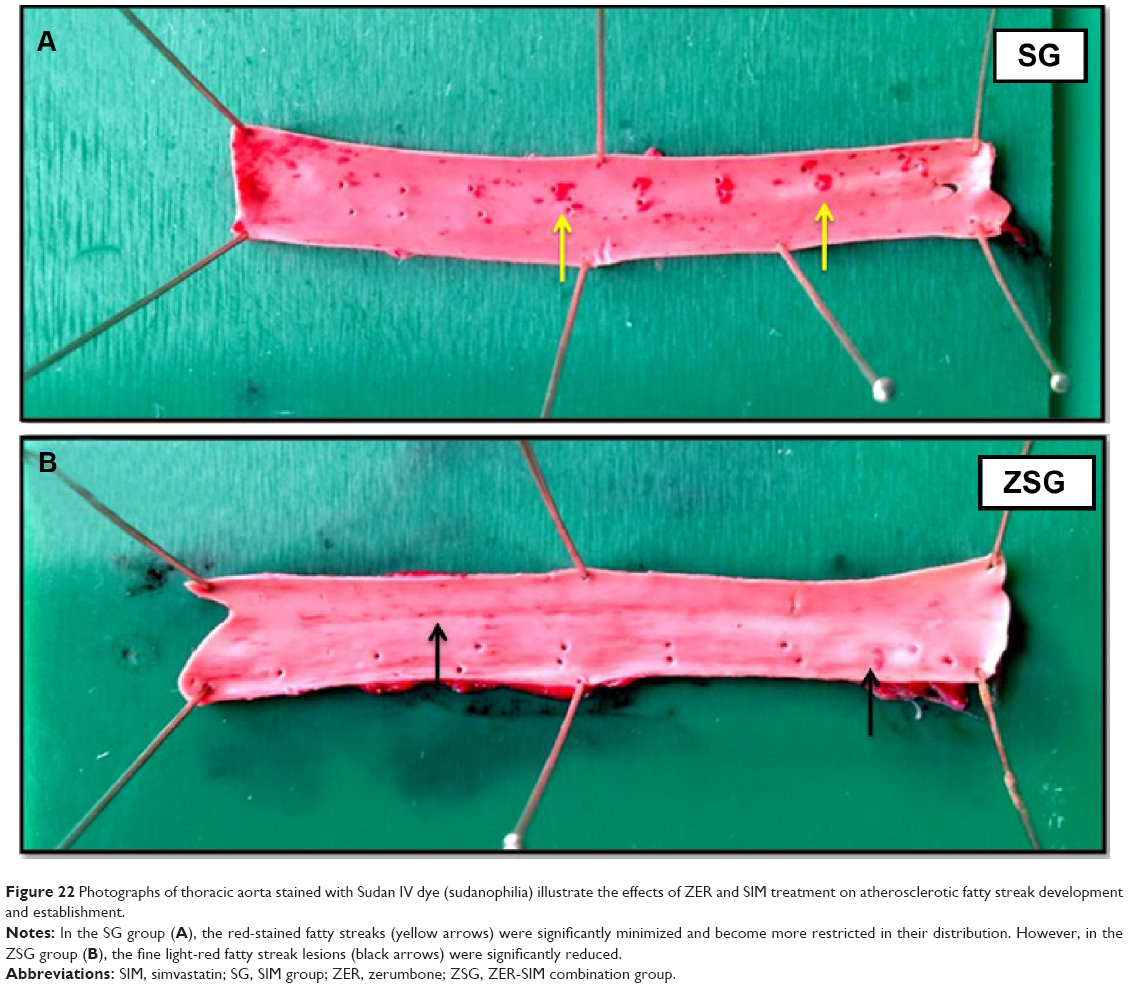 | Figure 22 Photographs of thoracic aorta stained with Sudan IV dye (sudanophilia) illustrate the effects of ZER and SIM treatment on atherosclerotic fatty streak development and establishment. |
Histopathological evaluation
Table 5 demonstrates a semiquantitative morphometric assay and lesion grading. Generally, rabbits in the HCD group showed a significant incremental increase in the atherosclerotic plaque buildup as expressed by intima-media thickness, increasing by 99% over a period of 10 weeks from a high-cholesterol diet. Figure 23 illustrates the primary plaque size and morphology in the HCD group compared to the lesion-free normal aorta in the CN group. Furthermore, the nearly mature plaque occupied almost 75% of the total aortal lumen.
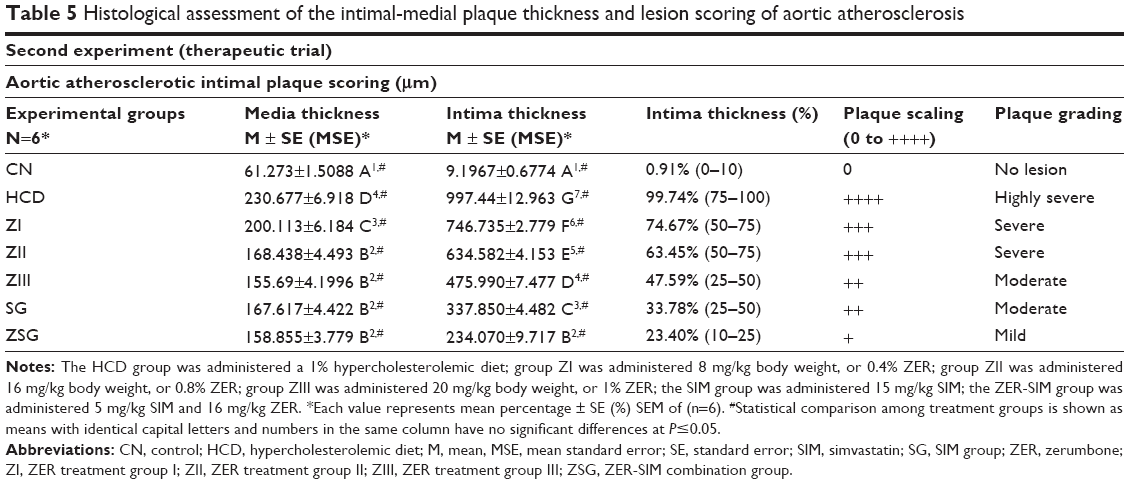 | Table 5 Histological assessment of the intimal-medial plaque thickness and lesion scoring of aortic atherosclerosis |
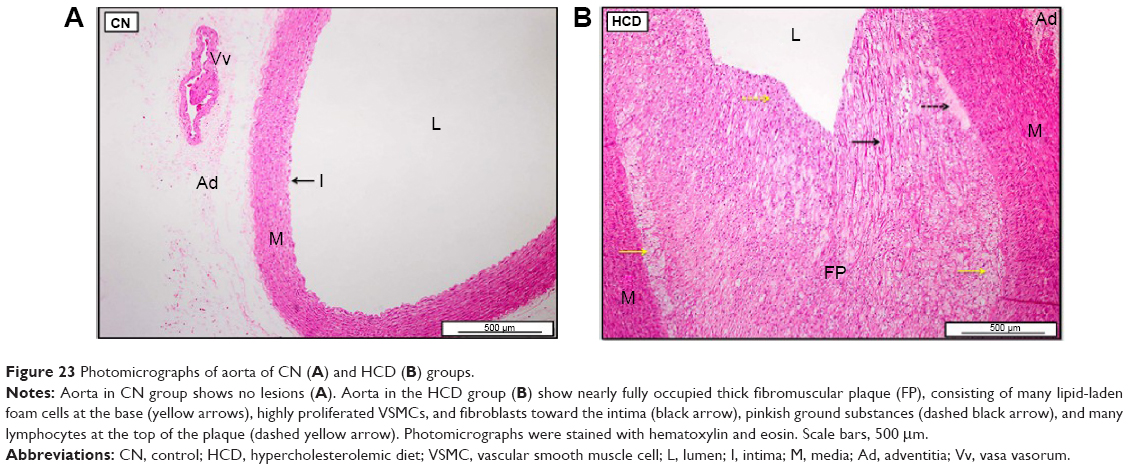 | Figure 23 Photomicrographs of aorta of CN (A) and HCD (B) groups. |
On the other hand, Figure 24 demonstrates reduction in the intimal plaque size in ZER treatment groups compared to the HCD group, which is quite significant in the ZIII group. However, the SG and ZSG groups also showed a prominent reduction in plaque size compared to the HCD group, with greater significance (P<0.05) in the ZSG group (Figure 25), in which the lesion is scaled as one plus (+) and graded as a mild lesion.
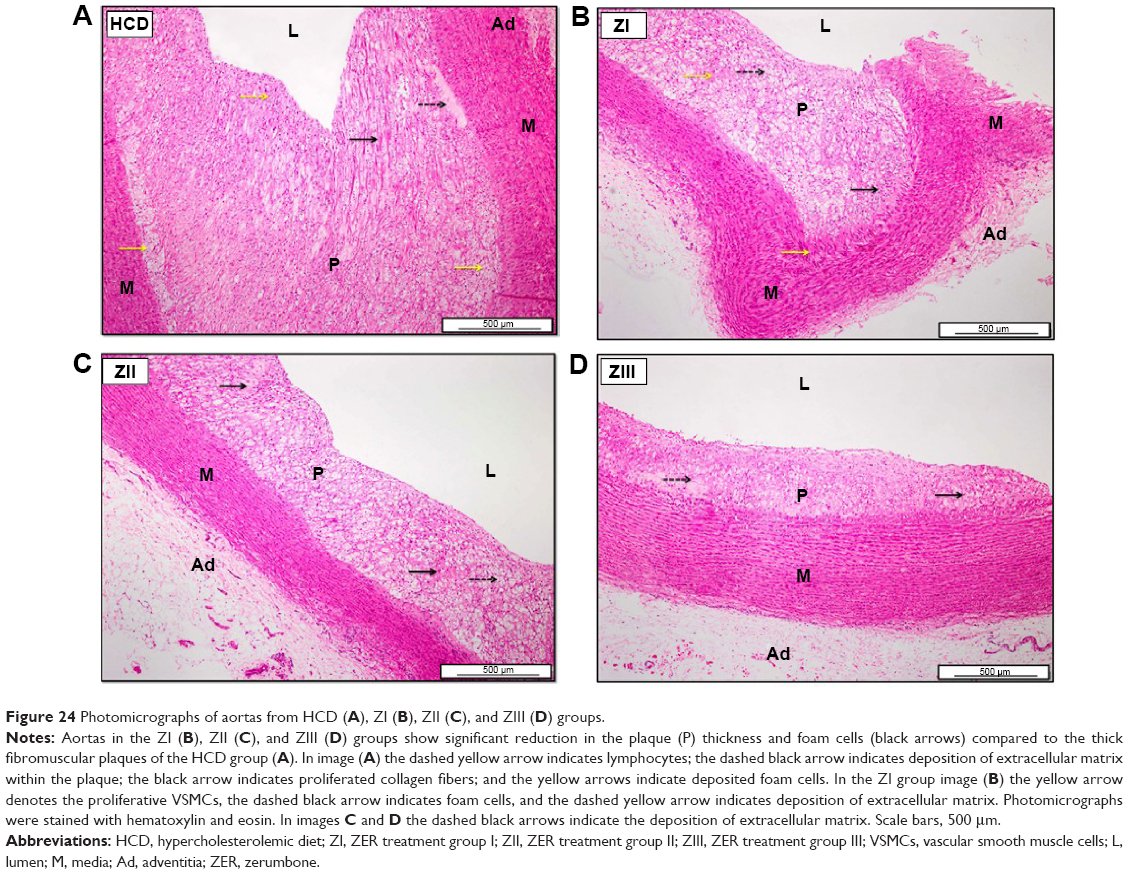 | Figure 24 Photomicrographs of aortas from HCD (A), ZI (B), ZII (C), and ZIII (D) groups. |
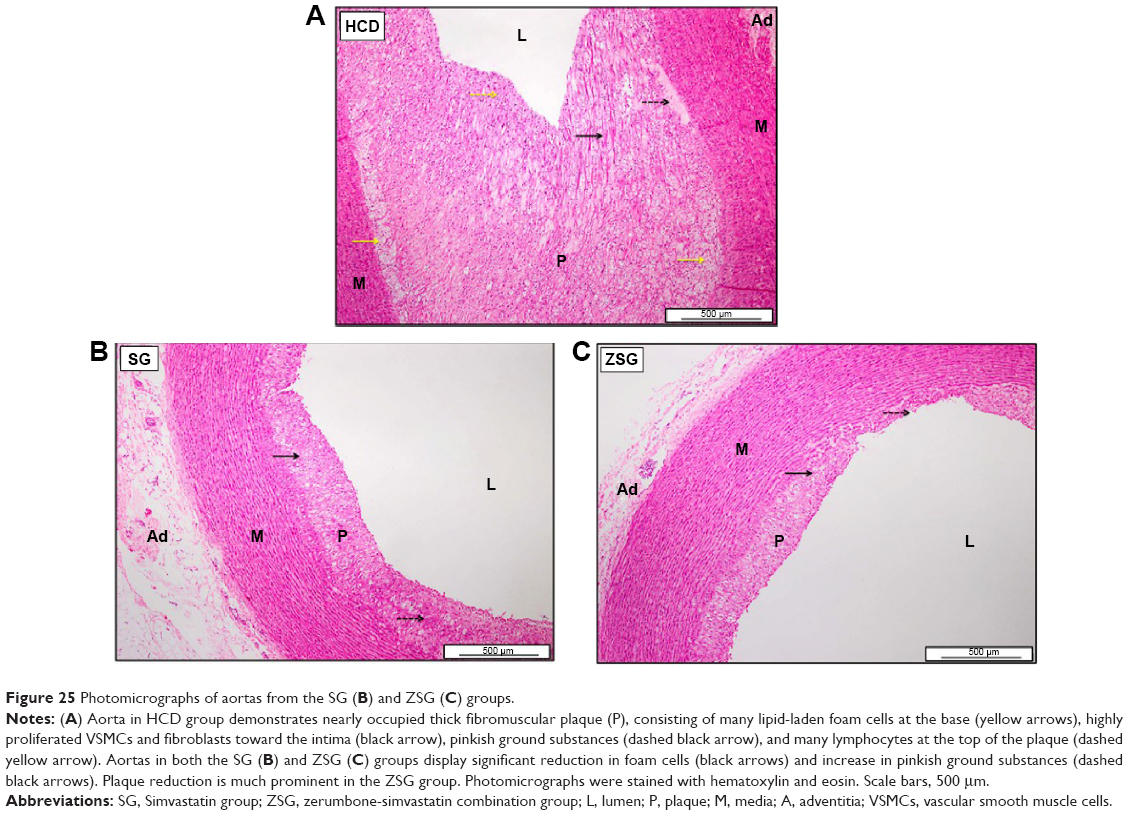 | Figure 25 Photomicrographs of aortas from the SG (B) and ZSG (C) groups. |
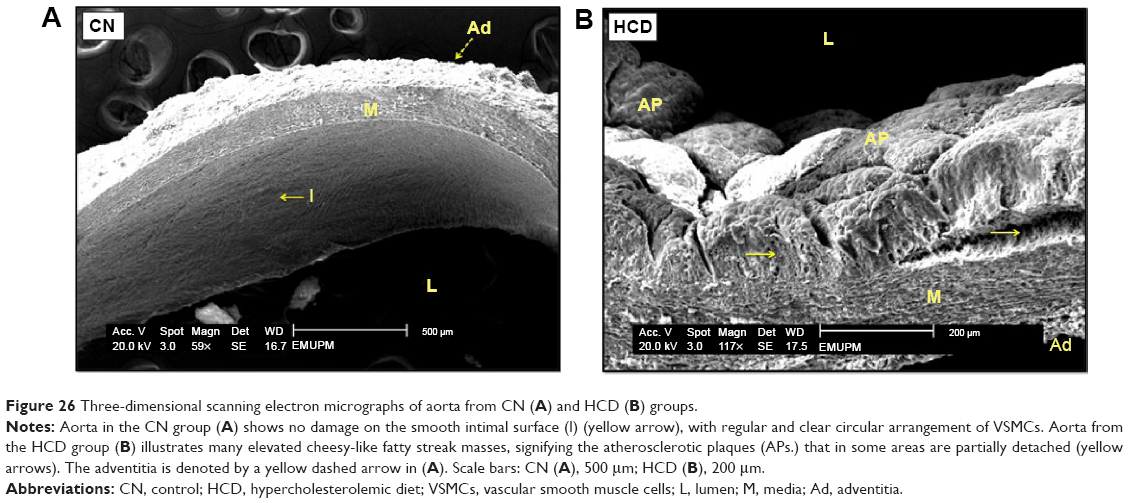
SEM evaluation
Figure 26 demonstrates the SEM of the intimal surface in the CN and HCD groups. The aorta in the CN group showed normal and regular orientation of the elastic lamellae together with an ordinary vascular smooth muscle cell direction in the tunica media. In contrast, the aorta in the HCD group had a thick, elevated, multifocal cheesy appearance with large fatty streaks. A SEM examination revealed an area in the plaque, which was partially separated from the intima due to its high cellular content. Remarkably, in the ZI, ZII, and ZIII groups, an obvious reduction in the plaque size was noted as a result of dose-dependent administration of ZER as compared to the HCD group (Figure 27). Moreover, Figure 28 demonstrates an exceptional reduction in plaque size in the SG group, and more obviously in ZSG group, compared to the HCD group.
 | Figure 26 Three-dimensional scanning electron micrographs of aorta from CN (A) and HCD (B) groups. |
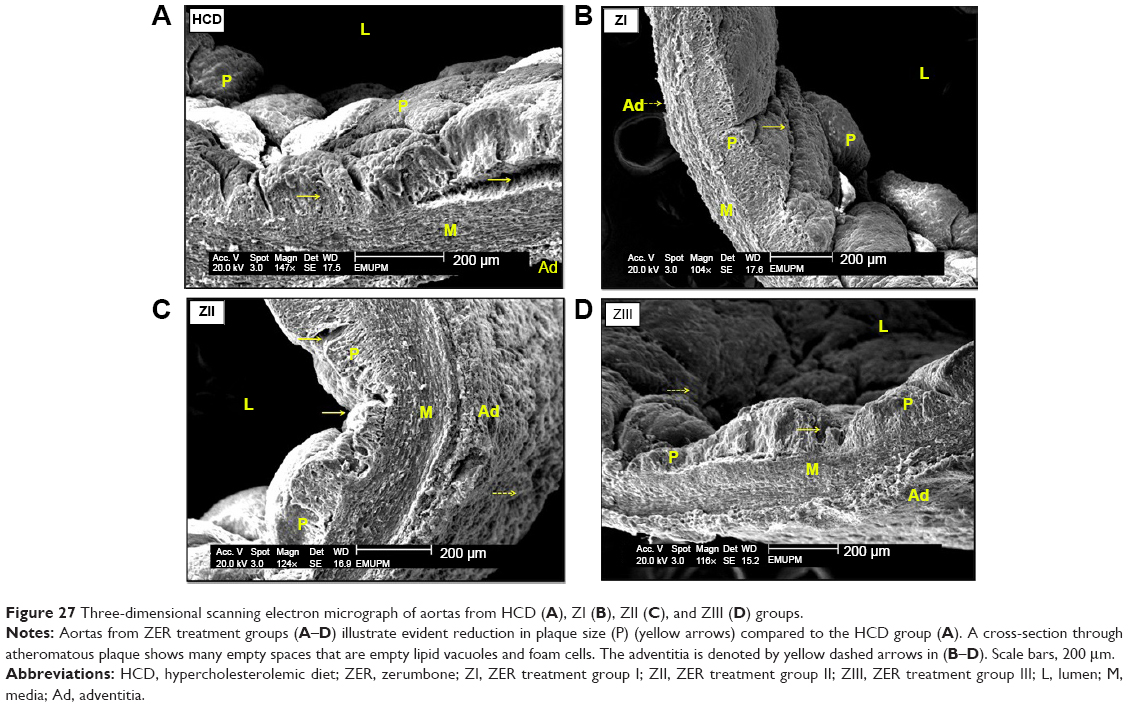 | Figure 27 Three-dimensional scanning electron micrograph of aortas from HCD (A), ZI (B), ZII (C), and ZIII (D) groups. |
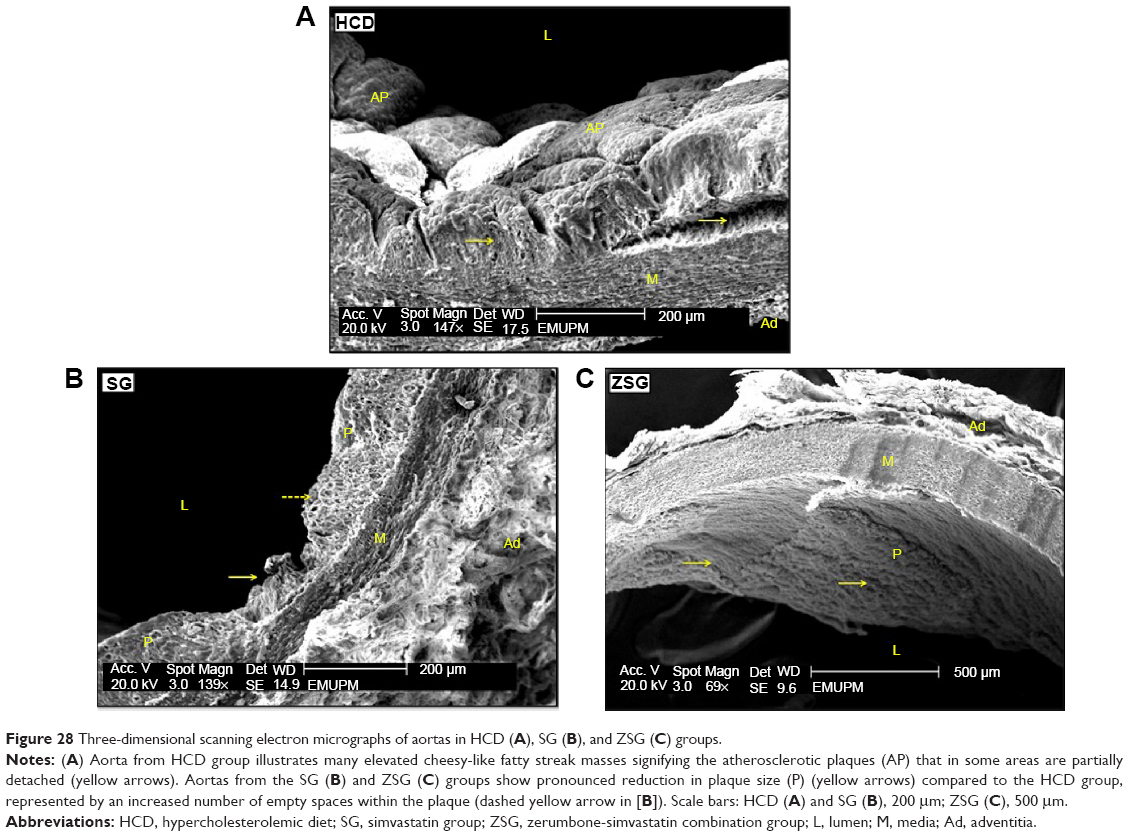 | Figure 28 Three-dimensional scanning electron micrographs of aortas in HCD (A), SG (B), and ZSG (C) groups. |
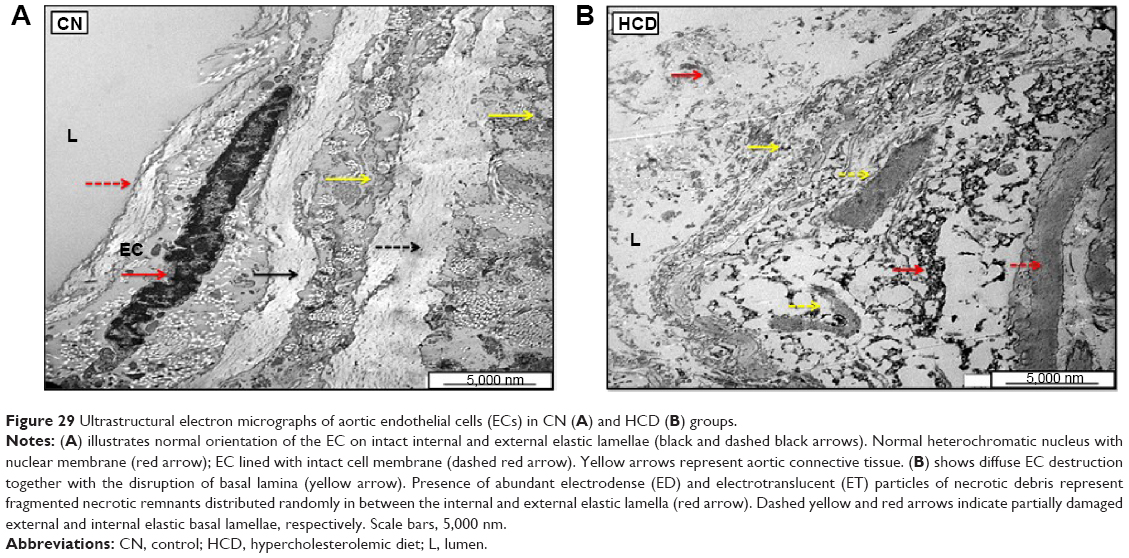
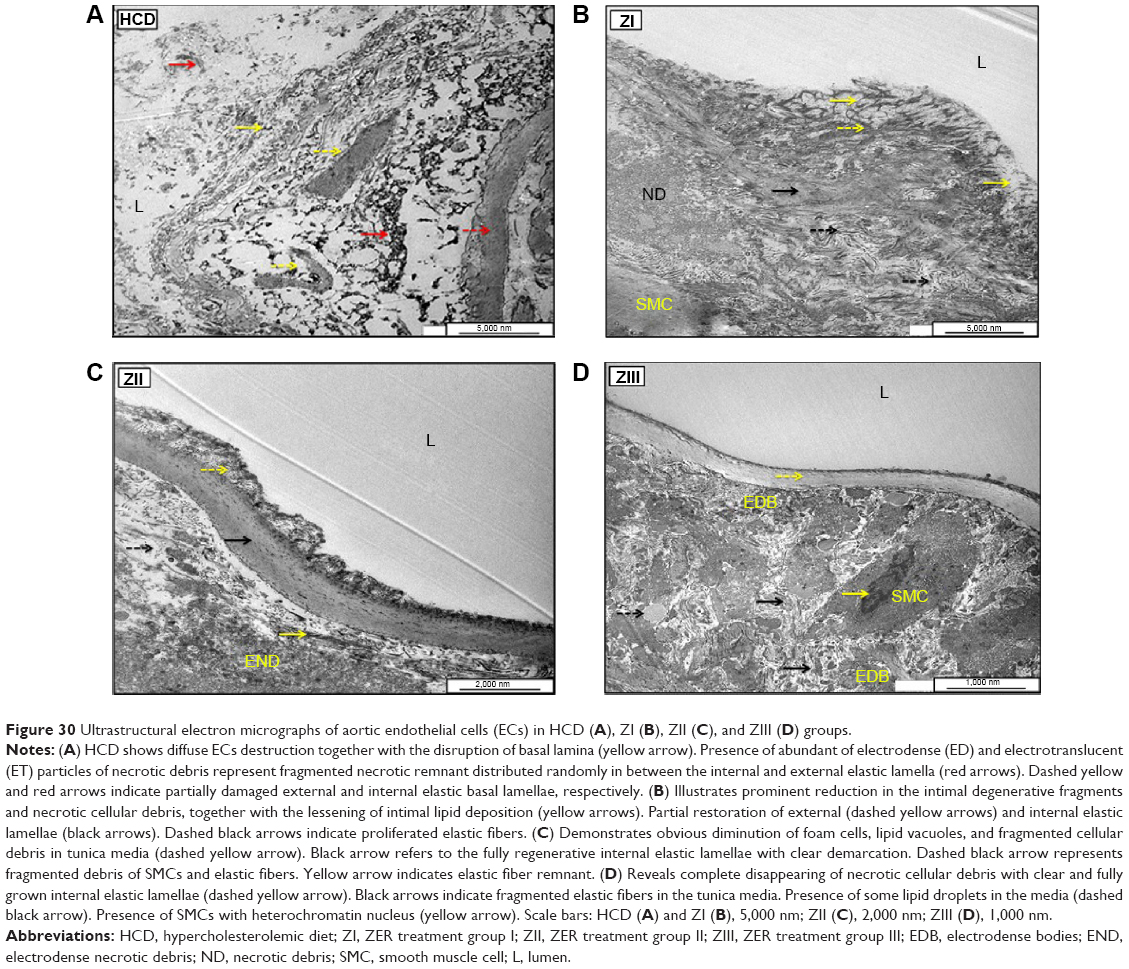
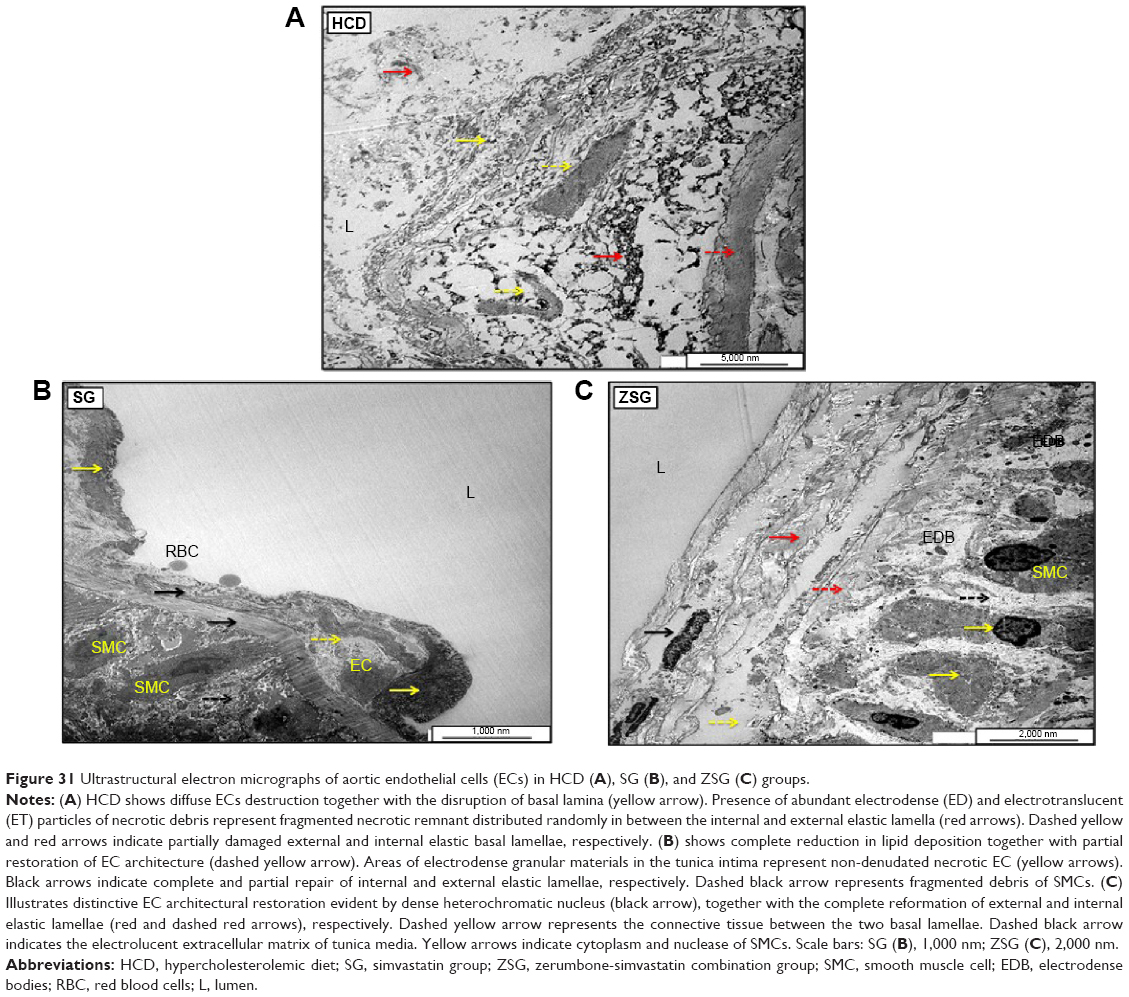
TEM evaluation
Figure 29 shows the results of the TEM analysis of aortas in the CN and HCD groups. An ultrastructural study of a single endothelial cell in the HCD group showed massive and diffuse destruction and fragmentation compared to the same type of cell in the CN group, which displayed a spindle shape that was oriented normally on the basal lamellae. Moreover, ZER treatment groups ZI, ZII, and ZIII showed prominent reduction in endothelial necrotic fragments and lipid deposition compared to the HCD group (Figure 30). However, a remarkable decrease in endothelial damage and partial restoration of cellular architecture were clearly observed in the SG and ZSG groups compared to the HCD group (Figure 31).
 | Figure 29 Ultrastructural electron micrographs of aortic endothelial cells (ECs) in CN (A) and HCD (B) groups. |
 | Figure 30 Ultrastructural electron micrographs of aortic endothelial cells (ECs) in HCD (A), ZI (B), ZII (C), and ZIII (D) groups. |
 | Figure 31 Ultrastructural electron micrographs of aortic endothelial cells (ECs) in HCD (A), SG (B), and ZSG (C) groups. |
Lipid peroxidation and antioxidant status
Figure S11 illustrates the effect of ZER treatment on lipid peroxidation biomarker MDA. Initially, at baseline W0, all groups showed no significant changes in MDA level. However, at W10, MDA values displayed a significant increase in all experimental groups, except the CN group. Moreover, at W14, following 4 weeks of treatment with SIM in the SG group, and with a combination of SIM and ZER in the ZSG group, all treatment groups showed a remarkable reduction in MDA level, which was more significant (P<0.05) in the ZIII and ZSG groups. Additionally, Figure S12 shows the effect of ZER and SIM treatments on the endogenous antioxidant biomarker SOD. The values of SOD showed a significant (P<0.05) incremental increase in all treatment groups at W14. However, lower SOD activity is documented at W10 in the HCD group compared to the CN group. Furthermore, the ZSG group showed more antioxidant effect, evidenced by a significant increase in SOD activity compared to the other treatment groups.
Discussion
One of the earliest events in the pathogenesis of atherosclerosis is the accumulation of oxLDL within the most inner arterial wall (intima), and the piling up of oxidatively modified LDL is a key factor in the initiation and progression in atheromatous lesions.38,39 Elevated levels of TC and TG will increase the risk of developing CHD, while a high level of HDL-C is useful in cholesterol metabolism through transporting of excess cholesterol to the liver to be excreted later in the bile.40–42
In the present study, the induction of experimental hypercholesterolemia was performed via 1% enriched high-cholesterol diet in a rabbit model of atherosclerosis; the preventive and therapeutic antihypercholesterolemic efficacy of ZER that was isolated from Z. zerumbet at the initiation, development, and establishment stages of early atherosclerosis was also evaluated. A previous study demonstrated that the ethanol extracts from Z. zerumbet significantly reduced the accumulation of visceral fat and improved hyperlipidemia in high-fat-diet obesity-induced rats by increasing lipid metabolism.7 In the current investigation, similar to the EE of Z. zerumbet treatment, oral administration of ZER with three different dose regimens significantly lowered the levels of serum TC, TG, and LDL-C, which contributed primarily to the reduction of atherosclerosis lesions in a dose-dependent manner.
It is suggested that the possible mechanism for the prevention and/or regression of atherosclerosis via serum lipid profile reduction is that ZER, in a dose-dependent manner (with more significant effects noticed in rabbits receiving 20 mg/kg), may inhibit the influx of oxLDL to the lesion site; at the same time, ZER may stimulate the transport of cholesterol to the liver as HDL for catabolism, where the cholesterol is finally converted to bile acids, which is an important pathway for eliminating excessive cholesterol from the body. These findings are in agreement with data reported previously in respect to the hypolipidemic and antiatherogenic effects of Zingiber extract in cholesterol-fed rabbits.43–45
The transition of blood-derived monocytes into lipid-laden foam cells via engulfing of modified LDL in fatty lesions is considered as any early initiative pacemaker in the process of atherogenesis.46 Therefore, another possible mechanism that may contribute to a better understanding the preventive and therapeutic antiatherogenic effects of ZER supplementation is the remarkable ability of the extract to suppress the expression of scavenger receptors on aggregated monocytes, which in turn block the uptake of excessive circulating oxLDL by macrophages, and as a result, reduce foam cell formation.15 Moreover, additional exploration has proved that EE of Zingiber exerts a protective effect on tissue lipid peroxidation and exhibits significant lipid-lowering activity in experimentally induced diabetic-dyslipidemia in rats.47
The results estimated from the current study suggest that consumption of ZER will both prevent and reduce the progression of early aortic atherosclerotic lesions in NZW rabbits on a high-cholesterol diet. This effect was associated with a significant reduction in the serum TC, TG, and LDL-C levels, together with a parallel reduction in the plaque size and area of fatty streak distribution evidenced in the morphological study. This effect may be due to the potent antioxidant content of ZER, which prevents free radical generation by the macrophage-derived foam cells.10,12
Our data were in harmony with another study that has suggested that consumption of ginger extract that is rich in phenolic antioxidants is associated with attenuation of early development of atherosclerosis via a significant reduction in plasma cholesterol that in turn reduces macrophage-mediated LDL oxidation, and inhibits LDL oxidation.4 Furthermore, in laboratory experiments, EE of Zingiber rhizomes has been shown to reduce plasma lipids in the cholesterol-fed rabbit model of atherosclerosis.48 Recent investigations emphasized that EE from Zingiber rhizomes showed remarkable protection from high-fat diet-induced metabolic syndromes in rats by strongly suppressing body weight gain, and by preventing hyperglycemia, hyperlipidemia, and insulin-resistant conditions.49 Additional research demonstrated that EE of Zingiber can regulate hepatic LDL and 3-hydroxy-3-methyl-glutaryl-coenzyme A reductase receptor expression in hyperlipidemic and hyperglycemic rats throughout reduction in cholesterol biosynthesis, together with an increased hepatic uptake of circulating LDL.50 Likewise, it was found that ginger acts as a hypolipidemic agent in cholesterol-fed rabbits.43,44
Feeding rats ginger extract significantly elevated the activity of hepatic cholesterol-7a-hydroxylase and the rate-limiting enzyme in bile acids biosynthesis, thereby stimulating cholesterol conversion to bile acids, resulting in elimination of cholesterol from the body.51 Our current study demonstrated that ZER supplementation orally as a preventive and therapeutic measure, along with SIM as a control positive for hypolipidemic agent, acted in the same manner by modulating hepatic uptake of TC and LDL-C via upregulating LDL receptor expression and increasing biosynthesis of bile acid in hepatic cells. The effect was in a dose-dependent manner that was more significant in a high dose regimen (20 mg/kg) in both experiments, while even more spectacular results were obtained in the preventive trial than an actual cure.
Atherosclerosis is a multi-factorial vascular disorder associated with different risk factors.52 Hypercholesterolemia has been determined to be a major risk factor for atherosclerosis,53 and reduction in plasma cholesterol concentration by statin drug therapy has intensely reduced cardiovascular incidence.54 Consumption of active natural compound nutrients, capable of reducing plasma cholesterol, should thus reduce the initiation, development, and further establishment of atherosclerosis.55,56 The association of hyperlipidemia with the initiation and development of atherosclerotic lesions has encouraged an extensive search for plant-based compounds that can effectively control blood and tissue lipid profiles with little or no toxic effects compared to synthetic versions.57
The present study demonstrated that dietary consumption of ZER in hypercholesterolemic rabbits significantly prevented, and to some extent, reduced the development and establishment of aortic atherosclerotic lesions, along with an impressive reduction in the levels of plasma LDL-C. Hypolipidemic and antiatherosclerotic effects of ginger extract, particularly Zingiber, were also demonstrated in cholesterol-fed rabbits.43 The hypocholesterolemic effect of ZER could have also possibly resulted from the inhibition of cellular cholesterol biosynthesis. In vivo cellular cholesterol synthesis following consumption and digestion appeared to be inhibited by ginger extract-derived metabolites. Reduced cellular cholesterol biosynthesis is associated with increased activity of the LDL receptor, which in turn leads to enhanced removal of LDL from plasma, and results in reduced plasma cholesterol concentration.58
The antiatherogenicity of ZER could also be attributed to its direct antioxidative effects on macrophages and on plasma LDL. Arterial wall macrophages also play a major role during early atherogenesis.59,60 Furthermore, oxidative stress induces macrophage responses that lead to increased capacity for oxLDL, increasing oxLDL cellular uptake, as well as macrophage lipid peroxidation and foam cell formation in the wall of the affected artery.39,61 On the other hand, the results showed that treatment with ZER alone or in combination with SIM caused a substantial, if not profound, reduction in the atherogenic and coronary indices, as well as plaque size, in experimental hyperlipidemic rabbits. The results were more significant in ZER-SIM (administered 16 mg/kg ZER and 5 mg/kg SIM) combination groups as a synergistic action.
This result strongly suggests that ZER has therapeutic potential for the management of obesity, hyperlipidemia, and development of early atherosclerosis, as well as for the prevention of atherogenic cardiovascular diseases, because previous studies suggested that ginger stimulates the conversion of cholesterol to bile acids, which is an important pathway of elimination of excessive cholesterol from the body.43,44 Likewise, oxidative stress induced by chronic and acute overproduction of reactive oxygen species (ROS) under many pathophysiological conditions played an important role in the development of cardiovascular diseases throughout various signaling pathways that stimulated vascular inflammation during the development of atherogenesis, starting from the initiation of the fatty streak, lesion development, and ultimately progressing to plaque rupture.62–64
Hypercholesterolemia, elevated circulating oxLDL, together with reduced plasma level of HDL-C, consistently correlated with the increment level of MDA, a lipid peroxidation byproduct that indicates high ROS and low antioxidant levels.65 In hypercholesterolemic atherosclerosis, considerable reduction in lesion development by antioxidant supplementation has been found to be associated with a decrease in plasma level of MDA and an increase in the antioxidant reserve.66,67 On the other hand, it has been shown that the majority of plants with natural antioxidant compounds also have a potential role in protection from a number of human maladies, such as cardiovascular diseases.68,69
Thus, in the present study, antioxidant properties were found by restoring the redox equilibrium where ZER increased the level of E-SOD while concomitantly minimizing the MDA level. This dual action resulted in a significant reduction in free radical accumulation and lipid peroxidation, because ZER reduced the generation of free radicals from inflammatory cells.12 The same outcome has also been documented by other research with respect to restoring the redox equilibrium by utilizing ZER in a rat model of osteoarthritis.70 Moreover, the reduction in atherosclerosis lesions and plaque appears to be the result of the anti-inflammatory, antiproliferative, and antioxidant potential in suppression of mononuclear inflammatory cell migration via suppression of cyclooxygenase-2, nitric oxide synthase, and NF-κB expression. This, furthermore, eliminated free radicals through a reduction in inflammatory cytokines, such as interleukin-1 and TNF-α.71 In conclusion, it is evident from the obtained data that ZER supplementation (8, 16, and 20 mg/kg) in combination with an HCD fed to rabbits for 10 weeks as a prophylactic measure, administered in a dose-dependent manner, resulted in less marked hyperlipidemia and comparatively, significantly lower grades of atherosclerotic lesions in rabbit aortas as compared to the pathogenic CN group (ie, rabbits maintained on a high-cholesterol diet alone).
Finally, the data revealed through toxicity assay that there was no significant toxic effect on hepatic and renal functions, evidenced by a biochemical and morphological evaluation. Therefore, the safety profile of ZER based on the current study points to the need for additional investigations to explore the advantageous effect of this herbal product using a higher dosage regimen and a longer duration in retarding development of early atherosclerosis.
Conclusion
In the current study, it was established that oral administration of ZER at doses of 8, 16, and 20 mg/kg alone as a prophylactic measure and as a supplementary treatment with SIM subsequent to atheromatous plaque formation, development, and establishment proved to exert significant antiatherogenic efficacy in preventing and reducing the severity of the lesion in a time- and dose-dependent manner. In addition, ZER significantly reduced the serum lipid profile together with suppression of lipid peroxidation and oxidative stress damage, and further augmented the antioxidant status of ZER relative to atherosclerotic lesions.
Furthermore, supplementation of ZER administered together with a high-cholesterol diet for 10 weeks as a prophylactic measure in a dose-dependent manner, resulted in decreased hyperlipidemia and comparatively lowers grades of atherosclerotic lesions. Finally, the safety profile of ZER, based on this study, requires more investigation to explore the advantageous effect of this herbal product, when using a higher dosage regimen and/or longer duration, against the development of early atherosclerosis.
Acknowledgments
The authors would like to express their utmost gratitude and appreciation to Universiti Putra Malaysia (UPM) (Grant number RUGS-5450334) and the histopathology laboratory of the Faculty of Veterinary Medicine, UPM, for providing instruments, chemicals, and consumables for conducting the current experiments.
Disclosure
The authors report no conflicts of interest in this work.
References
Steinberg D. Atherogenesis in perspective: hypercholesterolemia and inflammation as partners in crime. Nat Med. 2002;8:1211–1217. | ||
Holvoet P, Mertens A, Verhamme P, et al. Circulating oxidized LDL is a useful marker for identifying patients with coronary artery disease. Arterioscler Thromb Vasc Biol. 2001;21:844–848. | ||
Meisinger C, Baumert J, Khuseyinova N, Loewel H, Koenig W. Plasma oxidized low-density lipoprotein, a strong predictor for acute coronary heart disease events in apparently healthy, middle-aged men from the general population. Circulation. 2005;112:651–657. | ||
Fuhrman B, Rosenblat M, Hayek T, Coleman R, Aviram M. Ginger extract consumption reduces plasma cholesterol, inhibits LDL oxidation and attenuates development of atherosclerosis in atherosclerotic, apolipoprotein E-deficient mice. J Nutr. 2000;130:1124–1131. | ||
Ruslay S, Abas F, Shaari K, et al. Characterization of the components present in the active fractions of health gingers (Curcuma xanthorrhiza and Zingiber zerumbet) by HPLC–DAD–ESIMS. Food Chem. 2007; 104:1183–1191. | ||
Yob N, Jofrry SM, Affandi M, Teh L, Salleh M, Zakaria Z. Zingiber zerumbet (L.) Smith: a review of its ethnomedicinal, chemical, and pharmacological uses. Evid Based Complement Alternat Med. 2011;2011:543216. | ||
Chang CJ, Tzeng TF, Liou SS, Chang YS, Liu IM. Regulation of lipid disorders by ethanol extracts from Zingiber zerumbet in high-fat diet-induced rats. Food Chem. 2012;132:460–467. | ||
Duve R. Highlights of the chemistry and pharmacology of wild ginger (Zingiber zerumbet Smith). Fiji Agri J. 1980;42:41–43. | ||
Kitayama T. Attractive reactivity of a natural product, zerumbone. Biosci Biotechnol Biochem. 2011;75:199–207. | ||
Murakami A, Takahashi D, Kinoshita T, et al. Zerumbone, a Southeast Asian ginger sesquiterpene, markedly suppresses free radical generation, proinflammatory protein production, and cancer cell proliferation accompanied by apoptosis: the α, β-unsaturated carbonyl group is a prerequisite. Carcinogenesis. 2002;23:795–802. | ||
Schulze PC, Lee RT. Oxidative stress and atherosclerosis. Curr Atheroscler Rep. 2005;7:242–248. | ||
Murakami A, Ohigashi H. Cancer-preventive anti-oxidants that attenuate free radical generation by inflammatory cells. Biol Chem. 2006; 387:387–392. | ||
Song L, Leung C, Schindler C. Lymphocytes are important in early atherosclerosis. J Clin Invest. 2001;108:251–259. | ||
Galkina E, Ley K. Immune and inflammatory mechanisms of atherosclerosis. Annu Rev Immunol. 2009;27:165–197. | ||
Eguchi A, Kaneko Y, Murakami A, Ohigashi H. Zerumbone suppresses phorbol ester-induced expression of multiple scavenger receptor genes in THP-1 human monocytic cells. Biosci Biotechnol Biochem. 2007;71:935–945. | ||
Ohta H, Wada H, Niwa T, et al. Disruption of tumor necrosis factor-α gene diminishes the development of atherosclerosis in ApoE-deficient mice. Atherosclerosis. 2005;180:11–17. | ||
Rahman HS, Rasedee A, How CW, et al. Zerumbone-loaded nanostructured lipid carriers: preparation, characterization, and antileukemic effect. Int J Nanomedicine. 2013;8:2769–2781. | ||
Al-Saffar FJ, Ganabadi S, Fakurazi S, Yaakub H. Zerumbone improved immunoreactivity of neuropeptides in monosodium iodoacetate induced knee osteoarthritis in rat. African J Biotech. 2011;10:3646–3653. | ||
Shiomi M, Yamada S, Ito T. Atheroma stabilizing effects of simvastatin due to depression of macrophages or lipid accumulation in the atheromatous plaques of coronary plaque-prone WHHL rabbits. Atherosclerosis. 2005;178:287–294. | ||
Hernández-Presa MA, Ortego M, Tuñón J, et al. Simvastatin reduces NF-κB activity in peripheral mononuclear and in plaque cells of rabbit atheroma more markedly than lipid lowering diet. Cardiovasc Res. 2003;57:168–177. | ||
Charoenwanthanang P, Lawanprasert S, Phivthong-Ngam L, Piyachaturawat P, Sanvarinda Y, Porntadavity S. Effects of Curcuma comosa on the expression of atherosclerosis-related cytokine genes in rabbits fed a high-cholesterol diet. J Ethnopharmacol. 2011;134:608–613. | ||
Gómez-Garre D, Muñoz-Pacheco P, González-Rubio M, Aragoncillo P, Granados R, Fernández-Cruz A. Ezetimibe reduces plaque inflammation in a rabbit model of atherosclerosis and inhibits monocyte migration in addition to its lipid-lowering effect. Br J Pharmacol. 2009; 156:1218–1227. | ||
Prasad K. Reduction of serum cholesterol and hypercholesterolemic atherosclerosis in rabbits by secoisolariciresinol diglucoside isolated from flaxseed. Circulation. 1999;99:1355–1362. | ||
Campbell JH, Efendy JL, Smith NJ, Campbell GR. Molecular basis by which garlic suppresses atherosclerosis. J Nutr. 2001;131: 1006S–1009S. | ||
Nurulhuda MH, Azlan A, Ismail A, Amom Z, Shakirin FH. Cholesterol-lowering and atherosclerosis inhibitory effect of Sibu olive in cholesterol fed-rabbit. Asian J Biochem. 2012;7:80–89. | ||
Zulkhairi A, Zaiton Z, Jamaluddin M, et al. Alpha lipoic acid posses dual antioxidant and lipid lowering properties in atherosclerotic-induced New Zealand White rabbit. Biomed Pharmacother. 2008;62:716–722. | ||
Yanni AE. The laboratory rabbit: an animal model of atherosclerosis research. Lab Anim. 2004;38:246–256. | ||
Luna LG, editor. Manual of Histologic Staining Methods of the Armed Forces Institute of Pathology. New York: Blakiston Division, McGraw-Hill; 1968. | ||
Moghadasian MH. Experimental atherosclerosis: a historical overview. Life Sci. 2002;70:855–865. | ||
Prasad K. Regression of hypercholesterolemic atherosclerosis in rabbits by secoisolariciresinol diglucoside isolated from flaxseed. Atherosclerosis. 2008;197:34–42. | ||
Liang J, Liu E, Yu Y, et al. Macrophage metalloelastase accelerates the progression of atherosclerosis in transgenic rabbits. Circulation. 2006; 113:1993–2001. | ||
Zheng S, Qian Z, Tang F, Sheng L. Suppression of vascular cell adhesion molecule-1 expression by crocetin contributes to attenuation of atherosclerosis in hypercholesterolemic rabbits. Biochem Pharmacol. 2005;70:1192–1199. | ||
Bocan T, Mueller SB, Mazur MJ, Uhlendorf PD, Brown EQ, Kieft KA. The relationship between the degree of dietary-induced hypercholesterolemia in the rabbit and atherosclerotic lesion formation. Atherosclerosis. 1993;102:9–22. | ||
Hakimoğlu F, Kizii G, Kanay Z, Kizil M, Isi H. The effect of ethanol extract of Hypericum lysimachioides on lipid profile in hypercholesterolemic rabbits and its in vitro antioxidant activity. Atherosclerosis. 2007;192:113–122. | ||
Lapenna D, Ciofani G, Pierdomenico SD, Giamberardino MA, Cuccurullo F. Reaction conditions affecting the relationship between thiobarbituric acid reactivity and lipid peroxides in human plasma. Free Radic Biol Med. 2001;31:331–335. | ||
Ohkawa H, Ohishi N, Yagi K. Assay for lipid peroxides in animal tissues by thiobarbituric acid reaction. Anal Biochem. 1979;95:351–358. | ||
Marklund S, Marklund G. Involvement of the superoxide anion radical in the autoxidation of pyrogallol and a convenient assay for superoxide dismutase. Eur J Biochem. 1974;47:469–474. | ||
Steinberg D. Low density lipoprotein oxidation and its pathobiological significance. J Biol Chem. 1997;272:20963–20966. | ||
Chisolm GM, Steinberg D. The oxidative modification hypothesis of atherogenesis: an overview. Free Radic Biol Med. 2000;28:1815–1826. | ||
Castelli WP. Lipids, risk factors and ischaemic heart disease. Atherosclerosis. 1996;124 Suppl:S1–S9. | ||
Chapman MJ, Ginsberg HN, Amarenco P, et al; European Atherosclerosis Society Consensus Panel. Triglyceride-rich lipoproteins and high-density lipoprotein cholesterol in patients at high risk of cardiovascular disease: evidence and guidance for management. Eur Heart J. 2011;32:1345–1361. | ||
Toth PP, Davidson MH. High-density lipoproteins: marker of cardiovascular risk and therapeutic target. J Clin Lipidol. 2010;4:359–364. | ||
Sharma I, Gusain D, Dixit VP. Hypolipidemic and antiatherosclerotic effects of Zingiber officinale in cholesterol fed rabbits. Phytomeicine Res. 1996;10:517–518. | ||
Bhandari U, Sharma J, Zafar R. The protective action of ethanolic ginger (Zingiber officinale) extract in cholesterol fed rabbits. J Ethnopharmacol. 1998;61:167–171. | ||
Ahmed RS, Suke SG, Seth V, Chakraborti A, Tripathi AK, Banerjee BD. Protective effects of dietary ginger (Zingiber officinales Rosc.) on lindane-induced oxidative stress in rats. Phytother Res. 2008; 22:902–906. | ||
Gerrity R. The role of the monocyte in atherogenesis: I. Transition of blood-borne monocytes into foam cells in fatty lesions. Am J Pathol. 1981;103:181–190. | ||
Bhandari U, Pillai K. Effect of ethanolic extract of Zingiber officinale on dyslipidaemia in diabetic rats. J Ethnopharmacol. 2005;97:227–230. | ||
Verma SK, Singh M, Jain P, Bordia A. Protective effect of ginger, Zingiber officinale Rosc on experimental atherosclerosis in rabbits. Indian J Exp Biol. 2004;42:736–738. | ||
Nammi S, Sreemantula S, Roufogalis BD. Protective Effects of Ethanolic Extract of Zingiber officinale Rhizome on the Development of Metabolic Syndrome in High-Fat Diet-Fed Rats. Basic Clin Pharmacol Toxicol. 2009;104:366–373. | ||
Nammi S, Kim MS, Gavande NS, Li GQ, Roufogalis BD. Regulation of low-density lipoprotein receptor and 3-hydroxy-3-methylglutaryl coenzyme A reductase expression by Zingiber officinale in the liver of high-fat diet-fed rats. Basic Clin Pharmacol Toxicol. 2010;106:389–395. | ||
Srinivasan K, Sambaiah K. The effect of spices on cholesterol 7 alpha-hydroxylase activity and on serum and hepatic cholesterol levels in the rat. Int J Vitam Nutr Res. 1991;61:364–369. | ||
Badimon J, Fuster V, Chesebro J, Badimon L. Coronary atherosclerosis. A multifactorial disease. Circulation. 1993;87:113–116. | ||
Malloy MJ, Kane JP. Hyperlipidemia and cardiovascular disease. Curr Opin Lipidol. 2012;23:591–592. | ||
Gotto AM Jr, Grundy SM. Lowering LDL cholesterol: questions from recent meta-analyses and subset analyses of clinical trial data issues from the Interdisciplinary Council on Reducing the Risk for Coronary Heart Disease, ninth Council meeting. Circulation. 1999;99:E1–E7. | ||
Zeng Y, Song JX, Shen XC. Herbal remedies supply a novel prospect for the treatment of atherosclerosis: a review of current mechanism studies. Phytother Res. 2012;26:159–167. | ||
Mashour NH, Lin GI, Frishman WH. Herbal medicine for the treatment of cardiovascular disease: clinical considerations. Arch Intern Med. 1998;158:2225–2234. | ||
Jasuja ND. Hypocholesterolemic and antioxidant potentials of some plants and herbs: a review. J Zool Sci. 2013;1(2):26–42. | ||
Ness GC, Zhao Z, Lopez D. Inhibitors of cholesterol biosynthesis increase hepatic low-density lipoprotein receptor protein degradation. Arch Biochem Biophys. 1996;325:242–248. | ||
Libby P, Geng YJ, Aikawa M, et al. Macrophages and atherosclerotic plaque stability. Curr Opin Lipidol. 1996;7:330–335. | ||
Libby P, Ridker PM, Maseri A. Inflammation and atherosclerosis. Circulation. 2002;105:1135–1143. | ||
Hegele RA. The pathogenesis of atherosclerosis. Clinica Chimica Acta. 1996;246(1–2):21–38. | ||
Freedman JE. High-fat diets and cardiovascular diseaseAre nutritional supplements useful? J Am Coll Cardiol. 2003;41:1750–1752. | ||
Madamanchi NR, Vendrov A, Runge MS. Oxidative stress and vascular disease. Arterioscler Thromb Vasc Biol. 2005;25:29–38. | ||
Singh U, Jialal I. Oxidative stress and atherosclerosis. Pathophysiology. 2006;13:129–142. | ||
Fearon IM, Faux SP. Oxidative stress and cardiovascular disease: novel tools give (free) radical insight. J Mol Cell Cardiol. 2009;47: 372–381. | ||
Heistad DD, Wakisaka Y, Miller J, Chu Y, Pena-Silva R. Novel aspects of oxidative stress in cardiovascular diseases. Circ J. 2009;73: 201–207. | ||
Schwenke DC, Behr SR. Vitamin E combined with selenium inhibits atherosclerosis in hypercholesterolemic rabbits independently of effects on plasma cholesterol concentrations. Circ Res. 1998;83:366–377. | ||
Kaliora A, Dedoussis G, Schmidt H. Dietary antioxidants in preventing atherogenesis. Atherosclerosis. 2006;187:1–17. | ||
Shukla SK, Gupta S, Ojha SK, Sharma SB. Cardiovascular friendly natural products: a promising approach in the management of CVD. Nat Prod Res. 2010;24:873–898. | ||
Al-Saffar F, Ganabadi S, Fakurazi S, Yaakub H. Response of hepatic metabolizing enzymes and oxidative stress in orally administrated zerumbone against MIA-induced osteoarthritis in rats. J Animal Vet Adv.2011;10:566–573. | ||
Murakami A, Takahashi D, Koshimizu K, Ohigashi H. Synergistic suppression of superoxide and nitric oxide generation from inflammatory cells by combined food factors. Mutat Res. 2003;523:151–161. |
Supplementary materials
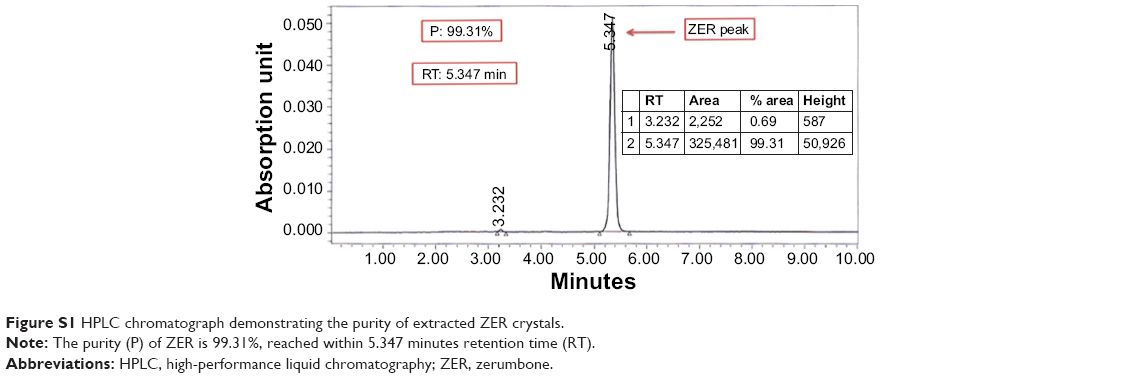 | Figure S1 HPLC chromatograph demonstrating the purity of extracted ZER crystals. |
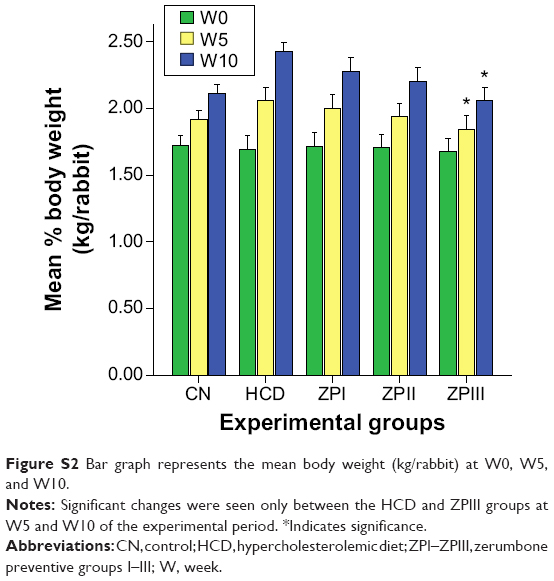 | Figure S2 Bar graph represents the mean body weight (kg/rabbit) at W0, W5, and W10. |
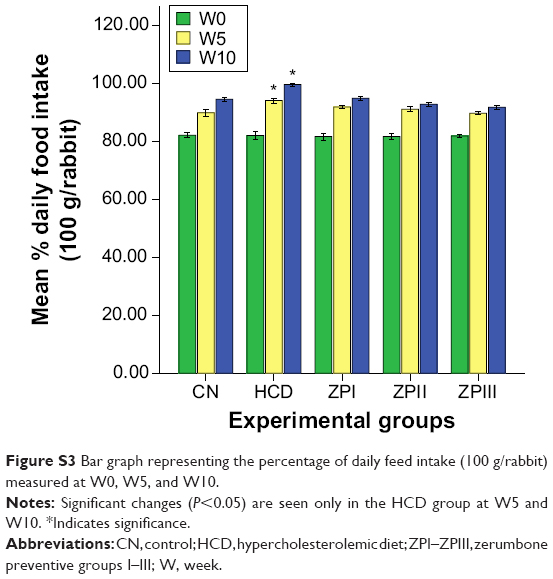 | Figure S3 Bar graph representing the percentage of daily feed intake (100 g/rabbit) measured at W0, W5, and W10. |
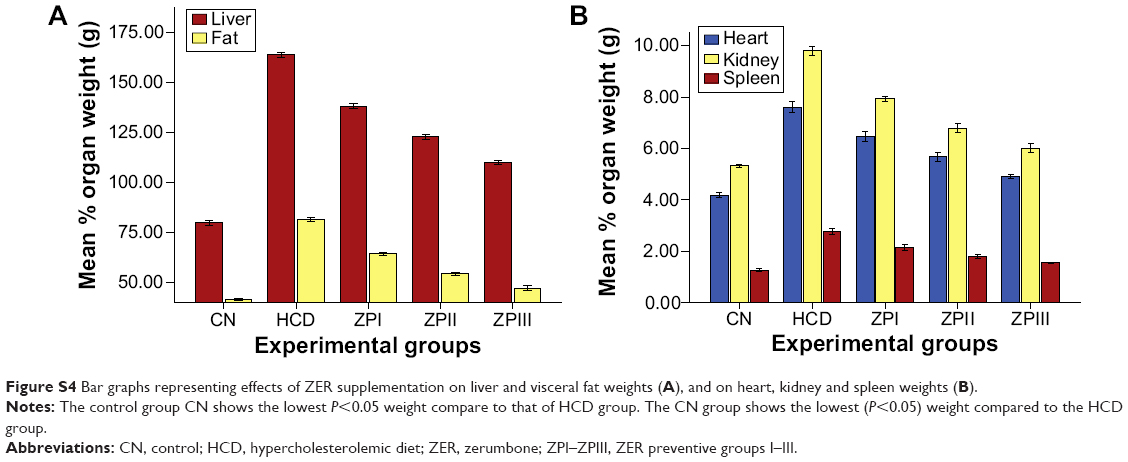 | Figure S4 Bar graphs representing effects of ZER supplementation on liver and visceral fat weights (A), and on heart, kidney and spleen weights (B). |
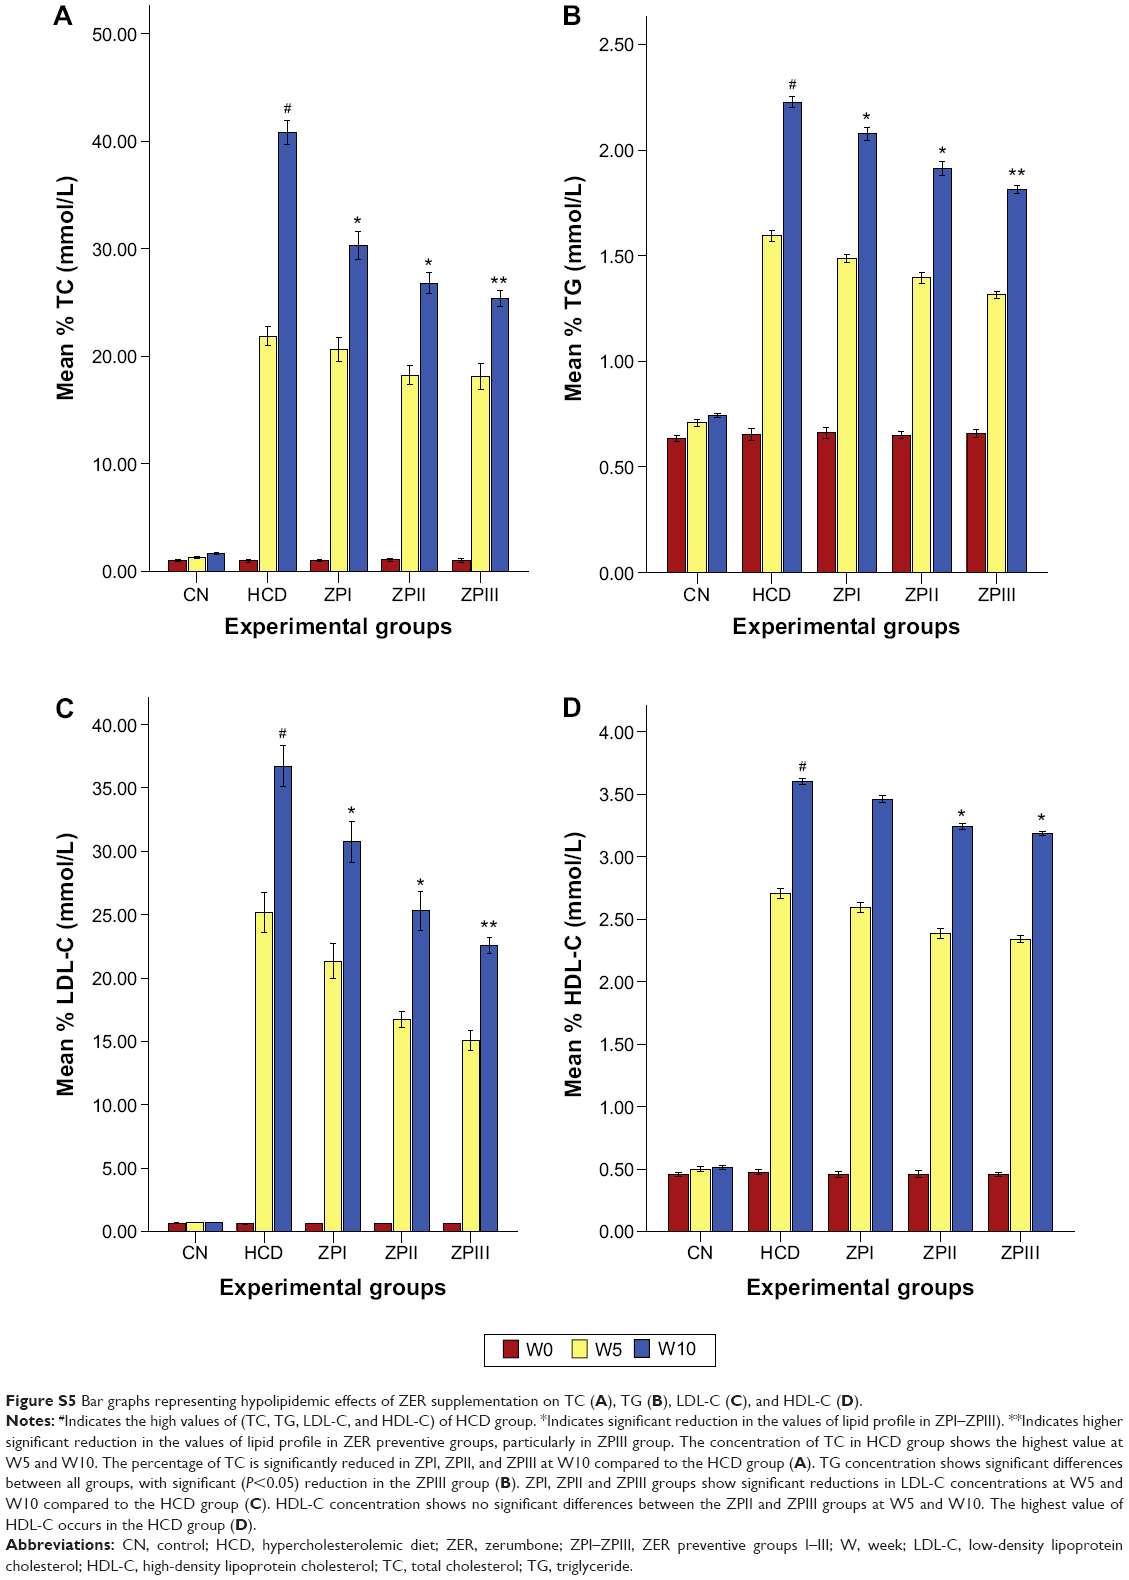 | Figure S5 Bar graphs representing hypolipidemic effects of ZER supplementation on TC (A), TG (B), LDL-C (C), and HDL-C (D). |
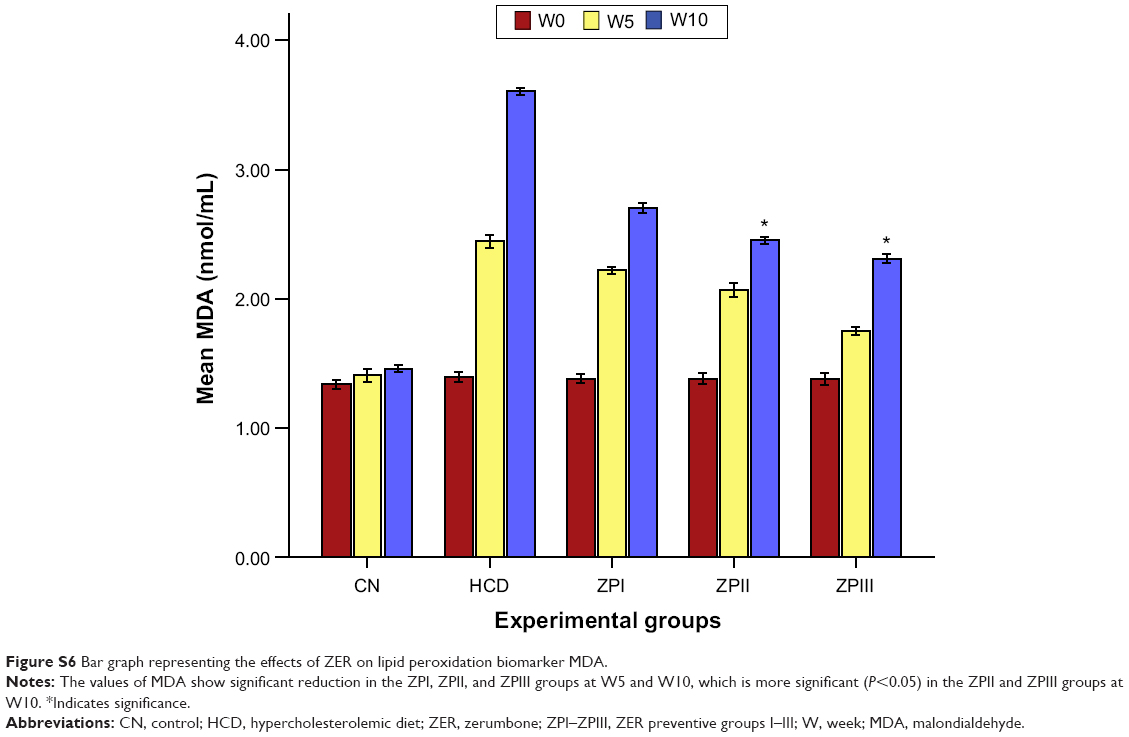 | Figure S6 Bar graph representing the effects of ZER on lipid peroxidation biomarker MDA. |
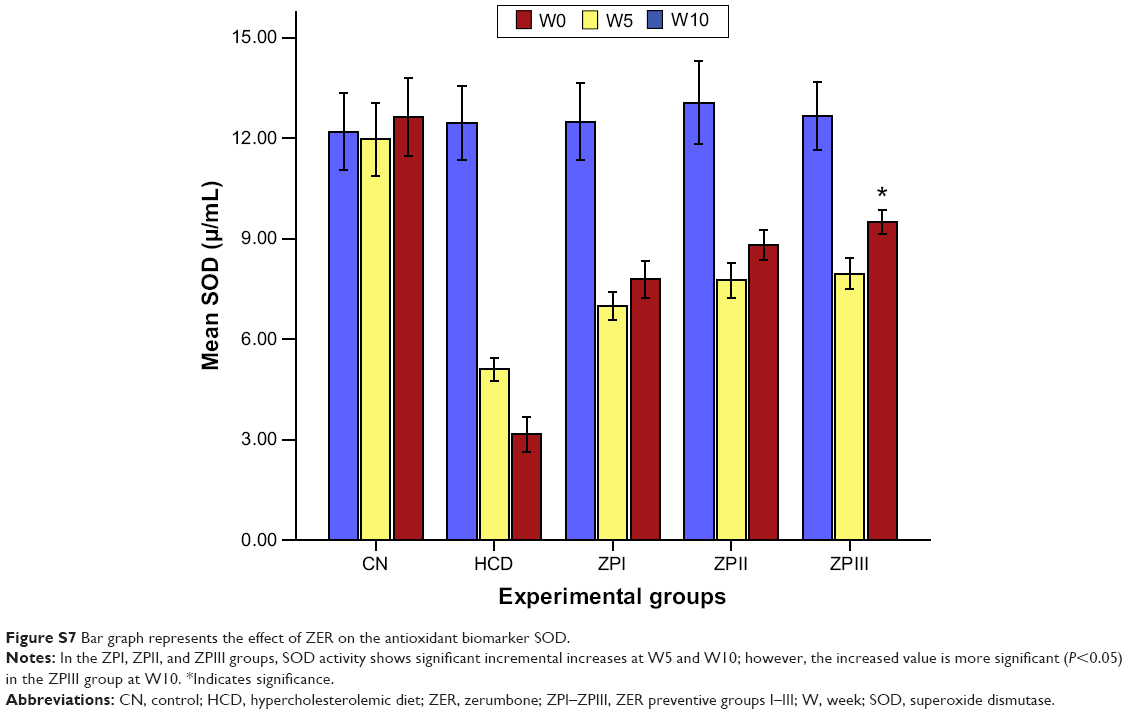 | Figure S7 Bar graph represents the effect of ZER on the antioxidant biomarker SOD. |
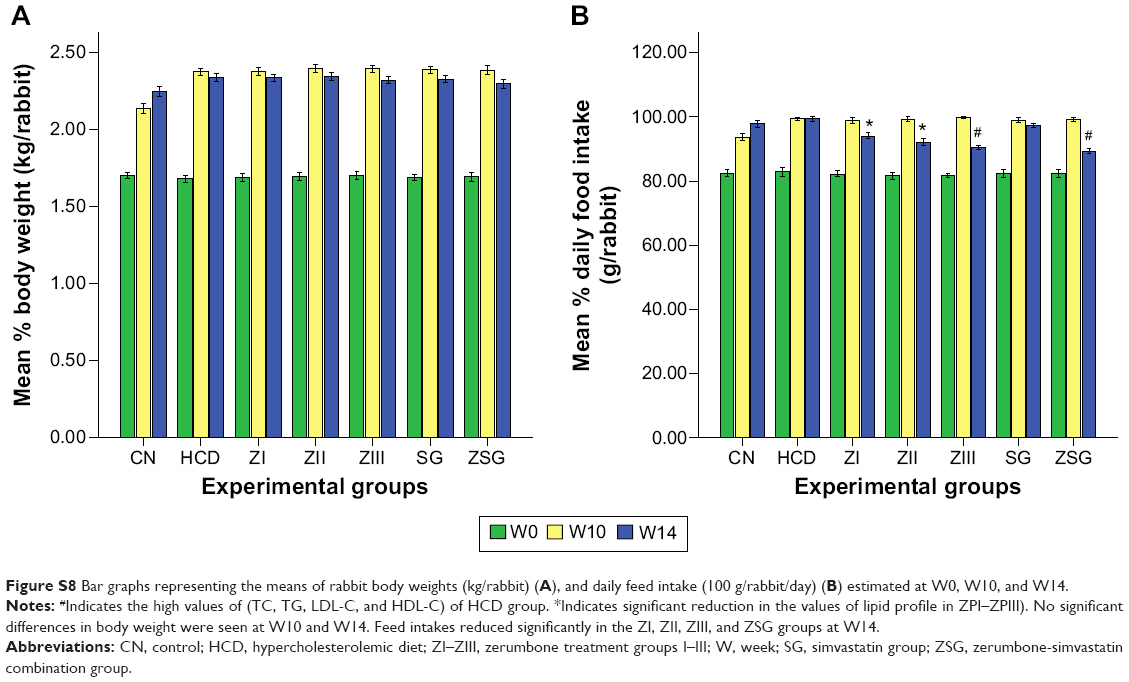 | Figure S8 Bar graphs representing the means of rabbit body weights (kg/rabbit) (A), and daily feed intake (100 g/rabbit/day) (B) estimated at W0, W10, and W14. |
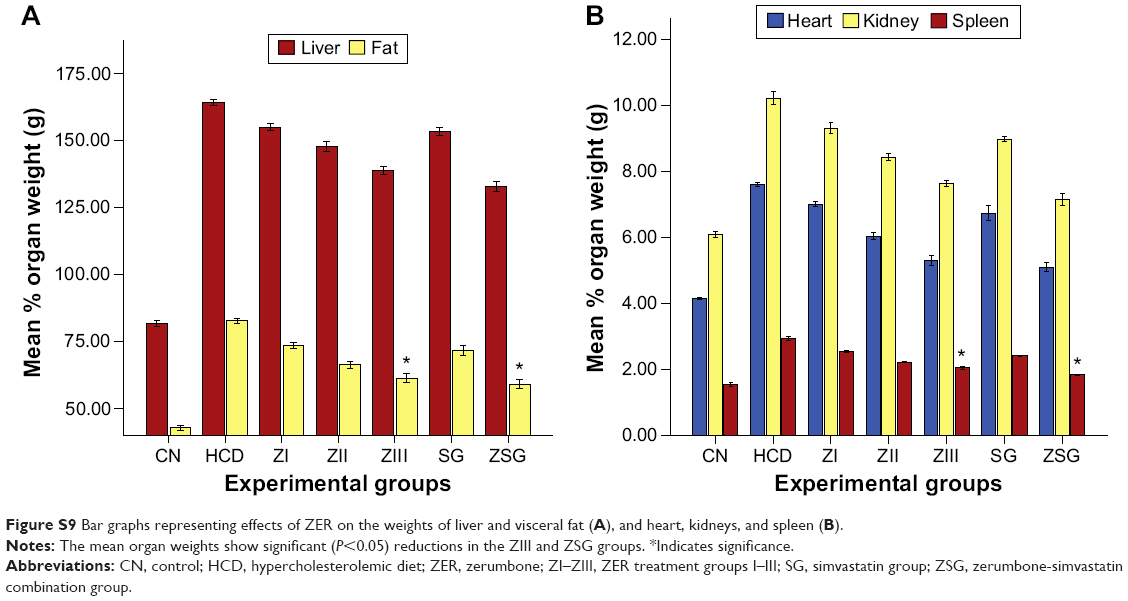 | Figure S9 Bar graphs representing effects of ZER on the weights of liver and visceral fat (A), and heart, kidneys, and spleen (B). |
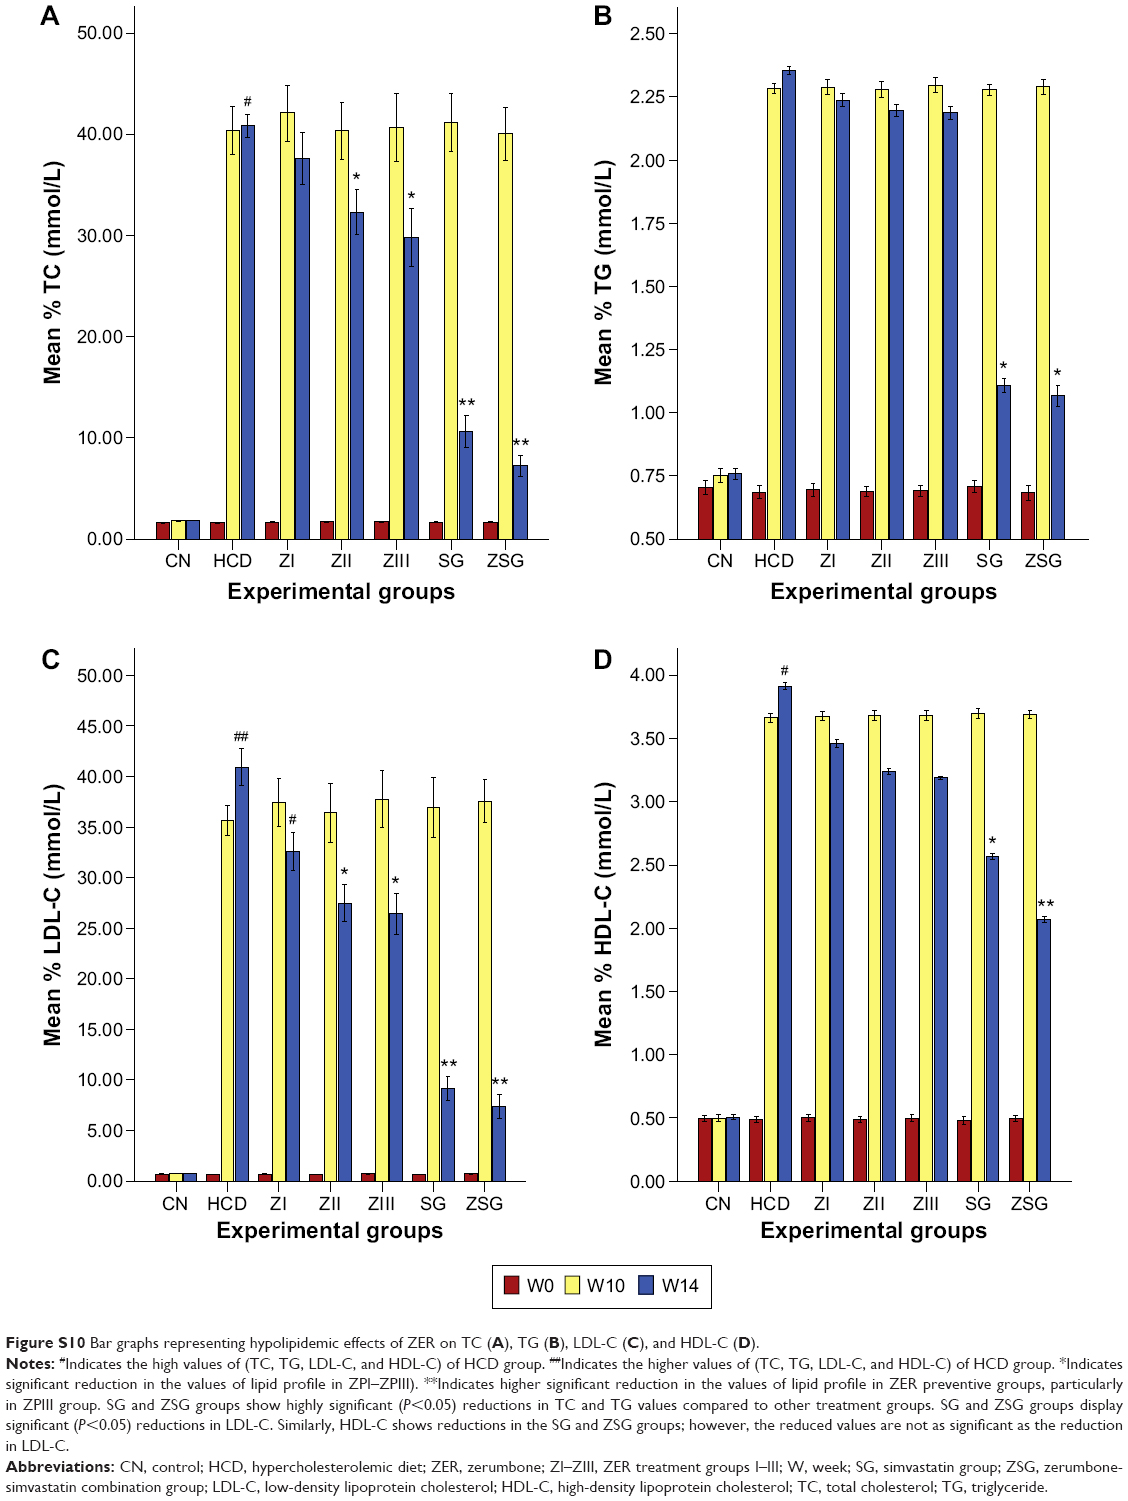 | Figure S10 Bar graphs representing hypolipidemic effects of ZER on TC (A), TG (B), LDL-C (C), and HDL-C (D). |
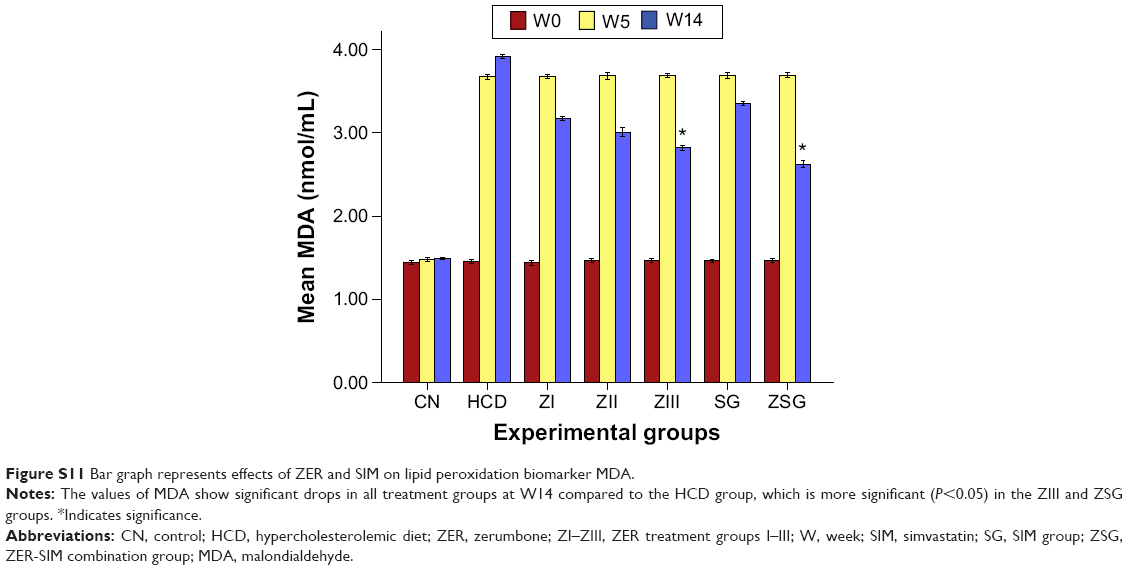 | Figure S11 Bar graph represents effects of ZER and SIM on lipid peroxidation biomarker MDA. |
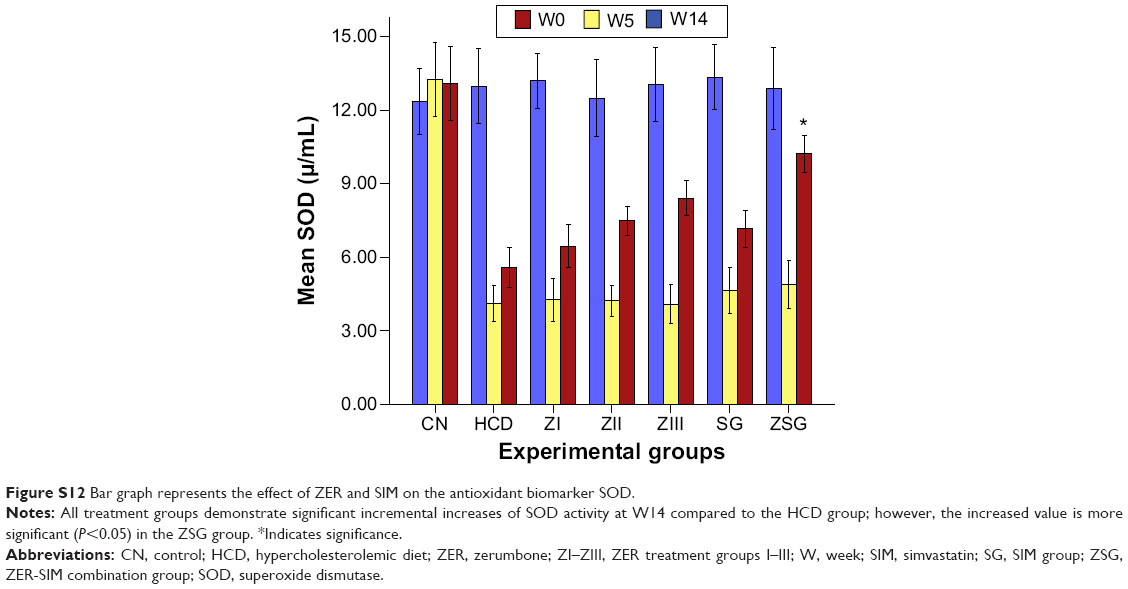 | Figure S12 Bar graph represents the effect of ZER and SIM on the antioxidant biomarker SOD. |
 © 2015 The Author(s). This work is published and licensed by Dove Medical Press Limited. The full terms of this license are available at https://www.dovepress.com/terms.php and incorporate the Creative Commons Attribution - Non Commercial (unported, v3.0) License.
By accessing the work you hereby accept the Terms. Non-commercial uses of the work are permitted without any further permission from Dove Medical Press Limited, provided the work is properly attributed. For permission for commercial use of this work, please see paragraphs 4.2 and 5 of our Terms.
© 2015 The Author(s). This work is published and licensed by Dove Medical Press Limited. The full terms of this license are available at https://www.dovepress.com/terms.php and incorporate the Creative Commons Attribution - Non Commercial (unported, v3.0) License.
By accessing the work you hereby accept the Terms. Non-commercial uses of the work are permitted without any further permission from Dove Medical Press Limited, provided the work is properly attributed. For permission for commercial use of this work, please see paragraphs 4.2 and 5 of our Terms.