")
Back to Archived Journals » Antibody Technology Journal » Volume 5
Antibody-based arrays in disease proteomics
Received 17 October 2014
Accepted for publication 30 December 2014
Published 9 February 2015 Volume 2015:5 Pages 15—25
DOI https://doi.org/10.2147/ANTI.S53335
Checked for plagiarism Yes
Review by Single anonymous peer review
Peer reviewer comments 4
Editor who approved publication: Professor Shixia Wang
Daniel Alexander Guthy,1 Hans Voshol2
1Oncology Disease Area, 2Analytical Sciences and Imaging, Novartis Institutes for BioMedical Research, Basel, Switzerland
Abstract: It is now 20 years since the term proteomics was first coined and soon thereafter began appearing in the scientific literature. In this review, we describe the opportunities and challenges in proteomics as an approach to understand disease at the molecular level. Proteome complexity is a fundamental challenge, which limits our ability to perform a comprehensive analysis of protein expression in cells or tissues. Not surprisingly, most progress has been made in homogeneous model systems, such as cell lines, using approaches that reduce the size and complexity of the proteome under investigation, eg, by affinity enrichment strategies. Targeted protein profiling methods are another approach to tackle this complexity. Here, antibody-based arrays can play an important role, because of their exquisite selectivity and sensitivity, even in complex matrices where mass spectrometry-based methods are not suitable. We conclude that in the future successful proteomics studies will combine discovery and targeted platforms, to obtain new insights as well as ensure robust validation.
Keywords: antibody-based arrays, biomarkers, mass spectrometry, disease proteomics
Introduction
It is now 20 years since the term proteomics was first coined by Mark Wilkins1 at the 1994 “From Protein Maps to Genomes” meeting in Siena, which at the time was mostly devoted to two-dimensional electrophoresis.2 As illustrated in Figure 1, it took a while before the term started appearing in the scientific literature, but once it did, there was a strong, almost exponential increase for 6 years. From 2003 onwards, the growth has started to level off, even coming to a halt in 2013. As a comparison, the number of papers citing genomics has been on a continuous climb for 27 years straight (Figure 1). One explanation for this difference is certainly that after the widespread use of “gene chips”, the advent of next generation sequencing has led to a second revolution in gene (expression) profiling. Current proteomics technologies, however, are not fundamentally different from those used 10 or 15 years ago. Obviously these publication statistics tell only part of the story, but in our opinion, for proteomics they do reflect that the field has faced some obstacles, and new approaches are needed to overcome these to increase the impact of proteomics on the understanding of disease and drug development.
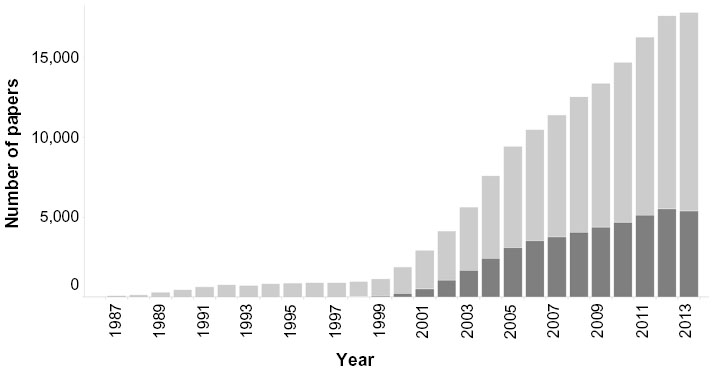 | Figure 1 Numbers of publications in PubMed using the word “proteomics” (dark bars) or “genomics” (light bars), since 1987. |
In this review, we describe the opportunities and challenges in proteomics as an approach to understanding disease at the molecular level. The focus is on why we require “open” and “closed” proteomics approaches and the important role antibody-based arrays can play in a field that is leaning so heavily on mass spectrometry (MS).
Current proteomics technologies and applications
Complexity is the fundamental challenge, which limits our ability to perform a comprehensive analysis of protein expression in cells or tissues. Complexity manifests itself at different levels in a proteomics analysis: at the proteome level, ie, the sheer number of different proteins in a cell; at the expression level, the dynamic range between the most and least abundant proteins; and at the analytical level, the diversity of physical properties a protein can have.
If proteomics is defined as the analysis of all proteins in a cell, one would be tempted to conclude that proteomics does not exist, since that goal has never been achieved and may not ever be achieved. Without belaboring the point, co-translational and post-translational modifications of the primary gene products will result in the presence of at least 100,000 protein species in a mammalian cell, representing 10,000–15,000 primary gene products. The abundance of these proteins/gene products spans beyond a million-fold dynamic range, from more than 107 copies per cell for a protein like actin, to ten or fewer copies for the least abundant proteins.3,4 In proteomics workflows, MS is the key technology for protein identification. In most cases though, for MS analysis, proteins are first digested to peptides with proteolytic enzymes such as trypsin. On the one hand, this is done because the masses of the smaller peptides can be measured with high accuracy and therefore be more readily matched to a sequence database (see Figure 2). On the other, post-translational modifications lead to heterogeneity at the protein level and hence to multiple masses for a single gene product. At the peptide level this is less of an issue, because usually there is a sufficient number of tryptic peptides with no or few modifications. A drawback of peptide-based analysis is that sample complexity increases by more than an order of magnitude, since an average protein will yield 20 or more tryptic peptides, which are typically 10–25 amino acids long.
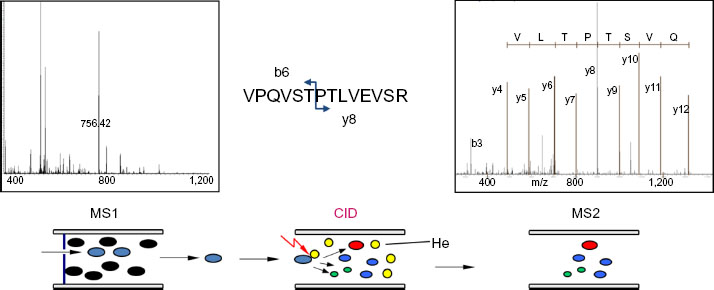 | Figure 2 Short backgrounder on protein identification by mass spectrometry. |
So, in the end, the ability of the mass spectrometer to deal with this mixture of hundreds of thousands of peptides will determine how comprehensive the analysis of the proteome in question will be. In fact, the analytical challenge is not unlike that encountered in next generation sequencing. If peptide “counting” could be done at a similar speed as is common for next generation sequencing instruments, sufficient analytical depth would be possible, even at the proteome level. In reality, mass spectrometers can currently achieve speeds of 10–20 peptides per second. Hence, 100 million “reads” would require more than 100 days of measurement time per sample. Admittedly this is a simplified comparison, but it serves to show that analytical depth remains a major challenge in proteome analysis, and is a recurring theme in this review.
MS-based proteomics: technical possibilities and challenges
The concept of using protein expression profiling to characterize biological systems predates the advent of “proteomics” by roughly 20 years. Already in 1975 several groups recognized the potential of two-dimensional electrophoresis to generate reproducible protein patterns.5–7 However, at that time, the identification of protein spots was the major obstacle to using the patterns effectively. This changed with the introduction of novel MS methods and the establishment of in-gel digestion protocols, which meant that a differentially expressed protein could be identified directly.8 Subsequently, the combination of two-dimensional gels and MS became the de facto standard in proteomics, and was applied to a wide variety of biological samples and questions, ranging from prokaryotes9 to brain tissue of psychiatric patients.10 While two-dimensional gel electrophoresis is still unsurpassed in resolving complex mixtures of proteins, peptide analysis by MS (see Figure 2) has taken its place as the core profiling approach in proteomics.11 Moreover, MS technology continues to develop at such a pace that indeed the majority of expressed human proteins can be/has been identified, not only looking across many studies,12 but even in a reasonable time frame within one experiment.11 In the latter case though, the information obtained on each protein is inherently limited, eg, it does not include important post-translational modifications.
Despite those technological developments, the complexity of the proteome has been a major hurdle for impactful protein profiling studies in the biomedical field. Unfortunately, the potentially most interesting samples, ie, patient tissues or biofluids, are also the most challenging.
Typically, a cellular protein profiling experiment requires protein amounts equivalent to at least hundreds of thousands of cells. Hence, such tissue samples will inevitably be a mixture of different cell types, thereby often diluting cell type-specific differences to below the detection level. In biofluids, the most important issue is the dynamic range between the ten most abundant proteins and the more relevant markers or mediators of disease.13 Moreover, because of the reasons described above, proteomics analyses are relatively time-consuming, making it hard to perform them at the scale required for the discovery of robust disease associations, and which has become the standard in genomics.14
Selected proteomics applications
Not surprisingly, the practical limitations discussed in the previous paragraph are reflected in the more and less successful applications of proteomics to biomedical and pharmaceutical research. In general, most progress has been made in homogeneous model systems, such as cell lines, using approaches that reduce the size and complexity of the proteome under investigation, eg, by affinity enrichment strategies. One example is chemical (or chemo-) proteomics, ie, the use of immobilized compounds as affinity tools to study drug–protein interactions, with the goal to discover novel pathway nodes or desired and undesired targets.15,16 Initially, chemical proteomics was mostly used to identify targets of compounds from phenotypic assays, in which compounds are not screened against a defined (protein) target, but using a “biological readout” like viability17 or reporter gene activation.16 Alternatively, broad spectrum binders to protein classes such as kinases or histone deacetylases can be used as a more generic compound screening tool.15,18 Recently, this approach has evolved even further, being applied to profile the expression of members of the target class, eg, active kinases in models of resistance to cancer drugs.19
Another area where proteomics has made a significant impact is the study of post-translational modifications (PTMs). PTMs such as phosphorylation, ubiquitination, acetylation, and glycosylation, just to name some of the best studied ones, are key in the regulation of protein stability, activity, and localization. Since PTMs are inherently introduced post-translationally (and sometimes co-translationally), they can only be studied at the protein level. For a comprehensive analysis, many PTMs require a specific enrichment step, mainly because they reduce the net positive charge of and thereby the MS “sensitivity” for the peptide (see Figure 2). Antibodies are available to enrich tyrosine-phosphorylated,20 ubiquitinated,21 and acetylated22 peptides, while all types of phosphopeptides can be purified by metal-affinity chromatography.23 Many motif-specific or site-specific antibodies are available for both analysis of phosphorylation and chromatin modifications. Those can be used in conjunction with MS,24 but are even more broadly applied in immunoassays like Western blotting, enzyme-linked immunosorbent assays (ELISAs), and arrays (see section on Antibody-based arrays). While there is no equivalent generic method for glycopeptides, subclasses can be enriched with lectins, and N-linked carbohydrates can be localized indirectly after enzymatic removal with PNGase F [peptide-N4-(acetyl-β-glucosaminyl)-asparagine amidase from Flavobacterium meningosepticum], which converts the asparagine on the protein that was carrying the sugar into an aspartic acid.25 Structural analysis of the protein-linked carbohydrates requires specialized MS techniques.26
A third main category of focused proteomics experiments is the analysis of protein complexes. Since most cellular proteins perform their job in close (physical) interaction with other proteins, it was hypothesized that systematic analysis of protein complexes would rapidly result in the attribution of functions to unknown proteins and the discovery of novel pathway nodes.27 There is little doubt that the analysis of immunoprecipitated proteins has become the most widely used application of proteomics technologies, culminating in high-throughput experiments and protein interaction maps with thousands of proteins,28 as well as in-depth analyses of specific protein complexes.29,30 The interpretation of such experiments, on any scale, has remained challenging because of ever-increasing MS sensitivity and the concomitant high background levels of abundant and “sticky” proteins in every experiment, aptly termed the “CRAPome”.31
As discussed under MS-based proteomics, “global” protein profiling has been significantly less successful in generating novel insights in disease biology, especially when attempting to discover correlations between protein expression and disease state in primary (human) samples.32 Nevertheless, there is a clear trend towards ever larger proteomic datasets, with a current focus on cancer in the framework of the Clinical Proteomic Tumor Analysis Consortium,33,34 to address some key shortcomings of “first-generation” clinical proteomics studies. Besides technological developments, standardization of methods across laboratories is an essential factor for such studies to be successful.35,36 Obviously, this short section only touches on some basic principles of proteomics applications, and does not do justice to the thousands of smaller and bigger success stories in proteomics over the last two decades. For more information, the reader is referred to these recent publications as a starting point.12,37–40
Targeted proteomics
So far, we have discussed proteomics methods of the so-called “open” or “discovery” type, ie, experiments that aim to map all the components of a (sub-) proteome. Early on, a complementary “targeted” approach was advocated and pioneered by the laboratory of Aebersold, in which the mass spectrometer is set to detect and quantify specific peptides.41 This type of analysis, also referred to as single reaction monitoring or multiple reaction monitoring, has been described in detail in several excellent reviews.36,42 The basic principle is that, for each protein of interest, representative and unique peptides are selected and the mass spectrometer is set up to specifically detect those “proteotypic” peptides. In a sense, these single reaction monitoring assays are the MS equivalent of an anti-peptide antibody, with the option of achieving very high specificity by detecting multiple peptides per protein. Using an intelligent experimental design, tens to hundreds of proteins can be detected and quantified in a single MS run, thereby creating the equivalent of an antibody array. Moreover, by generating proteotypic assays for every known protein, the targeted approach can be and has been extended to measure protein quantities at a proteome scale.42,43 The latest development in MS-based proteomics combines the best of discovery and targeted approaches by using so-called data-independent acquisition44 to collect a comprehensive peptide map of a sample, which then serves as a reference for further targeted experiments.45
One might think that these novel targeted MS methods provide the ultimate protein detection technology, which is universal, highly specific, and independent of cumbersome steps like antibody generation and testing. However, not even these methods are perfect. Sensitive MS detection of peptides can only be achieved if two requirements are fulfilled (see also Figure 2); the peptides in question have to be ionized and produce intense fragment peaks. Unfortunately, the best case scenario is when a pure and unmodified peptide is injected into the mass spectrometer. In real life, the presence of other peptides, which are injected simultaneously, reduces the ionization efficiency and important modifications such as phosphorylation can affect both ionization and fragmentation.46 Contrary to this, antibodies and other affinity reagents can bind to their targets efficiently in complex matrices. Below we discuss how the latest developments, with respect to availability of reagents, miniaturization, detection methods, and throughput, are transforming affinity-based protein detection into a true proteomics technology.
Antibody-based arrays
Antibodies have played an important role in targeted protein detection for many decades, from early applications in precipitation assays47,48 through milestones like the development of the ELISA49 and Western blotting techniques50 to today’s miniaturized chip-based systems where samples can be interrogated for expression of hundreds of proteins simultaneously.51 While these classical immunodetection methods still form the basis and often also the logical follow-up for array-based experiments, the key advantages of the latter are the parallel analysis of many samples and/or detection reagents, thus maximizing the information that can be gleaned from large numbers of samples which are often only available in small amounts. For the purpose of this review, we will distinguish antibody-based arrays in two main types: the forward array (also known as capture array or forward phase protein array) and the reverse array (lysate array or reverse phase protein array). One additional array type, which in a sense is also antibody-based, is the tissue microarray, a collection of tens to hundreds of tissue cores, which can be probed by immunohistochemical techniques. Typically, tissue microarrays are used in a semi-quantitative fashion, eg, to characterize expression levels in a few categories from low to high.52 A recent review of tissue microarrays and their use has been published by Remotti.53 In this review, we will not discuss in any depth “protein arrays”, large collections of more or less functional proteins, which are used for various purposes like (auto-) antibody screening, compound binding and enzyme substrate finding.47,54 The different types of arrays all share the requirement that their content, be it proteins, peptides, nucleic acids, or small molecules, has to be immobilized onto a solid support, either covalently or more commonly by non-covalent forces.55 Multiple substrates are available to accommodate different physical and chemical properties of the proteins. The choice of the right solid support depends on several factors, such as the immobilization principle (covalent binding, adsorption, affinity binding), the sample source (eg, purified versus non-purified), the complexity of the test sample, and the desired sensitivity. Choosing the proper surface chemistry is crucial to the effective usage of any type of array. The most commonly used solid supports are glass slides covered with a three-dimensional nitrocellulose coating (eg, Sartorius UniSart® 3D Nitro, Grace Bio-Labs Avid Chips), but to date a large repertoire of two-dimensional and three-dimensional solid supports with different surface chemistries is available (eg, aminosilane, polyacrylamide, and polystyrene among others). Figure 3 illustrates the two main types, ie, the forward and reverse array, that we will focus on because they are the basis for most of the work that has been done in the context of disease proteomics. In the forward phase arrays, an affinity or capture agent, such as an antibody or antigen, is immobilized onto a solid phase and finally incubated with the test samples. In recent years, as an alternative to planar microarrays, other types of carriers, such as microsphere-based, suspension-based, or bead-based microarrays have been developed (eg, Luminex xMAP®). Their main advantages are the multiplex format, the high-density arrays, and the low sample consumption. The main disadvantages are the high costs and the laborious immobilization procedure. This assay format is mainly used to detect cytokines or antibodies in serum. With their high flexibility and easy sample preparation process, these commercially available suspension arrays have replaced the ELISA in the case of multiplex immunoassays.56
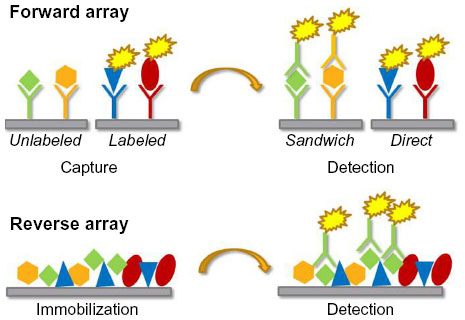 | Figure 3 Schematic representation of the two main antibody-based array types. |
In contrast to the suspension microarrays, planar or chip arrays are mainly used for studying protein expression levels and pathway signaling in complex mixtures such as tissue or cell lysates. In addition, these analytical arrays are also used for biomarker detection and to measure parameters like binding specificity and affinity.57
Reverse phase protein arrays are generated by immobilizing the samples of interest, eg, tissue lysates, samples derived from laser capture microdissection, cell lysates, protein fractions, peptides, or body fluids onto the surface of a solid support.58,59 The technology provides the opportunity to analyze phosphorylated, glycosylated, cleaved, or total cellular protein expression levels simultaneously in many samples at once. Even fixed samples, like formalin-fixed, paraffin-embedded or ethanol fixed tissues, can be applied and processed by reverse phase protein array technology. The signal detection is based on a specific antibody–epitope interaction, which limits the amount of different analytes to the availability of specific antibodies directed against the targets. These multiplexed assay formats have been successfully used for analysis of signal transduction pathways60 and prospective biomarker identification, as well as in diagnostic and/or for prognostic information in the context of clinical applications.61
Clearly, the two main array types have different, even complementary, strengths and weaknesses, and the choice between them depends on the particular application (see also Table 1). Reverse arrays have their advantages when it comes to designing smaller, flexible antibody panels with a focus on higher sample throughput, while the forward array format can accommodate medium to large optimized collections of antibodies, which allow for analysis of a fixed set of tens to hundreds of proteins in parallel. And as already mentioned, neither of these array formats is limited to the use of antibodies, but can be applied in conjunction with other affinity reagents, such as aptamers.
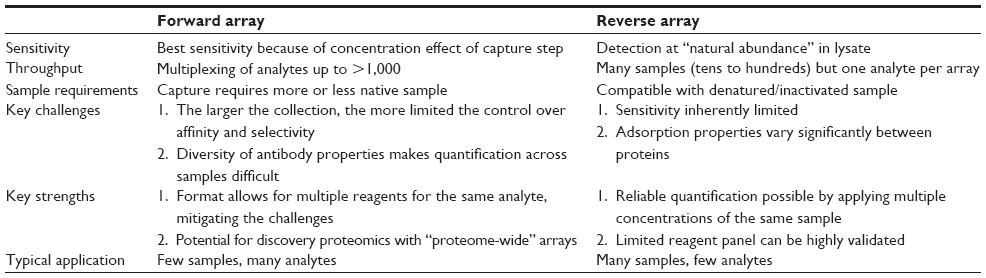 | Table 1 Properties of the main antibody-based array types |
Before discussing various aspects of antibody-based arrays, a few words on (functional) protein arrays, which are mainly used to study the biochemical properties and functions of native proteins, peptides, or domains printed on a solid support. Protein arrays have been used to study the interaction of the immobilized probes with proteins/antibodies, but also with other (bio-)molecules such as DNA, RNA, small molecules, lipids or glycans. The analytes are either immobilized on the chip surface after extensive purification using cell-based methods or by using cell-free expression systems.62 The cell-based format requires expression of the proteins of interest in host systems such as Escherichia coli or yeast, whereas cell-free expression microarrays rely on in situ protein synthesis from their corresponding DNA templates.56,63
Antibodies are the most commonly used affinity agents on arrays. One of the key factors in the usage of antibody-based arrays, or in fact all antibody-based assays, is the confirmation of specificity towards its antigen. In our experience, validation of the antibodies remains a bottleneck, especially since it is inevitable to combine pre- and post-array validation steps. These steps have two different purposes: prevalidation is done to eliminate antibodies with poor specificity, while post-validation aims to confirm that the antibody works reliably in a specific sample. The challenge is that inadequate antibodies can usually be identified rapidly, but much more time and effort have to be invested to confirm that an antibody is “good”. As an illustration, in the authors’ laboratories,64 prevalidation of antibodies for utilization on reverse arrays was done in several steps: first the antibodies were screened against a human cell lysate (eg, HeLa) using a Multiwestern blotting device, in which around 30 antibodies can be tested against a single sample. At this stage, anything showing more than the expected (usually a single) number of bands was discarded. Next, the remaining antibodies were tested against a small panel of cell lines, including one from the mouse and rat. Finally, a test was done on the arrays themselves. In our case, the majority of the inadequate antibodies failed already in the first validation step. This is probably explained by the fact that we were using basically the same lysate conditions for arrays and Westerns, resulting in good consistency between both platforms. If antibodies are to be used in a forward array format, where lysis conditions are quite different, an ELISA may be a better predictor of binding. Nevertheless, Western blotting is somewhat of a gold standard for antibody validation because it reveals what is bound and not just binding per se. Inevitably, however, the interaction of antibodies with their targets will alter under changing assay conditions, including cross-reactivity or loss of binding activity after immobilization and therefore some level of customization will always be required. Post-array validation is essential to further confirm and validate the observations, since the sample under investigation will hardly ever have been used for upfront validation. That can be done by either going back to a Western blot with the specific sample or even using immunoprecipitation and MS in cases where binding is not preserved under blotting conditions. If stringent validation criteria are used, the number of antibodies with the desired behavior will be rather small. Therefore, efficient ways of finding an existing antibody targeted against an antigen of interest are a key first step towards success, eg, using supplier information which usually includes some level of validation. A major step forward is the Human Protein Atlas, a multidisciplinary initiative set up to enable systematic exploration of the human proteome using antibody-based proteomics.65 This is accomplished by combining high-throughput generation of affinity-purified antibodies with protein profiling in a multitude of tissues and cells assembled in tissue microarrays. The database is updated annually and the current release52 contains more than 21,900 antibodies, targeting proteins from more than 16,600 human genes.
Specificity is the most important but not the only criterion for the suitability of antibodies or other affinity reagents for array-based applications. Affinity is another key factor for achieving sensitive and reproducible quantification. This factor is easier to control in the reverse format, where it is straightforward to apply the sample at multiple concentrations, and test for the linearity of the response.66 In a forward array format with hundreds or more antibodies/affinity reagents, this is much more challenging, and particular care should be taken if samples are to be compared quantitatively. In general, one can say that antibody-based arrays are a good format for screening many antibodies and/or samples, but in each case hits should be followed up with alternative methods, such as Western blotting and ELISA, to confirm that observed differences are not due to technical causes.
Some of the limitations associated with polyclonal or monoclonal antibodies can be minimized by using recombinant antibody libraries designed for microarray applications as the probe source.67,68 Large libraries of recombinant antibody-related molecules (<1010 members) provide instant access to a vast number of specific probes.69,70 In contrast to the conventional antibody production process, recombinant antibody libraries can be already designed with predefined properties for selectivity, affinity, and stability in an economically feasible manner.71
A completely different class of affinity reagents investigated in the context of microarrays is aptamers. Aptamers are short, single-stranded RNA or DNA oligonucleotides that can bind to a wide range of target molecules with high affinity and specificity.72 Recent improvements in aptamer technology have resulted in a large library of validated aptamers, which can be used to quantify more than 1,000 proteins simultaneously.73 While the in vitro selection of high-affinity aptamers appears to be more straightforward than antibodies, it has not been possible yet to generate good aptamers against small linear epitopes, such as (modified) peptides.
Detection methods
Over the last decade, the detection techniques for antibody-based arrays have been significantly improved. Along with the rapid development of this technology, the most critical parameters such as limit of detection, sensitivity, dynamic range, and the resolution have been substantially optimized. The detection technologies used for the analysis of arrays can be divided into two major classes, ie, label-based and label-free systems. To date, the majority of array applications are using the direct or indirect label-based systems, mainly due to their ease of use and the common availability of reagents and instruments. To further lower the limit of detection and to measure even low abundant proteins in complex mixtures, signal amplification systems like the rolling circle amplification, nanorolling circle amplification,74 proximity ligation assay,75 or tyramide signal amplification76 are promising tools to improve the sensitivity.
In addition to the conventional labeling methods, many novel labels, such as gold nanoparticles, Raman dye-labeled nanoparticles,77 quantum dots, or bio-barcode nanoparticles, have been developed to increase the sensitivity, reproducibility, and stability of the signal. Along with the development of novel dyes, a variety of confocal, non-confocal, or planar wave guide technology-based scanners is available for reading such arrays.78
In contrast to the label-based techniques, label-free detection methods rely on measurement of inherent properties of the molecule of interest, such as mass or dielectric property. Label-free techniques are capable of measuring biomolecular interactions and reaction kinetics in real time.79 A variety of technologies have been adapted to protein microarray detection, such as atomic force microscopy and surface plasmon resonance, among many others.
Array-based proteomics
Being a “closed” profiling tool, in other words probing only a predefined set of analytes, antibody-based arrays have inherent limitations in discovery proteomics. Therefore, MS-based methods have become the de facto standard in areas where such limitations of the analyte space are undesired, like target discovery. This is especially true at early stages of the discovery process, where samples are often derived from cellular or preclinical models, for which some of the already mentioned challenges for MS-based methods are less pronounced. Clearly, this is very different when it comes to clinical samples and/or the analysis of biofluids. Here the array-based methods can take maximal advantage of their affinity reagents, which excel under conditions and with samples where MS-based methods are not suitable or would only work with a much lower throughput and sensitivity.80 Cytokine arrays in different formats are probably the most widely applied antibody-based arrays, having already evolved into a routine tool. Cytokine analysis is a perfect application for forward arrays, targeting a fairly well-defined set of analytes in complex samples like biofluids with a focus on sensitivity. While the main applications remain in immunology research81 or in analyzing biomarkers in immune disease,82 the use of cytokine arrays is even extending into seemingly remote fields like resistance to cancer drugs, which can be driven by cytokines and their activation of growth and survival pathways.83 At the other end of the spectrum of forward arrays, one can find antibody collections covering a large variety of putative cancer biomarkers, where the selection appears to be at least partially based on the availability of antibodies.51
Reverse arrays have found their main niche in the analysis of signaling pathways. One reason for this is that both membrane-type and chip-type arrays are compatible with denaturing lysis buffers,61 which help to conserve phosphorylation states, as well as expose some of the phosphopeptide epitopes that may be less accessible in the native protein. Moreover, the reverse array format provides the flexibility to select signaling antibody panels that are adapted to the specific sample(s) or pathway(s) being studied. Reverse array-based signaling pathway analysis has gained increased attention, concomitant with the increased understanding of kinase dysregulation in disease, particularly in cancer and immunology, and the development of therapeutics to correct that. One specific drug discovery application is cellular profiling of kinase inhibitors,84 but the majority of published studies describe the profiling of patient samples for the discovery of biomarkers. An example from cancer research is patient stratification based on the actual pathway “activation state” as measured with antibodies against key signaling nodes.85,86 By correlating those signaling profiles with observations in the clinic, predictive models for treatment responses and relapses are starting to develop.87,88 Reverse arrays are also being used for the analysis of the adaptive responses generated by tumor cells to overcome growth inhibition by pathway blockers, which is already a major problem in the clinic.89,90 And of course, the approach is equally suitable for investigation of in vitro models to map out basic signaling mechanisms.66,91 Besides reverse array platforms, there are also various forward array formats with focused or broad collections of antibodies to detect protein phosphorylation.92–94 The focus on cancer in this review should not suggest that use of arrays does not extend to other fields like gastrointestinal disease95 and aging.93 For their part, aptamer-based arrays appear to be particularly suitable for the analysis of biofluids,73,96 another type of sample where classical proteomics methods are inadequate.
Coming back to the pros and cons of targeted proteomics using antibody-based arrays, one can summarize that the affinity tools are invaluable to achieve exquisite selectivity and sensitivity, but their generation and the concomitant assay development are typically cumbersome. Here, targeted MS has a clear advantage, since large numbers of assays can be set up in a limited time.42 Nevertheless, we believe that the ability to generate comprehensive protein expression and pathway profiles of patient samples is going to have a significant impact on the development of personalized therapies. Going forward, patients will no longer be classified based on macroscopic observations, but on the precise disruptions that are happening at the molecular level and consequently therapies will focus on correcting these disruptions. Moreover, only a protein/proteome level analysis can elucidate the key events that happen post-translationally. The more that is known about a certain area of biology, the easier it is to build an antibody-based array with the right, limited set of readouts. However, the application of arrays will not stop at the level of such panels. The ongoing efforts in generating large, even proteome-wide, libraries of antibodies or aptamers imply that the border between “closed” targeted analysis and “open” discovery proteomics is slowly fading and array-based global protein profiling is about to become reality.97,98
Conclusion
Coming back to one of the points raised at the beginning of this review, it can be concluded that both MS-based and array-based protein analysis are starting to approach proteome scale, as long as we define proteome scale as “at least one measurement (entity) per protein”.11 The Human Proteome Atlas project has shown that it is not just a theoretical possibility to generate an antibody for each protein, and the large-scale collections of proteotypic peptides are something like the equivalent for targeted MS. Is there a clear favorite proteome analysis approach among all the options discussed here? In our opinion, the best approach will be a hybrid for the foreseeable future. While antibodies (and other affinity reagents) have the enormous advantage that they can be used almost irrespective of sample complexity, it will not be feasible to generate specific affinity reagents for all possible forms of a protein. One solution could be to employ an affinity reagent that binds to all variants of a protein to reduce the complexity of a sample to a level where a mass spectrometer can read out all the different (modified) forms with high precision. Quite likely, this could be multiplexed to tens or hundreds of proteins using an array-type format. A slightly different form of this hybrid has already been implemented in the SISCAPA (stable isotope standards and capture by anti-peptide antibodies) technology,99 combining antibody enrichment of a proteotypic peptide from a complex sample such as serum, and MS detection in a single reaction monitoring type of experiment. And, besides utilizing different bespoke technologies, it will be equally important to combine discovery and targeted platforms, to obtain new insights and at the same time ensure the necessary throughput to validate novel targets or biomarkers in a statistically robust manner.
Disclosure
The authors report no conflicts of interest in this work.
References
Huber LA. Is proteomics heading in the wrong direction? Nat Rev Mol Cell Biol. 2003;4:74–80. | |
[No authors listed]. Proceedings of the 2nd Siena 2-D Electrophoresis Meeting. Siena, Italy, September 16–18, 1996. Electrophoresis. 1997;18:307–660. | |
Zubarev RA. The challenge of the proteome dynamic range and its implications for in-depth proteomics. Proteomics. 2013;13:723–726. | |
Naryzhny SN, Lisitsa AV, Zgoda VG, Ponomarenko EA, Archakov AI. 2DE-based approach for estimation of number of protein species in a cell. Electrophoresis. 2014;35:895–900. | |
O’Farrell PH. High resolution two-dimensional electrophoresis of proteins. J Biol Chem. 1975;250:4007–4021. | |
Scheele GA. Two-dimensional gel analysis of soluble proteins. Charaterization of guinea pig exocrine pancreatic proteins. J Biol Chem. 1975;250:5375–5385. | |
Klose J. Protein mapping by combined isoelectric focusing and electrophoresis of mouse tissues. A novel approach to testing for induced point mutations in mammals. Humangenetik. 1975;26:231–243. | |
Wilm M, Shevchenko A, Houthaeve T, et al. Femtomole sequencing of proteins from polyacrylamide gels by nano-electrospray mass spectrometry. Nature. 1996;379:466–469. | |
Otto A, Bernhardt J, Hecker M, Becher D. Global relative and absolute quantitation in microbial proteomics. Curr Opin Microbiol. 2012;15:364–372. | |
Kim SI, Voshol H, van Oostrum J, Hastings TG, Cascio M, Glucksman MJ. Neuroproteomics: expression profiling of the brain’s proteomes in health and disease. Neurochem Res. 2004;29:1317–1331. | |
Mann M, Kulak NA, Nagaraj N, Cox J. The coming age of complete, accurate, and ubiquitous proteomes. Mol Cell. 2013;49:583–590. | |
Wilhelm M, Schlegl J, Hahne H, et al. Mass-spectrometry-based draft of the human proteome. Nature. 2014;509:582–587. | |
Anderson NL. The clinical plasma proteome: a survey of clinical assays for proteins in plasma and serum. Clin Chem. 2010;56:177–185. | |
Purcell SM, Moran JL, Fromer M, et al. A polygenic burden of rare disruptive mutations in schizophrenia. Nature. 2014;506:185–190. | |
Bantscheff M. Mass spectrometry-based chemoproteomic approaches. Methods Mol Biol. 2012;803:3–13. | |
Huang SM, Mishina YM, Liu S, et al. Tankyrase inhibition stabilizes axin and antagonizes Wnt signalling. Nature. 2009;461:614–620. | |
Towbin H, Bair KW, DeCaprio JA, et al. Proteomics-based target identification: bengamides as a new class of methionine aminopeptidase inhibitors. J Biol Chem. 2003;278:52964–52971. | |
Bantscheff M, Drewes G. Chemoproteomic approaches to drug target identification and drug profiling. Bioorg Med Chem. 2012;20:1973–1978. | |
Duncan JS, Whittle MC, Nakamura K, et al. Dynamic reprogramming of the kinome in response to targeted MEK inhibition in triple-negative breast cancer. Cell. 2012;149:307–321. | |
Ren H, Tan ZP, Zhu X, et al. Identification of anaplastic lymphoma kinase as a potential therapeutic target in ovarian cancer. Cancer Res. 2012;72:3312–3323. | |
Theurillat JP, Udeshi ND, Errington WJ, et al. Prostate cancer. Ubiquitylome analysis identifies dysregulation of effector substrates in SPOP-mutant prostate cancer. Science. 2014;346:85–89. | |
Choudhary C, Weinert BT, Nishida Y, Verdin E, Mann M. The growing landscape of lysine acetylation links metabolism and cell signalling. Nat Rev Mol Cell Biol. 2014;15:536–550. | |
Yates JR III, Mohammed S, Heck AJ. Phosphoproteomics. Anal Chem. 2014;86:1313. | |
Stokes MP, Farnsworth CL, Moritz A, et al. PTMScan direct: identification and quantification of peptides from critical signaling proteins by immunoaffinity enrichment coupled with LC-MS/MS. Mol Cell Proteomics. 2012;11:187–201. | |
Zielinska DF, Gnad F, Wisniewski JR, Mann M. Precision mapping of an in vivo N-glycoproteome reveals rigid topological and sequence constraints. Cell. 2010;141:897–907. | |
Thaysen-Andersen M, Packer NH. Advances in LC-MS/MS-based glycoproteomics: getting closer to system-wide site-specific mapping of the N- and O-glycoproteome. Biochim Biophys Acta. 2014;1844:1437–1452. | |
Gavin AC, Aloy P, Grandi P, et al. Proteome survey reveals modularity of the yeast cell machinery. Nature. 2006;440:631–636. | |
Malovannaya A, Lanz RB, Jung SY, et al. Analysis of the human endogenous coregulator complexome. Cell. 2011;145:787–799. | |
Taylor MS, Lacava J, Mita P, et al. Affinity proteomics reveals human host factors implicated in discrete stages of LINE-1 retrotransposition. Cell. 2013;155:1034–1048. | |
Greber BJ, Boehringer D, Leibundgut M, et al. The complete structure of the large subunit of the mammalian mitochondrial ribosome. Nature. 2014;515:283–286. | |
Mellacheruvu D, Wright Z, Couzens AL, et al. The CRAPome: a contaminant repository for affinity purification-mass spectrometry data. Nat Methods. 2013;10:730–736. | |
Anderson NL, Ptolemy AS, Rifai N. The riddle of protein diagnostics: future bleak or bright? Clin Chem. 2013;59:194–197. | |
Ellis MJ, Gillette M, Carr SA, et al. Connecting genomic alterations to cancer biology with proteomics: the NCI Clinical Proteomic Tumor Analysis Consortium. Cancer Discov. 2013;3:1108–1112. | |
Zhang B, Wang J, Wang X, et al. Proteogenomic characterization of human colon and rectal cancer. Nature. 2014;513:382–387. | |
Addona TA, Abbatiello SE, Schilling B, et al. Multi-site assessment of the precision and reproducibility of multiple reaction monitoring-based measurements of proteins in plasma. Nat Biotechnol. 2009;27:633–641. | |
Carr SA, Abbatiello SE, Ackermann BL, et al. Targeted peptide measurements in biology and medicine: best practices for mass spectrometry-based assay development using a fit-for-purpose approach. Mol Cell Proteomics. 2014;13:907–917. | |
Cox J, Mann M. Quantitative, high-resolution proteomics for data-driven systems biology. Annu Rev Biochem. 2011;80:273–299. | |
Bensimon A, Heck AJ, Aebersold R. Mass spectrometry-based proteomics and network biology. Annu Rev Biochem. 2012;81:379–405. | |
Drabovich AP, Martinez-Morillo E, Diamandis EP. Toward an integrated pipeline for protein biomarker development. Biochim Biophys Acta. September 11, 2014. [Epub ahead of print.] | |
Kim MS, Pinto SM, Getnet D, et al. A draft map of the human proteome. Nature. 2014;509:575–581. | |
Kuster B, Schirle M, Mallick P, Aebersold R. Scoring proteomes with proteotypic peptide probes. Nat Rev Mol Cell Biol. 2005;6:577–583. | |
Picotti P, Aebersold R. Selected reaction monitoring-based proteomics: workflows, potential, pitfalls and future directions. Nat Methods. 2012;9:555–566. | |
Picotti P, Clement-Ziza M, Lam H, et al. A complete mass-spectrometric map of the yeast proteome applied to quantitative trait analysis. Nature. 2013;494:266–270. | |
Gillet LC, Navarro P, Tate S, et al. Targeted data extraction of the MS/MS spectra generated by data-independent acquisition: a new concept for consistent and accurate proteome analysis. Mol Cell Proteomics. 2012;11:O111.016717. | |
Liu Y, Huttenhain R, Collins B, Aebersold R. Mass spectrometric protein maps for biomarker discovery and clinical research. Expert Rev Mol Diagn. 2013;13:811–825. | |
Qian WJ, Jacobs JM, Liu T, Camp DG, Smith RD. Advances and challenges in liquid chromatography-mass spectrometry-based proteomics profiling for clinical applications. Mol Cell Proteomics. 2006;5:1727–1744. | |
Mattoon D, Michaud G, Merkel J, Schweitzer B. Biomarker discovery using protein microarray technology platforms: antibody-antigen complex profiling. Expert Rev Proteomics. 2005;2:879–889. | |
Hales CN, Randle PJ. Immunoassay of insulin with insulin-antibody precipitate. Biochem J. 1963;88:137–146. | |
Engvall E, Perlmann P. Enzyme-linked immunosorbent assay (ELISA). Quantitative assay of immunoglobulin G. Immunochemistry. 1971;8:871–874. | |
Towbin H, Staehelin T, Gordon J. Electrophoretic transfer of proteins from polyacrylamide gels to nitrocellulose sheets: procedure and some applications. Proc Natl Acad Sci U S A. 1979;76:4350–4354. | |
Srinivasan H, Allory Y, Sill M, et al. Prediction of recurrence of non muscle-invasive bladder cancer by means of a protein signature identified by antibody microarray analyses. Proteomics. 2014;14:1333–1342. | |
Proteome Atlas Website. The Human Proteome Atlas. Version 12-2013.12.05. Available from: http://www.proteinatlas.org. Accessed December 30, 2014. | |
Remotti H. Tissue microarrays: construction and use. Methods Mol Biol. 2013;980:13–28. | |
Levy D, Liu CL, Yang Z, et al. A proteomic approach for the identification of novel lysine methyltransferase substrates. Epigenetics Chromatin. 2011;4:19. | |
Rabe M, Verdes D, Seeger S. Understanding protein adsorption phenomena at solid surfaces. Adv Colloid Interface Sci. 2011;162:87–106. | |
Chandra H, Reddy PJ, Srivastava S. Protein microarrays and novel detection platforms. Expert Rev Proteomics. 2011;8:61–79. | |
Shafer MW, Mangold L, Partin AW, Haab BB. Antibody array profiling reveals serum TSP-1 as a marker to distinguish benign from malignant prostatic disease. Prostate. 2007;67:255–267. | |
Grote T, Siwak DR, Fritsche HA, et al. Validation of reverse phase protein array for practical screening of potential biomarkers in serum and plasma: accurate detection of CA19-9 levels in pancreatic cancer. Proteomics. 2008;8:3051–3060. | |
VanMeter AJ, Rodriguez AS, Bowman ED, et al. Laser capture microdissection and protein microarray analysis of human non-small cell lung cancer: differential epidermal growth factor receptor (EGPR) phosphorylation events associated with mutated EGFR compared with wild type. Mol Cell Proteomics. 2008;7:1902–1924. | |
Chan SM, Ermann J, Su L, Fathman CG, Utz PJ. Protein microarrays for multiplex analysis of signal transduction pathways. Nat Med. 2004;10:1390–1396. | |
Pierobon M, Belluco C, Liotta LA, Petricoin EF III. Reverse phase protein microarrays for clinical applications. Methods Mol Biol. 2011;785:3–12. | |
Hu S, Xie Z, Qian J, Blackshaw S, Zhu H. Functional protein microarray technology. Wiley Interdiscip Rev Syst Biol Med. 2011;3:255–268. | |
Nand A, Gautam A, Perez JB, Merino A, Zhu J. Emerging technology of in situ cell free expression protein microarrays. Protein Cell. 2012;3:84–88. | |
van Oostrum J, Calonder C, Rechsteiner D, et al. Tracing pathway activities with kinase inhibitors and reverse phase protein arrays. Proteomics Clin Appl. 2009;3:412–422. | |
Uhlen M, Oksvold P, Fagerberg L, et al. Towards a knowledge-based Human Protein Atlas. Nat Biotechnol. 2010;28:1248–1250. | |
Voshol H, Ehrat M, Traenkle J, Bertrand E, van Oostrum J. Antibody-based proteomics: analysis of signaling networks using reverse protein arrays. FEBS J. 2009;276:6871–6879. | |
Pavlickova P, Schneider EM, Hug H. Advances in recombinant antibody microarrays. Clin Chim Acta. 2004;343:17–35. | |
Borrebaeck CA, Wingren C. Recombinant antibodies for the generation of antibody arrays. Methods Mol Biol. 2011;785:247–262. | |
Prassler J, Thiel S, Pracht C, et al. HuCAL Platinum, a synthetic Fab library optimized for sequence diversity and superior performance in mammalian expression systems. J Mol Biol. 2011;413:261–278. | |
Dyax HomePage. Human antibody phage display. Available from: http://www.dyax.com/our-technology/phage-display-discovery-tool/antibody-phage-display.html. Accessed December 30, 2014. | |
Hoogenboom HR. Selecting and screening recombinant antibody libraries. Nat Biotechnol. 2005;23:1105–1116. | |
Walter JG, Kokpinar O, Friehs K, Stahl F, Scheper T. Systematic investigation of optimal aptamer immobilization for protein-microarray applications. Anal Chem. 2008;80:7372–7378. | |
Mehan MR, Ostroff R, Wilcox SK, et al. Highly multiplexed proteomic platform for biomarker discovery, diagnostics, and therapeutics. Adv Exp Med Biol. 2013;735:283–300. | |
Yan J, Su S, He S, et al. Nano rolling-circle amplification for enhanced SERS hot spots in protein microarray analysis. Anal Chem. 2012;84:9139–9145. | |
Nong RY, Wu D, Yan J, et al. Solid-phase proximity ligation assays for individual or parallel protein analyses with readout via real-time PCR or sequencing. Nat Protoc. 2013;8:1234–1248. | |
Perkin Elmer website. TSA (tyramide signal amplification). Available from: http://www.perkinelmer.com/Resources/TechnicalResources/ApplicationSupportKnowledgebase/TSA/tsa.xhtml. Accessed December 30, 2014. | |
Han XX, Zhao B, Ozaki Y. Surface-enhanced Raman scattering for protein detection. Anal Bioanal Chem. 2009;394:1719–1727. | |
Various manufacturers. Protein array scanner technology. Available from; http://www.bayertechnology.com/solutions/technology-development/proteomic-profiling/technology.html; http://www.innopsys.com/products-innoscan-a-mapix/innoscan-microarray-scanners; http://www.tecan.com. Accessed December 30, 2014. | |
Ray S, Mehta G, Srivastava S. Label-free detection techniques for protein microarrays: prospects, merits and challenges. Proteomics. 2010;10:731–748. | |
Solier C, Langen H. Antibody-based proteomics and biomarker research – current status and limitations. Proteomics. 2014;14:774–783. | |
Di Paolo NC, Shayakhmetov DM. The analysis of innate immune response to adenovirus using antibody arrays. Methods Mol Biol. 2014;1089:133–141. | |
Bustamante MF, Rio J, Castro Z, Sanchez A, Montalban X, Comabella M. Cellular immune responses in multiple sclerosis patients treated with interferon-beta. Clin Exp Immunol. 2013;171:243–246. | |
Britschgi A, Andraos R, Brinkhaus H, et al. JAK2/STAT5 inhibition circumvents resistance to PI3K/mTOR blockade: a rationale for cotargeting these pathways in metastatic breast cancer. Cancer Cell. 2012;22:796–811. | |
Martiny-Baron G, Haasen D, D’Dorazio D, Voshol J, Fabbro D. Characterization of kinase inhibitors using reverse phase protein arrays. Methods Mol Biol. 2011;785:79–107. | |
Cancer Genome Atlas Research Network. Comprehensive molecular characterization of gastric adenocarcinoma. Nature. 2014;513:202–209. | |
Wulfkuhle JD, Berg D, Wolff C, et al. Molecular analysis of HER2 signaling in human breast cancer by functional protein pathway activation mapping. Clin Cancer Res. 2012;18:6426–6435. | |
Cardnell RJ, Feng Y, Diao L, et al. Proteomic markers of DNA repair and PI3K pathway activation predict response to the PARP inhibitor BMN 673 in small cell lung cancer. Clin Cancer Res. 2013;19:6322–6328. | |
Yang JY, Yoshihara K, Tanaka K, et al. Predicting time to ovarian carcinoma recurrence using protein markers. J Clin Invest. 2013;123:3740–3750. | |
Mazumdar T, Byers LA, Ng PK, et al. A comprehensive evaluation of biomarkers predictive of response to PI3K inhibitors and of resistance mechanisms in head and neck squamous cell carcinoma. Mol Cancer Ther. 2014;13:2738–2750. | |
Sereni MI, Pierobon M, Angioli R, Petricoin EF III, Frederick MJ. Reverse phase protein microarrays and their utility in drug development. Methods Mol Biol. 2013;986:187–214. | |
Ummanni R, Mannsperger HA, Sonntag J, et al. Evaluation of reverse phase protein array (RPPA)-based pathway-activation profiling in 84 non-small cell lung cancer (NSCLC) cell lines as platform for cancer proteomics and biomarker discovery. Biochim Biophys Acta. 2014;1844:950–959. | |
Astanehe A, Finkbeiner MR, Krzywinski M, et al. MKNK1 is a YB-1 target gene responsible for imparting trastuzumab resistance and can be blocked by RSK inhibition. Oncogene. 2012;31:4434–4446. | |
Li L, Zhao D, Wei H, et al. REGgamma deficiency promotes premature aging via the casein kinase 1 pathway. Proc Natl Acad Sci U S A. 2013;110:11005–11010. | |
Rani S, O’Driscoll L. Analysis of changes in phosphorylation of receptor tyrosine kinases: antibody arrays. Methods Mol Biol. 2015;1233:15–23. | |
Vossenkamper A, Hundsrucker C, Page K, et al. A CD3-specific antibody reduces cytokine production and alters phosphoprotein profiles in intestinal tissues from patients with inflammatory bowel disease. Gastroenterology. 2014;147:172–183. | |
Baird GS, Nelson SK, Keeney TR, et al. Age-dependent changes in the cerebrospinal fluid proteome by slow off-rate modified aptamer array. Am J Pathol. 2012;180:446–456. | |
Brennan DJ, O’Connor DP, Rexhepaj E, Ponten F, Gallagher WM. Antibody-based proteomics: fast-tracking molecular diagnostics in oncology. Nat Rev Cancer. 2010;10:605–617. | |
Espina V, Liotta LA, Petricoin EF III. Reverse-phase protein microarrays for theranostics and patient tailored therapy. Methods Mol Biol. 2009;520:89–105. | |
Razavi M, Frick LE, LaMarr WA, et al. High-throughput SISCAPA quantitation of peptides from human plasma digests by ultrafast, liquid chromatography-free mass spectrometry. J Proteome Res. 2012;11:5642–5649. |
 © 2015 The Author(s). This work is published and licensed by Dove Medical Press Limited. The full terms of this license are available at https://www.dovepress.com/terms.php and incorporate the Creative Commons Attribution - Non Commercial (unported, v3.0) License.
By accessing the work you hereby accept the Terms. Non-commercial uses of the work are permitted without any further permission from Dove Medical Press Limited, provided the work is properly attributed. For permission for commercial use of this work, please see paragraphs 4.2 and 5 of our Terms.
© 2015 The Author(s). This work is published and licensed by Dove Medical Press Limited. The full terms of this license are available at https://www.dovepress.com/terms.php and incorporate the Creative Commons Attribution - Non Commercial (unported, v3.0) License.
By accessing the work you hereby accept the Terms. Non-commercial uses of the work are permitted without any further permission from Dove Medical Press Limited, provided the work is properly attributed. For permission for commercial use of this work, please see paragraphs 4.2 and 5 of our Terms.