")
Back to Journals » Clinical Interventions in Aging » Volume 12
Acute strength training promotes responses in whole blood circulating levels of miR-146a among older adults with type 2 diabetes mellitus
Authors Morais Junior GS, Souza VC, Machado-Silva W, Henriques AD, Melo Alves A, Barbosa Morais D, Nóbrega OT , Brito CJ, Santos Silva RJ
Received 13 May 2017
Accepted for publication 9 August 2017
Published 15 September 2017 Volume 2017:12 Pages 1443—1450
DOI https://doi.org/10.2147/CIA.S141716
Checked for plagiarism Yes
Review by Single anonymous peer review
Peer reviewer comments 3
Editor who approved publication: Dr Richard Walker
Gilberto Santos Morais Junior,1 Vinicius Carolino Souza,2 Wilcelly Machado-Silva,2 Adriane Dallanora Henriques,2 Andressa Melo Alves,1 Danilo Barbosa Morais,1 Otávio Toledo Nóbrega,2 Ciro José Brito,3 Roberto Jerônimo dos Santos Silva1
1Universidade Federal de Sergipe (UFS), São Cristóvão, Sergipe, 2Universidade de Brasília, Brasília, Distrito Federal, 3Universidade Federal de Juiz de Fora, Juiz de Fora, Minas Gerais, Brazil
Abstract: Type 2 diabetes mellitus (T2DM) consists of a set of metabolic and endocrine disorders which evolve into deficiency in insulin action and hyperglycemia. Physical exercise is considered the main intervention to prevent and control T2DM. Literature has suggested that circulating microRNAs (miRs) help to understand responses to physical activity among diabetic patients. Thus, the aim of this study was to analyze the acute effect of two interventions (strength and cardiovascular) on the total, whole blood circulating concentrations of miR-126, miR-146a and miR-155 in older adults with and without T2DM. A total of 23 male and female older adults (68.2±5.3 years) participated in the trial, 13 of whom presented with controlled T2DM and 10 were nondiabetics. They underwent both interventions separately, performed with intensity from 60% to 70% of reserve heart rate. Glucose and miRs levels were quantified and compared across groups with baseline titers as covariables. Diabetic patients showed more reduction in serum blood glucose than nondiabetics, with a great magnitude of reduction after the strength training intervention, which was paralleled by a positive change of the whole blood circulating levels of miR-146a, but not of the other miRs. Our report supports evidence that miR-146a levels in peripheral blood leukocytes are negatively associated with a state of insulin resistance, which is suggested as a novel marker to trace response to antidiabetic interventions.
Keywords: diabetes, physical exercise, microRNA, elderly, biomarker
Introduction
The aging process causes a number of morphological and physiological changes in the human body, such as reduced functional capacity of organs and tissues, loss of muscle mass, and changes in metabolic capacity.1 Because of these changes, there is an increased risk of cardiometabolic diseases (CMDs),2 with a higher level of sedentary lifestyle leading to a greater body mass and thus to a significant increase in the incidence of CMD, especially diabetes.3
Type 2 diabetes mellitus (T2DM) is a chronic metabolic disease directly related to impaired or deficient insulin action in the human body resulting directly from a state of resistance to this hormone, which leads not only to reduced glucose cellular uptake and systemic hyperglycemia but also to an overall worsened status of physical functioning.4,5 This condition is usually a direct result of a combination of genetic predisposition, physical inactivity, and poor eating habits.6,7
Currently, T2DM control is largely based on either pharmacological intervention, mainly the use of oral antidiabetic drugs to reduce glycemic levels to the physiological fasting glucose range of 70–99 mg/dL (up to 140 mg/dL if postprandial),8 or the non-pharmacological approach, which encloses changes in behavioral factors such as diet adequacy and adoption of regular exercise practices.9
There is strong evidence in the literature6,10 showing that physical activity helps in glycemic control by improving tissue sensitivity to insulin and reducing body weight. Increased blood glucose uptake by muscles may also result from enhanced action of the insulin-regulated GLUT4.
The literature shows that the two types of physical exercises (cardiorespiratory and strength) have positive effects on both prevention and control of T2DM,11 producing acute and chronic physiological effects.12 Xu et al13 suggested a new way of understanding physiological changes caused by physical activity: circulating microRNAs (c-miRs or c-miRNAs). miRs are small protein noncoding RNA molecules containing 18–23 nucleotides in their single-stranded chain,14 and they regulate gene expression at the posttranscriptional level by binding to 3′ and 5′ untranslated regions of target messenger RNAs (mRNAs). Thus, miRs may cause the inhibition of protein translation or even mRNA degradation.15,16
Because miRs are abundant in the entire cell nucleus, they circulate through blood and other body fluids in nucleated elements such as leukocytes.17 In the systemic circulation, miRs may also be found in small vesicles named exosomes and in high-density lipoprotein (HDL).18 These features make miRs resistant to endogenous RNAses and cooperate to make these molecules eligible to be studied as potential biomarkers of health and disease status.19 The complete set of intra- and extracellular miRs found in the systemic circulation is named c-miRs.
Recent studies have shown the association between miRs and several diseases, including T2DM.20,21 For example, the literature found an inversely proportional relationship between glucose levels and blood concentration of miR-126.22,23 Other studies suggest that reduced concentrations of miR-146a and miR-155 contribute to a pro-inflammatory state associated with T2DM.24–26 Thus, the three abovementioned miRs are possibly related to T2DM, which justifies a study on the association between physical activity and the concentration of these biomolecules.
Hence, the objective of the current trial was to analyze the acute effect of two types of physical intervention (cardiovascular and strength) on the total circulating concentrations of these three miRs in blood samples of older adults with and without T2DM. The understanding on how physical interventions systemically modulate the expression of potential biomarkers for T2DM may contribute to knowledge on the different strategies of the diabetic body to adapt to physical activity.
Materials and methods
A quasi-experimental study consisting of independent, parted exercise bouts was conducted with the same sample, with the experimental physical interventions being of different nature (strength and cardiovascular).
Sample
A total of 23 male and female older adults participated in the study, 13 of whom were clinically diagnosed with T2DM whereas the other 10 were nondiabetics. All subjects were regularly followed at a primary care center affiliated to the public health system of the city of Cedro de São João, Sergipe, Brazil, and were informed about the research aims by reading and signing a written consent form.
Inclusion criteria were age ≥60 years and no mobility restraints. All volunteers with uncontrolled T2DM at the initial assessment were ruled out. To assure protection for all volunteers, the trial followed recommendations of the Declaration of Helsinki. The protocol was approved by the institutional research ethics committee from the Federal University of Sergipe, Brazil.
Anthropometric characteristics
The following anthropometric measurements were obtained from the sample: body mass index (BMI) in kg/m2, waist circumference (WC) in cm, and hip circumference (HC) in cm, according to the standards recommended by the World Health Organization.27
Experimental design
The experiment lasted for 2 weeks. In the first week, heart rate was measured to estimate target heart rate zone and to familiarize participants with interventions. In the same week, after a 72-hour interval, they underwent intervention 1 (“strength training” circuit) and blood samples were collected before and after the procedure. In the second week, after a 7-day interval, intervention 2 (guided walk) was conducted, along with additional blood collections before and after the intervention (Figure 1).
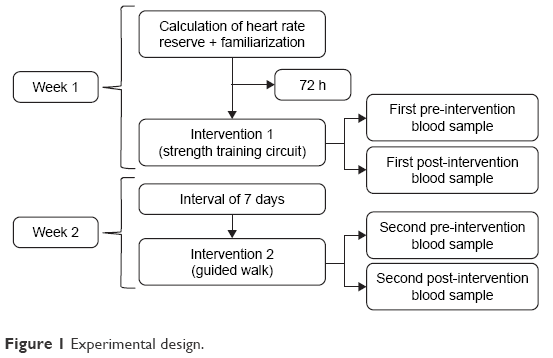 | Figure 1 Experimental design. |
Exercise intensity was controlled using the Polar Team® system, consisting of software on a specific tablet computer. Heart rate zone was established between 60% and 70% of heart rate reserve (HRR), determined by the equation, HRR = HRmax − RHR, where HRmax is the maximum heart rate, which was estimated by the Karvonen formula (HRmax = 220 age), and RHR is the resting heart rate, which was measured after a 5-min rest in the supine position in a ventilated environment at room temperature.
Warming up and cooling down
The warm-up lasted for 5 min and consisted of joint mobility exercises, encompassing the shoulder, hip, and knee joints needed to perform the interventions, with 15 repetitions per joint, whereas cooling down had the duration of 5 min and consisted of respiratory and stretching exercises.
Strength training circuit (intervention 1)
The strength training circuit comprised eight stations, where exercises were performed alternating body parts. The circuit lasted for 40 min distributed as follows: 5 min of warming up, 30 min of circuit, and 5 min of cooling down, which was immediately followed by blood collection.
The circuit had three sets, 40 s in each station, 20 s of rest between the stations, and 1 min of rest between the sets. During each rest, a hydration station was available to participants. A total of 30 min of circuit training, as advocated in the review by Romero-Arenas et al.28 Heart rate was continuously monitored during the circuit session, and a trained professional stayed near each station to ensure volunteers’ safety.
The exercises performed at each station were: standing row with extra-heavy Theraband (Carci, São Paulo, Brazil) tied to a fixed structure. “Sit and stand from chair” as adapted by Rikli and Jones.29 Bench press with Theraband (same specifications of the row station). Deadlift (exercise that predominantly works hip muscles). Biceps curl with 3 kg dumbbells (Polimet, Curitiba, Brazil) for men and 2 kg dumbbells for women.29 Squat with gym ball (Mercur, Santa Cruz do Sul, Brazil). Triceps curl with dumbbells (same specifications as the biceps curl station). Overhead stick squat (exercise that predominantly works knee extensors and flexors). The circuit was arranged following the same order described earlier, respecting the alternating schedule based on body parts, and giving priority to large muscle groups.
Cardiovascular circuit (intervention 2)
The second intervention lasted for 50 min, distributed as follows: 5 min of warming up, 40 min of guided walk with a target heart rate zone of 60%–70% of the previously calculated HRR, and 5 min of cooling down, according to recommendations of the World Health Organization for prescription of physical activity for older adults.30 Blood samples were collected immediately after cooling down activities. Volunteers’ safety and hydration procedures were the same as those adopted in intervention 1.
Blood collection procedure
Blood samples were drawn by venipuncture using vacutainer tubes containing EDTA. Approximately 5 mL of whole blood was collected and immediately distributed into smaller aliquots (1 mL), being stored at −20°C until molecular analysis. Another 5 mL was collected, left resting at room temperature and then centrifuged at 2,500 rpm for 15 min to obtain serum, a part of which being used immediately to determine glycemia and a part stored at −20°C for latter assessments of immune mediators. Venipuncture was performed by a trained nursing professional with vast experience in this procedure.
Blood glucose control
Glycemic levels were determined with spectrometry by means of an enzymatic reaction (glucose oxidase) using the 240 LabMax equipment and Labtest reagents. Before analysis, regular control procedure was carried out.
Inflammatory panel
From the serum previously stored, the inflammatory profile of the sample was determined by cytokine assessments performed by flow cytometry (FACS Verse model; BD Biosciences, San Jose, CA, USA), using the Human Th1/Th2 cytokine Kit (BD Biosciences) to yield levels of six mediators, as follows: interleukin (IL) 2, 4, 6 and 10; interferon gamma (IFNγ); and tumor necrosis factor (TNF). Measurement procedures followed protocols provided by the manufacturer.
The standard curve for each cytokine was generated using the mediator provided in the kit, and readings for each serum sample were estimated by interpolation from the corresponding standard curve. All data were analyzed using FCAP software, version 3.0 (BD Biosciences).
Total RNA extraction
Total RNA was purified using the mirVANA PARIS kit (Thermo Fisher Scientific, Waltham, MA, USA) according to a modified version of the manufacturer’s protocol, with 0.7 mL of whole blood slowly thawed in an ice bath. After extraction, quantification and sample quality analysis were conducted using a spectrophotometer (NanoDrop Lite; Thermo Fisher Scientific). Total RNA samples were stored at −20°C for later analysis.
Amplification efficiency
First, 1:10 serial dilutions with three RNA samples containing different concentrations (35.4 ng/μL, 56.6 ng/μL, and 97 ng/μL) were conducted to determine the concentration that showed better performance in the quantitative polymerase chain reaction (qPCR). These procedures revealed that the most effective concentration was 10−3, which was used for the three miRs (126, 146a, and 155).
qPCR analysis
cDNAs of the three miRs were prepared using the TaqMan microRNA Reverse Transcription (RT) kit (Thermo Fisher Scientific) according to the manufacturer’s instructions. The miRs under investigation (126, 146a and 155) were quantified by qPCR using TaqMan Universal PCR Master Mix reagent (Thermo Fisher Scientific) on the Eco™ Real-Time PCR System, version 4.0 (Illumina, San Diego, CA, USA), according to the manufacturer’s instructions, with denaturation at 50°C for 2 min and at 95°C for 10 min followed by cycling at 95°C for 15 s and at 60°C for 1 min for 45 cycles. RNU43 was used as reference (endogenous control), and relative quantification was performed by the 2−ΔCt method, as described by Zhang et al.22 All reactions were run in duplicate to determine cycle threshold mean values for each sample, with miR and endogenous amplification of each sample grouped in the same slab to avoid errors.
Statistical analysis
Statistical analysis included mean, SD, 95% CI, frequency of anthropometric measures, and analysis of sample cardiovascular risk. Shapiro–Wilk test and Levene test were used to test for normal distribution and data homogeneity, respectively.
The nonparametric Kruskal–Wallis test was used for comparisons of cytokines before and after the intervention (pre and post) for both interventions. The multivariate analysis of variance (MANOVA) was used to compare baseline values, and analysis of covariance (ANCOVA) was used to compare the magnitude of the intervention effect on blood glucose and miR levels according to patient’s disease status condition. The difference between diabetic and nondiabetic participants was analyzed comparing the data (post-intervention value minus pre-intervention value), using baseline values for each miR as a covariable. The Bonferroni procedure was used for post hoc data analyses.
All tests were performed by the IBM SPSS Statistics software, version 22 (IBM Corporation, Armonk, NY, USA), and the level of significance was set at p<0.05 for all analyses. The statistical power of the study was considered moderate (0.65) and calculated using the GPower software, version 3.1 (University of Düsseldorf, Düsseldorf, Germany).
Results
All 23 older adults previously mentioned participated in intervention 1 (strength training), whereas three participants (two with and one without T2DM) were lost in the subsequent intervention 2 (cardiovascular). Data on age and anthropometric measures of diabetic and nondiabetic subjects along with levels of blood glucose and of immune mediators are presented in Table 1 and show no difference at admission for such traits across glycemic statuses.
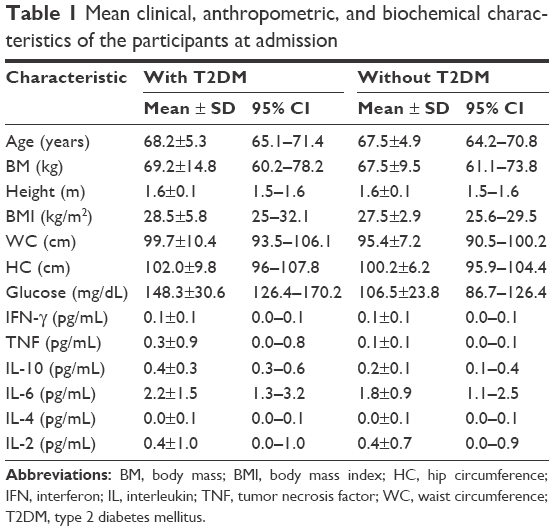 | Table 1 Mean clinical, anthropometric, and biochemical characteristics of the participants at admission |
Baseline (pre-intervention) relative quantities of the three miRs assessed were compared between groups and revealed no significant difference, regardless of health status (with or without T2DM) or training protocol (intervention 1 or 2).
The effect of each intervention on the glycemia of participants is shown in Figure 2, which demonstrates more significant reduction in absolute blood glucose levels among diabetic patients. Baseline levels were significantly related to the magnitude of reduction produced by both intervention 1 (F [1, 23] =5.87; p<0.03, r=0.48) and intervention 2 (F [1, 23] =25.63; p<0.001, r=0.79) so that all analyses were controlled for resting blood glucose measures. By doing so, a greater magnitude of serum glucose reduction could be observed among practitioners of intervention 1 (p<0.05).
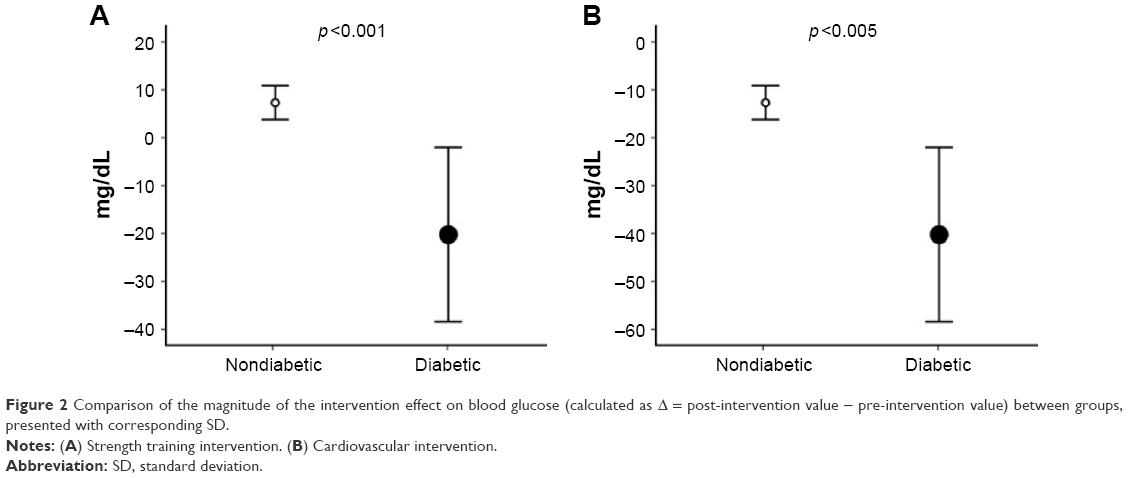 | Figure 2 Comparison of the magnitude of the intervention effect on blood glucose (calculated as Δ = post-intervention value − pre-intervention value) between groups, presented with corresponding SD. |
Figure 3 compares the relative quantities of each miR after the two interventions, according to the patient’s clinical condition. The baseline levels were once again significantly related to the magnitude of the effect of the strength training intervention on the concentration of miR-146a (F [1, 23] =166.31; p<0.001, r=0.94). Therefore, having baseline values as covariables, the subject’s disease status (with or without T2DM) showed a significant effect on the circulating levels of miR-146a, with diabetic patients exhibiting a significant increase in its level compared with nondiabetic patients, after intervention 1 (F [2, 23] =54.33; p<0.001, r=0.85). No change was observed in the circulating levels of any of the three miRs after intervention 2.
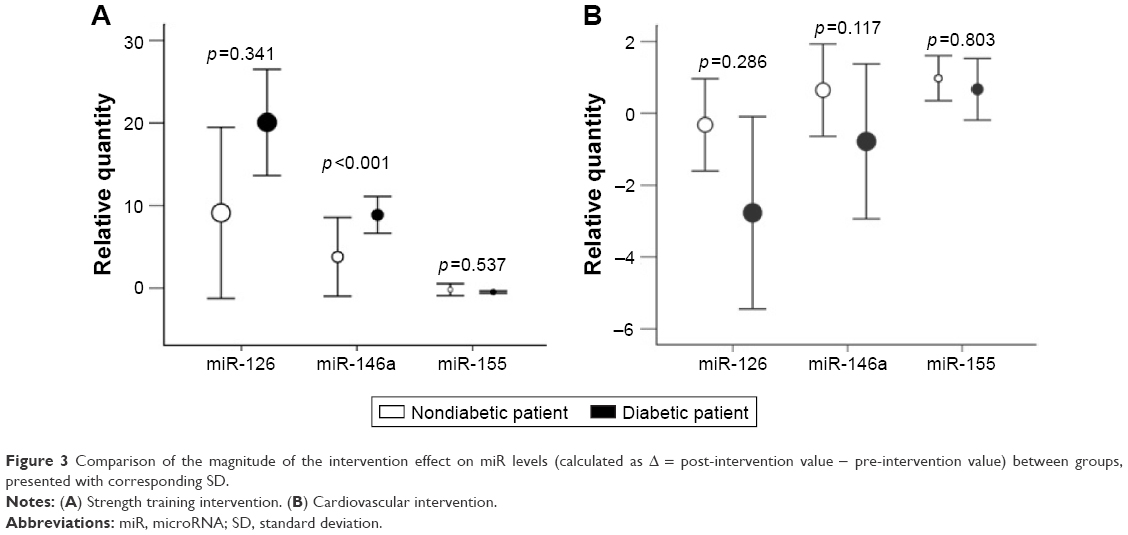 | Figure 3 Comparison of the magnitude of the intervention effect on miR levels (calculated as Δ = post-intervention value − pre-intervention value) between groups, presented with corresponding SD. |
Comparisons of cytokine levels before and after the intervention (pre- and post-intervention) revealed no significant differences with either the strength training or the cardiovascular intervention, regardless of the glycemic status (with or without T2DM) of the patients.
Discussion
The main findings obtained with the current trial consisted of greater decrease in serum blood glucose among diabetics compared with the nondiabetics after both interventions. Nonetheless, the extent of reduction was clearly greater among practitioners of intervention 1 (strength training circuit), being paralleled by a positive change in the total, whole blood circulating levels of miR-146a, which showed significantly greater changes among diabetic subjects (roughly doubling) compared to nondiabetic subjects.
Since baseline clinical parameters and miRs levels were similar between diabetic and nondiabetic patients and variations were corrected for baseline values of each miR, our results pointed to a consistent, intervention-specific phenomenon that was neither observed under cardiovascular settings nor in terms of other miRs investigated.
The mechanisms involved in miR-146a expression have not been well described in the literature so far, but studies found reduced concentrations of this miR in the circulation of diabetic subjects,25,31 showing a negative correlation with systemic glucose, insulin resistance, and inflammatory cytokines in patients with T2DM, in a pattern analogous to what is described in this study apart for a correlation with immune mediators. For example, Balasubramanyam et al31 reported that miR-146a expression in peripheral blood leukocytes is negatively associated with insulin resistance. According to them, the negative association found between miR-146a and TRAF6 mRNA levels is key to unveiling the phenomena. TRAF6 is a proinflammatory response element that acts as signal transducer in the NF-kappa B pathway, being a target of (therefore, downregulated by) miR-146a.32 In this scenario, an impaired expression of miR-146a in T2DM (by mechanisms as yet unknown) may prompt cells to become overresponsive to the proinflammatory millieu akin to chronic, age-related disorders, where cytokines are largely known to trigger or worsen an unbalanced glycemic state.33
In this respect, the significant increase in miR-146a concentrations after strength training intervention may represent a physiological aspect that may be useful to trace the functioning of glucose metabolism in the body.7,34–39 Our finding prompts for future studies seeking strategies to modulate systemic miR-146a expression as a possible mechanism to improve sensitivity to insulin, as advised elsewhere.31 Thus, the data reported in this study suggest a possible new metabolic pathway promoted by physical activity to provide benefits in the face of complications resulting from glucose intolerance.
However, it is important to note the possible limitations of the current study. First, we acknowledge that the intervention was short in duration, and the sample was limited in size as well as non-probabilistic due to exploratory nature of the study. But, assuming that both groups were nearly equal in sizes, the equation reproduced by Whitley and Ball40 was used a posteriori to calculate the power of our study. Taking into account the observed twofold change in the miR-146a levels (100%) while the overall SD of the variable reached 65% of such amplitude, the standardized difference was detected as 1/0.65=1.53. With that, the number of participants required in each group to detect such difference with 80% power and a 0.05 cutoff for statistical significance was determined as 10 individuals, which rendered our study as reasonably powered. But, investigations like this study should be reproduced with other large-sized samples as well as for longer periods to confirm the findings observed in this study as reproducible, long lasting, and physiologically relevant, in this order. It would also be advisable to continuously monitor control groups (no exercise) to observe whether these variations in the studied biomarkers result from factors unrelated to the intervention.
Moreover, we would like to emphasize the importance of using blood as the model tissue in studies involving c-miRs. Blood remains to date as the main biological material to measure biomarkers, due to easy handling and minimum discomfort for volunteers, suggesting that further research should use whole blood to quantify miRs as potential biomarkers.
Finally, it is worth noting that, to the best of our knowledge, no study so far has proposed to simultaneously analyze the acute effect of two types of interventions (cardiovascular and strength training) on the total circulating concentrations of miRs in older adults with or without T2DM.
Conclusion
The strength training intervention, when performed as a circuit, led to a significant greater increase in total circulating levels of miR-146a among diabetic patients compared with control subjects. No change was observed in the circulating levels of miR-126, miR-146a, and miR-155 after cardiovascular intervention in participants either with or without T2DM. Both interventions promoted decreases in blood glucose levels, with greater decreases among diabetic patients and among practitioners of the strength training circuit.
The results of the current study may open new perspectives for the prescription of physical activity for older adults with T2DM since strength training seems to promote more satisfactory acute outcomes that apparently relate to a detectable physiological response (miR-146a levels) which remains to be confirmed.
Acknowledgment
The research was supported with grants from the Brazilian National Council for Scientific and Technological Development (CNPq), the Brazilian Coordination for the Improvement of Higher Education (CAPES) and to the Foundation for Research and Technological Innovation of the State of Sergipe (FAPITEC).
Disclosure
The authors report no conflicts of interest in this work.
References
Chang MY, Chen HY. Body composition outcomes of a qigong intervention among community-dwelling aging adults. West J Nurs Res. 2016;38(12):1574–1594. | ||
Garg PK, Koh WJ, Delaney JA, et al. Risk factors for incident carotid artery revascularization among older adults: the cardiovascular health study. Cerebrovasc Dis Extra. 2016;6(3):129–139. | ||
Brostow DP, Hirsch AT, Pereira MA, Bliss RL, Kurzer MS. Nutritional status and body composition in patients with peripheral arterial disease: a cross-sectional examination of disease severity and quality of life. Ecol Food Nutr. 2016;55(1):87–109. | ||
Sawacha Z, Spolaor F, Guarneri G, et al. Abnormal muscle activation during gait in diabetes patients with and without neuropathy. Gait Posture. 2012;35(1):101–105. | ||
Spolaor F, Sawacha Z, Guarneri G, Del Din S, Avogaro A, Cobelli C. Altered EMG patterns in diabetic neuropathic and not neuropathic patients during step ascending and descending. J Electromyogr Kinesiol. 2016;31:32–39. | ||
Lenasi H, Klonizakis M. Assessing the evidence: exploring the effects of exercise on diabetic microcirculation. Clin Hemorheol Microcirc. 2016;64(4):663–678. | ||
Rohling M, Herder C, Stemper T, Mussig K. Influence of acute and chronic exercise on glucose uptake. J Diabetes Res. 2016;2016:2868652. | ||
American Diabetes Association. Diagnosis and classification of diabetes mellitus. Diabetes Care. 2014;37:81–90. | ||
Del Prato S, Barnett AH, Huisman H, Neubacher D, Woerle HJ, Dugi KA. Effect of linagliptin monotherapy on glycaemic control and markers of beta-cell function in patients with inadequately controlled type 2 diabetes: a randomized controlled trial. Diabetes Obes Metab. 2011;13(3):258–267. | ||
Cloostermans L, Wendel-Vos W, Doornbos G, et al. Independent and combined effects of physical activity and body mass index on the development of Type 2 Diabetes – a meta-analysis of 9 prospective cohort studies. Int J Behav Nutr Phys Act. 2015;12:147. | ||
Bassi D, Mendes RG, Arakelian VM, et al. Potential effects on cardiorespiratory and metabolic status after a concurrent strength and endurance training program in diabetes patients – a randomized controlled trial. Sports Med Open. 2016;2:31. | ||
McGarrah RW, Slentz CA, Kraus WE. The effect of vigorous- versus moderate-intensity aerobic exercise on insulin action. Curr Cardiol Rep. 2016;18(12):117. | ||
Xu T, Liu Q, Yao J, Dai Y, Wang H, Xiao J. Circulating microRNAs in response to exercise. Scand J Med Sci Sports. 2015;25(2):e149–e154. | ||
Endo K, Weng H, Naito Y, et al. Classification of various muscular tissues using miRNA profiling. Biomed Res. 2013;34(6):289–299. | ||
Koutsoulidou A, Mastroyiannopoulos NP, Furling D, Uney JB, Phylactou LA. Expression of miR-1, miR-133a, miR-133b and miR-206 increases during development of human skeletal muscle. BMC Dev Biol. 2011;11:34. | ||
Butz H, Kinga N, Racz K, Patocs A. Circulating miRNAs as biomarkers for endocrine disorders. J Endocrinol Invest. 2016;39(1):1–10. | ||
Monleau M, Bonnel S, Gostan T, Blanchard D, Courgnaud V, Lecellier CH. Comparison of different extraction techniques to profile microRNAs from human sera and peripheral blood mononuclear cells. BMC Genomics. 2014;15:395. | ||
Wardle SL, Bailey ME, Kilikevicius A, et al. Plasma microRNA levels differ between endurance and strength athletes. PLoS One. 2015;10(4):e0122107. | ||
Tiberio P, Callari M, Angeloni V, Daidone MG, Appierto V. Challenges in using circulating miRNAs as cancer biomarkers. Biomed Res Int. 2015;2015:731479. | ||
Al-Kafaji G, Al-Mahroos G, Alsayed NA, Hasan ZA, Nawaz S, Bakhiet M. Peripheral blood microRNA-15a is a potential biomarker for type 2 diabetes mellitus and pre-diabetes. Mol Med Rep. 2015;12(5):7485–7490. | ||
Yang TT, Song SJ, Xue HB, Shi DF, Liu CM, Liu H. Regulatory T cells in the pathogenesis of type 2 diabetes mellitus retinopathy by miR-155. Eur Rev Med Pharmacol Sci. 2015;19(11):2010–2015. | ||
Zhang T, Li L, Shang Q, Lv C, Wang C, Su B. Circulating miR-126 is a potential biomarker to predict the onset of type 2 diabetes mellitus in susceptible individuals. Biochem Biophys Res Commun. 2015;463(1–2):60–63. | ||
Zhang T, Lv C, Li L, et al. Plasma miR-126 is a potential biomarker for early prediction of type 2 diabetes mellitus in susceptible individuals. Biomed Res Int. 2013;2013:761617. | ||
Corral-Fernandez NE, Salgado-Bustamante M, Martinez-Leija ME, et al. Dysregulated miR-155 expression in peripheral blood mononuclear cells from patients with type 2 diabetes. Exp Clin Endocrinol Diabetes. 2013;121(6):347–353. | ||
Baldeon RL, Weigelt K, de Wit H, et al. Decreased serum level of miR-146a as sign of chronic inflammation in type 2 diabetic patients. PLoS One. 2014;9(12):e115209. | ||
Mazloom H, Alizadeh S, Pasalar P, Esfahani EN, Meshkani R. Downregulated microRNA-155 expression in peripheral blood mononuclear cells of type 2 diabetic patients is not correlated with increased inflammatory cytokine production. Cytokine. 2015;76(2):403–408. | ||
World Health Organization. Physical Status: The Use and Interpretation of Anthropometry. Geneva: World Health Organization; 1995. | ||
Romero-Arenas S, Martinez-Pascual M, Alcaraz PE. Impact of resistance circuit training on neuromuscular, cardiorespiratory and body composition adaptations in the elderly. Aging Dis. 2013;4(5):256–263. | ||
Rikli RE, Jones CJ. Development and validation of criterion-referenced clinically relevant fitness standards for maintaining physical independence in later years. Gerontologist. 2013;53(2):255–267. | ||
World Health Organization. Global Recommendations on Physical Activity for Health. Geneva: World Health Organization; 2010. | ||
Balasubramanyam M, Aravind S, Gokulakrishnan K, et al. Impaired miR-146a expression links subclinical inflammation and insulin resistance in type 2 diabetes. Mol Cell Biochem. 2011;351(1–2):197–205. | ||
Lv F, Huang Y, Lv W, et al. MicroRNA-146a ameliorates inflammation via TRAF6/NF-κB pathway in intervertebral disc cells. Med Sci Monit. 2017;23:659–664. | ||
Wang X, Bao W, Liu J, et al. Inflammatory markers and risk of type 2 diabetes: a systematic review and meta-analysis. Diabetes Care. 2013;36(1):166–175. | ||
Umpierre D, Ribeiro PA, Kramer CK, et al. Physical activity advice only or structured exercise training and association with HbA1c levels in type 2 diabetes: a systematic review and meta-analysis. JAMA. 2011;305:1790–1799. | ||
Yalamanchi SV, Stewart KJ, Ji N, et al. The relationship of fasting hyperglycemia to changes in fat and muscle mass after exercise training in type 2 diabetes. Diabetes Res Clin Pract. 2016;122:154–161. | ||
Sigal RJ, Armstrong MJ, Colby P, et al. Clinical practice guidelines: physical activity and diabetes. Can J Diabetes. 2013;37:40–44. | ||
Liubaoerjijin Y, Terada T, Fletcher K, Boule NG. Effect of aerobic exercise intensity on glycemic control in type 2 diabetes: a meta-analysis of head-to-head randomized trials. Acta Diabetol. 2016;53(5):769–781. | ||
Jakobsen I, Solomon TP, Karstoft K. The acute effects of interval-type exercise on glycemic control in type 2 diabetes subjects: importance of interval length. a controlled, counterbalanced, crossover study. PLoS One. 2016;11(10):e0163562. | ||
Park JH, Lee YE. Effects of exercise on glycemic control in type 2 diabetes mellitus in Koreans: the fifth Korea National Health and Nutrition Examination Survey (KNHANES V). J Phys Ther Sci. 2015;27(11):3559–3564. | ||
Whitley E, Ball J. Statistics review 4: sample size calculations. Crit Care. 2002;6(4):335–341. |
 © 2017 The Author(s). This work is published and licensed by Dove Medical Press Limited. The full terms of this license are available at https://www.dovepress.com/terms.php and incorporate the Creative Commons Attribution - Non Commercial (unported, v3.0) License.
By accessing the work you hereby accept the Terms. Non-commercial uses of the work are permitted without any further permission from Dove Medical Press Limited, provided the work is properly attributed. For permission for commercial use of this work, please see paragraphs 4.2 and 5 of our Terms.
© 2017 The Author(s). This work is published and licensed by Dove Medical Press Limited. The full terms of this license are available at https://www.dovepress.com/terms.php and incorporate the Creative Commons Attribution - Non Commercial (unported, v3.0) License.
By accessing the work you hereby accept the Terms. Non-commercial uses of the work are permitted without any further permission from Dove Medical Press Limited, provided the work is properly attributed. For permission for commercial use of this work, please see paragraphs 4.2 and 5 of our Terms.