")
Back to Journals » Drug Design, Development and Therapy » Volume 12
A targeted therapy for melanoma by graphene oxide composite with microRNA carrier
Authors Liu C, Xie H, Yu JG, Chen X , Tang S, Sun L, Chen X, Peng D, Zhang X, Zhou J
Received 16 December 2017
Accepted for publication 24 June 2018
Published 21 September 2018 Volume 2018:12 Pages 3095—3106
DOI https://doi.org/10.2147/DDDT.S160088
Checked for plagiarism Yes
Review by Single anonymous peer review
Peer reviewer comments 2
Editor who approved publication: Dr Jianbo Sun
Can Liu,1 Huiqing Xie,2 Jingang Yu,3 Xiaoqing Chen,3 Shijie Tang,4 Lichun Sun,5 Xiang Chen,6 Defei Peng,7,* Xiangyan Zhang,8,* Jianda Zhou1,*
1Department of Plastic Surgery, The Third Xiangya Hospital, Central South University, Changsha, Hunan, 410013, China; 2Department of Rehabilitation, The Third Xiangya Hospital, Central South University, Changsha, Hunan, 410013, China; 3School of Chemistry and Chemical Engineering, Central South University, Changsha, Hunan, 410013, China; 4Cleft Lip and Palate Treatment Center, The Second Affliated Hospital, Shantou University Medical College, Shantou, Guangdong, 515041,China; 5Department of Medicine, School of Medicine, Tulane Health Sciences Center, New Orleans, LA, USA; 6Department of Dermatology, The Xiangya Hospital, Central South University, Changsha, Hunan, 410008, China; 7Department of Burns and Plastic Surgery, Guizhou Provincial People’s Hospital, Guiyang, Guizhou, 550002, China; 8Department of Nursing, The Second Xiangya Hospital, Central South University, Changsha, Hunan, 410011, China
*These authors contributed equally to this work
Background: Nowadays, the combination of microRNA (miR) is attracting increased attention in clinical cancer trials. However, the clinical use of miR is highly limited because of certain properties such as instability, low-specificity distribution, and metabolic toxicity.
Methods: In order to improve the anti-tumor efficacy and reduce the side effects of miR in treating melanoma, a combination of graphene oxide (GO), chitosan (CS), and a cellular penetrating peptide, MPG, was prepared with solid dispersion method in this research. The research has analyzed the specific components of nano drug-loading complexes GO-CS and GO-CS-MPG through characterization research and confirmed the bio-safety of the carrier material GO-CS-MPG.
Results: The GO-CS-MPG-miR33a/miR199a nano drug-loading complex was successfully constructed and its medical effectiveness was verified. Through the subcutaneous tumor implantation experiment, an evident effect of the drug-loading complex in inhibiting melanoma cells was proven.
Conclusion: Results suggest that GO-CS-MPG may have potential applications in melanoma therapy.
Keywords: melanoma, graphene oxide, chitosan, cellular penetrating peptide, microRNA
Introduction
Among all the body surface tumors, melanoma is the most malignant. Due to environmental pollution, especially the increasing exposure of ultraviolet radiation, morbidity of melanoma rises year by year. There have been 200,000 newly found melanoma cases every year all over the world.1,2 For early-phase or local melanoma, exairesis in clinic can achieve satisfactory results. For intermediate or terminal melanoma in which cancer cells have widely invaded patients’ local tissue or metastasis, various comprehensive treatments including exairesis, radiotherapy, chemotherapy, and immunotherapy have been employed and prognosis has been poor with only 15% of patients surviving for 5 years.3 Therefore, it is urgent for a new drug to be created to inhibit malignant melanoma.
In a previous study, the research group has verified that microRNA (miR)-33a can regulate the glycolysis level of melanoma cells and influence their proliferation and apoptosis, metastasis as well as the sensitivity of radiotherapy.25 Hence, miR33a can be a novel drug for melanoma treatment. The research team has also explored whether miR199a can inhibit melanoma and as a result, has found that miR199a can regulate MET protein and that its overexpression can inhibit the invasive growth of melanoma.4 miR199a can also impact the metastasis of melanoma cells. But the clinical use of miR is significantly limited because of its specific properties such as instability, low-specificity distribution, and metabolic toxicity.5 It has great clinical significance and limitless application prospects to seek an efficient path for miR to be conveyed into melanoma tissue stably, targeted precisely, safely, and efficiently, and to eventually play an antineoplastic role.
Graphene oxide (GO) is a novel nano medicine carrier. Acting as nanocarrier of antineoplastics, GO has the following advantages: 1) a large surface area comprising different kinds of functional groups. Through chemical modification, its properties can be changed and it can be bonded with targeted molecules or drug molecules; 2) large drug-loading capacity and good stability: it can load a large amount of antineoplastics and has a high histocompatibility as well as long period of blood circulation if chemically modified; 3) less side effects: drugs are distributed less in normal tissues because of its high targeting ability, which reduces side effects. Since GO is insoluble in water and organic solvents, solving its distribution/solution problems is the precondition to apply in clinic.6–11 In recent years, the team has been studying the structure modification and drug-loading capacity of GO. By using polar molecules or bioactive molecules such as β-cyclodextrin and its derivatives, polycarbonate and chitosan (CS), and so on to modify GO, many of its properties, not merely distribution but also biocompatibility, have been improved. The composite that was obtained can control drug release and elevate the drug targeting capacity, which has made a significant reference for the study of tumor-targeted drug-loading system.
Cellular membrane is a natural defensive cover for human bodies. It is also a barrier against drug molecules, polypeptides, and nucleic acids to enter into cells. Cellular penetrating peptide is an effective transmembrane drug carrier. Research studies show that it can transport drug molecules through the cellular membrane, which means drugs can overcome the cellular membrane barrier under its help.27 MPG is one of the most efficient cellular penetrating peptides.12 Research studies also demonstrate that MPG can not only transport oligonucleotides or miR into cells but also improve their transmembrane efficiency.13,14
Based on previous research studies and correlative references, the study was planned to adopt the proven technology of nanomaterial assembly to construct a multiple targeted and efficient nano drug-loading complex, GO-CS-MPG-miR33a/miR199a. Accordingly, a research to study the characterization of the nano drug loader and its cellular toxicity and safety will be conducted. Research on proliferation of transfer as well as correlative animal experiments will also be made after transfecting the drug loader into melanoma A375 cells. If this project succeeds, a new form of anti-melanoma drug with intellectual property right is likely to be obtained and the risk of recurrence in malignant melanoma patients is likely to be reduced.
Materials and procedures
Experimental materials, cell lines, and animals
All the materials in this study were analytic reagent grade and used as received, including graphene from Nantong Ji Haitan Pharmaceutical Company Limited (Jiangsu, China); 1-(3,2-dimethylamino)-3-methyl-2-imine hydrochloride and dimethyl sulfoxide from Sinopharm Group Chengdu Chemical Reagent Company Limited (Sichuan, China); dimethyl sulfoxide from Sigma Aldrich Co. (St Louis, MO, USA); CS from Zhengzhou Transcendency Chemical Industry Company Limited (Henan, China); cellular penetrating peptides (MPG, GALFLGFLGAAGSTMGAWSQPKSKRKV) from Beijing SBS Genetech Company Limited (Beijing, China); fluorescein isothiocyanate (FITC) fluorescent dye from LiTTLE-PA Sciences Company Limited (Hubei, China); Glucose Test Kit and Lactic Acid Test Kit from Amyjet Scientific Company Limited (Hubei, China); mouse anti-Met antibody, mouse anti-β-tubulin antibody, and anti-mouse secondary antibody from KPL Company (Gaithersburg, MD, USA); miR199a plasmid and miR33a plasmid from Shanghai GenePharma Biology Company Limited (Shanghai, China); and Cell Counting Kit-8 (CCK8) from Biosharp Company (Anhui, China).
Human melanoma A375 and L929 cells were purchased from cell bank of Xiangya (refer to our previous publication).15 The cells were grown in Roswell Park Memorial Institute-1640 (Thermo Fisher Scientific, Waltham, MA, USA), containing 10% heat-inactivated fetal bovine serum from Sijiqing Bioengineering Materials Co., Ltd (Hangzhou, China) and 100 U/mL penicillin and streptomycin.
Male mice without thymus were purchased from Hunan SJA Laboratory Animal Company Limited (Hunan, China) and were housed at a controlled temperature of 20°C–22°C and a relative humidity of 50%–60% with 12 hours of light–dark cycles. All animals were in quarantine for a week before treatment, procedures related to them were performed in conformity to the Animal Welfare Act, and experiments with them were approved by the Institutional Animal Care and Treatment Committee of Central South University.
Preparation of GO
Weigh out 0.3 g of crystalline flake graphite and 1.5 g of KMnO4, mix them and transfer the mixture to a 100-mL round-bottom flask. Then measure 36 mL of concentrated H2SO4 and 4 mL of H3PO4 and mix them uniformly. Add the mixed liquid drop by drop into the flask in an ice bath and treat with an ultrasonic wave. Then the color of the liquid turns to blackish green. Transfer the flask to a 50°C water bath and keep it warm for 12 h. Add H2O2, and the color of the liquid would turn into luminous yellow. When no bubbles are produced in the flask, the liquid should be centrifuged. Wash with 0.1M HCl for three times and with distilled water until pH =7 was obtained. Then lyophilize the liquid. In the end GO powder can be produced.
Grafting of CS onto GO
Add 0.20 g of GO, 0.10 g of 4-dimethylaminopyridine, 0.75 g of CS, and 80 mL of dimethyl sulfoxide into a 50 mL round-bottom flask and mix them homogeneously, then add 0.5 g of 1-[3-(dimethylamino)propyl]–3-ethylcarbodiimide hydrochloride. Keep the flask in an oil bath at 60°C for 3 h. Wash the mixed liquid with water for three times, with 0.5M HCl for three times, and then with water again until the solution becomes neutral. Lyophilize the liquid. In the end, a GO-CS composite will be produced.
Grafting of MPG polypeptide onto GO-CS
Weigh out 200 mg of GO-CS and sterilize it under high temperature and high pressure. Wash with distilled water for three times and then purify and lyophilize. Under the condition of strict sterile operation, take 100 mg of the lyophilized composite, and dissolve it in 500 mL of water without RNase and oscillate the solution in an ultrasonic oscillator for 4–6 h. The carboxyl group on the MPG polypeptide is first activated with dicyclohexylcarbodiimide, and then add an excessive amount of MPG polypeptide and emulsify under the temperature of 37°C and ultrasonic wave, then keep it standing for 24–48 h. Purify the mixture by dialysis and wash with water without RNase for three times, then make it lyophilized. Eventually a GO-CS-MPG carrier will be produced.
Preparation of GO-CS-MPG-miR
The miR sample was centrifuged at full speed for 30 s to allow it to sink to the bottom of the tube. One hundred and fifty microliters of diethyl pyrocarbonate (DEPC)-treated water was added per absorbance, mixed, and made into a concentration of 20 μmol/L of a bulk solution, which was packed into 15 μL/tube and stored at −20°C. The polypeptide GO-CS-MPG 0.4 mg was weighed into an eppendorf tube, dissolved in 10 mL of DEPC-treated water, and stored at −20°C. Remove the RNase EP tube, and add the miR solution and GO-CS-MPG solution in proportion. Incubate at 37°C for 10 min. Mix the miR solution and the GO-CS-MPG solution quickly. Swirl vibration for 50 s and set aside.
Characterization research on nano drug carrier
Analyze the prepared GO-CS and GO-CS-MPG with infrared (IR) spectroscopy, Raman spectroscopy, thermogravimetric analysis (TGA), scanning electron microscope (SEM), and other characterization methods.
Cultivation of cells
Nutrient solution for melanoma A375 cell line was highly sugary DMEM containing 10% FBS. The cell lines were cultivated in an incubator at 37°C and 5% CO2.
Cytotoxicity experiment
- Adjust the cell density to 5×10⁴/mL and inoculate the cells into a 96-well plate. Add 100 μL of cell suspension into each well and make sure the number of L929 cells is ~5×10³ in each well.
- Add GO-CS-MPG of different concentration (0–160 mg/mL) into the L929 cell solution and set five duplicate wells for each group. Place the 96-well plate into an incubator at 37°C and 2% CO2 and keep cultivating for 24, 48, and 72 h.
- When cultivation for 24, 48, and 72 h is completed, add 10 μL of CCK8 solution into each well, continuously place the 96-well plate into the incubator at 37°C and 2% CO2, and keep cultivating for 2 h.
- Choose the 450 nm optical filter and determine the absorbance value of the solution in each well with a microplate reader so as to finally determine the L929 cell toxicity.
Cell transfection experiment
- Take 10 mg of GO-CS-MPG dissolved in 5 mL of dimethyl sulfoxide and stir for 30 min by the electromagnetic agitator, and then add FITC (GO-CS-MPG:FITC =1:8 mol). Light should be avoided thought out the process.
- Add 5 mL of deionized water, continue stirring for 24 h, and place it in a dialysis bag (MWCO =1 kDa) to remove the organic solvent and excess dye for 48 h.
- Pour it into a 0.22 μm filter after dialysis and store it at 4°C in a refrigerator after the preparation of the freeze-drying material is completed.
- The A375 cells were planted in an eight-well culture slides with a density of 4×10³ (cells/well), and the cells were cultured for 24 h.
- Culture solution that contains the FITC-GO-CS-MPG microspheres (0.08 mg/mL) must be changed after 24 h and should be cultured for 24 and 48 h.
- The culture medium should be removed and washed three times with PBS solution, and the FITC-GO-CS-MPG microspheres were washed in the medium.
- The fluorescence expression was observed with 3.7% formaldehyde-fixed cells for 30 min, the formaldehyde was removed, and 100 μL of fresh PBS solution was then added.
Cell proliferation experiment
- Grouping: a blank control group, a GO-CS-MPG group, a miR199a group, a miR33a group, a GO-CS-MPG-miR199a group, a GO-CS-MPG-miR33a group, and a GO-CS-MPG-miR33a/miR199a group.
- Other specific test methods are provided in the “Cytotoxicity experiments” section.
Western blot verification of Met expression
Cells were harvested 72 h after transfection and then lysed with sodium dodecyl sulfate loading buffer solution. The protein concentration of each sample was determined using the Bradford method. About 30 μg of protein supernatant was subjected to sodium dodecyl sulfate-polyacrylamide gel electrophoresis and transferred into nitrocellulose membranes. Membranes were blocked for 1.5 h and incubated with mouse anti-Met antibody (1:1,000) or mouse anti-β-tubulin antibody (1:10,000). All membranes were incubated at 4°C overnight. Membranes were washed three times with PBST and then incubated for 1 h at room temperature in anti-mouse secondary antibody (1:10,000). Electrochemiluminescence chemiluminescence was used to reveal proteins, and Bandscan software (Glyko, Novato, CA, USA) was used to scan the gray value of Western blot bands to calculate the relative content of protein.
Detection of glycolysis level
After cell culture, transfection was performed, and 8 replicate wells were set in each group. 20 μL of cell culture medium samples were taken 24 h and 48 h after transfection. The concentration of lactic acid and glucose in each sample was determined according to the glucose test kit and the lactic acid test kit. The lactic acid concentration is the lactic acid yield, expressed in L. The glucose concentration in the original medium was 11.11 mmol/L, and the difference in glucose concentration in the sample was considered glucose consumption, which was expressed as G. The relationship between L/G reaction lactic acid production and glucose consumption and the efficiency of aerobic glycolysis was observed in each group.
Subcutaneous tumor implantation for nude mice
Choose male mice without thymus grown for 6 weeks and weighing 18–24 g for the in vivo proliferation experiment. Adjust the cell density to 5×10⁶/mL and inoculate the cells into the subcutaneous tissue of the back of nude mice. On the ninth day after inoculation, randomly divide the mice into seven groups with three mice in each: a blank control group, a GO-CS-MPG group, a miR199a group, a miR33a group, a GO-CS-MPG-miR199a group, a GO-CS-MPG-miR33a group, and a GO-CS-MPG-miR33a/miR199a group. Inject the corresponding therapeutic solution into the tumor tissue, and the surrounding tissue of each tumor should be injected with 50 μL at three different spots. Administer once again on the 20th day after tumor bearing. Observe the mice’s eating state, mental state, the variation of weight, and the variation of tumor volume (= length × width2 × 0.5). On the 35th day after inoculation, kill the mice, extract the implanted tumors, and take photos to record the volume of each tumor.
Statistical analysis
All experiments should be repeated at least three times and the experimental data should be expressed as mean ± SD. SPSS 22.0 was used to analyze the data. A method of single-factor variance analysis or single population t-test was adopted to contrast the mean values of the two samples, and P<0.05 indicates the difference is statistically significant.
Results
IR results of the nano drug carrier
The results of IR spectroscopy are shown in Figure 1, which shows that when the wavenumber is about 3,300 cm−1, a remarkable stretching vibration peak emerges and the light transmittance of GO-CS-MPG is apparently lower than that of GO-CS. When the wavenumber is nearly 2,900 cm−1, a stretching vibration peak also appears and the light transmittance of GO-CS-MPG is slightly lower than that of GO-CS. When the number is about 1,636 cm−1, prominent stretching vibration occurs and when the value is around 1,081 cm−1, the stretching vibration becomes trivial. Hence, it can be concluded that the two kinds of drug carrier materials both containing the group −C−O−C and ester groups were produced when CS was grafted onto GO. A conclusion can thus be drawn that the CS was successfully grafted onto the GO.
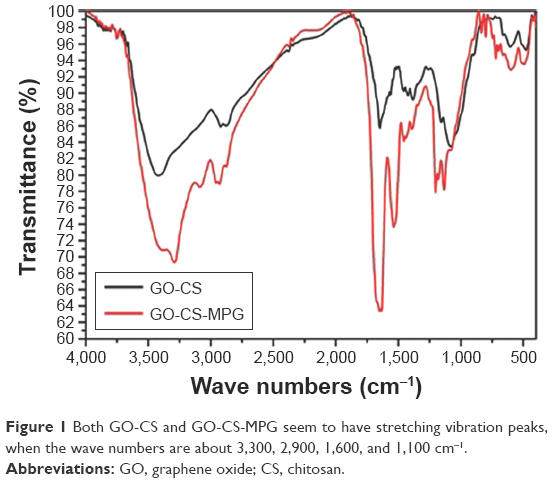 | Figure 1 Both GO-CS and GO-CS-MPG seem to have stretching vibration peaks, when the wave numbers are about 3,300, 2,900, 1,600, and 1,100 cm−1. |
Raman spectroscopy results of the nano drug carrier
Results are displayed in Figure 2. From the spectrograms of Raman it can be seen that the two drug carrier materials both have two peak values, that is, Peak D at 1,360 cm−1 and Peak C at 1,580 cm−1. For GO-CS, the intensity of Peak D is 600 while that of Peak G is 550, and the absolute intensity ID/IG is 1.09. For GO-CS-MPG, the intensity of Peak D is 510 while that of Peak G is 450, and the absolute intensity ID/IG is 1.13.
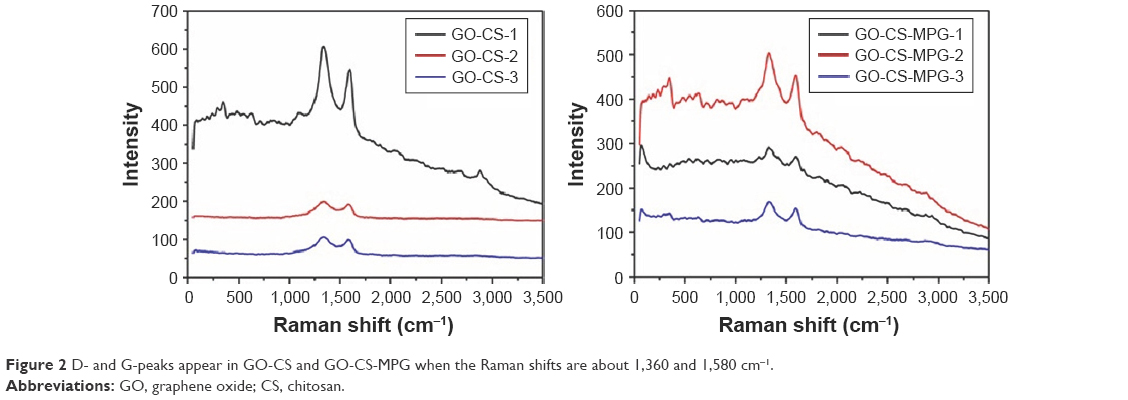 | Figure 2 D- and G-peaks appear in GO-CS and GO-CS-MPG when the Raman shifts are about 1,360 and 1,580 cm−1. |
TGA results of the nano drug carrier
TGA results are demonstrated in Figure 3. For GO-CS carrier, when the temperature ranges from 50°C to 100°C, the weight loss ratio is ~10%; when it ranges from 100°C to 600°C, weight loss is resulted from the complete thermolysis of CS molecules, and the residue is six-membered carbocyclic structure of graphene (of which the mass ratio is 40%), which indicates that the grafting ratio of CS is about 50% (100%–40%–10% [100% represents the proportion of GO-CS, 40% represents the proportion of CS, 10% represents the proportion of water, and the remaining 50% is the proportion of GO]). For GO-CS-MPG carrier, weight loss temperature is lower than that of GO-CS, and the mass ratio of the residue after thermolysis is 32%, lower than that of GO-CS (40%), which means the grafting ratio of MPG is about 8% (40%–32% [after the thermal decomposition of GO-CS, 40% remains, while the thermal decomposition of GO-CS-MPG is only 32%]).
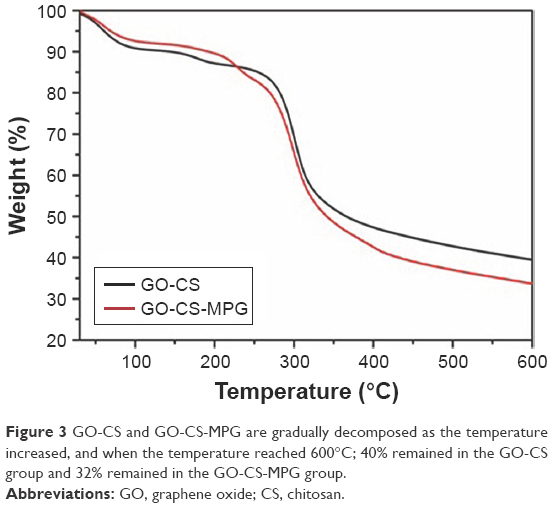 | Figure 3 GO-CS and GO-CS-MPG are gradually decomposed as the temperature increased, and when the temperature reached 600°C; 40% remained in the GO-CS group and 32% remained in the GO-CS-MPG group. |
SEM results of the nano drug carrier
The results are shown in Figure 4 (A and C are for GO-CS; B and D are for GO-CS-MPG). Figure 4A and C show that the surface of GO-CS is flake-like, the carrier material does not look like a slice and its thickness increases. Figure 4B and D manifests that the surface of GO-CS is not smooth and wavelike compared with GO and an increase in the thickness of GO-CS carrier can be seen in this section. Furthermore, a comparison of Figure 4A and C with Figure 4B and D shows that besides the inherent surface characteristics, there are some chain-like and rod-shaped structures on the surface of GO-CS.
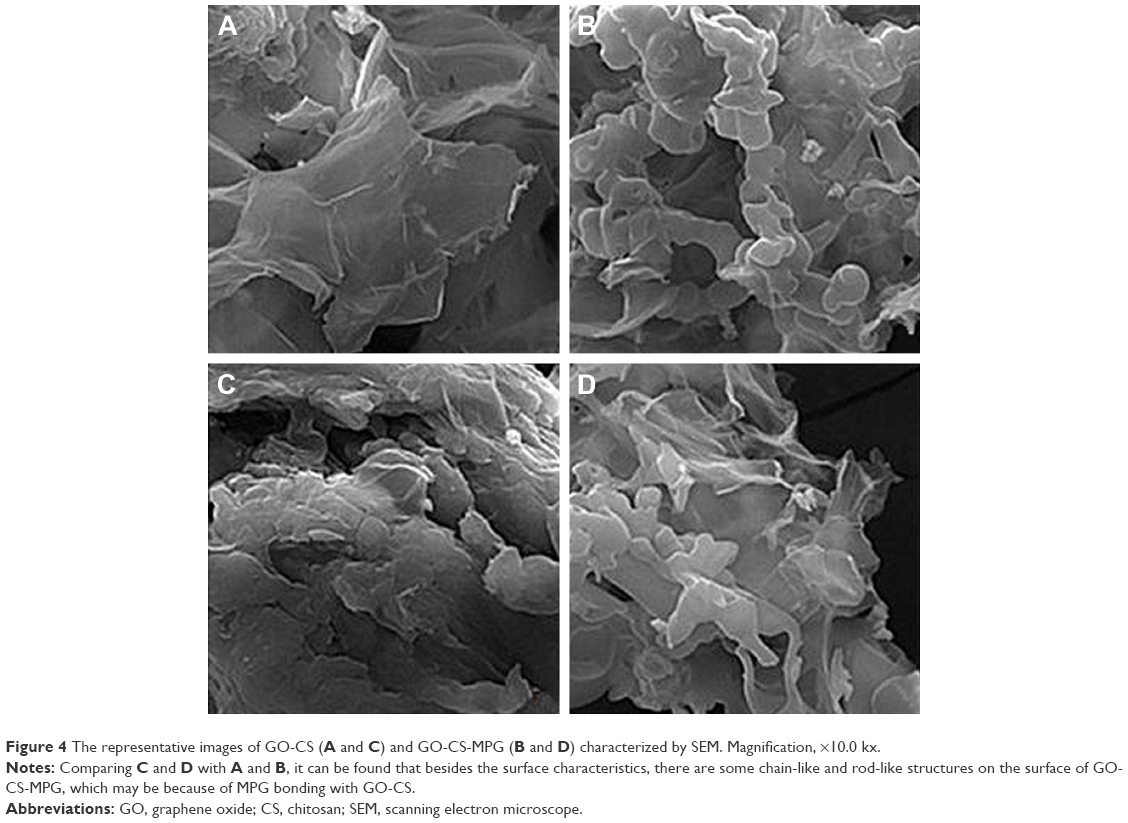 | Figure 4 The representative images of GO-CS (A and C) and GO-CS-MPG (B and D) characterized by SEM. Magnification, ×10.0 kx. |
Cytotoxicity experiment results of the nano drug carrier
CCK8 was used to test the cytotoxicity with the concentration of GO-CS-MPG ranging from 0 to 160 mg/L. The experimental results are displayed in Figure 5. It can be seen that as the GO-CS-MPG concentration increases, it has a certain toxic effect on L929 cells. However, the survival rate of L929 cells can still reach 80.5% even when the concentration of GO-CS-MPG is up to 80 mg/L, which manifests that GO-CS-MPG is well compatible with L929 cells with low cytotoxicity with a very slight influence on cytoactivity.
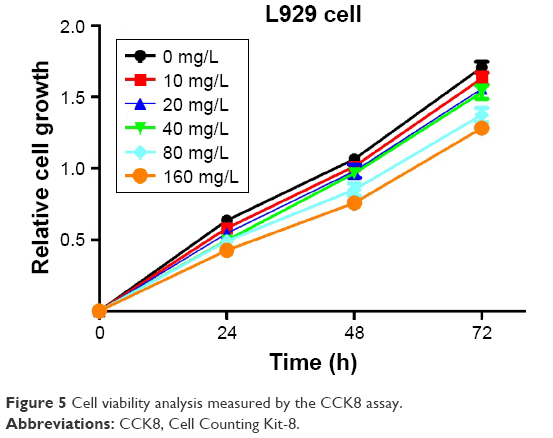 | Figure 5 Cell viability analysis measured by the CCK8 assay. |
Cell transfection experiment results of the nano drug carrier
Figure 6 shows the results of the A375 pinocytosis of FITC-GO-CS-MPG microspheres. The green fluorescent performance in the cells can be clearly observed in the figure.
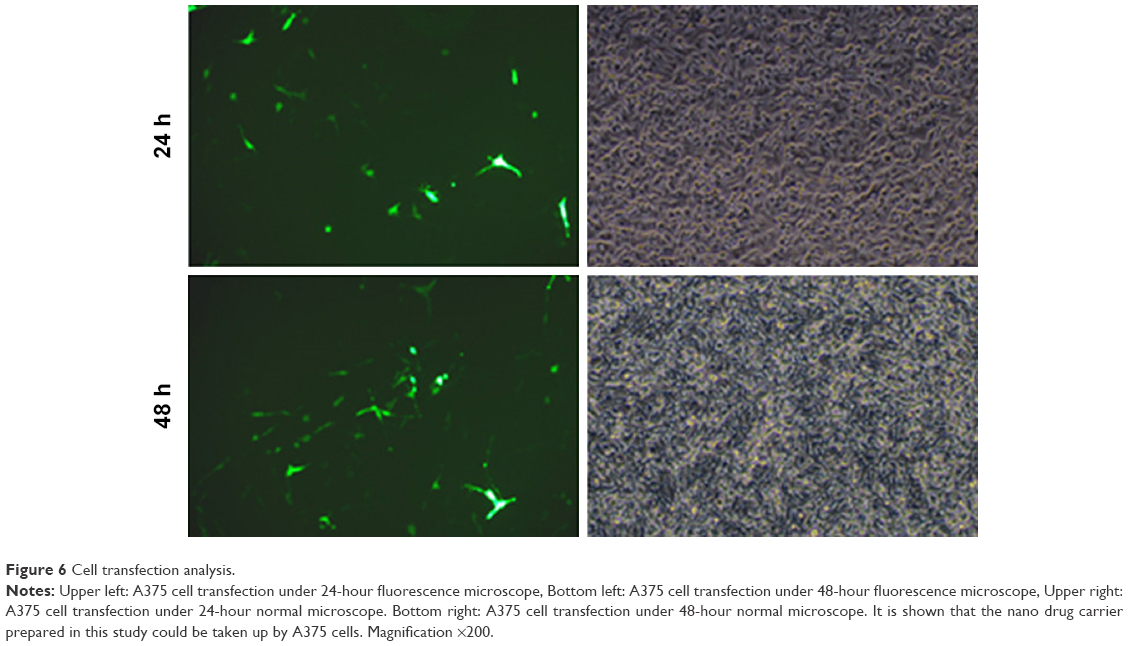 | Figure 6 Cell transfection analysis. |
Proliferation experiment results of the nano drug carrier with miR loaded
The outcomes are shown in Figure 7. The figure shows that GO-CS-MPG with no drug loaded has few effects on A375 cells and that compared with the blank control group, there is no statistical significance. When single miR199a or miR33a is used, they have an effect on A375 cells to some degree with respective inhibition rates of 27.14% and 24.62%, respectively. When single miR199a or miR33a is loaded, the GO-CS-MPG carrier has an effect on A375 cells to some degree with respective inhibition rates of 37.12% and 39.70%, respectively. Compared with the blank control group, GO-CS-MPG loaded with miR33a and miR199a has an evident effect on A375 cells and the inhibition rate is about 50.25% (P<0.05). Compared with the other groups, GO-CS-MPG with miR33a and miR199a loaded has stronger effect on A375 cells (P<0.05).
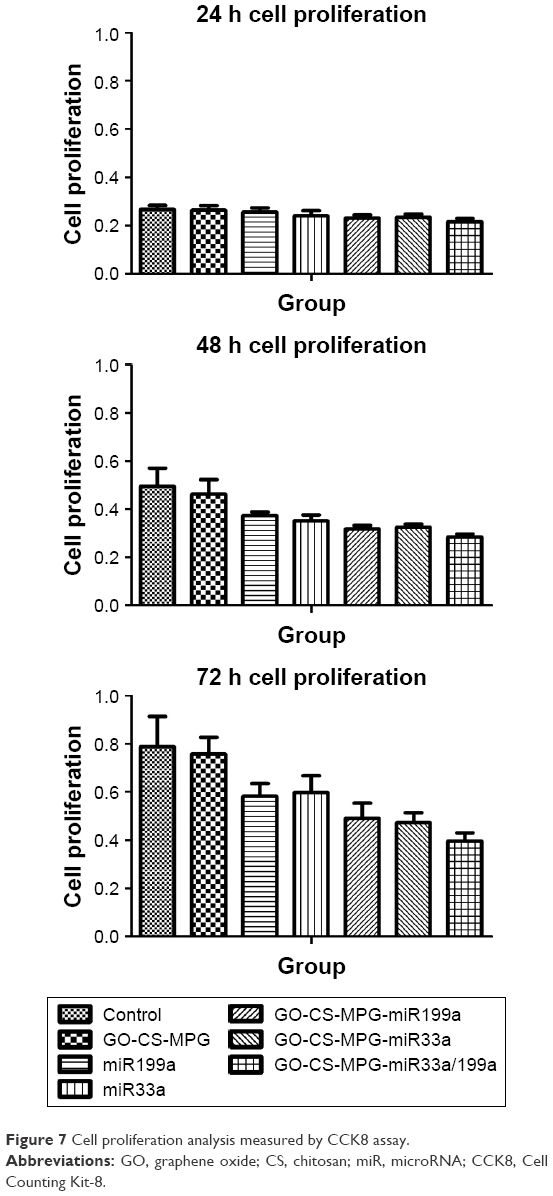 | Figure 7 Cell proliferation analysis measured by CCK8 assay. |
Western blot experiment results of the nano drug carrier with miR loaded
The results are shown in Figure 8. Compared with the other groups, GO-CS-MPG-miR33a/199a group is higher. Furthermore, in the miR199a group, the GO-CS-MPG-miR199a group, and the GO-CS-MPG-miR33a/199a group, the relative expression of Met is significantly increased (P<0.05), and between the other groups, there were no statistically significant differences (P>0.05).
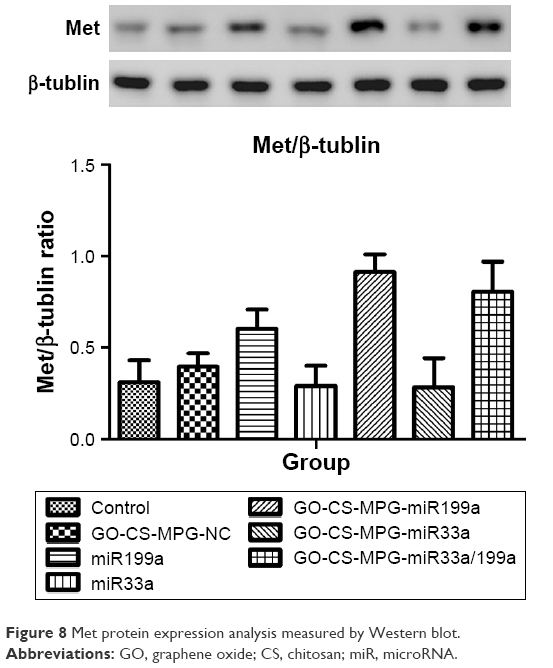 | Figure 8 Met protein expression analysis measured by Western blot. |
Results of glycolysis level detection experiment of the nano drug carrier with miR loaded
The results of the glycolysis level detection experiment are shown in Figure 9. At 24 and 48 h, compared with the blank control group, the empty GO-CS-MPG group, the miR199a group and the GO-CS-MPG-miR199a group has few changes, while the ratio of L/G in the miR33a group, the GO-CS-MPG-miR33a group, and the GO-CS-MPG-miR33a/199a group is lower. Furthermore, in the miR33a group, the GO-CS-MPG-miR33a group and the GO-CS-MPG-miR33a/199a group, the ratio of L/G has been clearly decreased (P<0.05), and between other groups, there were no statistically significant differences (P>0.05). Also, the ratio of L/G in the GO-CS-MPG-miR33a group is lower than the miR33a group (P<0.05).
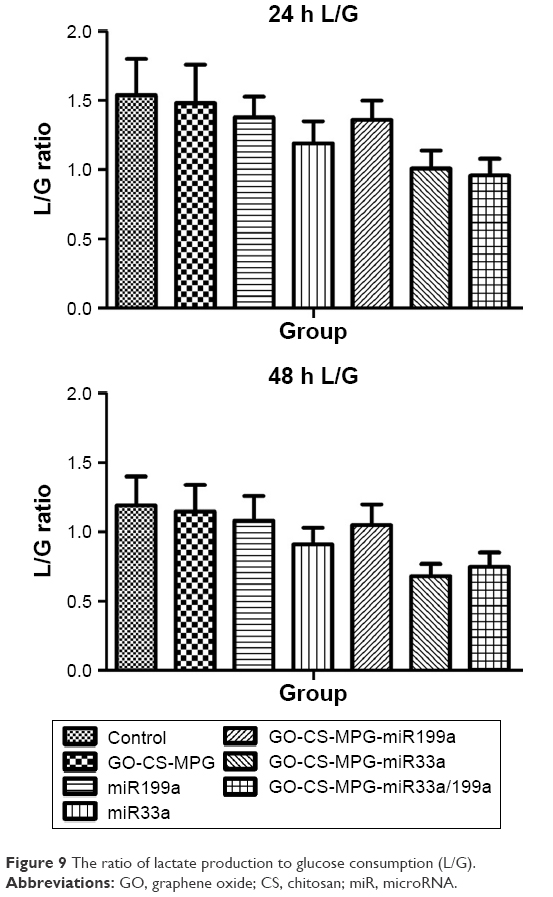 | Figure 9 The ratio of lactate production to glucose consumption (L/G). |
Results of subcutaneous tumor implantation experiment of the nano drug carrier complex
Approximately 7 days after inoculating the A375 single-cell suspension into the subcautaneous tissue of the nude mice, tumors were formed. After 14 days, tumors became more obvious with a formation rate of 100%. No nude mice died during this period and the volume of tumors became increasingly larger along with tumor-bearing time. According to the results shown in Figure 10, single GO-CS-MPG has few effects on the volume of tumors, and there is no statistical difference between single GO-CS-MPG and blank control. When single miR199a or miR33a is used, they have an effect on tumor volume to some degree. While GO-CS-MPG is loaded with miR199a or miR33a, the volume of the tumors have an obvious inhibition. Compared with the other groups, GO-CS-MPG loaded with miR33a and miR199a has evident effect on tumor volumes, and the inhibition rate is the highest (P<0.05).
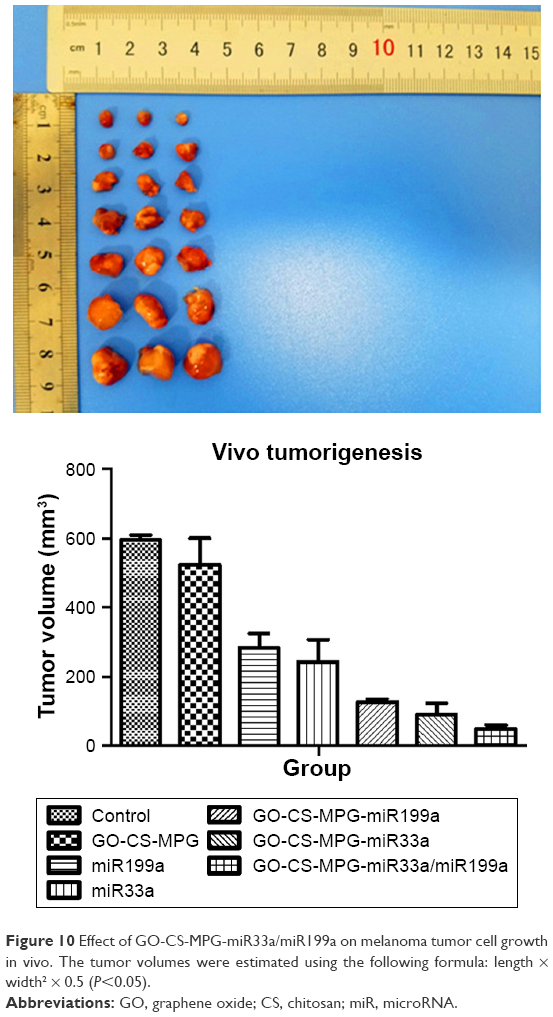 | Figure 10 Effect of GO-CS-MPG-miR33a/miR199a on melanoma tumor cell growth in vivo. The tumor volumes were estimated using the following formula: length × width2 × 0.5 (P<0.05). |
Discussion and conclusion
Material characterization research is to study the substantial structure of testing materials with the aid of specific techniques or certain information. To obtain the structural characteristics of materials, usually several methods need to be combined. In this experiment, IR spectroscopy, Raman spectroscopy, TGA, and SEM were integrated to investigate the real structure of the prepared nano drug carrier material.
The nature of IR spectroscopy is when materials are exposed to IR ray, energy will be absorbed by specific structures and stored in molecules. If the stored energy reaches a threshold value, molecules will vibrate and produce a specific spectrogram. Through the IR spectroscopy experiment, specific structures can be distinguished according to the spectrogram.16 It is known that when wavenumber is about 3,300 cm−1, groups like −OH and −NH will show a peak of stretching vibration and when it is about 2,900 cm−1, the group −CH will display a stretching vibration. When this value is around 1,600 cm−1, the group −C=O will show peak of stretching vibration, and when it is close to 1,100 cm−1, the group −C−O−C− will manifest the peak. From Figure 1, small-range stretching vibration can be seen when the wavenumber is ~1,081 cm−1, indicating group −C−O−C− exists in the molecules of the two drug carrier materials. The stretching vibration peaks of the two are almost the same, which suggests that ether groups are produced when the reaction between CS and GO takes place while no such groups are produced between MPG and GO-CS. As a result, it can be concluded that CS is successfully grafted onto GO. There will be evident stretching vibration peaks for GO-CS and GO-CS-MPG when the wavenumber is nearly 1,650 cm−1, which proves that ester group −C=O exists in the molecules of the two. And the reason why the peak intensity of GO-CS-MPG is larger than that of GO-CS is that the internal structures of cellular penetrating peptide MPG are combined by peptide bonds which contain a large number of −C=O, which also provides a new evidence for the combination between MPG and GO-CS. When the wavenumber is around 2,900 cm−1, stretching vibration peaks of GO-CS and GO-CS-MPG can be discerned, suggesting that group −C−H− exists in the molecules of the two. When the value is ~3,300 cm−1, the peaks of GO-CS and GO-CS-MPG can be seen, indicating groups O−H and N−H exist in both the molecules. But the peak intensity of the latter is larger than that of the former, because the latter contains MPG in which a number of O−H and N−H exist. It also proves MPG has been successfully grafted onto GO-CS.17–19
Raman spectroscopy analysis plays an important role in the development of carbon materials and is one of the most widely used techniques applied on novel carbon materials like graphene and carbon nanotube. It has large resolution ratio and is able to quickly analyze the characterizations of materials such as the electron band structure, material crystal structure, electron–phonon coupling, and phonon energy dispersion without any damage to the materials. Due to the inherent properties of graphene, Raman spectroscopy analysis, since creation, has become indispensable to investigate its characterization.20 The mechanism of Raman spectroscopy analysis is to represent the characterization of materials via Peak D produced from structure defects of materials, Peak G from the tangential vibration of sp2 hybridized carbon atoms and Peak G’ from the specific way of stacking between adjacent carbon atoms.21 It is mainly aimed at the characterization of GO, so only the parameters of Peak D and Peak G are necessary. The so-called Peak D, at 1,360 cm−1, coming from the structure defects of the six-membered carbon cycle of graphene and the scattering of amorphous carbons and cavities, reflects the randomness of GO and its definition of intensity is ID. Peak G, at 1,580 cm−1, which comes from E2 tangential vibration, expresses the plane integrity of the six-membered carbon cycle of GO. The results can be found in Figure 2. According to the Raman spectrogram, each drug carrier has two peak values, that is, Peak D at 1,360 cm−1 and Peak G at 1,580 cm−1. For GO-CS, the intensity value of Peak D is 600 and that of Peak G is 550; the absolute intensity ID/IG is 1.09. For GO-CS-MPG, the intensity values of Peak D and Peak G are 510 and 450, respectively, and the absolute intensity ID/IG is 1.13. No significant differences can be found between the intensity values of Peak D, Peak G, and the absolute intensity values. This implies that the degree of randomness of graphene does not increase, nor was the surface of GO clearly damaged after combining with CS and MPG, which means GO can keep its chemical and physical properties stable.
TGA investigates the heat stability and componential proportion of materials by controlling the temperatures through specific procedures, thereby determining the mass variation of determinants along with the changing temperatures and then making comparison with the standard temperature of complete thermal decomposition of different compounds. To determine the componential proportion of GO, CS, and MPG in GO-CS-MPG, a TGA experiment was performed on the prepared GO-CS and GO-CS-MPG.22 According to the results shown in Figure 3, for GO-CS, when the temperature ranges from 50°C to 100°C, combined water and absorbed water lose weight with a loss ratio of ~10%. When the temperature ranges from 100°C to 250°C, groups containing oxygen of GO lose weight and the glycosidic bonds break up. And when the temperature ranges from 250°C to 350°C, the thermal oxidizing decomposition reaction takes place on the molecular chain of CS. At that time weight loss comes from the carbonization of adjacent hydroxyls and the breakage of glycosidic bonds. But CS molecules are not completely decomposed under that temperature. When the temperature ranges from 350°C to 600°C, the loss comes from the complete decomposition of CS molecules; in the end, only the six-membered carbon ring remains (its proportion is about 40%). This indicates that CS molecules have been grafted onto GO molecules, and the grafting ratio is ~50% (100%–40%–10%). For GO-CS-MPG, the rate of weight loss is slightly faster than that of GO-CS when the temperature ranges from 100°C to 600°C. The reason might be the thermal decomposition of MPG, which happens when the temperature is 50°C–600°C. This also shows that MPG has been grafted onto GO-CS, and 32% of the total weight remains when GO-CS-MPG is completely decomposed, lower than that (40%) of GO-CS, indicating that the grafting ratio is ~8% (40%–32%). So for an integrated GO-CS-MPG carrier molecule, GO accounts for 40% of its weight, CS 50%, MPG 8% and others like combined water or absorbed water 2%.
SEM is designed to give researchers a more comprehensive and intuitive understanding of the materials being prepared. To perform this analysis, first prepare the samples and scan under a very narrow electron beam. Next collect the electrons reflected by the samples with a specific detector and convert them to electronic signals, which will then be transmitted to the kinescope and screen. So the image of the stereoscopic surface structure of the samples can be seen. The results are shown in Figure 4. According to Figure 4A, the appearance of GO-CS is lamellar, but the thickness of GO-CS carrier is significantly increased compared with the single-layer sheet structure of GO itself. This indicates that CS bonds with GO in the form of membrane covering. In Figure 4B, GO-CS is not smooth in surface and does not have the wave-like shape as GO itself is. In addition, the section of GO-CS is larger than that of GO, proving CS has been grafted onto GO. Comparing Figure 4C and D with Figure 4A and B, it can be found that besides the surface characteristics, there are some chain-like and rod-like structures on the surface of GO-CS-MPG, which may be because of MPG bonding with GO-CS.
As a nano gene carrier, GO-CS-MPG is supposed to be advantageous for its favorable biocompatibility, low or even zero cytotoxicity, and null influence on cytoactivity. In the in vitro experiment, CCK8 was used to determine the cytotoxicity of L929 cells with the concentration of GO-CS-MPG ranging from 0 to 160 mg/L. Results from Figure 5 show that the survival rate of L929 cells lowers when the concentration of GO-CS-MPG increases, indicating GO-CS-MPG is toxic to L929 cells to some degree. But the rate is 80.5% when the concentration of GO-CS-MPG is 80 mg/mL, suggesting that GO-CS-MPG is well biocompatible with L929 cells with low cytotoxicity. Therefore, as a nano carrier, GO-CS-MPG is highly bio-safe and promises to be a safe and efficient drug carrier in the follow-up studies.
Results of cell transfection show that the microsphere materials prepared in this study can be taken up by the cells and accumulate in the cytoplasm. As the co-culture time increased, the fluorescence intensity exhibited at 48 h was also increased relative to 24 h. This result directly confirms that the microsphere carrier has the ability to be taken-up by A375 and has a time-dependent cumulative dependence. At 48 h, the rate of endocytosis is about 50%. Therefore, GO-CS-MPG microspheres are an ideal carrier for this study.
A cell proliferation experiment was performed to check if GO-CS-MPG-miR33a/miR199a could inhibit the growth of melanoma A375 cells by the research group. Compared with the blank control group, GO-CS-MPG-miR33a/miR199a can inhibit the growth of melanoma A375 cells. Compared with the other groups, GO-CS-MPG-miR33a/miR199a is more potent in inhibiting A375 cells. This verifies the conclusion drawn on the previous experiment that miR33a and miR199a can inhibit the growth of A375 cells. It also demonstrates that GO-CS-MPG can synergistically inhibit the growth of A375 cells when both miR33a and miR199a are loaded.
miR regulates the expression of genes at the posttranscriptional level, which can directly regulate oncogene and/or tumor suppressor gene expression. In this study, we have investigated the effect of miR199a on a melanoma cell line. We have found that the expression of Met in the miR199a group, the GO-CS-MPG-miR199a group, and the GO-CS-MPG-miR33a/miR199a group is higher. Compared with the miR199a group, the relative expression of Met in the GO-CS-MPG-miR199a group and the GO-CS-MPG-miR33a/miR199a group is significantly increased (P<0.05). This also shows that GO-CS-MPG can be used as an effective carrier for miR199a. In our previous research, we have found that overexpression of miR199a significantly decreased cell proliferation and increased apoptosis, suggesting that miR199a may be negative regulators of melanoma,4 which is confirmed again in this study.
Aerobic glycolysis is a characteristic change in most malignant cells and plays a very important role in the development of cancer.23 Tumor cells can generate ATP energy through glycolysis and also produce NADPH and ribose via the pentose phosphate pathway to meet the needs of biosynthesis of fatty acids, amino acids, and nucleic acids. Melanoma, as a highly malignant tumor, also has marked aerobic glycolysis characteristics.24 In the aerobic glycolysis pathway, two molecules of lactic acid are produced after one molecule of glucose enters the cell, so the ratio of glucose metabolized by glycolysis can be calculated based on the L/G ratio. As shown in the results of the experiment, compared with the blank control group, the ratio of L/G in the miR33a group, the GO-CS-MPG-miR33a group, and the GO-CS-MPG-miR33a/miR199a group is lower (P<0.05). This proves that miR33a can inhibit glycolysis efficiency, which is consistent with our previous research. Moreover, the ratio of L/G in the GO-CS-MPG-miR33a group is lower than the miR33a group (P<0.05). This also shows that GO-CS-MPG can be used as an effective carrier of miR33a.
To check more clearly if GO-CS-MPG-miR33a/miR199a could synergistically inhibit the growth of A375 cells, a subcutaneous tumor implantation experiment was conducted. On the 35th day after tumor implantation, the tumor volume of the nude mice treated with GO-CS-MPG-miR33a/miR199a was minimal. Apparently, the growth rate of this group of tumors was lower than that of the other groups. Hence, a conclusion can be drawn that nano drug carrier GO-CS-MPG-miR33a/miR199a can powerfully inhibit the growth of the subcutaneously implanted tumors from melanoma A375 cells.
To sum up, according to the in vitro experiments above, when GO-CS-MPG carries miR33a and miR199a, it can inhibit the growth of melanoma A375 cells synergistically. This is probably because the amount of miR33a and miR199a is larger when carried by GO-CS-MPG than that directly transfected from plasmids. On the other hand, GO-CS-MPG increases the membrane-penetrating efficiency by letting more miR33a and miR199a into A375 cells, thereby improving the efficiency of transfection. After entering the A375 cells, miR33a can regulate the level of glycolysis of melanoma cells and interfere with their apoptosis.25 After entering the A375 cells, miR199a can regulate the expression of Met protein and ultimately inhibit the invasive growth of melanoma A375 cells. Compared with single miR33a or miR199a transfected into melanoma cells, combination of the two makes them more powerful in inhibiting the growth of melanoma A375 cells.26
Finally, GO-CS-MPG is a safe and efficient nano gene carrier. With miR33a and miR199a added, it can synergically inhibit the growth of melanoma A375 cells.
Acknowledgments
The present study was supported by the National Natural Science Foundation of China (numbers 81572689, 81372140, 81301688), the Natural Science Foundation of Hunan Province (number 2015JJ4053), the Project of Science and Technology of Hunan Province (number 2016SK2087), the Project of Health and Family Planning Commission of Hunan Province (numbers 2016-126 and 2015-40), and the Project of Science and Technology of Guizhou Province (number 2016–7189). This study was also supported by Xiao Zhou and Jintian Tang. We thank them for their outstanding contributions to this work. This research, including the use of cell lines, was approved by the institutional review board of the Third Xiangya Hospital, Central South University.
Author contributions
Defei Peng, Xiangyan Zhang, and Jianda Zhou made the same huge contributions to this paper. All authors contributed toward data analysis, drafting and critically revising the paper, gave final approval of the version to be published, and agree to be accountable for all aspects of the work.
Disclosure
The authors report no conflicts of interest in this work.
References
Zeng Q, Wang Q, Chen X, et al. Analysis of lncRNAs expression in UVB-induced stress responses of melanocytes. J Dermatol Sci. 2016;81(1):53–60. | ||
Luo C, Cao K, Zhou JD, et al. Site-directed mutagenesis (Y52E) of POLH affect its ability to bypass UV induced DNA. West Indian Med J. 2014;63(4):311–316. | ||
Rigel DS, Russak J, Friedman R. The evolution of melanoma diagnosis: 25 years beyond the ABCDs. CA Cancer J Clin. 2010;60(5):301–316. | ||
Xu D, Tan J, Zhou M, et al. Let-7b and microRNA-199a inhibit the proliferation of B16F10 melanoma cells. Oncol Lett. 2012;4(5):941–946. | ||
Uchino K, Ochiya T, Takeshita F. RNAi therapeutics and applications of microRNAs in cancer treatment. Jpn J Clin Oncol. 2013;43(6):596–607. | ||
Sanna V, Pala N, Sechi M. Targeted therapy using nanotechnology: focus on cancer. Int J Nanomedicine. 2014;9(1):467–483. | ||
Bertrand N, Wu J, Xu X, Kamaly N, Farokhzad OC. Cancer nanotechnology: the impact of passive and active targeting in the era of modern cancer biology. Adv Drug Deliv Rev. 2014;66:2–25. | ||
Ozpolat B, Sood AK, Lopez-Berestein G. Liposomal siRNA nanocarriers for cancer therapy. Adv Drug Deliv Rev. 2014;66:110–116. | ||
Lim EK, Jang E, Lee K, Haam S, Huh YM. Delivery of cancer therapeutics using nanotechnology. Pharmaceutics. 2013;5(2):294–317. | ||
Eldar-Boock A, Polyak D, Scomparin A, Satchi-Fainaro R. Nano-sized polymers and liposomes designed to deliver combination therapy for cancer. Curr Opin Biotechnol. 2013;24(4):682–689. | ||
Tan S, Li X, Guo Y, Zhang Z. Lipid-enveloped hybrid nanoparticles for drug delivery. Nanoscale. 2013;5(3):860–872. | ||
Morris MC, Vidal P, Chaloin L, Heitz F, Divita G. A new peptide vector for efficient delivery of oligonucleotides into mammalian cells. Nucleic Acids Res. 1997;25(14):2730–2736. | ||
Selvam S, Thomas PB, Hamm-Alvarez SF, et al. Current status of gene delivery and gene therapy in lacrimal gland using viral vectors. Adv Drug Deliv Rev. 2006;58(11):1243–1257. | ||
Stevenson M, Ramos-Perez V, Singh S, et al. Delivery of siRNA mediated by histidine-containing reducible polycations. J Control Release. 2008;130(1):46–56. | ||
Liu R, Xie H, Luo C, et al. Identification of FLOT2 as a novel target for microRNA-34a in melanoma. J Cancer Res Clin Oncol. 2015;141(6):993–1006. | ||
Fan W, Li H, Shan Y, Lv H, Zhang H, Liang Y. Classification of vinegar samples based on near infrared spectroscopy combined with wavelength selection. Anal Methods. 2011;3(8):1872–1876. | ||
Xu H, Liu Z, Cai W, Shao X. A wavelength selection method based on randomization test for near-infrared spectral analysis. Chemometr Intell Lab Syst. 2009;97(2):189–193. | ||
Shao X, du G, Jing M, Cai W. Application of latent projective graph in variable selection for near infrared spectral analysis. Chemometr Intell Lab Syst. 2012;114:44–49. | ||
Shan R, Cai W, Shao X. Variable selection based on locally linear embedding mapping for near-infrared spectral analysis. Chemometr Intell Lab Syst. 2014;131:31–36. | ||
Edwards HG, Stern B, Villar SE, David AR, Stem B. Combined FT-Raman spectroscopic and mass spectrometric study of ancient Egyptian sarcophagal fragments. Anal Bioanal Chem. 2007;387(3):829–836. | ||
Chen XH, Zhang WH, Zhang QZ, et al. FTIR and Raman spectroscopic analysis on carbapenems antibiotics imipenem. Chin J Light Catter. 2006;18:26. | ||
Idris SS, Rahman NA, Ismail K. Combustion characteristics of Malaysian oil palm biomass, sub-bituminous coal and their respective blends via thermogravimetric analysis (TGA). Bioresour Technol. 2012;123:581–591. | ||
Hanahan D, Weinberg RA. Hallmarks of cancer: the next generation. Cell. 2011;144(5):646–674. | ||
vander Heiden MG, Cantley LC, Thompson CB. Understanding the Warburg effect: the metabolic requirements of cell proliferation. Science. 2009;324(5930):1029–1033. | ||
Zhou J, Xu D, Xie H, et al. miR-33a functions as a tumor suppressor in melanoma by targeting HIF-1α. Cancer Biol Ther. 2015;16(6):846–855. | ||
Zhou J, Liu R, Wang Y, et al. miR-199a-5p regulates the expression of metastasis-associated genes in B16F10 melanoma cells. Int J Clin Exp Pathol. 2014;7(10):7182–7190. | ||
Bolhassani A. Potential efficacy of cell-penetrating peptides for nucleic acid and drug delivery in cancer. Biochimi Biophysi Acta. 2011;1816(2):232–246. |
 © 2018 The Author(s). This work is published and licensed by Dove Medical Press Limited. The full terms of this license are available at https://www.dovepress.com/terms.php and incorporate the Creative Commons Attribution - Non Commercial (unported, v3.0) License.
By accessing the work you hereby accept the Terms. Non-commercial uses of the work are permitted without any further permission from Dove Medical Press Limited, provided the work is properly attributed. For permission for commercial use of this work, please see paragraphs 4.2 and 5 of our Terms.
© 2018 The Author(s). This work is published and licensed by Dove Medical Press Limited. The full terms of this license are available at https://www.dovepress.com/terms.php and incorporate the Creative Commons Attribution - Non Commercial (unported, v3.0) License.
By accessing the work you hereby accept the Terms. Non-commercial uses of the work are permitted without any further permission from Dove Medical Press Limited, provided the work is properly attributed. For permission for commercial use of this work, please see paragraphs 4.2 and 5 of our Terms.