")
Back to Journals » International Journal of Nanomedicine » Volume 14
A smartphone-assisted pressure-measuring-based diagnosis system for acute myocardial infarction diagnosis
Authors Hong G, Rui G , Zhang D, Lian M , Yang Y, Chen P, Yang H, Guan Z, Chen W , Wang Y
Received 8 December 2018
Accepted for publication 15 February 2019
Published 8 April 2019 Volume 2019:14 Pages 2451—2464
DOI https://doi.org/10.2147/IJN.S197541
Checked for plagiarism Yes
Review by Single anonymous peer review
Peer reviewer comments 2
Editor who approved publication: Dr Thomas Webster
Guolin Hong,1 Gang Rui,2 Dongdong Zhang,1 Mingjian Lian,1 Yuanyuan Yang,1 Ping Chen,1 Huijing Yang,3 Zhichao Guan,4 Wei Chen,5 Yan Wang6
1Department of Laboratory Medicine, The First Affiliated Hospital of Xiamen University, Xiamen 361005, People’s Republic of China; 2Department of Orthopaedic Surgery, The First Affiliated Hospital of Xiamen University, Xiamen 361005, People’s Republic of China; 3Department of Clinical Medicine, Fujian Medical University, Fuzhou 350108, People’s Republic of China; 4Department of Research and development, Xiamen Passtech Co.,Ltd., Xiamen 361101, People’s Republic of China; 5Higher Educational Key Laboratory for Nano Biomedical Technology of Fujian Province, Department of Pharmaceutical Analysis, Fujian Medical University, Fuzhou 350004, People’s Republic of China; 6Department of Cardiology, the Affiliated Cardiovascular Hospital of Xiamen University, Medical College of Xiamen University, Xiamen 361004, People’s Republic of China
Background: Acute myocardial infarction (AMI), usually caused by atherosclerosis of coronary artery, is the most severe manifestation of coronary artery disease which results in a large amount of death annually. A new diagnosis approach with high accuracy, reliability and low measuring-time-consuming is essential for AMI quick diagnosis.
Purpose: The objective of this study was to develop a new point-of-care testing system with high accuracy and reliability for AMI quick diagnosis.
Patients and methods: 50 plasma samples of acute myocardial infarction patients were analyzed by developed Smartphone-Assisted Pressure-Measuring-Based Diagnosis System (SPDS). The concentration of substrate was firstly optimized. The effect of antibody labeling and matrix solution on measuring result were then evaluated. And standard curves for cTnI, CK-MB and Myo were built for clinical sample analysis. The measuring results of 50 clinical samples were finally evaluated by comparing with the measuring result obtained by CLIA.
Results: The concentration of substrate H2O2 was firstly optimized as 30% to increase measuring signal. A commercial serum matrix was chosen as the matrix solution to dilute biomarkers for standard curve building to minimize matrix effect on the accuracy of clinical plasma sample measuring. The standard curves for cTnI, CK-MB and Myo were built, with measuring dynamic range of 0–25 ng/mL, 0–33 ng/mL and 0–250 ng/mL, and limit of detection of 0.014 ng/mL, 0.16 ng/mL and 0.85 ng/mL respectively. The measuring results obtained by the developed system of 50 clinical plasma samples for three biomarkers matched well with the results obtained by chemiluminescent immunoassay.
Conclusion: Due to its small device size, high sensitivity and accuracy, SPDS showed a bright potential for point-of-care testing (POCT) applications.
Keywords: acute myocardial infarction, diagnosis, pressure sensor, smartphone, Pt nanoparticle
Introduction
Annually, more than 2.4 million deaths in the US, 4 million deaths in Europe and northern Asia, and more than a third of deaths in developed nations are caused by coronary artery disease (CAD).1–4 Acute myocardial infarction (AMI), usually caused by atherosclerosis of coronary artery, is the most severe manifestation of CAD, resulting in high mortality.5 Treatment of AMI is time-critical.6 Early medical and surgical intervention has been widely demonstrated to be able to significantly reduce the myocardial damage and mortality.7 To provide an accurate medical treatment for AMI, a quick diagnosis of AMI during door-to-balloon time is crucially required. According to current consensus, AMI is majorly defined by some physical diagnostic approaches such as electrocardiogram (ECG),8–10 changes in the motion of the heart wall on imaging, and some well-evaluated cardiac biomarkers,11,12 like cardiac troponin I/T (cTnI/cTnT),13–17 MB isoenzyme of creatine kinase (CK-MB),18,19 and myoglobin (Myo).20 ECG involves the placement of a series of leads on a person’s chest that measure electrical activity associated with the contraction of heart muscle, which has long been used for AMI diagnosis. By measuring ST-T variation or Q-waves, ECG can accurately diagnose AMI. Imaging methods, like chest X-ray, single-photon emission computed tomography/computed tomography scans, and positron emission tomography scans, can also be used for AMI diagnosis.21 Instead of ECG and imaging approaches, some well-evaluated biomarkers are now widely used for AMI diagnosis. These biomarkers include highly specific proteins like cTnI/cTnT, as well as some less-specific biomarkers like CK-MB and Myo. Due to differences in their diagnostic window periods and to improve the accuracy of AMI diagnosis, these biomarkers are often measured simultaneously. Various detection approaches for these AMI biomarkers, such as chemiluminescence immunoassay (CLIA), ELISA, and lateral immunochromatographic assay (LICA), are currently available in most hospitals.22 Among these approaches, CLIA, assisted by fully automated devices, has shown the highest user-friendliness, sensitivity, reliability, and diagnosis efficiency for quantitative measurement. However, limited by the device size and a rigorous demand for running-environment control to ensure a stable working condition, the highly precise equipment can hardly work out of a well-developed laboratory. This results in a lack of effective and reasonable diagnosis of AMI in some less developed areas, which cannot support such precision and expansive instrument, as well as some emergency situations in the wild. As a supplement for CLIA, LICA is widely used under highly unfavorable environments due to its simple operational process. However, most LICA products can only support qualitative purpose instead of quantitative application, because of a significant variation caused by the uncontrollable reaction process that occurs on the nitrocellulose membrane. Therefore, a quantitative detection approach with good portability, high sensitivity, and accuracy under an unfavorable environment is highly essential.
In recent years, Pressure-based Bioassay (PASS) for biomarker detection has been reported.23–26 Different from traditional detection methods that are based on light, color, electrical activity, magnetic force, heat, or distance, the developed assay transforms molecular signal into pressure signal by enzyme- or catalyst (nanoparticles)-linked immunosorbent assay. Furthermore, a similar system was further applied for analysis at the single-cell level,27,28 drug detection, and analysis of disease biomarkers.29 PASS has shown high sensitivity, high reliability, and good portability in the reported works, which can be attributed to pressure sensor that is highly sensitive to pressure variations caused by the immunity assay. However, the developed measuring device is not user-friendly enough and can measure only one sample per time. The measurement between different samples with a short delay may cause unpredictable error. Besides, due to being lack of a strict control of manipulation procedure, the detection result may be affected by operator’s experience. Therefore, PASS is still far from being applied in applications that have a rigorous requirement for reliability and controllability like clinical diagnosis, although the technique still has a bright potential.
To solve abovementioned problems, herein, we developed Smartphone-Assisted Pressure-Measuring-Based Diagnosis System (SPDS) for portable and highly sensitive diagnostic applications. SPDS is composed of a pressure measuring device and a smartphone. The size of the pressure measuring device is 115×67×50 mm3, small enough to be pocket-portable. The smartphone is connected to the pressure measuring device via Bluetooth, which helps to analyze the data and give an accurate detection and diagnosis result, with the capability of storing more than 105 detection results. To estimate the sensitivity and reliability of the instrument, SPDS was used to measure clinical plasma samples for AMI diagnosis by cTnI/CK-MB/Myo combined examination. The labeling process was first estimated, and matrix effect of biomarkers in different matrix solutions was compared. To minimize the matrix effect for detection accuracy, a commercially available matrix serum was used to replace low-biomarker-concentration plasma for the building of standard curve for each biomarker. Finally, 50 clinical plasma samples were tested and compared with the measuring results obtained by CLIA (Abbott Architect i2000SR). The results showed that the concentration values of three biomarkers in the 50 samples measured by SPDS matched well with those measured by CLIA. The SPDS showed a comparable sensitivity and reliability with CLIA, while with much smaller device size and assisted by smartphone for data analysis system, allowing applications under highly unfavorable circumstances, including the hospitals in less developed areas and emergency situations in the wild. Moreover, to help to give early medical treatment and surgical intervention for AMI patient, the SPDS shows bright prospect for AMI diagnosis during ambulance delivery time, much earlier than traditional door-to-balloon time, which may have potential to significantly decrease the damage caused by AMI in the patients.
Materials and methods
Chemicals and materials
The antibodies for three biomarkers and matrix serum were supplied by Xiamen Passtech Co., Ltd. H2PtCl6, Tween-20, and casein-Na were obtained from Sigma-Aldrich Co. Magnetic beads were obtained from Thermo Fisher Scientific. Other inorganic salts were obtained from Sinopharm Chemical Reagent Co., Ltd.
Synthesis of Pt nanoparticles (PtNPs)
To prepare PtNPs, 1 mL of 0.1 M H2PtCl6 solution and 96.9 mL of ultrapure water were added into a round-bottom flask. The solution was heated to 80°C with magnetic stirring at the rate of 700 rpm. About 2.1 mL of 1.4 M ascorbic acid was then added. The mixture was kept at 80°C for 30 minutes. The obtained PtNPs solution was stored in a conical flask at room temperature.
The optimization of H2O2 concentration
To optimize the concentration of H2O2, 1 μL of synthesized PtNP solution was added into 50 μL of 10 mM hosphate buffered saline with 1% Twen-20 (PBST, pH 7.0) in an eight-well strip, followed by mixing with pipette tip blowing. About 50 μL of H2O2 at different concentrations (30%, 15%, 7.5%, and 3.75%) was then added and mixed. The strip was placed into the pressure reading device for the real-time monitoring of pressure variation. The results were compared to choose the best H2O2 concentration.
Antibody labeling on PtNPs
Five hundred microliters of PtNP solution was centrifuged at 13,000 rpm for 10 minutes to remove the supernatant and resuspended with 500 μL of 1 mM morpholinoethanesulfonic acid (MES) buffer (pH 7.0). For cTnI assay, 100 μL of labeling antibody solution (120 μg/mL diluted in ultrapure water) was added into the resuspended PtNPs solution, followed by a short mixing for 40 seconds to ensure uniform absorption of antibody molecules on the PtNPs surface, followed by 10-minute incubation at room temperature to increase the absorption efficiency. The mixture was then added to 500 μL of blocking buffer (0.25% casein in 100 mM Na2CO3-NaHCO3 buffer with 0.25% Tween-20, 5% sucrose, pH 9.0) and kept for 2 hours at room temperature, followed by centrifugation at 5,000 rpm for 5 minutes to remove the supernatant. The recovered nanoparticles were finally resuspended in 10 mM citrate buffer (pH 7.0) and stored at 4°C. For CK-MB and Myo assay, 110 μL of labeling antibody solution (with 50 μg/mL and 10 μg/mL labeling antibody for each biomarker, respectively) was used and the recovered nanoparticles were stored in 0.1 M PBS (pH 7.4). The labeling process for cTnI was similar to the abovementioned procedure.
Evaluation of the effect of antibody labeling on PtNP catalysis efficiency
To evaluate the influence of antibody labeling process on PtNP catalysis efficiency, 1 μL of PtNP solution with three antibody-labeled biomarkers was added into 50 μL of 10 mM PBST (pH 7.0) in an eight-well strip, followed by a short mixing. About 50 μL of 30% H2O2 solution was then added and mixed several times by blowing with a pipette tip. Then the strip was placed into the pressure measuring device at 37°C for 5 minutes to measure the pressure value. As a comparison, 1 μL of synthesized PtNP solution was used following the same steps. The obtained pressure values were compared to evaluate the variation in catalysis efficiency. Each point was measured three times to obtain an average value.
To demonstrate that the antibody molecules have bound onto the PtNP surface, PtNP solution before and after labeling was diluted with ultrapure water by 50 times, respectively, and zeta-average diameter and zeta-potential were measured using a dynamic light scattering device (Zetasizer Nano ZS90, Malvern, Worcestershire, United Kingdom). The obtained zeta-average diameter and potential for PtNPs before and after labeling were compared.
Coating of magnetic beads with capture antibody
Dynabeads M280 Tosylactivated (165 μL, 30 mg/mL) was washed three times with 0.1 M PBS buffer (pH 7.4). About 20 μL of capture antibodies (cTnI 7.5 mg/mL, CK-MB 5 mg/mL, and Myo 5 mg/mL), 150 μL of 0.1 M PBS (pH 7.4), and 100 μL of 3 M ammonium sulfate were added and incubated for 16 hours at 37°C. After removing the supernatant, 1 mL of 0.01 M PBS with 0.5% BSA was added to block the leftover binding sites on the beads for 1 hour at 37°C. The magnetic beads were resuspended in 250 μL of PBS with 0.1% BSA and washed three times to achieve a final beads concentration of 20 mg/mL. The obtained beads solution was stored at 4°C for further use.
Matrix effect evaluation
To evaluate the matrix effect on plasma sample detection, samples with gradient concentrations of cTnI (0, 0.1, 1, 5, 10, 25, and 50 ng/mL) antigen diluted in 10 mM PBS buffer, commercial serum matrix, and a mix of negative clinical samples (concentration of cTnI <0.01 ng/mL, measured by CLIA), were measured by the developed SPDS which included the following steps:
(1) | Hundred microliters of samples with different concentrations of cTnI in different matrix solutions was mixed with 20 μL of capture antibody-modified magnetic beads (1 mg/mL, diluted by reagent diluent) for 5 minutes to let the antigen molecules in the sample to be captured by the antibody on magnetic beads. | |
(2) | The beads were washed three times following the steps of magnetic beads gathering by a permanent magnet for 30 seconds, resuspension in 200 μL of washing buffer (10 mM PBST), and shaking for 30 seconds. | |
(3) | The washing buffer was then replaced with 50 μL of antibody-labeled PtNP (diluted 2.5 times with 10 mM PBST) solution, incubated for 5 minutes, and was followed by washing for another three times to remove free antibody-labeled PtNP. | |
(4) | Hundred microliters of H2O2 was then added into the well to allow O2 molecule generation for 5 minutes. The eight-well strip was placed into a pressure reader to collect the detection result. |
The obtained measurement result was finally analyzed and compared. The best matrix for standard substance dilution for standard curve building was chosen considering the balance between acceptable matrix effect and acquiring convenience.
For the matrix effect evaluation of CK-MB and Myo assays, the same approach was used, except that the negative clinical serum sample for CK-MB was <0.5 mg/mL and for Myo was <1 mg/mL.
Each point was measured three times, and the average values and SD were calculated.
Standard curve building for cTnI immunoassay
(1) | Hundred microliters of sample with a series of cTnI concentrations (0, 0.01, 0.1, 1.0, 5.0, 10.0, 15.0, 20.0, 25.0, and 50.0 ng/mL) in different matrix solutions was mixed with 50 μL of capture antibody-modified magnetic beads (1 mg/mL, diluted by reagent diluent) for 5 minutes to let the antigen molecules in the sample be captured by the antibody on magnetic beads. | |
(2) | The beads were repeatedly washed three times with the steps of magnetic beads gathering by a permanent magnet for 30 seconds, resuspension with 200 μL of washing buffer (10 mM PBST), and shaking for 30 seconds. | |
(3) | The washing buffer was replaced with 50 μL of antibody-labeled PtNP (diluted 2.5 times with 10 mM PBST) solution, allowing for 5 minutes of incubation, and then followed by washing with 200 μL of washing buffer (10 mM PBST) for another three times to remove free PtNPs. | |
(4) | Hundred microliters of H2O2 was then added into the well to allow O2 molecule generation for 5 minutes. The eight-well strip was immediately placed on a pressure measuring device to collect detection result. | |
(5) | Each concentration measurement was repeated for three times, and the average values and SDs were calculated. |
Standard curve building for CK-MB immunoassay
(1) | Hundred microliters of samples with different concentrations of CK-MB (0, 0.41, 1.23, 3.69, 11.1, 33.3, 100, and 300 ng/mL) in different matrix solutions was mixed with 50 μL of capture antibody-modified magnetic beads (1 mg/mL, diluted by reagent diluent) for 5 minutes to let the antigen molecules in the sample to be captured by the antibody on magnetic beads. | |
(2) | The beads were repeatedly washed three times with steps of magnetic beads gathering by a permanent magnet for 30 seconds, followed by resuspension with 250 μL of washing buffer (10 mM PBST) and shaking for 30 seconds. | |
(3) | The washing buffer was replaced with 50 μL of antibody-labeled PtNP (diluted 2.5 times with 10 mM PBST) solution, incubated for 5 minutes, and was followed by washing for another three times to remove free antibody-labeled PtNP. | |
(4) | Hundred microliters of H2O2 was then added into the well to allow O2 molecule generation for 5 minutes. The eight-well strip was placed on a pressure measuring device to collect detection result. | |
(5) | Each concentration measurement was repeated for three times, and the average values and SDs were calculated. |
Standard curve building for Myo immunoassay
(1) | Twenty microliters of samples with different concentrations of Myo (0, 15.7, 31.3, 62.5, 125, 250, 500, and 1,000 ng/mL) in different matrix solutions was mixed with 50 μL of capture antibody-modified magnetic beads (1 mg/mL, diluted by reagent diluent) in the well of an eight-well strip for 5 minutes to let the antigen molecules in the sample to be captured by the antibody on magnetic beads. | |
(2) | The beads were repeatedly washed three times with steps of magnetic beads gathering by a permanent magnet for 30 seconds, followed by resuspension with 250 μL washing buffer (10 mM PBST) and shaking for 30 seconds. | |
(3) | The washing buffer was replaced with 50 μL of antibody-labeled PtNP (diluted by 2.5 times with 10 mM PBST) solution, incubated for 5 minutes, which was followed by washing for another three times to remove free antibody-labeled PtNP. | |
(4) | Hundred microliters of H2O2 was then added into the well to allow O2 molecule generation for 5 minutes. The eight-well strip was placed on a pressure measuring device to collect detection result. | |
(5) | Each concentration measurement was repeated for three times, and the average values and SDs were calculated. |
Determining the limit of detection (LOD) of a biomarker
The pressure variation value of each biomarker was found to be linear to the biomarker concentration. The LOD for each biomarker was determined as follows:
|
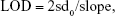
where sd0 is the SD of blank samples and slope is obtained by linear regression for pressure variation to different biomarker concentrations at low level.
Specificity evaluation of SPDS for three biomarkers
To investigate the specificity of SPDS for three biomarkers, some common proteins found in serum, including thrombin (Thr), hemoglobin (Hb), human serum albumin (HSA), immunoglobulin G (IgG), and a common inflammation biomarker C-reactive protein (CRP), were used as the negative controls. The concentration of each negative control protein was 1 mg/mL diluted in serum matrix, and the concentrations of the three biomarkers (cTnI, CK-MB, Myo) were 10 ng/mL, 100 ng/mL, and 250 ng/mL, respectively, which acted as the positive controls. The same assay procedure and reagents for three biomarkers were used to test these negative control proteins samples to measure the pressure variation value after immune assay. Three runs were taken for each protein test and average value and SD were calculated.
Detection of clinical plasma samples
The concentration of three biomarkers, cTnI, CK-MB, and Myo, in 50 clinical plasma samples was measured with SPDS following the same measuring procedure as standard curve building for each biomarker respectively. The obtained results were compared with CLIA (ARCHITECT i2000SR). Each point was measured three times, and the average values and SD were calculated.
Results of Bland–Altman analysis of clinical plasma samples
The Bland–Altman analysis of clinical samples comparing the results of SPDS with the CLIA method was performed by using SPSS software. Briefly, for the results obtained from SPDS (Vspds) and CLIA (Vclia) methods for 50 clinical samples, variables were calculated as follows:
|
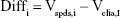
|
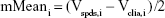
|

Then, the average value (mean) and SD of Diffi were calculated by the software, and the reference lines of 95% CI were obtained as follows:
|

|

Finally, a scatter diagram was build using mMeani as x-axis and Diffi as y-axis. Mean reference line and 95% CI reference lines were added on the scatter diagram to generate Bland–Altman diagram.
Manipulation process of SPDS
The eight-well strip with H2O2 and PtNPs-bound magnetic beads after immunoassay was covered with a sealing rubber pad to seal the wells and put inside the adaptor to deliver into pressure measuring device. The screw valve then moved the pressure sensor module down to press onto the rubber pad, fully sealing the gap between pressure sensor module and rubber pad. Afterward, the start button was pressed to start the measurement of pressure.
Results and discussion
Principle of SPDS
SPDS comprises a pressure measuring device (Figure 1A and C) for data collection and transporting pressure data to a smartphone (Figure 1A), and a smartphone for data analysis, storage, and output. The structure profile of developed pressure measuring device is shown in Figure 1B. The major parts of the device include a screw valve to seal the eight-well strip, eight integrated pressure sensors to measure pressure value of each well, a rubber pad for gas sealing, and an adaptor for loading of the strip into the device. The schematic of SPDS working procedure is shown in Figure 1A. To measure the biomarker concentration with SPDS, the sample is first incubated with magnetic beads, which is coated with capture antibody molecules, in a well of an eight-well strip to capture biomarker molecules onto beads surface. After a washing step to remove the sample remnant to avoid non-specific absorption, PtNPs modified with labeling antibody are added into the well to label the biomarkers, generating an antibody-antigen-antibody sandwich structure. After another washing step to remove free labeling PtNPs, H2O2 substrate is added and catalyzed by PtNPs. Then, the strip is immediately placed in a pressure measuring device and sealed with screw valve. A large amount of O2 gas is produced causing significant pressure variation in the wells, which is measured by the pressure sensor and transmitted to a smartphone via Bluetooth. The pressure variation value is finally analyzed by the smartphone and transformed into biomarker concentration value with a previously fed standard curve input pattern. Compared to traditional biomarker detection approaches such as light, heat, magnetic force, etc., SPDS transforms biomarker molecule signal into pressure signal, thus avoiding the inevitable environmental effects caused by light, heat, and magnetic field. Furthermore, by measuring the pressure variation value after and before catalyzation process, instead of only the absolute pressure value after catalyzation, SPDS eliminates the possible error caused by the atmospheric pressure changes due to altitude variation or changes in weather. By using a simple but highly precise integrated pressure sensor, SPDS significantly decreases the device size for highly sensitive monitoring and allows for highly accurate biomarker detection under robust environments. Furthermore, assisted by a smartphone via Bluetooth, SPDS is able to deal with complicated data analysis contributed by the strong computing power of smartphone,30,31 which helps expand the application field of SPDS to a larger extent, such as POCT for emergency, bacterial detection in external environments such as POCT for emergency and bacteria detection out of field.
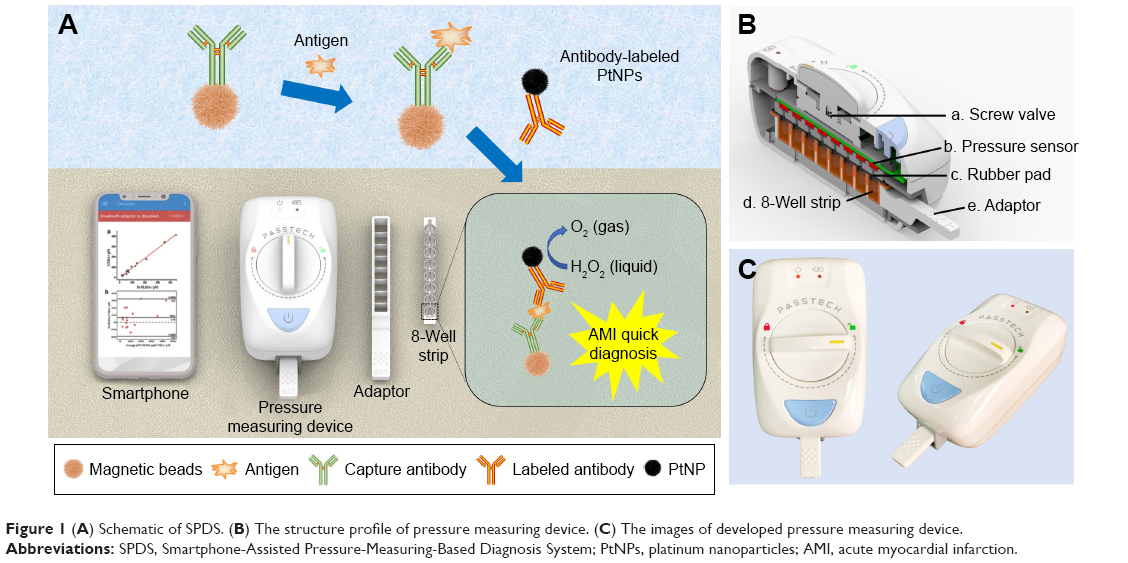 | Figure 1 (A) Schematic of SPDS. (B) The structure profile of pressure measuring device. (C) The images of developed pressure measuring device. |
Optimization of H2O2 concentration
As the substrate of PtNPs, the concentration of H2O2 may significantly affect the catalytic efficiency leading to a change in sensitivity. To optimize the catalytic efficiency, firstly we optimized the H2O2 concentration. The result is shown in Figure S1; when the concentration of H2O2 decreased, the catalytic efficiency of PtNPs also decreased. The measured pressure variation value for 30% H2O2 was almost ten times the value obtained by 3.75% H2O2. To obtain the highest detection sensitivity for biomarkers, 30% H2O2 was chosen for further pressure measuring assays.
Effect of antibody labeling on PtNPs catalysis efficiency
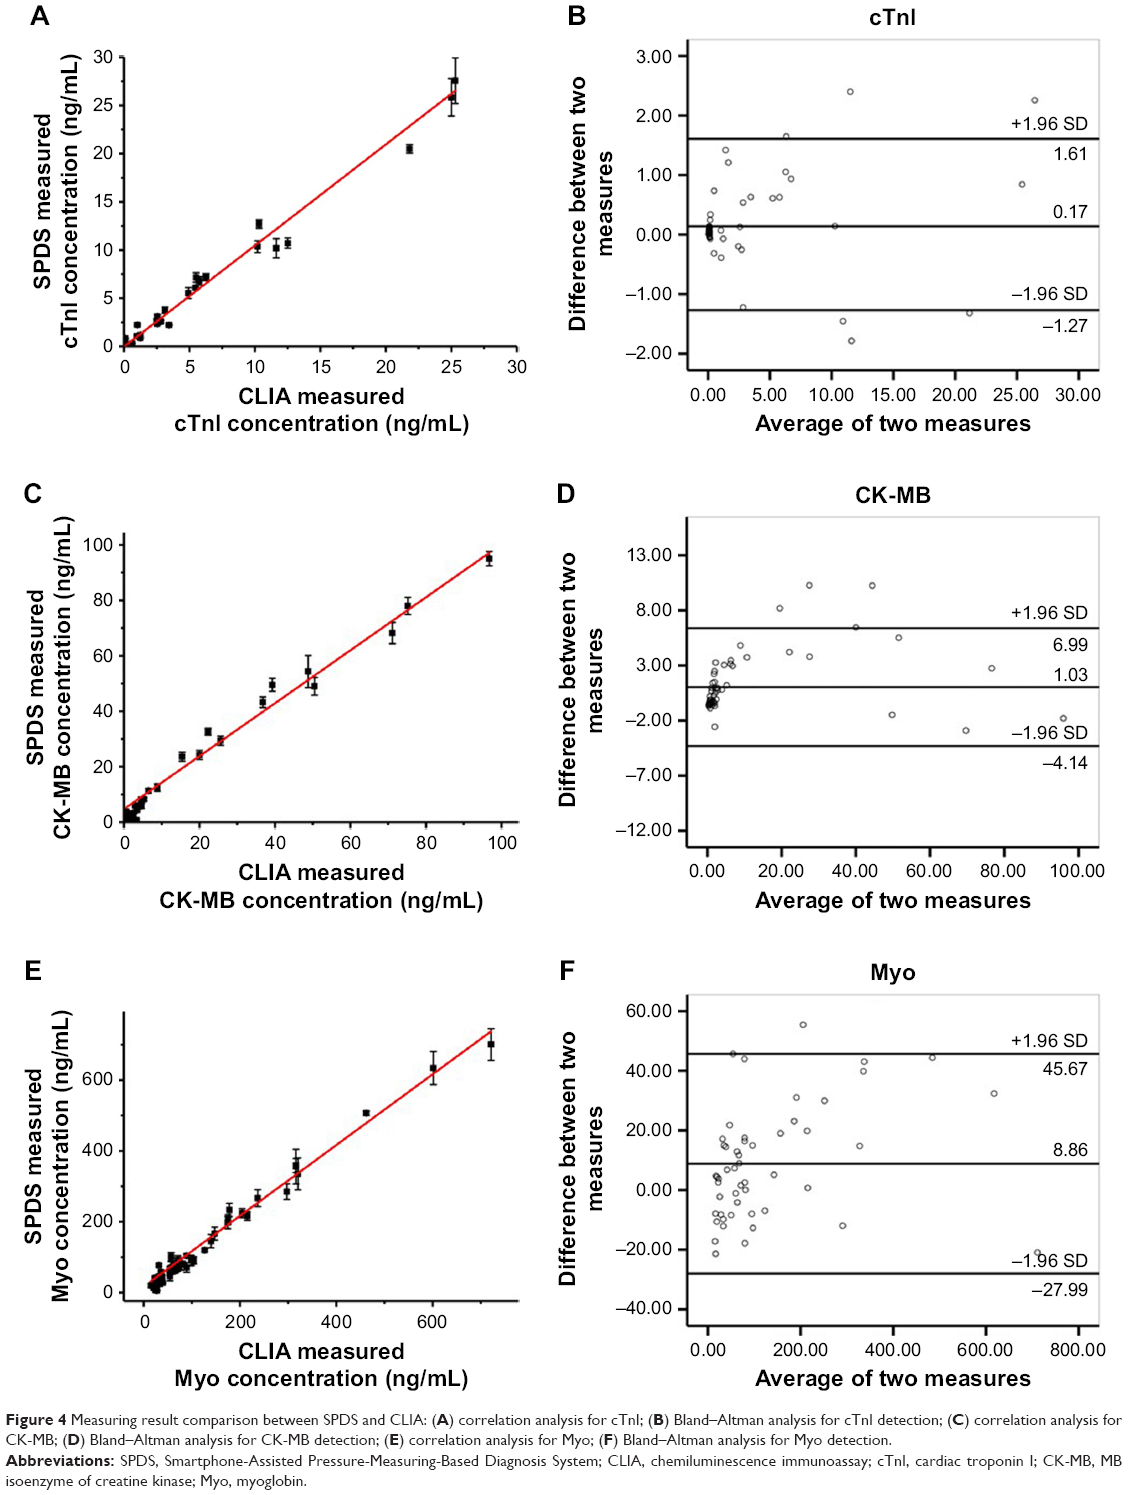
As shown in Figure 2A and B, the zeta-average diameter increased to 207.3 nm for cTnI (for profile, see Figure S2B), 215.2 nm for CK-MB (for profile, see Figure S2C), and 188.3 nm for Myo (for profile, see Figure S2D) from 126.2 nm before labeling (for profile, see Figure S2A). The zeta-potential changed from −27.6 mV to −41.9 mV for cTnI, −40.0 mV for CK-MB, and −38.6 mV for Myo. The increase in zeta-average diameter suggests binding of antibody molecules and blocking by protein molecules (casein) onto the PtNP surface. The negative variation of zeta-potential can be attributed to the fact that casein (isoelectric point ~4.8) and antibodies (isoelectric point ~6.8) are negatively charged in pure water (pH ~7.0).
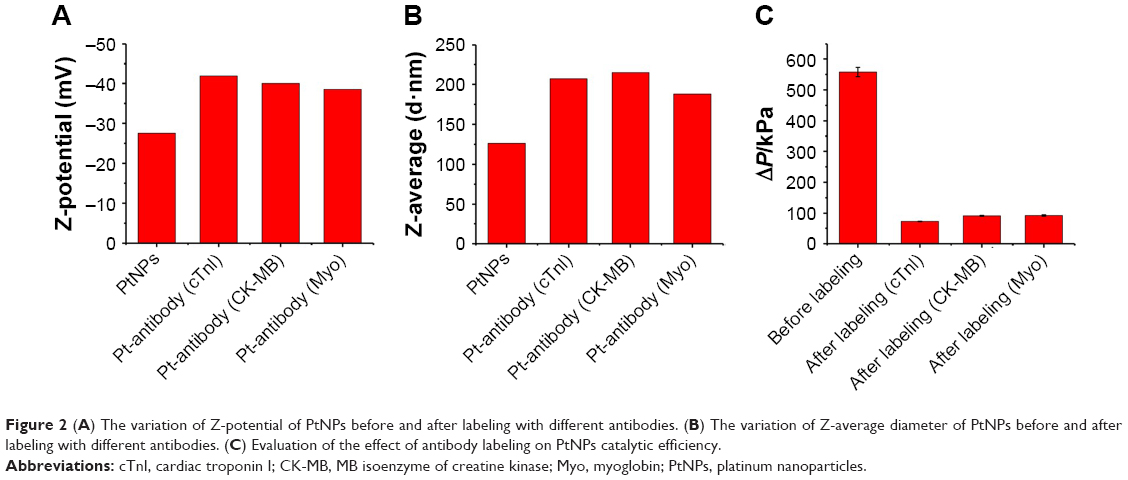 | Figure 2 (A) The variation of Z-potential of PtNPs before and after labeling with different antibodies. (B) The variation of Z-average diameter of PtNPs before and after labeling with different antibodies. (C) Evaluation of the effect of antibody labeling on PtNPs catalytic efficiency. |
To evaluate the influence of labeling process on PtNPs catalysis function, the catalysis efficiency of PtNPs before and after labeling with different biomarker antibodies was compared. The result is shown in Figure 2C. The catalysis efficiency of PtNPs labeled with cTnI, CK-MB, and Myo antibodies was found to significantly decrease by 86.9%, 83.6%, and 83.4% after labeling, which was speculated to be caused by the occupation of the catalytic site by antibody molecules, surface charge variation of PtNPs, and a decrease of specific surface area.
Evaluation of matrix effect
Compared with buffer solution, plasma contains much more complex compounds, which include a large amount of proteins, polysaccharides, ions, and even cells.32 The measurement of biomarker molecules in plasma is usually different from that obtained from buffer, due to an unpredictable non-specific absorption and molecular conformation variation under different environments. To minimize the measuring error caused by this kind of matrix effect, a gradient concentration of biomarker molecules was added into two different matrixes, including 10 mM PBS buffer and commercially available serum matrix. As the control group, a mixture of ten clinically determined low-level plasma samples (cTnI <0.01 ng/mL, CK-MB <0.5 ng/mL, and Myo <1 mg/mL) was used. The measuring results of three biomarkers in different matrixes were compared to choose the one showing the smallest matrix effect. As shown in Figure 3A–C, the cTnI added in serum matrix and plasma mixture showed similar concentration–pressure response, while much higher pressure response was observed in buffer samples. CK-MB added in serum matrix also showed the same result with low-level plasma samples, while the response of sample with CK-MB added in buffer was lower than the one added in matrix. However, no difference was found in three kinds of matrix analysis for Myo detection. This result was inferred to be caused by the contents, such as proteins, ions, or organic molecules, in serum matrix and plasma. These molecules may compete with antigen or lead to a non-specific absorption to magnetic beads and PtNP surface to decrease antibody-antigen binding efficiency, thus resulting in a lower measuring value (similar to what happened in CK-MB assay). On the other hand, some conditions, like pH and different types of ions or ion strength in serum matrix and plasma, might increase the antibody binding efficiency, causing a higher measuring result (similar to what happened in cTnI assay). However, when the biomarker molecule was stable enough and was rarely affected by the solution environment, there will be no significant difference in the results obtained from different types of matrix (similar to what happened in Myo assay). To minimize the measuring error caused by matrix effect, commercial serum matrix was chosen to dilute the biomarkers to build standard curve for further applications.
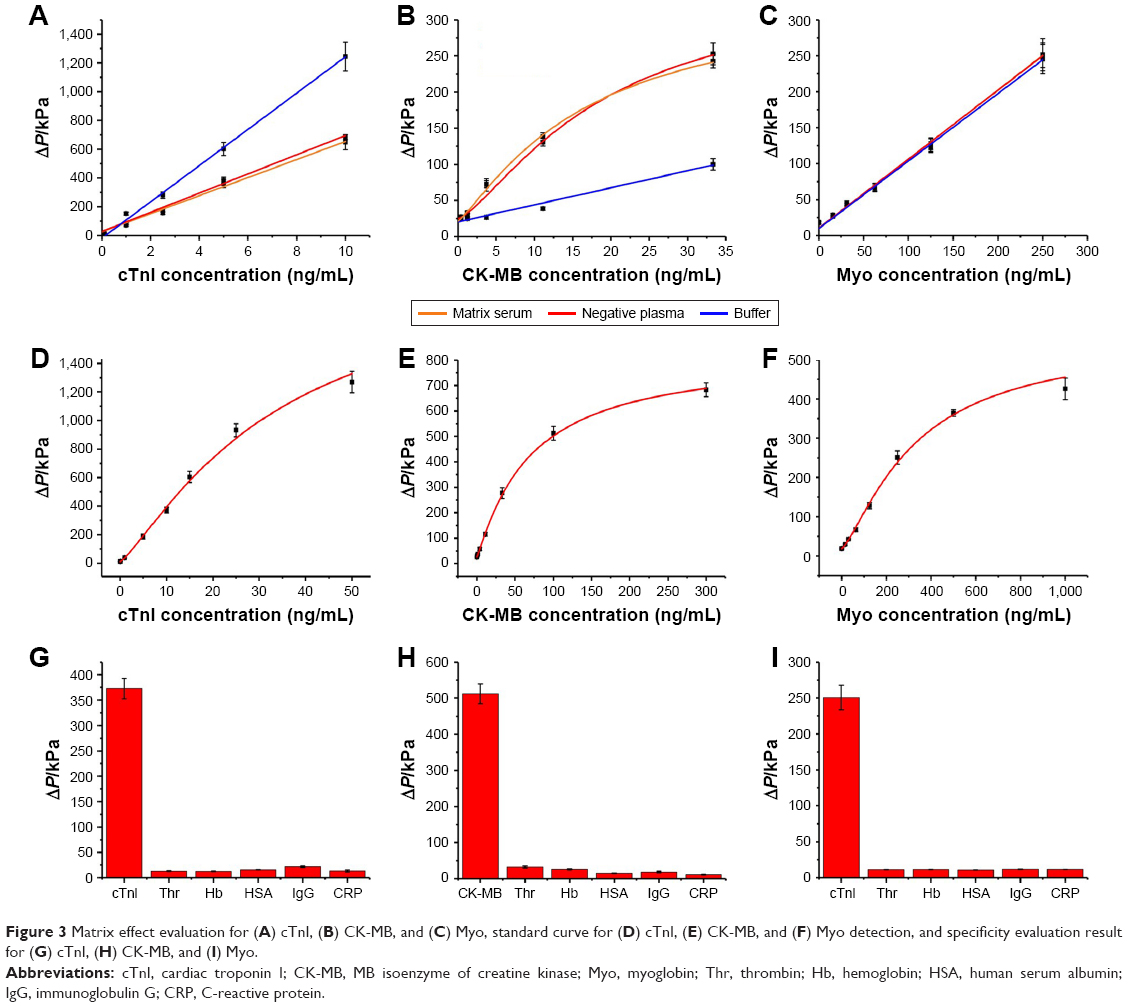 | Figure 3 Matrix effect evaluation for (A) cTnI, (B) CK-MB, and (C) Myo, standard curve for (D) cTnI, (E) CK-MB, and (F) Myo detection, and specificity evaluation result for (G) cTnI, (H) CK-MB, and (I) Myo. |
Standard curves of three AMI biomarkers
Serum matrix solution added with different concentrations of cTnI, CK-MB, or Myo was evaluated with the developed assay as the steps described in the Materials and methods section. The resulting standard curves for three biomarkers are shown in Figure 3D–F. The pressure value for cTnI showed a good linear relationship with antigen concentration in the range from 0 to 25 ng/mL (Figure S3A), with a LOD of 0.014 ng/mL, consistent with the sensitivity of currently available cTnI diagnosis approaches.22 The increasing tendency of pressure variation value declining when cTnI concentration was further increased after 20 ng/mL, which was mainly caused by the saturation of antibody binding sites on the magnetic beads. The linear range for pressure response value to CK-MB concentration and Myo concentration was found to be 0–33 ng/mL (Figure S3B) and 0–250 ng/mL (Figure S3C), with LOD of 0.16 ng/mL and 0.85 ng/mL, respectively, and the decrease of pressure variation value in the same slope was found when biomarker concentration increased higher than about 75 ng/mL and 400 ng/mL for CK-MB and Myo, respectively. All the coefficient values of variation for each concentration of the three biomarkers were determined to be smaller than 10%, demonstrating a good repeatability of SPDS.
To increase the quantitative accuracy, logistic regression with four variants was used to build a standard curve formula. The logistic regression formula is given by formula 1 as follows:
|
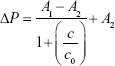
In formula 1, A1, A2, c0, and n are parameters obtained by logistic fitting, ΔP is pressure variation value obtained by pressure measuring device, and c is biomarker concentration in samples.
The values for four variants were fitted by Origin software, and the fitting results for cTnI, CK-MB, and Myo are given by formula 2, formula 3, and formula 4, respectively:
|
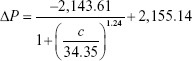
|
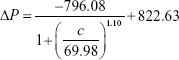
|
The fitting results were transferred into the smartphone App for further sample detection and data calculation to translate pressure signal into concentration value.
According to the built standard curves, SPDS had shown a higher sensitivity and accuracy (with CV% smaller than 10% for different biomarker concentrations) than most POCT products like LICA (LOD equals about 0.1 ng/mL for cTnI, CV <15%) and comparable detection performance with CLIA (LOD equals about 0.02 ng/mL for cTnI, CV <15%). However, with much smaller device size and being more user-friendly, SPDS could be applied under highly unfavorable conditions, rather than CLIA.
Specificity evaluation of SPDS for three biomarkers
To investigate the specificity of SPDS for three biomarkers, some common proteins found in serum, including Thr, Hb, HSA, IgG, and a common inflammation biomarker CRP, were used as the negative controls. The results shown in Figure 3G–I indicate that the developed assays for three biomarkers had high specificity to these proteins commonly found in human blood. The results demonstrated that SPDS and developed reagents were highly specific to their biomarkers and were rarely affected by the common proteins present in real blood samples, which we consider is majorly contributed by high specificity of the chosen antibodies and well-developed nanoparticle coating procedure.
Clinical sample detection
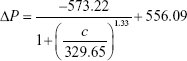
To estimate the performance of SPDS, 50 clinical samples, whose concentrations of cTnI, CK-MB, and Myo had been measured by CLIA, were tested by SPDS. The results of comparison are shown in Figure 4A, C, and E. The linear slopes of comparison for cTnI, CK-MB, and Myo were fitted as 1.049 (R2=0.9852), 0.9545 (R2=0.9852), and 0.998 (R2=0.9908), which demonstrated an excellent match between two different assays. To further analyze the correlation between the results of CLIA and SPDS, Bland–Altman analysis was performed.33 As shown in Figure 4B, D, and F, almost all of the compared samples were in the range of 95% CI, suggesting a good correlation between the developed assay and CLIA. Only 4/50, 3/50, and 1/50 samples for cTnI, CK-MB, and Myo were out of 95% CI range, which might be caused by biomarker proteolysis during sample storage.
 | Figure 4 Measuring result comparison between SPDS and CLIA: (A) correlation analysis for cTnI; (B) Bland–Altman analysis for cTnI detection; (C) correlation analysis for CK-MB; (D) Bland–Altman analysis for CK-MB detection; (E) correlation analysis for Myo; (F) Bland–Altman analysis for Myo detection. |
The clinical sample detection result demonstrated that SPDS rivaled CLIA in the detection performance for three biomarkers of AMI, and it has strong potential for clinical applications that need high sensitivity and accuracy instead of CLIA where a huge automatic device cannot be supported.
Conclusion
In summary, to satisfy the demand for a portable system with high detection sensitivity and accuracy for the applications of diagnosis under unfavorable environments and detection in wild situations, we developed SPDS to solve the problem that the currently available approaches or devices are facing. The catalytic efficiency was firstly optimized and matrix effect was minimized by using commercially available serum matrix, instead of buffer, to dilute biomarker molecules to build the standard curve. The detection performance and system reliability of SPDS were finally verified by comparing the measuring results for the three biomarkers of 50 clinical plasma samples obtained by SPDS and CLIA. Furthermore, though a small device, while not losing any sensitivity and accuracy, SPDS showed a good potential for POCT application and diagnosis under emergency, bacteria detection out of field, and poison detection at the military front.
Compared with the results reported for PASS, SPDS showed much better user-friendliness and reliability due to its integrated pressure measuring device, optimized pressure variation value measuring method, and the support of smartphone for data manipulation. SPDS can also measure eight samples simultaneously, which could significantly decrease the error caused by the tedious and unfriendly manipulation of the device in PASS which involves measuring the sample on one-by-one basis. SPDS has shown a bright prospect in clinical application.
However, we also have to admit that SPDS is still a half-automated system for AMI diagnosis and the manipulation for immune assay is still complicated. In the future work, we would convert the device into a totally automated system for POCT. Besides, we would attempt to further optimize PtNPs modification protocol to minimize the effect of modification on nanoparticle catalytic efficiency and further improve the sensitivity of SPDS.
Acknowledgments
We gratefully acknowledge the financial support from the National Natural Science Foundation of China (81772287, 81371902), the Natural Science Foundation of Fujian Province of China (2016J01643), and the Joint Project of Major Diseases in Xiamen City of China (3502Z20179044).
Disclosure
The authors report no conflicts of interest in this work.
References
Fox KA, Steg PG, Eagle KA, et al. Decline in rates of death and heart failure in acute coronary syndromes, 1999–2006. JAMA. 2007;297(17):1892–1900. doi:10.1001/jama.297.17.1892 | ||
White HD, Chew DP. Acute myocardial infarction. Lancet. 2008;372(9638):570–584. doi:10.1016/S0140-6736(08)61237-4 | ||
Reed GW, Rossi JE, Cannon CP. Acute myocardial infarction. Lancet. 2017;389(10065):197–210. doi:10.1016/S0140-6736(16)30677-8 | ||
Townsend N, Nichols M, Scarborough P, Rayner M. Cardiovascular disease in Europe: epidemiological update 2015. Eur Heart J. 2015;36(40):2696–2705. doi:10.1093/eurheartj/ehv428 | ||
Wang JC, Normand SL, Mauri L, Kuntz RE. Coronary artery spatial distribution of acute myocardial infarction occlusions. Circulation. 2004;110(3):278–284. doi:10.1161/01.CIR.0000135468.67850.F4 | ||
Jordanova N, Gyongyosi M, Khorsand A, et al. New cut-off values of cardiac markers for risk stratification of angina pectoris. Int J Cardiol. 2005;99(3):429–435. doi:10.1016/j.ijcard.2004.03.003 | ||
Lapointe-Shaw L, Bell CM. Acute myocardial infarction. BMJ. 2014;348:f7696. doi:10.1136/bmj.f7696 | ||
El-Sherif N, Denes P, Katz R, et al. Definition of the best prediction criteria of the time domain signal-averaged electrocardiogram for serious arrhythmic events in the postinfarction period. J Am Coll Cardiol. 1995;25(4):908–914. | ||
Davie AP, Love MP, McMurray JJ. Value of ECGs in identifying heart failure due to left ventricular systolic dysfunction. BMJ. 1996;313(7052):300–301. | ||
Brady WJ Jr, Aufderheide TP, Chan T, Perron AD. Electrocardiographic diagnosis of acute myocardial infarction. Emerg Med Clin. 2001;19(2):295–320. doi:10.1016/S0733-8627(05)70185-1 | ||
Dolci A, Panteghini M. The exciting story of cardiac biomarkers: from retrospective detection to gold diagnostic standard for acute myocardial infarction and more. Clin Chim Acta. 2006;369(2):179–187. doi:10.1016/j.cca.2006.02.042 | ||
Wu AH, Feng YJ, Contois JH, Pervaiz S. Comparison of myoglobin, creatine kinase-MB, and cardiac troponin I for diagnosis of acute myocardial infarction. Ann Clin Lab Sci. 1996;26(4):291–300. | ||
Eggers KM, Jaffe AS, Venge P, Lindahl B. Clinical implications of the change of cardiac troponin I levels in patients with acute chest pain-an evaluation with respect to the Universal Definition of Myocardial Infarction. Clin Chim Acta. 2011;412(1–2):91–97. doi:10.1016/j.cca.2010.09.020 | ||
Horowitz MB, Willet D, Keffer J. The use of cardiac troponin-I (cTnI) to determine the incidence of myocardial ischemia and injury in patients with aneurysmal and presumed aneurysmal subarachnoid hemorrhage. Acta Neurochir. 1998;140(1):87–93. | ||
Arenja N, Reichlin T, Drexler B, et al. Sensitive cardiac troponin in the diagnosis and risk stratification of acute heart failure. J Intern Med. 2012;271(6):598–607. doi:10.1111/j.1365-2796.2011.02469.x | ||
Hamm CW, Goldmann BU, Heeschen C, Kreymann G, Berger J, Meinertz T. Emergency room triage of patients with acute chest pain by means of rapid testing for cardiac troponin T or troponin I. N Eng J Med. 1997;337(23):1648–1653. doi:10.1056/NEJM199712043372302 | ||
Katus HA, Looser S, Hallermayer K, et al. Development and in vitro characterization of a new immunoassay of cardiac troponin T. Clin Chem. 1992;38(3):386–393. | ||
Saito T, Matsumoto H, Matsuyama H, et al. Clinical evaluation of the new creatine kinase MB reagent kit “L-System CK-MB MtO”. Rinsho Byori. Jpn J Clin Pathol. 2011;59(3):236–242. | ||
Robinson DJ, Christenson RH. Creatine kinase and its CK-MB isoenzyme: the conventional marker for the diagnosis of acute myocardial infarction. J Emerg Med. 1999;17(1):95–104. | ||
Kennedy RL, Harrison RF, Burton AM, et al. An artificial neural network system for diagnosis of acute myocardial infarction (AMI) in the accident and emergency department: evaluation and comparison with serum myoglobin measurements. Comput Meth Prog Biomed. 1997;52(2):93–103. doi:10.1016/S0169-2607(96)01782-8 | ||
Thygesen K, Alpert JS, Jaffe AS, et al. Third universal definition of myocardial infarction. Circulation. 2012;126(16):2020–2035. doi:10.1161/CIR.0b013e31826e1058 | ||
Fathil MFM, Arshad MKM, Gopinath SCB, et al. Diagnostics on acute myocardial infarction: cardiac troponin biomarkers. Biosens Bioelectron. 2015;70:209–220. doi:10.1016/j.bios.2015.03.037 | ||
Zhu Z, Guan ZC, Liu D, et al. Translating molecular recognition into a pressure signal to enable rapid, sensitive, and portable biomedical analysis. Angew Chem Int Ed. 2015;54(36):10448–10453. doi:10.1002/anie.201503963 | ||
Ji TH, Liu D, Liu F, et al. A pressure-based bioassay for the rapid, portable and quantitative detection of C-reactive protein. Chem Commun. 2016;52(54):8452–8454. doi:10.1039/C6CC03705D | ||
Liu D, Jia SS, Zhang HM, et al. Integrating target-responsive hydrogel with pressuremeter readout enables simple, sensitive, user-friendly, quantitative point-of-care testing. ACS Appl Mater Inter. 2017;9(27):22252–22258. doi:10.1021/acsami.7b05531 | ||
Lin B, Guan Z, Song Y, et al. Lateral flow assay with pressure meter readout for rapid point-of-care detection of disease-associated protein. Lab Chip. 2018;18(6):965–970. doi:10.1039/c8lc00010g | ||
Wang Y, Yang L, Li B, Yang CJ, Jin Y. Point-of-care assay of telomerase activity at single-cell level via gas pressure readout. Anal Chem. 2017;89(16):8311–8318. doi:10.1021/acs.analchem.7b01529 | ||
Ding E, Hai J, Li T, et al. Efficient Hydrogen-generation CuO/Co3O4 heterojunction nanofibers for sensitive detection of cancer cells by portable pressure meter. Anal Chem. 2017;89(15):8140–8147. doi:10.1021/acs.analchem.7b01951 | ||
Ran B, Xianyu Y, Dong M, Chen Y, Qian Z, Jiang X. Bioorthogonal reaction-mediated ELISA using peroxide test strip as signal readout for point-of-care testing. Anal Chem. 2017;89(11):6113–6119. doi:10.1021/acs.analchem.7b00831 | ||
Mitchell JR, Sharma P, Modi J, et al. A smartphone client-server teleradiology system for primary diagnosis of acute stroke. J Med Internet Res. 2011;13(2):e31. | ||
Hong JI, Chang BY. Development of the smartphone-based colorimetry for multi-analyte sensing arrays. Lab Chip. 2014;14(10):1725–1732. doi:10.1039/c3lc51451j | ||
Rai AJ, Vitzthum F. Effects of preanalytical variables on peptide and protein measurements in human serum and plasma: implications for clinical proteomics. Expert Rev Proteomics. 2006;3(4):409–426. doi:10.1586/14789450.3.4.409 | ||
Bland JM, Altman DG. Applying the right statistics: analyses of measurement studies. Ultrasound Obstet Gynecol. 2003;22(1):85–93. doi:10.1002/uog.122 |
Supplementary materials
 | Figure S1 Optimization result of H2O2 concentration. |
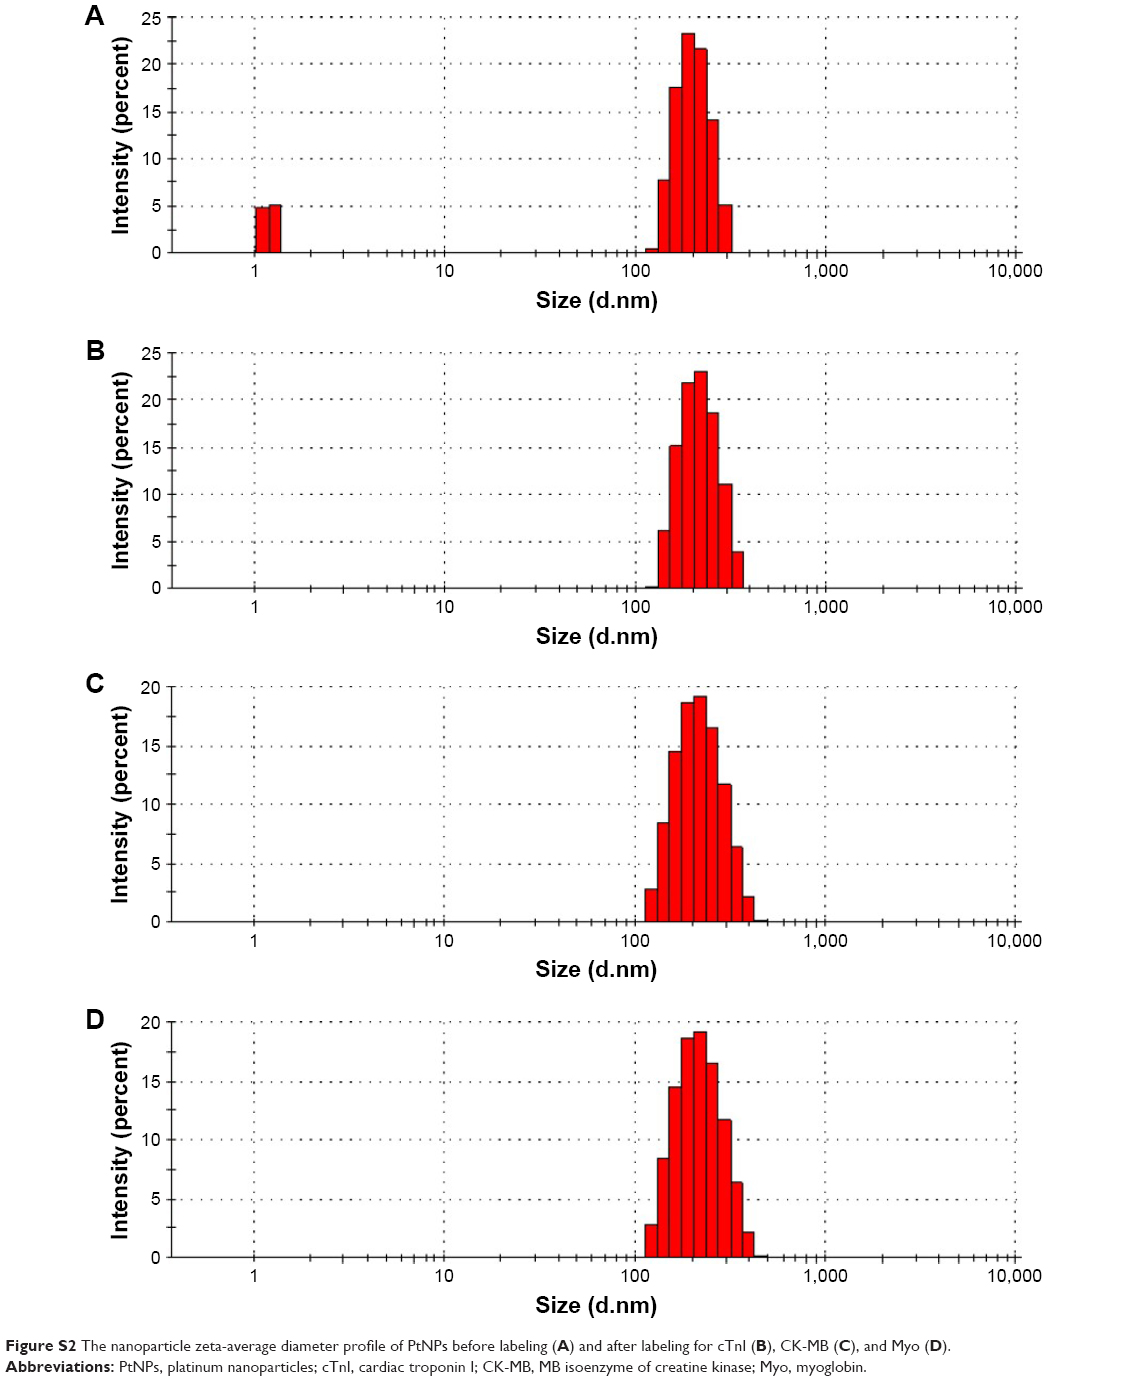 | Figure S2 The nanoparticle zeta-average diameter profile of PtNPs before labeling (A) and after labeling for cTnI (B), CK-MB (C), and Myo (D). |
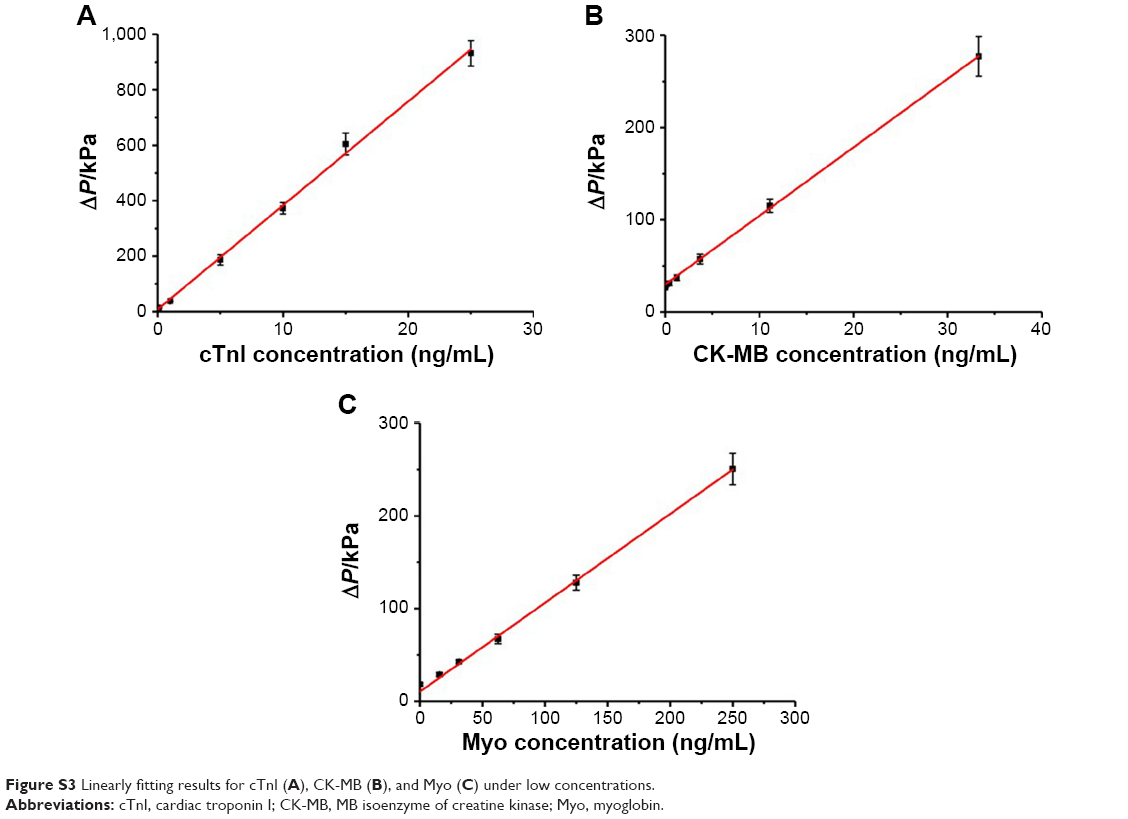 | Figure S3 Linearly fitting results for cTnI (A), CK-MB (B), and Myo (C) under low concentrations. |
 © 2019 The Author(s). This work is published and licensed by Dove Medical Press Limited. The full terms of this license are available at https://www.dovepress.com/terms.php and incorporate the Creative Commons Attribution - Non Commercial (unported, v3.0) License.
By accessing the work you hereby accept the Terms. Non-commercial uses of the work are permitted without any further permission from Dove Medical Press Limited, provided the work is properly attributed. For permission for commercial use of this work, please see paragraphs 4.2 and 5 of our Terms.
© 2019 The Author(s). This work is published and licensed by Dove Medical Press Limited. The full terms of this license are available at https://www.dovepress.com/terms.php and incorporate the Creative Commons Attribution - Non Commercial (unported, v3.0) License.
By accessing the work you hereby accept the Terms. Non-commercial uses of the work are permitted without any further permission from Dove Medical Press Limited, provided the work is properly attributed. For permission for commercial use of this work, please see paragraphs 4.2 and 5 of our Terms.