")
Back to Journals » Journal of Blood Medicine » Volume 11
A Single-Center Retrospective Study to Investigate the Follow-Up of Patients with Monoclonal Proteinemia by Community Physicians in the UK
Authors Ramasamy I
Received 25 March 2020
Accepted for publication 14 May 2020
Published 11 June 2020 Volume 2020:11 Pages 191—203
DOI https://doi.org/10.2147/JBM.S255390
Checked for plagiarism Yes
Review by Single anonymous peer review
Peer reviewer comments 2
Editor who approved publication: Dr Martin H Bluth
Indra Ramasamy
Department of Blood Sciences, Worcester Royal Hospital, Worcester WR5 1DD, Worcestershire, UK
Correspondence: Indra Ramasamy
Department of Blood Sciences, Worcester Royal Hospital, Charles Hastings Way, Worcester WR5 1DD, Worcestershire, UK
Email [email protected]
Background: We determined the detection rate of monoclonal gammopathy of undetermined significance (MGUS) and follow-up of MGUS patients in a center that uses reflex testing at globulin levels outside the reference range as part of its routine service to detect monoclonal protein (M-protein). We recorded the natural history and follow-up of these patients. This is one of the first reports on the diagnosis and follow-up of MGUS patients within the UK.
Patients and Methods: A total of 163 patients diagnosed in 2006 and 393 patients with M-protein on long-term follow-up in 2006 were followed over a period of 10 years (y) by community physicians with laboratory support.
Results: In 2006, newly diagnosed patients with an M-protein and total number of patients as a percentage of the Worcestershire population were, respectively, 0.025%, 0.045% (at 45– 49y); 0.1%, 0.25% (at 60– 64y); and 0.26%, 1.12% (at 75– 79y). Patients with M-protein had a survival of 35.5% at 10 y and 43.5% at > 10y follow-up. Kaplan–Meier analysis of patients with an M-protein showed that lymphoplasma-cell proliferative disorders (LPD)-free survival was 91% for both 10y and > 10y follow-up. LPD-free survival decreased to approximately 73% when competing causes (death due to unrelated causes, transient M-protein, loss to follow-up) were censored. Progression to LPD occurred at initial M-protein values of 3g/L at diagnosis. During follow-up, 38.3% died without evidence of LPD, 12% were diagnosed with transient M-protein, 8.7% developed LPD, 10.9% had stable M-protein, 4.9% showed increasing M-protein, and 25.2% were lost to follow-up. Survival curves showed that M-protein isotype contributed to LPD-free survival in the order IgG=IgM>IgA>biclonal M-protein.
Conclusion: Geographical variations in the diagnosis and follow-up of MGUS patients in the UK need investigation. From public health viewpoint, it is essential to determine MGUS follow-up to improve clinical care and individualise risk-based follow-up of patients.
Keywords: MGUS, monoclonal gammopathy of undetermined significance, MGUS progression, MGUS follow-up, community physician
Background
Multiple myeloma (MM) is a clonal plasma cell malignancy that accounts for approximately 2% of all malignancies. The annual incidence, age adjusted to the 2015 United Kingdom population was 9.3 per 100,000 resulting in 5540 cases per year. There was a slight male predominance.1
Two articles provide evidence that all MM are preceded by monoclonal gammopathy of undetermined significance (MGUS).2,3 MGUS is characterised by the presence of monoclonal protein (M-protein) lower than 30 g/L, the presence of fewer than 10% plasma cells in the bone-marrow and the absence of end-organ damage such as hypercalcemia, renal insufficiency and bone lesion.4
A systematic review of 14 studies suggested that crude prevalence of MGUS in those older than 50 years is 3.2% in a predominantly white population. MGUS is higher in black people (5.9–8.4%) than in white people.5 The study by Kyle et al6 found the prevalence of MGUS in Olmsted County, Minnesota, USA to be 4 fold higher in those older than 80 years (6.6%) compared with those aged 50 to 59 years (1.7%). The true prevalence of MGUS has not been estimated accurately, as prevalence estimates from studies were restricted to specific geographic areas or hospital populations and did not use sensitive electrophoretic methods.5
Studies in Olmsted County have reported the occurrence of axial fractures is significantly increased in MGUS even in the absence of progression to MM.7 Other studies have shown that MGUS is a risk factor for fracture.8–10 Studies have suggested that MGUS is associated with increased risk of arterial and venous thrombosis.11–13 MGUS can cause monoclonal gammopathy of renal significance, a spectrum of renal disease that includes AL amyloidosis and proliferative glomerulonephritis with monoclonal immunoglobulin (Ig) deposits.14 MGUS can be associated with peripheral neuropathy.15 The management of these B-cell related disorders may need early intervention and a new concept of monoclonal gammopathy of clinical significance (MGCS) has been suggested.16
Reported rates of progression of MGUS to myeloma vary and there are a limited number of studies on the risk of MGUS progression to MM in select population groups. Further, MGUS patients appear to undergo inadequate work-up, follow-up and treatment in a community setting.17 Guidelines suggest that serum protein electrophoresis (SPEP) should be performed if there is clinical suspicion of an M-protein-related disorder, raised total protein/globulin or immunoglobulins, particularly if one or more immunoglobulin classes (IgG, IgA, IgM) are reduced.18
Despite advances in novel therapies for MM and improved understanding of health outcomes associated with MGUS, the value of reflex testing protein electrophoresis in patients with high serum globulin values remains controversial. Most studies on MGUS patient follow-up were carried out in the USA with landmark studies in Minnesota.6 We report on that seen in a real-world situation when screening for M-protein is carried out using serum samples, with globulin levels outside the reference range, is sent to the laboratory for analysis. Follow-up of patients with M-protein is carried out by community physicians. This is the first study to report on screening for patients with M-protein and patient follow-up by community physicians to be reported from the UK.
In South Worcestershire, UK, protein electrophoresis is carried out in patients with globulin values outside the reference range as a screening test for M-protein and MM. From the year 1977, protein electrophoresis was reflex tested in all patient samples with high globulin values, analysed in the laboratory.19 Reflex testing was part of the service offered by the laboratory, which in addition carried out SPEP requested through routine clinical care. We report on the natural history and follow-up of two cohorts of patients, those diagnosed in 2006 and followed up for a period of 10 years and those diagnosed prior to 2006 and followed for a period of greater than 10 years to evaluate if progression to LPD differs during the first years following diagnosis.20
Patients and Methods
In Worcester protein electrophoresis was carried out in samples sent for analysis to the laboratory when serum globulin (total protein-albumin) levels were ≤ 17 g/L and ≥37 g/L as part of the laboratory’s role in screening and diagnosis of MGUS and MM. Screening at values ≤ 17g/L was carried out as immunoparesis may suggest the presence of light chain myeloma. The screening service was started in 1977 (19). Laboratory reference range for serum globulin ranged from 17-37 g/L. Serum globulin levels were measured as part of liver function test in patient samples analysed from hospital inpatient, outpatient clinics and community general practice. Reflex testing of protein electrophoresis was not restricted to a single discipline but was carried out on all serum samples sent for total protein and albumin. Serum albumin and total protein were measured as part of the liver function test, which included in addition the liver enzymes, alkaline phosphatase, gamma glutamyl transferase and alanine transaminase. Further, SPEP was also carried out if requested by clinicians, as part of routine clinical care, the latter were not based on serum globulin levels. As part of the service the laboratory advised on MGUS testing interval guidelines. The patients were followed from 1st April 2006 to 1st April 2016, a period of 10 years. The current laboratory information management system was introduced in April 2006 and the study was started and initiated from that date. The cohorts diagnosed prior to April 2006 (and followed for a period of 10 years or more) and those diagnosed during 2006 (and followed for a period of 10 years)were analysed separately. Patient follow-up was carried out as part of service evaluation of the protein electrophoresis routine service as required by National Health Service, UK (21). The evaluation followed strict internal quality assurance protocols. All patient data were analysed and patient confidentiality maintained in accordance with NHS data protection policy (22) and the Declaration of Helsinki.
Between April 2006 and April 2007 a total 9636 protein electrophoresis was carried out, of these approximately 55% were reflex tested based on abnormal serum globulin levels. Protein electrophoresis and immunofixation was carried out in 2006 using the Hydragel (Sebia UK). In 2011 the analytical method for detection, typing and quantitation of monoclonal protein (M-protein) was changed to capillary electrophoresis and immunosubtraction using the Capillarys (Sebia UK). Total protein was measured using the biuret method and albumin using the bromocresol green method (Roche, UK). Other laboratory parameters measured in patients with an M-protein were complete blood count, renal function, serum calcium and quantitation of immunoglobulins. The diagnostic criteria for MGUS was M-protein <30 g/L, <10% plasma cells in the bone marrow, absence of bone lytic lesions, anemia, hypercalcemia and renal insufficiency unless these could be attributed to other causes than plasma cell dyscrasias. In accordance with clinical practice bone marrow examination was deemed unnecessary unless the clinical index of suspicion was high. As a result bone marrow and skeletal survey results were not available in all patients and MGUS diagnosis was based on M-protein value, complete blood count, renal function and bone profile (calcium, phosphate, albumin and alkaline phosphatase in serum). The absence of bone marrow aspirate at the start of the study meant there was an uncertainty that asymptomatic LPD was present at baseline. These patients would have progressed to LPD at an earlier point in time during the follow-up period.
During April 2006 to March 2007, 163 patients were newly diagnosed with an M-protein, 36 patients were on long term follow-up at intervals of 6 months, and 357 patients on long term follow-up at intervals of 12 months. Of the 163 patients, detected with an M-protein in 2006, 23 were detected by non-reflex testing i.e.SPEP was carried out as a result of clinician request. Approximately 14.1% of the M-protein patientswere detected following requests through routine clinical care. The UK provides universal health care through the National Health Service. Patients with LPD are typically followed by hospital based hematologists. In Worcester, patients with M-protein who are asymptomatic at diagnosis are followed up by community based clinicians. Patients referred to hospital based hematologists because of clinical/biochemical concerns of LPDor complications of LPD, at diagnosis, were not included in the study. The latter patients were excluded as they were followed up by hospital based clinical hematologists and the study is based on patients with M-protein monitored by community based general practitioners. The current analysis covers 10 y clinical follow-up of the 163 patients newly diagnosed with M-protein during the period 2006-2007, and 393patients on long term follow-up during 2006 (36 on follow up for 6 months and 357 on long term follow up for 12 months). Follow-up of these patients was at the direction of community general practitioners with advice by the laboratory on testing intervals. Testing intervals were advised as a follow-up period of 3 months following detection of the M-protein. If there was no change in patient status at 3 months, patient follow-up was advised at 6 or 12 monthly intervals. If patients were not followed up at the appropriate time a letter was written to the community medical practitioner. From 2011, the laboratory initiated SPEP, renal function and bone profile if other laboratory tests were requested on serum samples from patients with M-protein who had no follow-up for a period of 6 months. The primary end point of the study was progression to LPD. Investigation for further progression to myeloma was based on increasing values in M-protein, development of hypercalcemia, anemia, decrease in renal function of unknown cause and clinical symptoms (bone pain, increased infection, and lytic lesions in the bone) developed. In the UK, a community physician who detects progression to malignancy in a patient with M-protein will refer the patient to a hematology specialist in a hospital center for further investigation and treatment. Referral to hospital based specialist care was based on the development of clinical symptoms, changes in biochemistry or complete blood count data and was at the request of the community medical practitioner. Diagnosis of myeloma was based on bone marrow biopsy and plasma cells >10% in the bone marrow.Clinical details of patients were obtained by review of each patient’s inpatient and outpatient medical records.
Statistical analysis
The end points with respect to progression to LPD or death was calculated with the use of Kaplan-Meier estimate using GraphPad Prism software. Prism uses log-rank (Mantel-Cox) test to compare two survival curves. Hazard ratios to compare slopes of survival curves were calculated by Prism based on the log-rank method. (https://www.graphpad.com/).The age specific detection and follow-up rate of patients with M-protein was calculated using the mid-2006 South (S) Worcestershire population data from the Office of National Statistics, UK.
Results
Patient demographics and baseline characteristics at the start of the study (April 2006)
The median age of the 163 patients diagnosed with M-protein during the period April 2006 to March 2007 was 75 years (range 36–99), 87 patients were male and 76 were female. The average concentration of the M-protein was 7.4 g/L (range 1–41), creatinine 119.6 µmoll/L (range 3–633), haemoglobin 12.1 g/dl. (range 6.1–16.7). The median age of 393 patients on long term follow-up was 77 years (range 36–98), 215 patients were male and 178 were female. The average concentration of the M-protein was 7.1 g/L (range 0–46), creatinine 104 µmoll/L (range 36–743) and haemoglobin 12.9 g/dl. (range 7.6–18.1). The distribution of M-protein at detection, from April 2006 to March 2007, according to globulin levels are given in Figure 1. Of the 163 patients with newly diagnosed M-protein, 44% were diagnosed at globulin levels in the range 35–39g/L, 8.2% of this cohort progressed to LPD. Twenty-five percent of patients with M-protein were diagnosed at globulin levels of 40–44 g/L, 5% progressed to LPD.
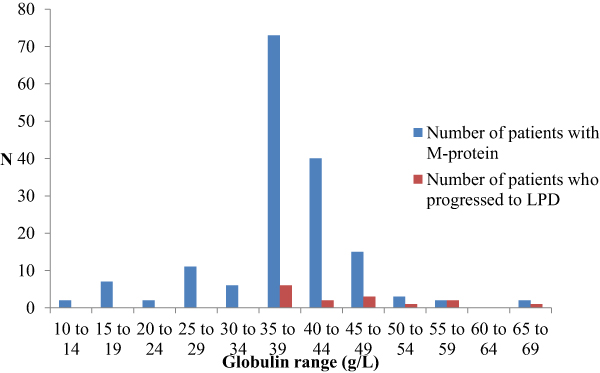 |
Figure 1 M-protein distribution according to globulin levels at detection. |
Distribution of M-protein according to age for patients diagnosed in 2006 and for patient diagnosed prior to 2006 is shown in Figure 2. The number of new patients with M-protein detected in 2006 in the laboratory which included reflex testing of SPEP at high globulin values increased with age and was 0.009% (as a percentage of the total population in S. Worcestershire) at 35–39 years (y), 0.025% at 45–49 y, 0.033% at 55–59 y, 0.1% at 60–64y, 0.18% at 70–74 y, 0.26% at 75–79y and 0.6% at 90–100 y. The total number of patients monitored by community physicians increased with age and was 0.02% at 35–39 y, 0.05% at 45–49 y, 0.14% at 55–59 y, 0.25% at 60–64y, 0.66% at 70–74 y, 1.12% at 75–79y, 0.97% at 80–84 y and 1.7% at 85–89 y. The total number of patients with M-protein followed up by community physicians was 0.3% of the 172,900 residents of South Worcestershire, 35 years or older.
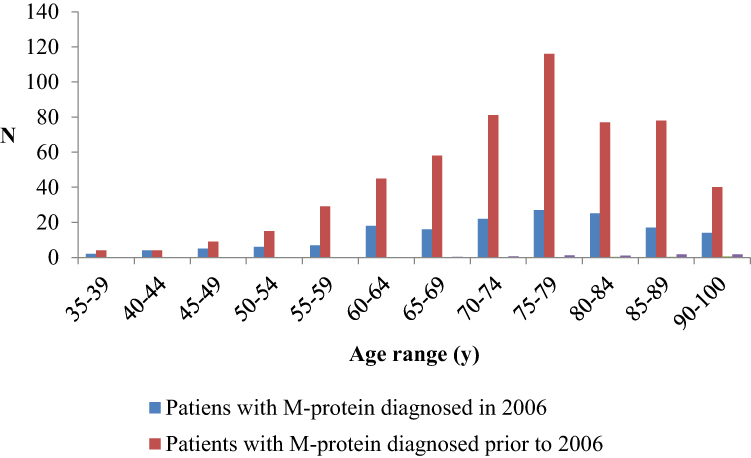 |
Figure 2 Distribution of patients with M-protein according to age. N=number patients with M-protein. |
Patient cohort was divided into those who were on long term follow-up at the start of the study (>10y) and those diagnosed at the start of the study (April 2006). The two cohorts were analysed separately for demography, survival and LPD-free survival. However, total survival and loss to follow-up are also given in combination for both cohorts. Progression to LPD depending on immunoglobulin isotype is given by combining both cohorts to increase the number of patients in each subgroup.
The distribution of immunoglobulin isotype among patients is shown in Figure 3. When both cohorts were combined, sixty-eight percent had M-protein with IgG isotype, 17% with an IgM isotype, 8% an IgA isotype and 5% were biclonal (two different types of M-protein). One 81 y old male with a serum free kappa light chains (determined by immunofixation) in serum, followed up by community physicians, died within a year of start of the study.
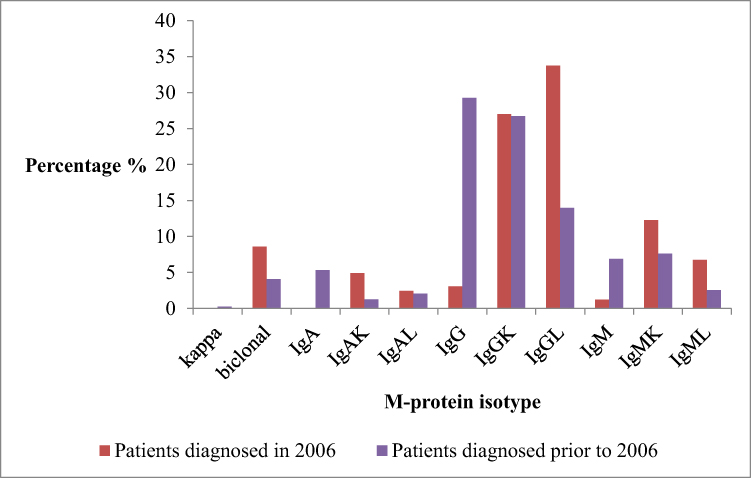 |
Figure 3 M-protein distribution according to immunoglobulin isotype. |
Progression to Lymphoplasma-Cell Proliferative Disorders
The 163 patients diagnosed in 2006–2007 were followed for a total of 797 person years (median 4y, range 0–10). Three hundred and ninety-three patients diagnosed prior to 2006 were followed for a total of 2328 person years (median 7.3y, range 1–10). Progression and follow-up times were calculated from the start of the study, April 2006. Of the 556 patients (when both cohorts were combined) in the study, during the study, 38.3% died without evidence of LPD, 25.2% were lost to follow-up and 12.0% diagnosed with transient M-protein. Of the patients lost to follow-up, 38% died of unrelated causes. Of the 556 patients 10.9% had stable M-protein, 4.9% showed increasing M-protein values and 8.7% developed lymphoplasma-cell proliferative disorders. During follow-up lymphoplasma-cell proliferative disorders developed in 48 patients (Table 1).
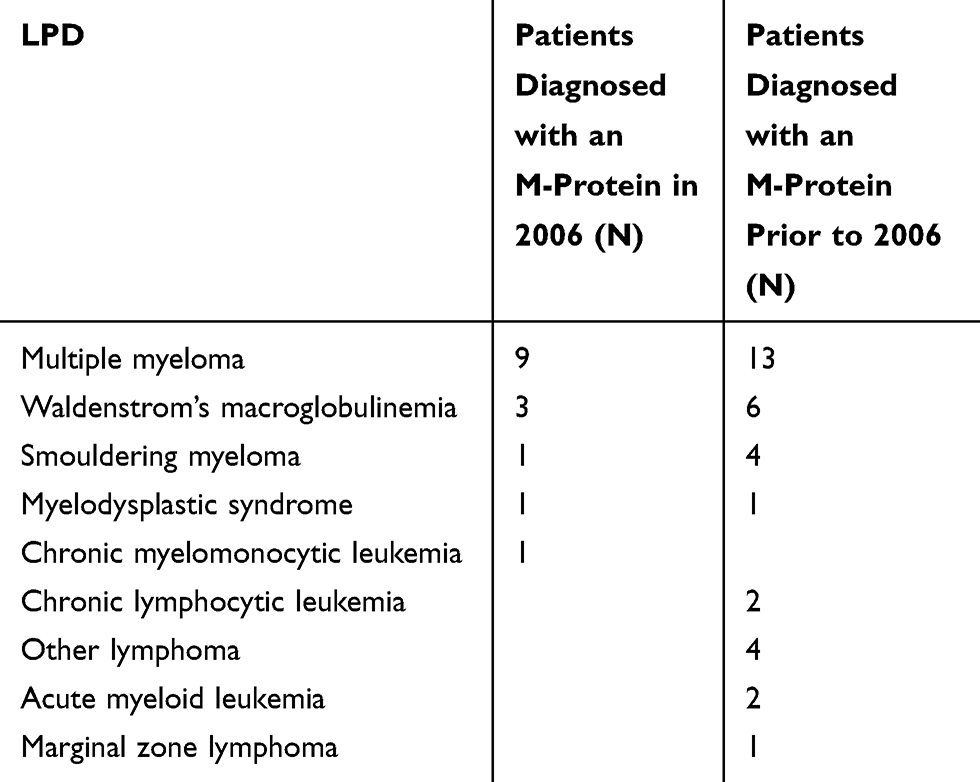 |
Table 1 Type of Progression During 10-Year Follow-Up |
The cumulative survival of patients with M-protein diagnosed in 2006 is compared with patients diagnosed prior to 2006 (Figure 4). The comparison showed a slightly lower survival rate for patients diagnosed during 2006 (35.5% to 43.5%, ρ<0.002, HR=1.462 (1.18–1.95)). The graph suggests increasing risk of mortality during the first year of follow-up for patients diagnosed during 2006, this was attributed to death due to factors other than LPD.
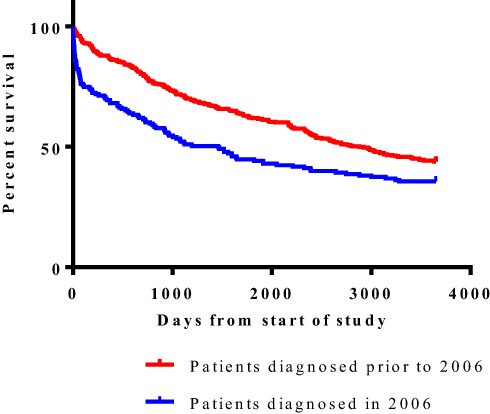 |
Figure 4 Survival curves of patients diagnosed with M-protein. |
Three patients diagnosed during the 10-year follow-up and 2 patients diagnosed prior to 2006 with an M-protein greater than 30 g/L were under the care of community physicians. Four of the patients were referred to hospital-based hematology specialists and diagnosed with MM within a year of start of the study, April 2006. One 86 y old patient monitored by community general physicians was not followed up after September 2006. A total of 12 patients with M-protein values between 20 and 29 g/L were monitored by community physicians. Patient characteristics are given in Table 2. Progression during the 10-year follow-up period according to initial M-protein value at the beginning of the study is summarised in Figure 5A and B. Case progression occurred in patients with an initial M-protein concentrations from 3 g/L. Progression of MGUS to myeloma is illustrated in two case studies in the Supplementary materials section. Both cases illustrate the continued risk of progression at long term follow-up.
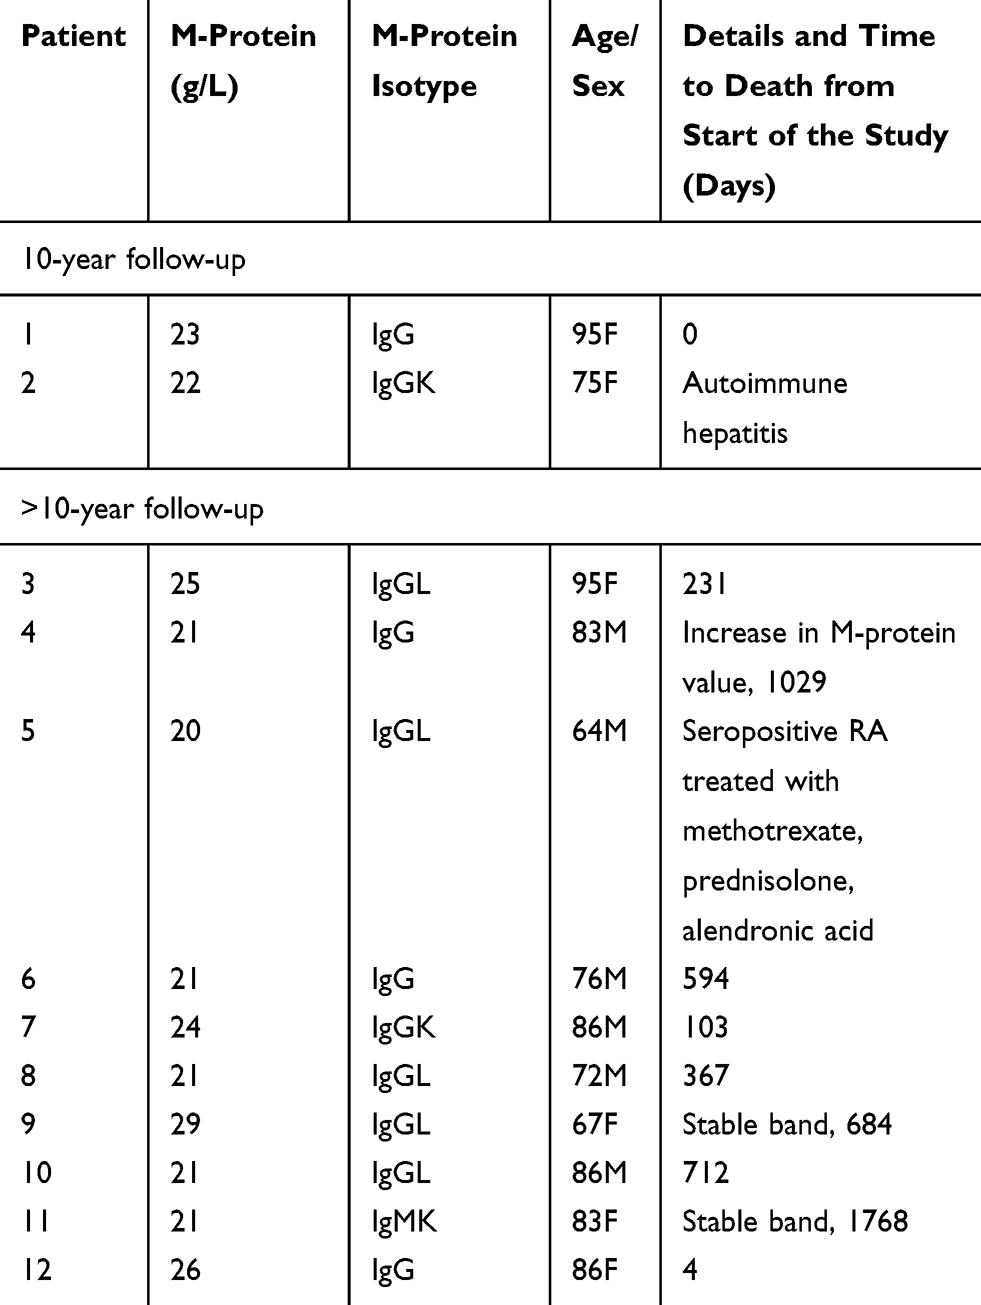 |
Table 2 Details of Patients with M-Protein in the Range 20–29g/L Monitored by Community Physicians |
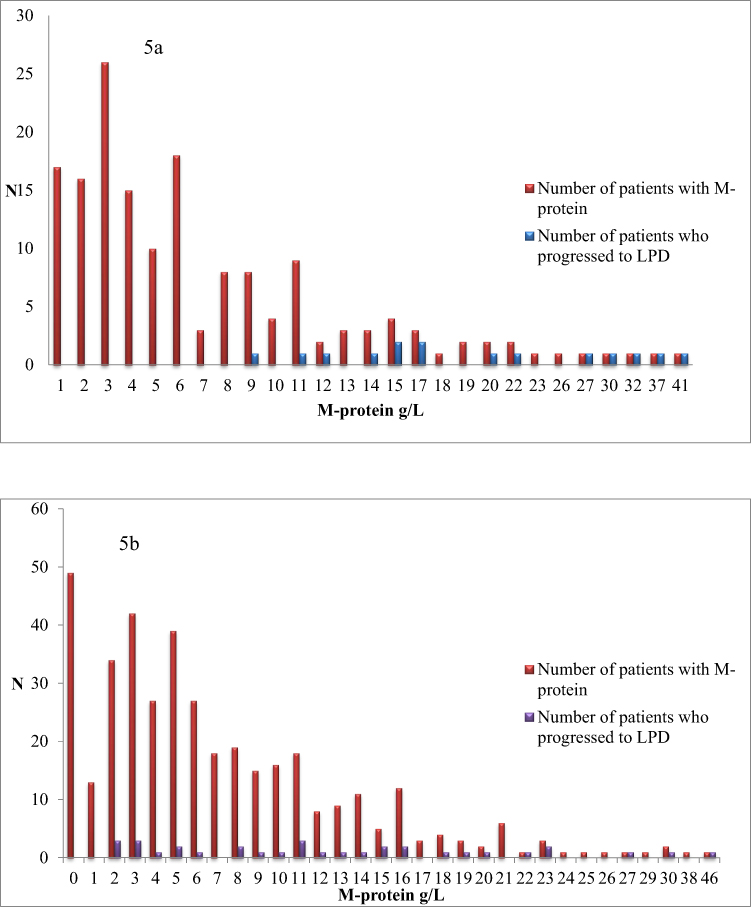 |
Figure 5 (A) Patients diagnosed during 2006. Progression to LPD according to M-protein value at diagnosis. (B) Patients diagnosed prior to 2006. Progression to LPD according to M-protein value at start of study. |
Overall LPD-Free Survival
Figure 6A and B shows the LPD-free survival curves with and without censoring subjects for competing causes (death due to causes other than LPD, patients lost to follow-up and transient M-protein). The risk of progression to LPD did not differ between patients followed for 10 years and those followed for a period >10 years (90.8% LPD-free survival at 10 years and 91.6% at a period >10 years). LPD-free survival when death due to causes other than LPD, transient M-protein and loss to follow-up were censored was 72.9% at 10-year follow-up and 78.6% at follow-up greater than 10 years. Overall LPD-free survival was significantly lower (p<0.02) when competing causes were censored in the Kaplan–Meier plot.
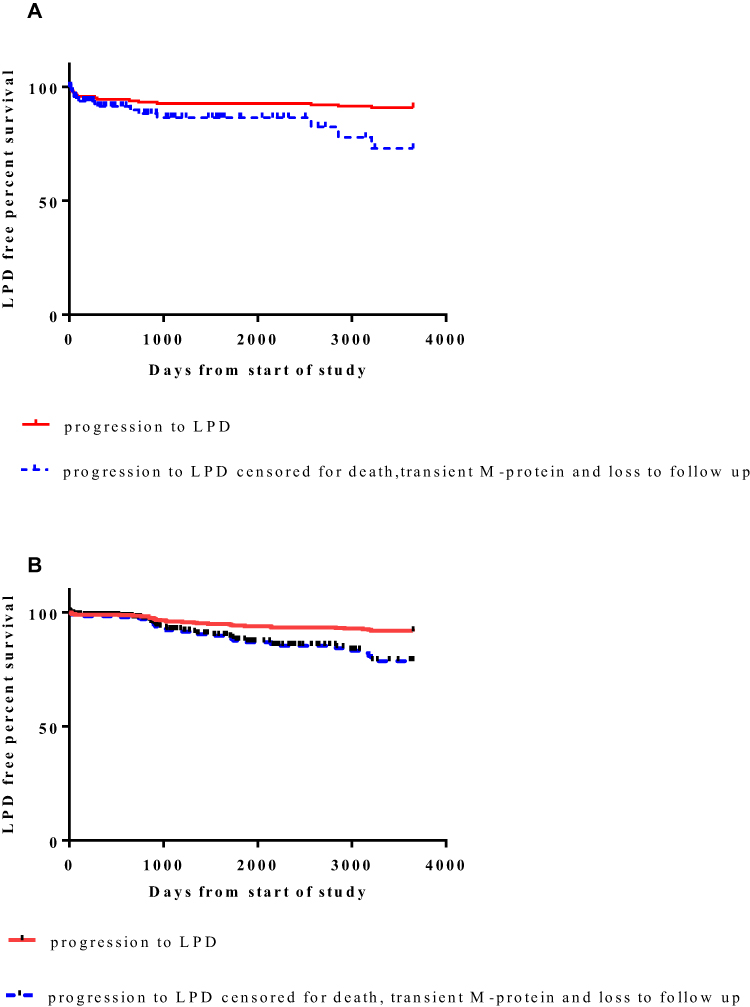 |
Figure 6 (A) LPD-free survival curves for patients diagnosed with an M-protein in 2006. (B) LPD-free survival curve for patients diagnosed with an M-protein prior to 2006. |
Analysis According to Immunoglobulin Group
The baseline characteristics of patients, when both cohorts were combined, according to M-protein immunoglobulin isotype is given in Table 3. The percentage of patients who developed LPD over a period of 10 years for IgG MGUS: 6.8%, IgM MGUS: 8.8%. IgA MGUS was 15.2% and biclonal MGUS: 23.7%. The LPD-free survival for each individual immunoglobulin isotypes when competing causes, death due to unrelated events, loss to follow-up or transient M-protein were censored is shown in Figure 7. Overall LPD-free survival was significantly lower for patients with biclonal M-protein (ρ<0.003, HR=4.433 (3.812–93.02)) and IgA M-protein (ρ<0.06, HR=2.197 (0.97–8.62)) when compared to IgG MGUS patients. When patients with IgM M-protein were considered LPD-free survival was similar to patients with an IgG M-protein (ρ>0.3, HR=1.455 (0.66–3.5)). However, the slopes of the survival curves suggested that the risk of progression was higher for IgM MGUS patients.
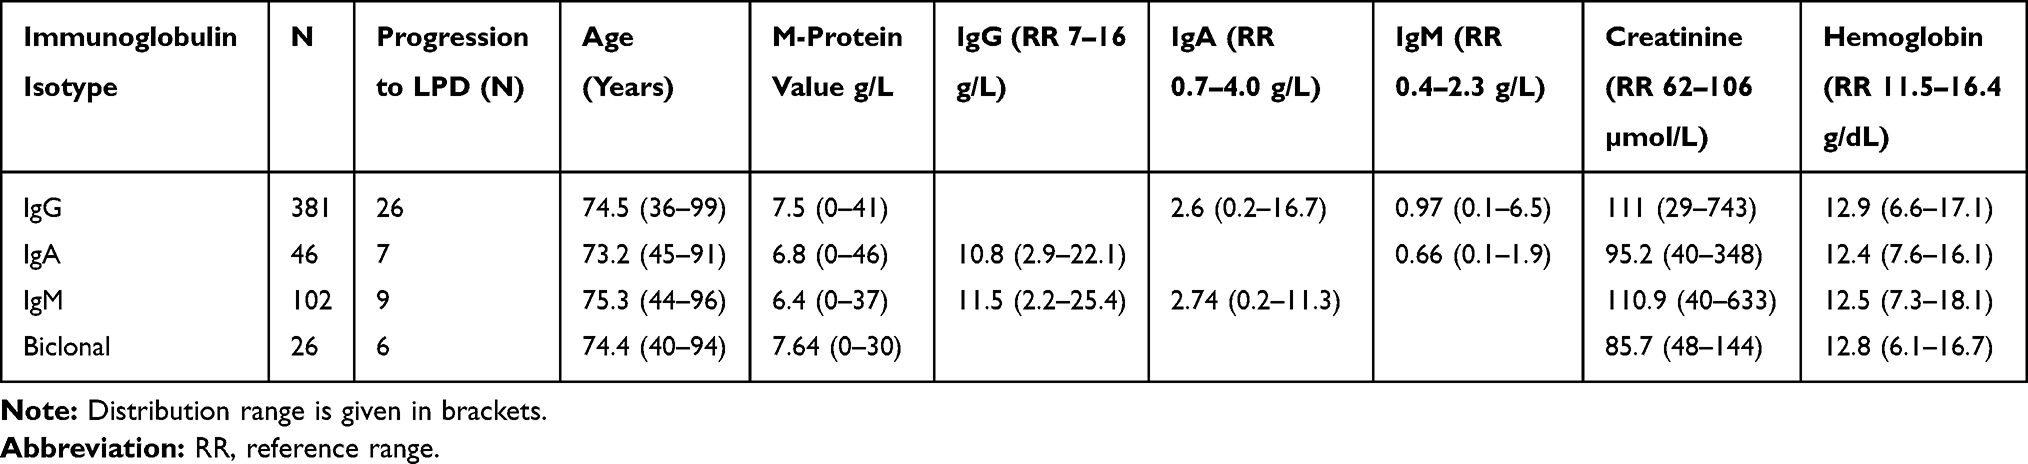 |
Table 3 Characteristics of Patients in Type-Specific Immunoglobulin Groups in April 2006 |
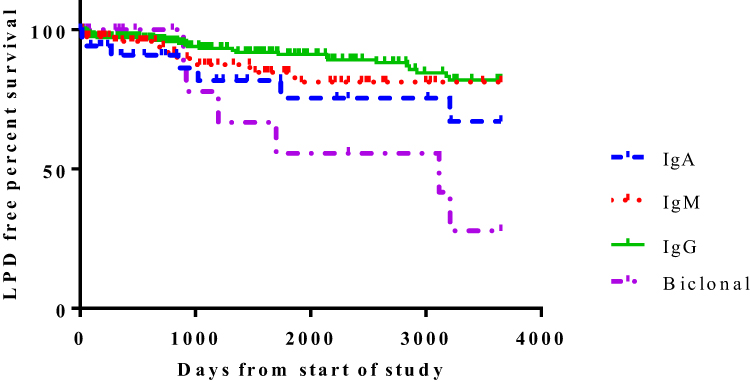 |
Figure 7 LPD-free survival curve according to subtype of MGUS. |
Discussion
Clinical guidelines recommend screening at high serum globulin values for M-protein and follow-up of patients with MGUS, but evidence supporting this practice is lacking. This study describes the use of screening for M-protein using serum globulin values as part of the routine SPEP service, and the clinical follow-up of M-protein patients by community physicians. Routine screening of serum samples sent to the laboratory for analysis may serve as an alternative to population screening for MGUS. It is now known that MGUS precedes all cases of M-protein associated malignancy.2,3 The study suggests the M-protein is found in serum globulin values within the reference range. The optimal serum globulin levels for the detection of M-protein remain to be determined. Our study suggests that a cut-off at the upper reference limit for serum globulin was associated with significant detection of patients with M-protein who developed malignant transformation. M-protein was identified in 3.2% of the 21,463 residents of Olmsted County, Minnesota, 50 years of age or older.6 If the prevalence of M-protein is similar in Worcestershire, about 10% of the 172,900 residents, 35 years or older, with M-protein, were identified following screening of samples sent for analysis in the laboratory. The study suggests that the prevalence of M-protein as determined by population screening identifies more patients with M-protein than reflex testing at high globulin levels. In this study the prevalence of M-protein identified by routine screening was higher in men than in women. A finding corroborated by other studies.23 Previous studies suggest that only 21% of 70-year-old patients with MGUS have been recognised during routine clinical practice in a large population-based cohort. At the time of clinical recognition the median duration of the patient’s MGUS was estimated to be 11 years.24 A true detection of all patients with MGUS would require serial sampling of the S. Worcestershire population and this is not feasible at present. The current practice of screening patients for M-protein at serum globulin values greater than the upper reference range was considered a practical alternative.
The most common immunoglobulin type in M-protein identified in this study was IgG (two-thirds of cases). This finding is similar to a study in the USA6 and in France.25 IgM MGUS was found in 17% of our patients and in the American study6 and in 24% of patients in the French study25 suggesting geographical differences in MGUS immunoglobulin isotype distribution.
Prior studies have shown that patients with MGUS are at increased risk of progression or death compared to an age-matched control population.26 We describe the overall survival for patients with M-protein as 35.5% for patient followed up for 10 years and 43.5% for patients followed up for >10 years. There was an increased risk of mortality during the first year of follow-up, following the first detection of the M-protein. Routine and reflex SPEP was carried out in sera sent to the laboratory for investigation of patients with clinical comorbidities and were more likely to be at increased risk of death from causes unrelated to LPD. M-protein was transient in 12% of patients and was likely to be secondary to non-LPD disorders. The high disappearance rate of the M-protein on longitudinal analysis suggests that non-malignant causes are detected by reflex testing. Progression to LPD occurred in patients with M-protein values of 3g/L. Previous studies have shown that values of 5g/L M-protein or a stable M-protein do not exclude MM development.3 Although the risk of progression to MM may be low in patients with M-protein of 5g/L these findings suggest that lifelong surveillance is important in all patients with M-protein.
In the Minnesota epidemiological studies the risk of progression to a lymphoid disorder without accounting for death due to competing causes was 10% at 10 years, 18% at 20 years, 28% at 30 years, 36% at 35 years, and 36% at 40 years.26 In Swedish hospital MGUS patients the cumulative risk for any malignancy was 8.9% in the first 10 years.27 In a small German population series of 165 MGUS patients progression rate to MM or WM was 0.6%/year.28 The risk of progression to LPD reported for MGUS patients varied between studies and the variation can be attributed at least in part to differences in the selected patient populations and study design.29
There are few studies on long term follow-up of patients with M-protein, most studies cover periods of 5–10 years,20,30 and most studies are epidemiological studies based in Southeastern Minnesota.26 Few studies on the practice of MGUS follow-up or the natural history of patients diagnosed in the UK are available. This is the first study to report on the follow-up of patients with M-protein which included those diagnosed by screening at globulin values outside the reference range. The study is divided into two cohorts, those diagnosed with an M-protein in 2006 and those diagnosed prior to 2006. The time of follow-up varied from 10 years to >10 years. It is possible that the rate of progression is weighted towards the years of follow-up, rates being highest in the first years, this may result in more frequent follow-up during the first years of diagnosis.20
In this study, cumulative LPD-free survival from April 2006 (not accounting for death due to other causes, loss to follow-up or transient M-protein which are competing risk factors) was 91% at 10 years and at >10 years. LPD-free survival decreased to 72.9% at 10 years and 78.6% at >10years if competing factors (death, loss to follow-up and transient M-protein) were censored in the analysis. The risk of transformation to LPD did not diminish even after 10 years. If competing factors were taken into account, approximately one in four of the patients followed over a period of 10 years or longer was at risk of developing a lymphoid malignancy. Other studies suggest that the risk of progression was higher during the first two years of follow-up.20 Previous studies suggest that the progression to plasma cell malignancy is indefinite and persists even after more than 30 years follow-up.31 The United Kingdom Myeloma Forum and Nordic Myeloma Study Group stress the importance of regular laboratory and clinical evaluation of these patients.18
Similar to previous reports we found a difference in risk of progression between IgG MGUS and non-IgG MGUS. We found that IgM MGUS had a similar survival rate to IgG MGUS. We report that IgA MGUS and biclonal gammopathies have a higher rate of malignant transformation than IgG MGUS and IgM MGUS. An association was found between IgA MGUS and risk of progression in previous studies.32,33 The Mayo clinic study reported an association between the risk of progression and free light chain ratio, M-protein concentration and isotype. In addition to factors considered by the Mayo Clinic, immunoparesis27 and the proportion of aberrant cells within the bone marrow are further variables that can classify progression to MM.34
The Mayo study reported a lower risk of progression for IgG MGUS compared to non-IgG MGUS.35 We did not observe a difference between the risk of progression of IgG MGUS and IgM MGUS. Other studies have reported no difference in risk progression between non-IgG vs IgG MGUS.27 The reason for these differences is not clear. The interpretation of the association of MGUS isotypes with progression is complicated by different populations of study subjects and different types of lymphoid malignancies in each study. Genetic susceptibility to LPD may differ between populations and predispose to different forms of LPD.36
Previous studies have reported that a model using abnormal serum-free light chain ratio as well as immunoglobulin heavy chain isotype is a better predictor of risk of progression. A limitation of this study is that serum-free light chain values were not included, as serum-free light chain measurement was introduced in Worcestershire after 2006. Our study, however, is similar to previous studies which reported a cumulative risk of progression to LPD of approximately 1% per year24 and a higher risk of transformation for IgA MGUS.37 Further, in a population-based cohort 3.3% of patients had abnormal serum-free light chain ratio.38 Serum-free light chains can be used to detect light chain myeloma and as the measurement of serum-free light chains was not available, light chain MGUS patients are not be included in the study.
There are currently few retrospective data available regarding the efficacy of monitoring and optimal follow-up of MGUS patients in the UK. Previous studies in the United States show demographic differences in the risk of progression to LPD.39 Two articles provide evidence that all MM are preceded by MGUS.2,3 Previous studies suggest that patients with MM with prior knowledge of MGUS had better MM survival, and stress the importance of clinical follow-up.40 In a study in the Unites States 6% of study patients had MGUS follow-up.41 In the Mayo Clinic an institution with long-standing clinical and laboratory interest in MGUS, 69% of MGUS patients who progressed to MM had optimal follow-up. Optimal follow-up resulted in lower incidence of MM diagnosis secondary to onset of serious symptoms compared with patients followed less frequently.42 In the current study 25.2% of patients were lost to follow-up. A total of 17 patients with M-protein value of >20g/L were followed up by community general physicians. It is possible that abnormal laboratory values or symptoms were not fully investigated, thus providing potential for missed early diagnosis. Further clinical evaluation of patients with M-protein >20 g/L for progression to MM was less in the cohort diagnosed prior to 2006. Post-2006, behavioural change among practising clinicians in the follow-up of MGUS is likely based on the revised perception of MM as a treatable malignancy concomitant with the introduction of highly effective less toxic therapeutic reagents. Community-based physicians may need further information stressing the symptoms that could signal the progression to malignant neoplasm, despite the low risk of progression.
The limitations of this study are that this is a single-center retrospective study and data collection was from medical and laboratory records, and 25.2% of patients were lost to follow-up. However patient selection was based on all the patients on the laboratory information system which recorded all patients followed up by community physicians with laboratory support. We do not believe that loss to follow-up, which was not based on patient demographics led to sample bias. Nearly all studies on this subject are retrospective single-center based. Two prospective studies have reported a lower incidence of malignant transformation.32,43 It is also likely that screen-detected patients with M-protein have a different clinical course than patients with M-protein detected following clinical request. Possible reasons are that screen-detected M-protein patients have a more indolent course due to decreased co-morbidities, or that clinically detected patients undergo a more thorough clinical evaluation.20 It is also possible that screen-detected patients from a hospital patient other than a community based screening program have varying co-morbidities and a different prognosis. Strengths of this study are its large sample size and length of follow-up. The study reflects that seen in a real-world situation, when patients with M-protein are followed up by community physicians with support from the laboratory.
Conclusions
To our knowledge this is the first retrospective study in the UK investigating the follow-up of patients diagnosed with M-protein using a service that included reflex testing at globulin values outside the reference range. Monitoring of asymptomatic patients was carried out by community-based physicians with laboratory support on testing intervals and patient follow-up. Similar to previous studies we report the clinical prevalence of M-protein diagnosed by reflex testing to be lower than the serologic prevalence.44 In this study approximately 25% of patients were lost to follow-up. Community-based physicians may benefit from further education on the follow-up of patients with M-protein. MGUS follow-up patterns varied geographically and demographically across the US.45 From a public health point of view it is essential to determine the clinical prevalence of MGUS and the healthcare burden of MGUS follow-up by community physicians instead of hospital-based specialist hematologists. In the US there is a projected shortage of haematologists-oncologists by 2020.46 Further studies are necessary to evaluate MGUS follow-up patterns across the UK. Such studies may provide data for improving clinical follow-up of MGUS patients as well as estimating the healthcare burden of MGUS in the UK.
Abbreviations
SPEP, serum protein electrophoresis; MGUS, monoclonal gammopathy of undetermined significance; MM, multiple myeloma; LPD, lymphoplasma-cell proliferative disorders; y, years; M-protein, monoclonal protein; Ig, immunoglobulin; MGCS, monoclonal gammopathy of clinical significance.
Disclosure
The author reports no conflicts of interest in this work.
References
1. Available from: http://www.cancerresearchuk.org/health-professional/cancer-statistics/statistics-by-cancer-type/myeloma/incidence#ref-0.
2. Weiss BM, Abadie J, Verma P, Howard RS, Kuehl WM. A monoclonal gammopathy precedes multiple myeloma in most patients. Blood. 2009;113(22):5418–5422. doi:10.1182/blood-2008-12-195008
3. Landgren O, Kyle RA, Pfeiffer RM, et al. Monoclonal gammopathy of undetermined significance (MGUS) consistently precedes multiple myeloma: a prospective study. Blood. 2009;113:5412–5417. doi:10.1182/blood-2008-12-194241
4. Kyle RA, Rajkumar SV. Monoclonal gammopathy of undetermined significance and multiple myeloma. JAMA Oncol. 2015;1:174–175. doi:10.1001/jamaoncol.2015.33
5. Wadhera RK, Rajkumar SV. Prevalence of monoclonal gammopathy of undetermined significance: a systematic review. Mayo Clin Proc. 2010;85:933–942. doi:10.4065/mcp.2010.0337
6. Kyle RA, Therneau TM, Rajkumar SV, et al. Prevalence of monoclonal gammopathy of undetermined significance. N Engl J Med. 2006;354:1362–1369. doi:10.1056/NEJMoa054494
7. Melton LJ, Rajkumar SV, Khosla S, Achenbach SJ, Oberg AL, Kyle RA. Fracture risk in monoclonal gammopathy of undetermined significance. J Bone Miner Res. 2004;19:25–30. doi:10.1359/jbmr.0301212
8. Piot JM, Royer M, Schmidt-Tanguy A, et al. Factors associated with an increased risk of vertebral fracture in monoclonal gammopathies of undetermined significance. Blood Cancer J. 2015;5:e345. doi:10.1038/bcj.2015.71
9. Kristinsson SY, Tang M, Pfeiffer RM, et al. Monoclonal gammopathy of undetermined significance and risk of skeletal fractures: a population-based study. Blood. 2010;116:2651–2655. doi:10.1182/blood-2010-04-282848
10. Veronese N, Luchini C, Solmi M, Sergi G, Manzato E, Stubbs B. Monoclonal gammopathy of undetermined significance and bone health outcomes: a systematic review and exploratory meta-analysis. J Bone Miner Metab. 2018;36:128–132. doi:10.1007/s00774-017-0817-8
11. Kristinsson SY, Pfeiffer RM, Björkholm M, et al. Arterial and venous thrombosis in monoclonal gammopathy of undetermined significance and multiple myeloma: a population-based study. Blood. 2010;115:4991–4998. doi:10.1182/blood-2009-11-252072
12. Gregersen H, Nørgaard M, Severinsen MT, Engebjerg MC, Jensen P, Sørensen HT. Monoclonal gammopathy of undetermined significance and risk of venous thromboembolism. Eur J Haematol. 2011;86:129–134. doi:10.1111/j.1600-0609.2010.01539.x
13. Ludwig H, Delforge M. Threatening clots in MGUS and myeloma. Blood. 2010;115:4975–4976. doi:10.1182/blood-2010-04-276345
14. Rosner MH, Edeani A, Yanagita M, Glezerman IG, Leung N; American Society of Nephrology Onco-Nephrology Forum. Paraprotein-related kidney disease: diagnosing and treating monoclonal gammopathy of renal significance. Clin J Am Soc Nephrol. 2016;11:2280–2287. doi:10.2215/CJN.02920316
15. Chaudhry HM, Mauermann ML, Rajkumar SV. Monoclonal gammopathy–associated peripheral neuropathy: diagnosis and management. Mayo Clin Proc. 2017;92(5):838–850. doi:10.1016/j.mayocp.2017.02.003
16. Fermand J-P, Bridoux F, Dispenzieri A, et al. Monoclonal gammopathy of clinical significance: a novel concept with therapeutic implications. Blood. 2018;132(14):1478–1485. doi:10.1182/blood-2018-04-839480
17. Berenson JR, Yellin O, Quiery A, et al. A retrospective study to evaluate the work-up and follow-up of patients with monoclonal gammopathy of undetermined significance. Clin Lymphoma Myeloma Leuk. 2011;11:336–341. doi:10.1016/j.clml.2011.02.002
18. Bird J, Behrens J, Westin J, et al. Haemato-oncology Task Force of the British Committee for Standards in Haematology, UK Myeloma Forum and Nordic Myeloma Study Group. UK Myeloma Forum (UKMF) and Nordic Myeloma Study Group (NMSG): guidelines for the investigation of newly detected M-proteins and the management of monoclonal gammopathy of undetermined significance (MGUS). Br J Haematol. 2009;147:22–42. doi:10.1111/j.1365-2141.2009.07807.x
19. Adams RA, Smith L, Pickering PE. The incidence of monoclonal proteins during 7 years of screening in a district general hospital. Immunology. 1984;51:451.
20. Go RS, Heien HC, Sangaralingham LR, Habermann EB, Shah ND. Risk of progression of monoclonal gammopathy of undetermined significance into lymphoplasmacytic malignancies: determining demographic differences in the USA. Haematologica. 2018;103(3):e123–e125. doi:10.3324/haematol.2017.179978
21. Twycross A, Shorten A. Service evaluation, audit and research: what is the difference? Evid Based Nurs. 2014;17:65–66. doi:10.1136/eb-2014-101871
22. Available from: https://www.england.nhs.uk/wp-content/uploads/2019/10/data-protection-policy-v5.1.pdf.
23. Therneau TM, Kyle RA, Melton LJ
24. Kyle RA, Durie BG, Rajkumar SV, et al.; International Myeloma Working Group. Monoclonal gammopathy of undetermined significance (MGUS) and smoldering (asymptomatic) multiple myeloma: IMWG consensus perspectives risk factors for progression and guidelines for monitoring and management. Leukemia. 2010;24(6):1121–1127. doi:10.1038/leu.2010.60
25. Saleun JP, Vicariot M, Deroff P, Morin JF. Monoclonal gammopathies in the adult population of Finistère, France. J Clin Pathol. 1982;35:63–66. doi:10.1136/jcp.35.1.63
26. Kyle RA, Larson DR, Therneau TM, et al. Long-term follow-up of monoclonal gammopathy of undetermined significance. N Engl J Med. 2018;378(3):241–249. doi:10.1056/NEJMoa1709974
27. Turesson I, Kovalchik SA, Pfeiffer RM, et al. Monoclonal gammopathy of undetermined significance and risk of lymphoid and myeloid malignancies: 728 cases followed up to 30 years in Sweden. Blood. 2014;123:338–345. doi:10.1182/blood-2013-05-505487
28. Eisele L, Dürig J, Hüttmann A, et al.; Heinz Nixdorf Recall Study Investigative Group. Prevalence and progression of monoclonal gammopathy of undetermined significance and light-chain MGUS in Germany. Ann Hematol. 2012;91:243–248. doi:10.1007/s00277-011-1293-1
29. van de Poel MH, Coebergh JW, Hillen HF. Malignant transformation of monoclonal gammopathy of undetermined significance among out-patients of a community hospital in southeastern Netherlands. Br J Haematol. 1995;91:121–125. doi:10.1111/j.1365-2141.1995.tb05256.x
30. Baldini L, Guffanti A, Cesana BM, et al. Role of different hematologic variables in defining the risk of malignant transformation in monoclonal gammopathy. Blood. 1996;87:912–918. doi:10.1182/blood.V87.3.912.bloodjournal873912
31. Kyle RA, Therneau TM, Rajkumar SV, Larson DR, Plevak MF, Melton LJ
32. Schaar CG, Cessie S, Snijder S, et al. Long-term follow-up of a population based cohort with monoclonal proteinaemia. Br J Haematol. 2009;144(2):176–184. doi:10.1111/j.1365-2141.2008.07423.x
33. Cesana C, Klersy C, Barbarano L, et al. Prognostic factors for malignant transformation in monoclonal gammopathy of undetermined significance and smoldering multiple myeloma. J Clin Oncol. 2002;20:1625–1634. doi:10.1200/JCO.2002.20.6.1625
34. Pérez-Persona E, Vidriales MB, Mateo G, et al. New criteria to identify risk of progression in monoclonal gammopathy of uncertain significance and smoldering multiple myeloma based on multiparameter flow cytometry analysis of bone marrow plasma cells. Blood. 2007;110:2586–2592. doi:10.1182/blood-2007-05-088443
35. Rajkumar SV, Kyle RA, Therneau TM, et al. Serum free light chain ratio is an independent risk factor for progression in monoclonal gammopathy of undetermined significance. Blood. 2005;106:812–817. doi:10.1182/blood-2005-03-1038
36. Steingrímsson V, Lund SH, Turesson I, et al. Population-based study on the impact of the familial form of waldenström macroglobulinemia on overall survival. Blood. 2015;125:2174–2175. doi:10.1182/blood-2015-01-622068
37. Gregersen H, Mellemkjaer L, Ibsen JS, Dahlerup JF, Thomassen L, Sørensen HT. The impact of M-component type and immunoglobulin concentration on the risk of malignant transformation in patients with monoclonal gammopathy of undetermined significance. Haematologica. 2001;86(11):1172–1179.
38. Dispenzieri A, Katzmann JA, Kyle RA, et al. Prevalence and risk of progression of light-chain monoclonal gammopathy of undetermined significance: a retrospective population-based cohort study. Lancet. 2010;375:1721–1728. doi:10.1016/S0140-6736(10)60482-5
39. Landgren O, Graubard BI, Katzmann JA, et al. Racial disparities in the prevalence of monoclonal gammopathies: a population-based study of 12,482 persons from the National Health and Nutritional Examination Survey. Leukemia. 2014;28:1537–1542. doi:10.1038/leu.2014.34
40. Sigurdardottir EE, Turesson I, Lund SH, et al. The role of diagnosis and clinical follow-up of monoclonal gammopathy of undetermined significance on survival in multiple myeloma. JAMA Oncol. 2015;1:168–174. doi:10.1001/jamaoncol.2015.23
41. Go RS, Gundrum JD, Neuner JM. Determining the clinical significance of monoclonal gammopathy of undetermined significance: a SEER-medicare population analysis. Clin Lymphoma Myeloma Leuk. 2015;15:177–186. doi:10.1016/j.clml.2014.09.004
42. Bianchi G, Kyle RA, Colby CL, et al. Impact of optimal follow-up of monoclonal gammopathy of undetermined significance on early diagnosis and prevention of myeloma-related complications. Blood. 2010;116:2019–2025. doi:10.1182/blood-2010-04-277566
43. Anagnostopoulos A, Evangelopoulou A, Sotou D, Gika D, Mitsibounas D, Dimopoulos MA. Incidence and evolution of monoclonal gammopathy of undetermined significance (MGUS) in Greece. Ann Hematol. 2002;81(7):357–361. doi:10.1007/s00277-002-0493-0
44. Go RS, Swanson KM, Sangaralingham LR, Habermann EB, Shah ND. Clinical prevalence (diagnosed cases) of monoclonal gammopathy of undetermined significance in the US: estimating the burden on health care. Leukemia. 2016;30:1443–1446. doi:10.1038/leu.2015.336
45. Go RS, Heien HC, Sangaralingham LR, Habermann EB, Shah ND. Monoclonal gammopathy of undetermined significance: follow-up patterns in the united states and concordance with clinical practice guidelines. Mayo Clin Proc Innov Qual Outcomes. 2017;1:161–169. doi:10.1016/j.mayocpiqo.2017.06.002
46. Go RS, Doyle LM. A monoclonal gammopathy in search of clinical significance: 57 years later. Blood. 2009;114:2355–2356. doi:10.1182/blood-2009-06-229120
 © 2020 The Author(s). This work is published and licensed by Dove Medical Press Limited. The full terms of this license are available at https://www.dovepress.com/terms.php and incorporate the Creative Commons Attribution - Non Commercial (unported, v3.0) License.
By accessing the work you hereby accept the Terms. Non-commercial uses of the work are permitted without any further permission from Dove Medical Press Limited, provided the work is properly attributed. For permission for commercial use of this work, please see paragraphs 4.2 and 5 of our Terms.
© 2020 The Author(s). This work is published and licensed by Dove Medical Press Limited. The full terms of this license are available at https://www.dovepress.com/terms.php and incorporate the Creative Commons Attribution - Non Commercial (unported, v3.0) License.
By accessing the work you hereby accept the Terms. Non-commercial uses of the work are permitted without any further permission from Dove Medical Press Limited, provided the work is properly attributed. For permission for commercial use of this work, please see paragraphs 4.2 and 5 of our Terms.