")
Back to Journals » International Journal of Nanomedicine » Volume 14
A novel theranostic gold nanorods- and Adriamycin-loaded micelle for EpCAM targeting, laser ablation, and photoacoustic imaging of cancer stem cells in hepatocellular carcinoma
Authors Locatelli E, Li Y , Monaco I, Guo W , Maturi M , Menichetti L , Armanetti P, Martin RC , Comes Franchini M
Received 6 December 2018
Accepted for publication 9 February 2019
Published 13 March 2019 Volume 2019:14 Pages 1877—1892
DOI https://doi.org/10.2147/IJN.S197265
Checked for plagiarism Yes
Review by Single anonymous peer review
Peer reviewer comments 2
Editor who approved publication: Dr Thomas Webster
Erica Locatelli,1,* Yan Li,2,* Ilaria Monaco,1 Wei Guo,3 Mirko Maturi,1 Luca Menichetti,4 Paolo Armanetti,4 Robert C Martin,2 Mauro Comes Franchini1
1Department of Industrial Chemistry “Toso Montanari”, Bologna, Italy; 2Department of Surgery, School of Medicine, University of Louisville, Louisville, KY, USA; 3Department of Hematology, The First Hospital of Jilin University, Changchun, China; 4Institute of Clinical Physiology, National Research Council (CNR), Pisa, Italy
*These authors contributed equally to this work
Introduction and purpose: Cancer stem cells (CSCs) present a higher capacity to evade being killed by cancer agents and developing chemoresistance, thus leading to failure of conventional anticancer therapeutics. Nanomaterials specifically designed for targeting and treating not only tumor cells, but also CSCs, may encompass therapeutic and diagnostic tools, thus successfully eradicating the tumor.
Materials and methods: Polymeric micelles simultaneously loaded with gold nanorods (GNRs) and Adriamycin were prepared and used as a novel therapeutic and diagnostic weapon. Epithelial cell adhesion molecule (EpCAM) is an important CSC surface marker and has been exploited in this work as an active targeting agent. Photoacoustic imaging was applied for GNR individuation and tissue recognition.
Results: The nanosystem was demonstrated to be able to elicit effective targeting of cancer cells and cause their killing, in particular under laser ablation. Moreover, ex vivo photoacoustic imaging is able to clearly identify tumor regions thanks to GNR’s contrast.
Conclusion: The nanosystem can be considered a powerful and promising theranostic weapon for hepatocellular carcinoma treatment.
Keywords: gold nanorods, drug delivery, photoacoustic imaging, photothermal therapy, EpCAM, cancer stem cells
Introduction
About 90% of therapeutic failures in cancer patients are attributed to chemoresistance. Conventional therapeutic strategies, such as chemo-agents killing rapidly growing cancer cells, may exhibit initial success, but the eventual relapse of the tumor, due to the greater resistance of some cells is a critical point. A certain type of cancer cells, such as progenitor cells/cancer stem cells (CSCs), renders the capability to this subset of cancer cells to evade slaughter from a variety of structural and functional chemo-agents, thus accounting for nearly all therapeutic failures. However, most chemotherapeutic agents aim to destroy rapidly dividing cancer cells other than undifferentiated CSCs. New types of therapeutic strategies for targeted drug delivery to cancer cells, especially to the CSCs, could be promising as a radical treatment for cancer. Finding the agents for CSC killing could be the key to eliminate these cancer-initiator/progenitor cell CSCs, thereby radically abolishing the tumors. Unlike the cancer cells that were rapidly dividing and differentiating, CSCs underwent continuous self-renewal to avoid insult and chemo-killing. Targeting the CSCs would provide a novel therapeutic strategy, a shift away from the traditional chemotherapy. To test this hypothesis, we first performed an in vitro study using a sphere-formation assay to enrich the CSCs. This sphere-formation assay was originally established as an in vitro culture system to enrich nervous stem cells1 and was used latterly to enrich CSCs.2 In this in vitro culture system, two important growth factors used were the epidermal growth factor (EGF) and basic fibroblast growth factor (bFGF). The use of bFGF was critical to regulate the proliferative fate of unipotent and bipotent EGF-generated progenitor cells.3
Hepatocellular carcinoma (HCC) is the fifth most common cancer and the third leading cause of cancer-related deaths worldwide.4 HCC is often resistant to chemotherapeutic drugs, with only a few drugs eliciting a therapeutic effect in the HCC patients.5
The treatment results obtained with chemotherapeutic agents in advanced HCC have been disappointing. Adriamycin (Adr) has been commonly used for the comprehensive treatment of various cancers including HCC. Adr was one of the first chemotherapeutic drugs used for HCC and showed interesting results;6 however, the chemoresistance that developed greatly hindered its efficacy, with a marginal role in the treatment of HCC patients. The interest on Adr is growing again due to the technological advance that now allows targeted release of the drug. In our previous study,7 we demonstrated that Adr can decrease the expression of epithelial cell adhesion molecule (EpCAM). Recent finding demonstrated that EpCAM, an important CSCs surface marker, is overexpressed in the cancer cells contributing to chemoresistance.5 Therefore, a targeted release of Adr could be a potential strategy to improve its chemotherapeutic efficacy.
Gold nanorods (GNRs) have showed promising applications in imaging, therapy, and biological sensing, thanks to their peculiar geometry.8 Significant biomedical applications based on targeted heat delivery, such as killing localized cancer cells by hyperthermia after optical excitation, become possible when GNR resonance is tuned to near-infrared (NIR), rays to which tissues are relatively transparent. In addition, under nanosecond-pulsed NIR laser irradiation, GNRs act as perfect contrast agent for photoacoustic (PA) imaging, a powerful diagnostic, noninvasive technique, which could be used for early cancer diagnosis.9,10 Moreover, by employing continuous wave NIR laser tuned in the region of GNR plasmonic absorption, they can increase the temperature of their surroundings up to several tens of degrees, enabling their employment for photothermal therapy (PTT) of cancer.11,12 Many other nanostructured materials have been recently developed to efficiently convert NIR light into heat, but GNRs display higher photothermal conversion efficiencies and improved biocompatibility.13,14
Recently, a simultaneous loading of lipophilic GNRs and curcumin into polymeric nanomicelles (GNRs-1/curc@PMs) made of biocompatible PLGA-b-PEG copolymer has been developed and used for in vivo treatment of premalignant esophageal adenocarcinoma.15
A similar strategy is exploited in the present work to create a drug delivery carrier able to host two different therapeutic agents, Adr and GNRs, simultaneously and to deliver them to the site of action, thanks to decoration with the EpCAM antibody on the surface of the nanosystem. When decorated with EpCAM antibodies, Adr/GNRs@PMs-antiEpCAM could specifically target CSCs and enhance the concentration of drugs in the tumor site, thereby killing, especially under laser irradiation, the CSCs completely.16 Moreover, the enhanced localization of GNRs on the tumor region could be efficiently detected by using the photoacousting imaging, thus allowing diagnosis and therapy by using a single drug.
Experimental section
All chemicals were purchased from Sigma-Aldrich Co. (St Louis, MO, USA) and used as received. Poly(D,L-lactide-co-glycolide) (50/50) with carboxylic acid end group (PLGA-COOH, inherent viscosity 0.12 dL/g, MW ~7 kDa) was purchased from Lakeshore Biomaterials (Birmingham, AL, USA). Polyethylene glycol with amino and carboxylic acid end groups (NH2-PEG-COOH, MW ~3 kDa) was purchased from Rapp Polymere GmbH (Tübingen, Germany). All aqueous solutions were prepared with deionized water obtained using an ultrafiltration system (Milli-Q; EMD Millipore, Billerica, MA, USA) with a measured resistivity above 18 MΩ/cm. CH2Cl2 was passed through basic alumina prior to use. Dynamic light scattering measurements were performed on a Malvern Zetasizer-nano-S working with a 532 nm laser beam. ζ potential measurements were conducted in DTS1060C-Clear disposable zeta cells at 25°C. SpectraAA 100 Varian was used for atomic absorption spectroscopy analysis. Final concentration of the suspensions was determined by gravimetric analysis by drying 100 μL of solution at 120°C for 24 hours then accurately weighting the residual dry matter amount. Amount of Adr entrapped in the polymeric micelles was determined by fluorescence analysis with an Ediburg FLSP920 spectrofluorimeter equipped with a 450 W Xenon arc lamp.
Synthesis of Adr/GNRs@PMs-antiEpCAM-(binary bomb-EpCAM)
In a common procedure, 40 mL of 1.25 mM solution of GNRs coated with cetyltrimethyl ammonium bromide, obtained as previously reported,17 were added dropwise to a solution composed of 140 mg of ethyl 11-(4-mercaptobenzoyl) undecanoate (Ligand 1) in 40 mL of warm ethanol. Ligand exchange reaction was allowed to take place by shaking overnight. Lipophilic GNRs-1 were precipitated by centrifugation (10 minutes, 6 krpm) and washed twice with ethanol. The final pellet was then collected in 18 mL of dichloromethane (DCM). Successively, Adr/GNRs@PMs were prepared by water-in-oil-in-water (w/o/w) double emulsion solvent evaporation method. First, 2 mL of Adr 1 mg mL−1 in water were emulsified by tip-probe sonication with 18 mL of GNRs-1 in DCM in which 100 mg of PLGA-b-PEG-COOH and 100 mg of PLGA-b-PEG-NH2 have been dissolved. Then, the obtained emulsion was further emulsified with 80 mL of water in which 1 g of sodium cholate hydrate had been dissolved as stabilizer. The organic solvent was evaporated in vacuum and PMs were purified on Amicon Ultra centrifugal filters (MWCO 300 kDa) and finally collected in 10 mL. Afterward, 5 mL of Adr/GNRs@PMs underwent antibody conjugation. First, 12 μg of anti-EpCAM were added to 5 mL of a solution containing 1 mg of N-(3-dimethylaminopropyl)-N′-ethylcarbodiimide hydrochloride (1-ethyl-3-(3-dimethylaminopropyl) carbodiimide [EDC]) and 1 mg of N-hydroxysulfosuccinimide sodium salt (sulfo-NHS). After 1 hour under stirring conditions, 5 mL of Adr/GNRs@PMs was added dropwise, and conjugation was allowed to happen by stirring overnight. Then, Adr/GNRs@PMs-antiEpCAM (also called binary bomb-EpCAM) were purified on Amicon Ultra centrifugal filters (MWCO 300 kDa) and finally collected in 4 mL of water.
Identification of binary bomb-EpCAM in Hepa1-6 cell spheroids
Hepa1-6 cell line (CRL-1830) was purchased from American Type Culture Collection (Manassas, VA, USA).
For sphere formation assay, Hepa1-6 cells were seeded in an eight-well chamber slide at a density of 106 cells per well. When cells reached ~90% confluence, serum-free DMEM/F12 medium supplied with EGF and bFGF was used as the standard spheroid condition to enrich CSCs, which was a well-established assay.18 The cells were then treated with 100 μg of binary bomb-EpCAM for 12 hours. To identify binding of binary bomb-EpCAM to Hepa1-6 cell spheroids, the chamber was removed from the slide. The slide was washed and fixed with cold acetone (−20°C) for 2 minutes. After fixing, the slides were washed with PBS-T, and blocked with 10% FBS for 30 minutes at room temperature. The slide was then exposed to 1:100 dilution of donkey anti-mouse IgG1-PE-conjugated antibody for 1 hour at room temperature. The positive PE staining was examined under a fluorescence microscope at 200× magnification.
Cell viability
For non-spheroid assay, Hepa1-6 cells were seeded in 96-well plates at a density of 2×10⁵ cells per well. Three days after cell seeding, the cells reached ~80% confluence and were followed by serum-free medium for 12 hours. For sphere formation assay, Hepa1-6 cells were seeded in 96-well plates at a density of 106 cells per well. When cells reached ~90% confluence, serum-free DMEM/F12 medium supplied with EGF and bFGF was used as a standard spheroid condition to enrich CSCs. Both non-spheroids and spheroids were treated with binary bomb-EpCAM at the concentrations of 12.5, 25, 50, and 100 μg for 12 hours. After the treatment, cells were then exposed to NIR laser light at a wavelength of 808 nm using a diode-pumped solid-state laser (DPSSL) system. The power density of exposure was 1 minute at 3 W/cm2 as previously reported.15 Cell viability was evaluated by MTT reduction assay. The growth inhibition was calculated based on mean optical density values from triplicate wells for each treatment to determine cell viability. The MTT assay was repeated three times for each measurement.
Orthotropic tumor model
To establish a xenograft HCC model, male C57L/J mice (Jackson Laboratory, Bar Harbor, ME, USA) at 8 weeks old and a mouse hepatoma cell line, hepa1-6, were used. C57L/J mouse is syngeneic with BW7756 mouse, while the hepa1-6 cell line is a derivative of the BW7756 mouse hepatoma and shows a reliable tumor growth in the syngeneic host C57L/J mouse. Laparotomy was performed, and hepa1-6 cells were inoculated at 106 cells into the right liver lobe of C57L/J mouse. The tumor growth was monitored weekly by resolution ultrasound (US) (Vevo 770™-120 image system; Visualsonics Inc., Toronto, ON, Canada). The representative image is showed in Figure 1. Animal procedures were approved by the Institutional Animal Care and Use Committee of University of Louisville, which is certified by the American Association for Accreditation of Laboratory Animal Care.
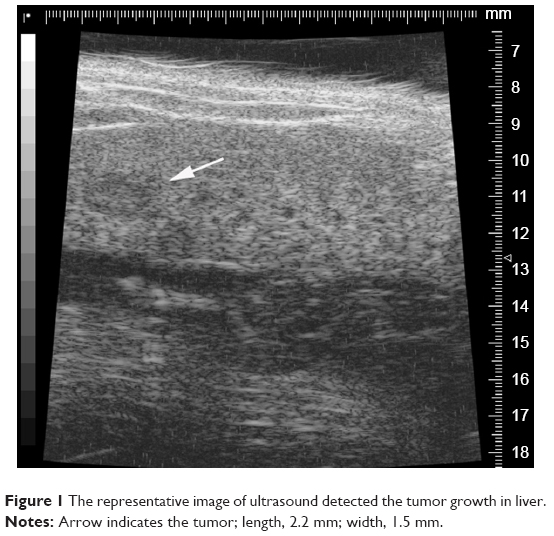 | Figure 1 The representative image of ultrasound detected the tumor growth in liver. |
Binary bomb-EpCAM (Adr/GNRs@PMs-antiEpCAM) administration and NIR light exposure
When the tumor growth reached 1.5–2.5 mm2 by the US measurement, laparotomy was performed in the animals again, and the animals were injected intra-tumorally with 100 μL Adr/GNRs@PMs-antiEpCAM at a concentration of 100 μg in saline or with the same amount of saline solution for the control group. Twelve hours later, the mice were anesthetized and exposed to an 808 nm light produced using a DPSSL system. Three days after the treatment, the animals were sacrificed and required tissues fixed in 10% buffered formalin for histological examination. Tumor tissues were also frozen in liquid nitrogen for immunofluorescence examination.
Identification of Adr/GNRs@PMs-antiEpCAM in HCC tissues
The frozen tissues were sectioned, and the slides were fixed in cold acetone (−20°C) for 2 minutes. After fixing, the slides were washed with PBS-T and blocked with 10% FBS for 30 minutes at room temperature. DAPI was used for staining at 1:1,000 as a counter stain for the nuclei. The slides were washed again and exposed to the antibody at 1:100 dilution of anti-mouse IgG1-fluorescein isothiocyanate (FITC)-conjugated antibody to identify the location of Adr/GNRs@PMs-antiEpCAM within the cancerous tissues. FITC-positive staining was examined under a fluorescence microscope at 200× magnification.
Histopathology
The formalin-fixed tumor tissues were embedded in paraffin. Serial sections of 5 mm were mounted onto glass slides for histopathological analysis. H&E-stained slides were obtained for each sample for the histological study.
Quantification of HCC cell killing by silver staining
The formalin-fixed tumor tissues were embedded in paraffin. Serial sections of 5 mm were mounted onto glass slides for histopathological analysis. Silver staining was obtained for each sample for the histological study quantification of HCC cell killing in cancerous tissue treatments of Adr/GNRs@PMs-antiEpCAM and Adr/GNRs@PMs before and after laser exposure. The cell numbers were counted per high power in the digital images acquired with the Olympus 1×51 microscope at 20× magnification using the Olympus DP72 digital camera via the cellSens Dimension imaging system (Olympus Corporation, Tokyo, Japan).
Immunofluorescence examination of CSC surface marker
The frozen tissues were sectioned, and slides were fixed in cold acetone (−20°C) for 2 minutes. After fixing, the slides were washed with PBS-T, and blocked with 10% FBS for 30 minutes at room temperature. The slides were washed again and exposed to 1:200 dilution of FITC-conjugated antibodies (anti-EpCAM and anti-CD133) to identify the expression of EpCAM and CD133 within the cancerous tissue treatments of Adr/GNRs@PMs-antiEpCAM and Adr/GNRs@PMs before and after laser exposure. All digital images were acquired with the Olympus 1×51 microscope at 40× magnification using the Olympus DP72 digital camera via the cellSens Dimention imaging system (Olympus Corporation) and stored as JPG data files, with fixed resolutions of 200 pixels/inch. FITC-positive staining was examined under a fluorescence microscope at 200× magnification. A computer image analysis was performed to quantify the expressions of EpCAM and CD133 in Adr/GNRs@PMs-antiEpCAM and Adr/GNRs@PMs before and after laser. The acquired color images from the immunohistochemical staining were defined at a standard threshold according to the software specification. The computer program then quantified the threshold area represented by color images. CD133 and EpCAM protein expressions were defined by the percentages of threshold area in acquired color images.
CSC surface marker EpCAM identified by Western blot
Hepa1-6 cells were seeded in 100 mm plates at a density of 2×10⁵ cells per well. When cells reached ~90% confluence, the cells were treated with Adr, Adr/GNRs@PMs-antiEpCAM and Adr/GNRs@PMs for 12 hours. After the treatment, cells were then exposed to NIR laser light at a wavelength of 808 nm using a DPSSL system. Protein levels for EpCAM were semi-quantified by Western blot analysis as described previously. Electrophoresis was performed on 12% SDS-PAGE gel and the proteins were transferred to nitrocellulose membranes. Membranes were incubated with primary antibody of EpCAM overnight at 4°C and with secondary antibody for 1 hour at room temperature. The antigen–antibody complexes were then visualized using ECL (Amersham, Piscataway, NJ, USA). The protein bands were quantified by densitometry analysis, and the protein expression was presented in a pixel ratio of target protein vs endogenous reference, β-actin.
Ex vivo PA evaluation
The PA acquisitions were made by Vevo LAZR 2100 by FUJIFILM VisualSonics Inc. This multimodal imaging platform provides PA images co-registered with B-mode images of the surrounding structures. PA signals were excited by laser pulses of 6–8 ns pulse width generated at a rate of 20 Hz by a Nd:YAG laser with an optical parametric oscillator that makes it tunable in the optical window from 680 to 970 nm. The PA spectra of GNRs have been characterized by evaluating the spectral response on tissue mimicking agar phantoms, and we compared the PA response generated from the injection treated and healthy livers. The PA spectral response of healthy liver was calculated as an average of PA signals produced from 36 regions of interest (ROIs, area ~0. 334 mm2), randomly placed on liver tissue regions acquired from two different slices. The PA images have been processed by spectral unmixing techniques19,20 by using a tool provided by the software of VevoLAZR 2100 imaging. The pattern of distribution of targeted nanomaterials has been assessed ex vivo in two samples EpCAM1 and EpCAM2 (as described in the previous section). The PA signal from the targeted-GNRs has been recorded, together with the endogenous oxy/deoxy-hemoglobin distribution. We acquired the whole liver images at fixed wavelength (840 nm), prescribing single step of 150 μm, in order to obtain the 3D PA-US renders. We evaluated the total averaged PA signal on the whole sample of explanted livers. The PA records were compared with the relative inductively coupled plasma mass spectrometry (ICP-MS) data. In addition, to find a potential correlation between PA imaging and micro-US records in healthy and non-healthy liver tissues, the US-acquired slices have been analyzed by a texture algorithm based on the evaluation of 122 statistical parameters as described.21
Statistical analysis
Data were collected from repeated experiments and were presented as mean ± SD. ANOVA was used to determine if differences exist. If so, a post hoc Tukey’s test was used for analysis of the difference between groups using SigmaPlot analysis and graphing software. P-values <0.05 were considered statistically significant.
Results and discussion
Synthesis of Adr/GNRs@PMs-antiEpCAM
GNRs were coated on their surface with ethyl 11-mercaptoundecanoate 1, obtained as previously reported22 in order to make them lipophilic and stable in organic solvents, thus allowing their entrapment into the polymeric micelles. After incubation of GNRs coated with cetyltrimethyl ammonium bromide with ligand 1, lipophilic GNRs-1 were easily redispersed in DCM. Next, GNRs-1 were entrapped along with Adr into polymeric nanomicelles (PMs) using water-in-oil-in-water (w/o/w) double emulsion solvent evaporation technique: the amphiphilic PLGA-b-PEG-COOH and PLGA-b-PEG-NH2 copolymers were selected to create biocompatible, biodegradable, and water-soluble micelles able to circulate for long periods of time in the bloodstream.23 Therefore, the organic solution composed of GNRs-1 and copolymers was emulsified with a small amount of water phase containing Adr and the so-obtained pre-micelles were stabilized by a second emulsification with a larger amount of aqueous solution containing sodium cholate hydrate as stabilizing agent. The resulting Adr/GNRs@PMs were partially kept as negative control and partially conjugated with the targeting agent, antiEpCAM antibody. The conjugation was achieved through amide bond formation between the carboxylic acid on the antibody fragment and the free amine groups on the surface of the micelles using the classical EDC chemistry. The entire procedure is summarized in Scheme 1.
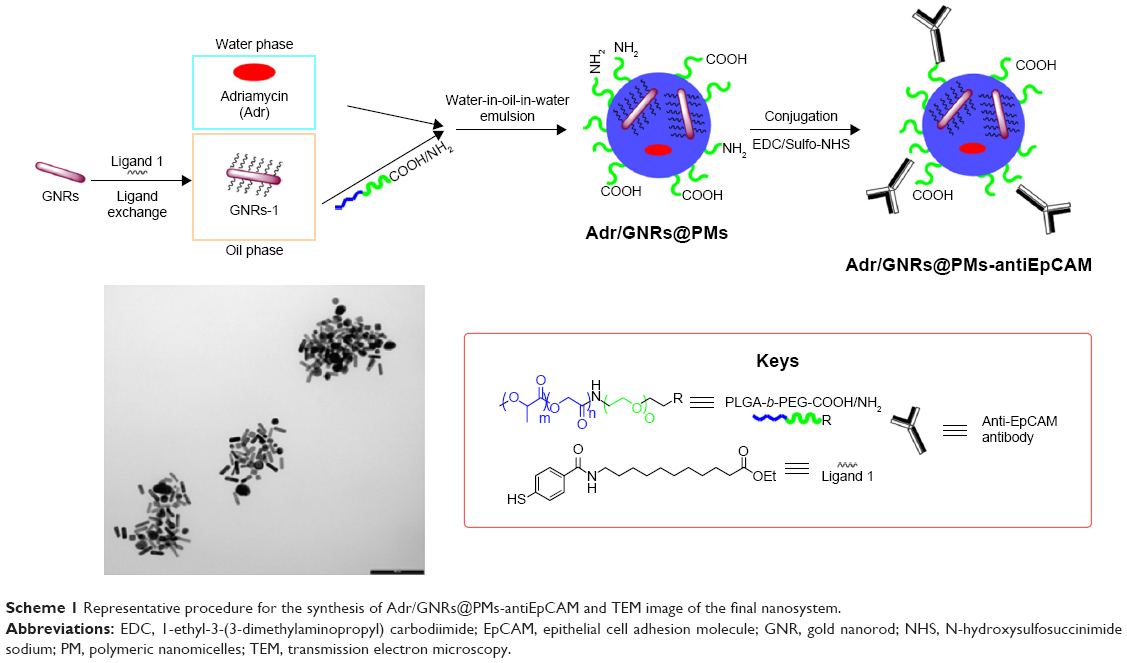 | Scheme 1 Representative procedure for the synthesis of Adr/GNRs@PMs-antiEpCAM and TEM image of the final nanosystem. |
A complete characterization of the final micelles, before and after conjugation with antiEpCAM antibody, was carried out and reported in Table 1. Micelles showed a suitable size and polydispersity index for in vivo applications and excellent stability even after the conjugation procedure. Similarly, GNRs remained unaltered during the entire process as demonstrated by the maintenance of λmax.
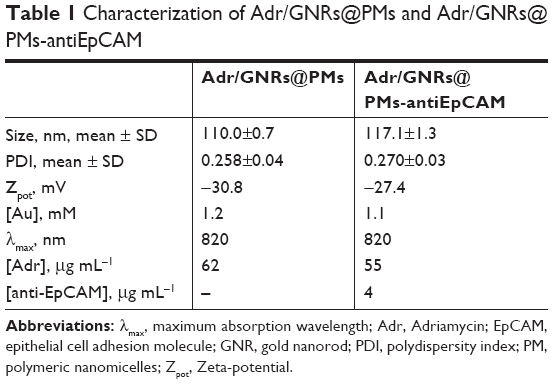 | Table 1 Characterization of Adr/GNRs@PMs and Adr/GNRs@PMs-antiEpCAM |
Identification of binary bomb-EpCAM in Hepa1-6 cell spheroids
To determine if the synthesized Adr/GNRs@PMs-antiEpCAM can bind to HCC cell spheres, immunofluorescence staining was performed to identify the antiEpCAM in the micelles using donkey anti-mouse IgG1 PE-conjugated antibody. Positive staining (red spots in Figure 2) was found in the Adr/GNRs@PM-antiEpCAM-treated Hepa1-6 cell spheroids but not with Adr/GNRs@PMs-treated Hepa1-6 cell spheroids, thus confirming the importance of the targeting EpCAM on the surface of micelles to increase their binding affinity for the CSCs which are enriched in the Hepa1-6 cell spheroids.
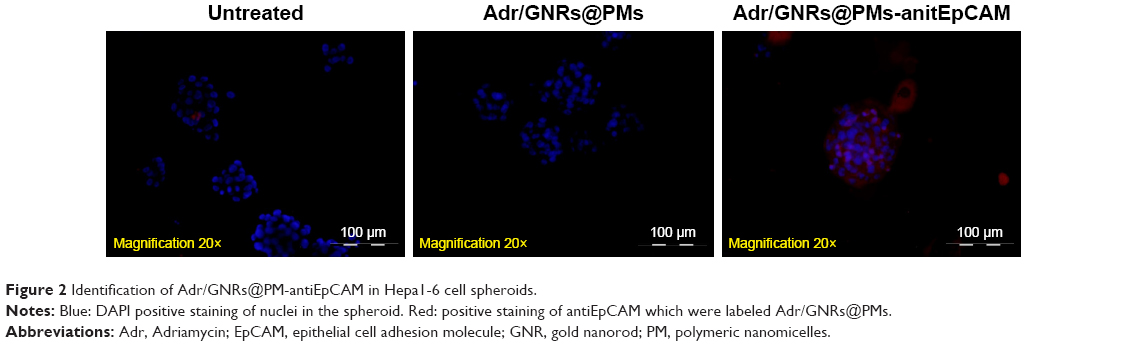 | Figure 2 Identification of Adr/GNRs@PM-antiEpCAM in Hepa1-6 cell spheroids. |
Cell viability
Significant cell viability reduction was found in both cells and spheroids treated with Adr/GNRs@PMs-antiEpCAM. In particular, laser exposure produces a drastic decrease in viability of cancer cells treated with the final nanosystems, thus demonstrating the advantages in terms of the binary bomb for releasing Adr in addition to thermal ablation properties derived from GNR particles (Figure 2). To determine whether the photothermal effect of the GNRs could affect cell viability, the temperature was determined in the Hepa1-6 cells with treatments of three GNR-based micelles (GNRs@PM, GNRs@PMs-antiEpCAM, and Adr/GNRs@PMs-antiEpCAM). The temperature was significantly increased with laser exposure at 40 and 60 seconds, compared to the 0 second laser exposure. The cyotoxicity of GNRs@PMs and GNRs@PM-antiEpCAM was also determined by MTT assay. The result indicated that about 10% growth inhibition of Hepa1-6 cells was induced by the two micelles (GNRs@PMs and GNRs@PMs-antiEpCAM) with laser exposure, indicating that GNR-derived thermal effect could also contribute to the cell death which was consistent with our previous report (Figure 3).16
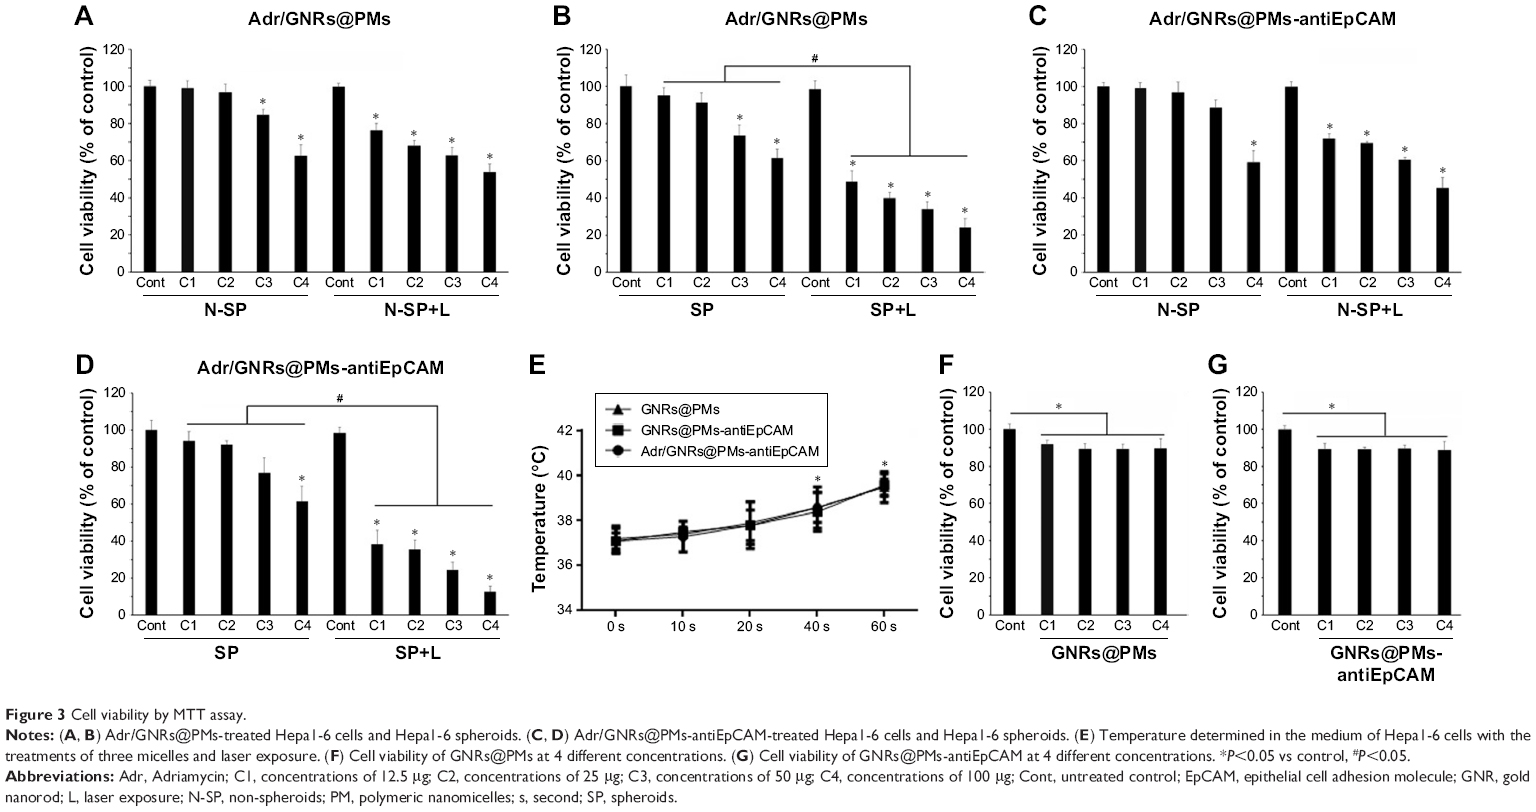 | Figure 3 Cell viability by MTT assay. |
Orthotropic tumor model
An orthotropic tumor model was established for further study. The animal surgery procedure was reported by our group previously.24 Ultrasound imaging was performed weekly to measure the tumor size. A representative US image is shown in Figure 1. The tumor size was measured as 2.2 mm in length and 1.5 mm in width. Then the animals were further treated with Adr/GNRs@PM-antiEpCAM.
Identification of Adr/GNRs@PM-antiEpCAM in HCC tissues
As described in the Experimental section, the tumor burden in the animals were treated with Adr/GNRs@PMs-antiEpCAM and laser. Three days after the treatments, the animals were sacrificed and the tumor tissues were harvested. In the frozen tissue, Adr/GNRs@PMs-antiEpCAM binding to the tumor tissue was determined using immunofluorescence staining. Positive staining (green spots in Figure 4) identified antiEpCAM in the micelles using anti-mouse IgG1 FITC-conjugated antibody. This result provided evidence that Adr/GNRs@PMs-antiEpCAM also had high binding affinity with tumor tissue in vivo.
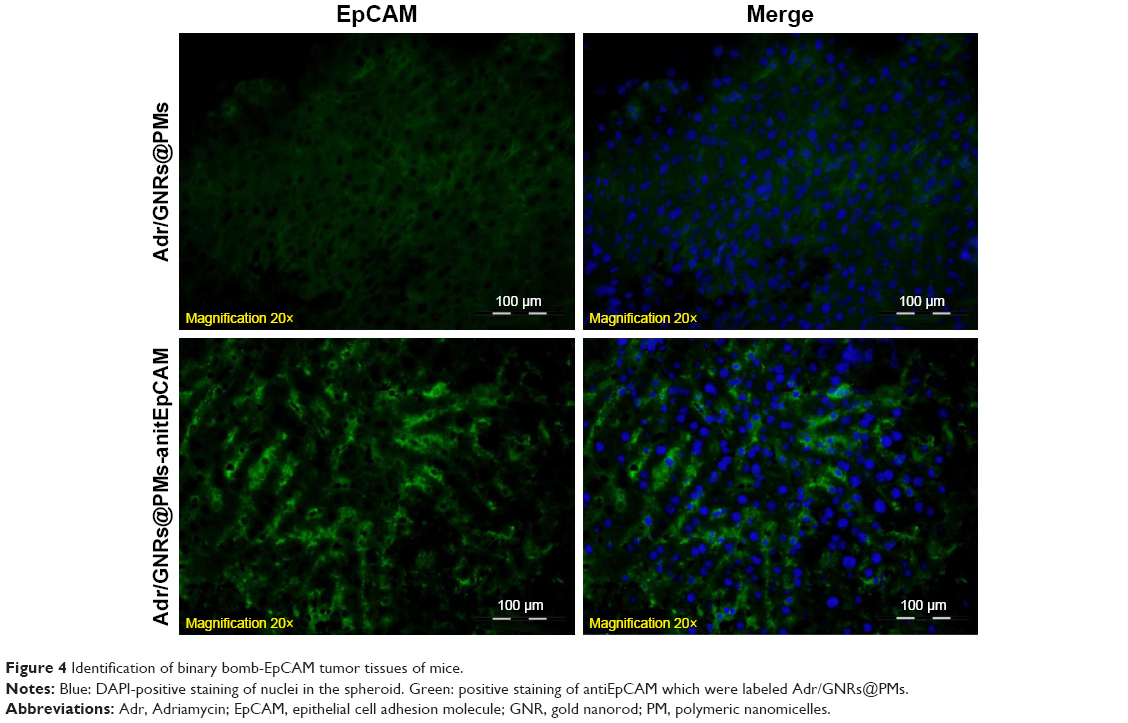 | Figure 4 Identification of binary bomb-EpCAM tumor tissues of mice. |
Histopathology
Histology showed that the inoculated HCC tumor grew and invaded into the hepatic parenchyma. Three days after treatments, it was observed that Adr/GNRs@PMs-antiEpCAM treatment caused tumor cell death and lymphocyte infiltration as well as hemorrhage in local regions. However, Adr/GNRs@PMs-antiEpCAM treatment with laser exposure caused extensive tumor cell death, implying that most tumor cells were killed by the binary bomb by release of Adr in addition to thermal ablation properties deriving from GNRs (Figure 5).
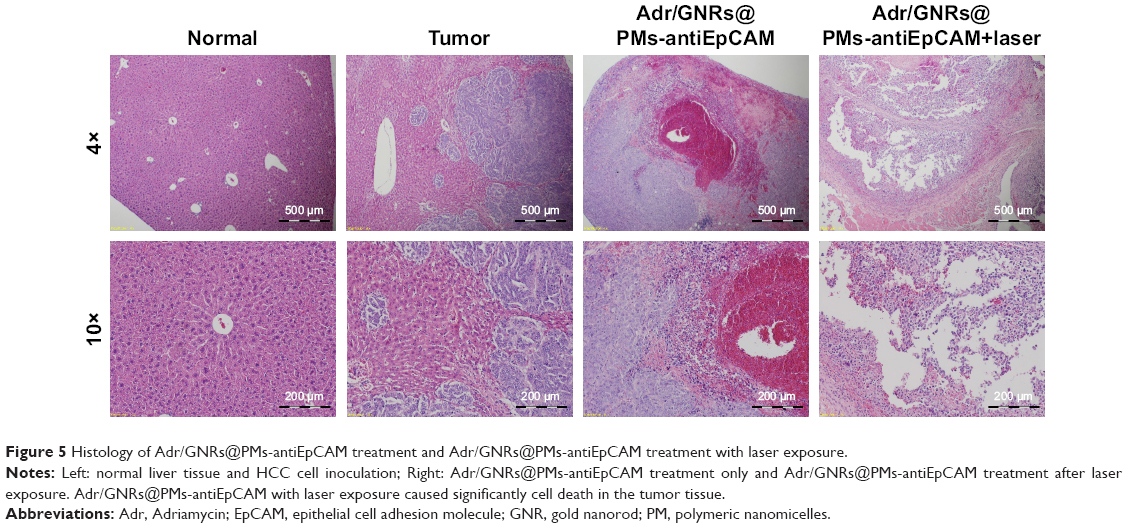 | Figure 5 Histology of Adr/GNRs@PMs-antiEpCAM treatment and Adr/GNRs@PMs-antiEpCAM treatment with laser exposure. |
Evaluation of HCC cell killing and CSC surface markers
To evaluate the tumor cell-killing effect in vivo, a silver staining assay was performed to determine the tumor cell-killing efficacy of Adr/GNRs@PMs-antiEpCAM and Adr/GNRs@PMs. As shown in Figure 6, both of the two micelles showed excellent tumor cell-killing effects after laser exposure. Adr/GNRs@PMs-antiEpCAM with laser exposure showed a significant effect of tumor cell-killing compared with Adr/GNRs@PMs. To evaluate whether the binary bomb targeted the CSC, two CSC markers were determined in the tumor tissues. Both the micelles showed significant effect for destroying the CSC markers in the tumor tissues.
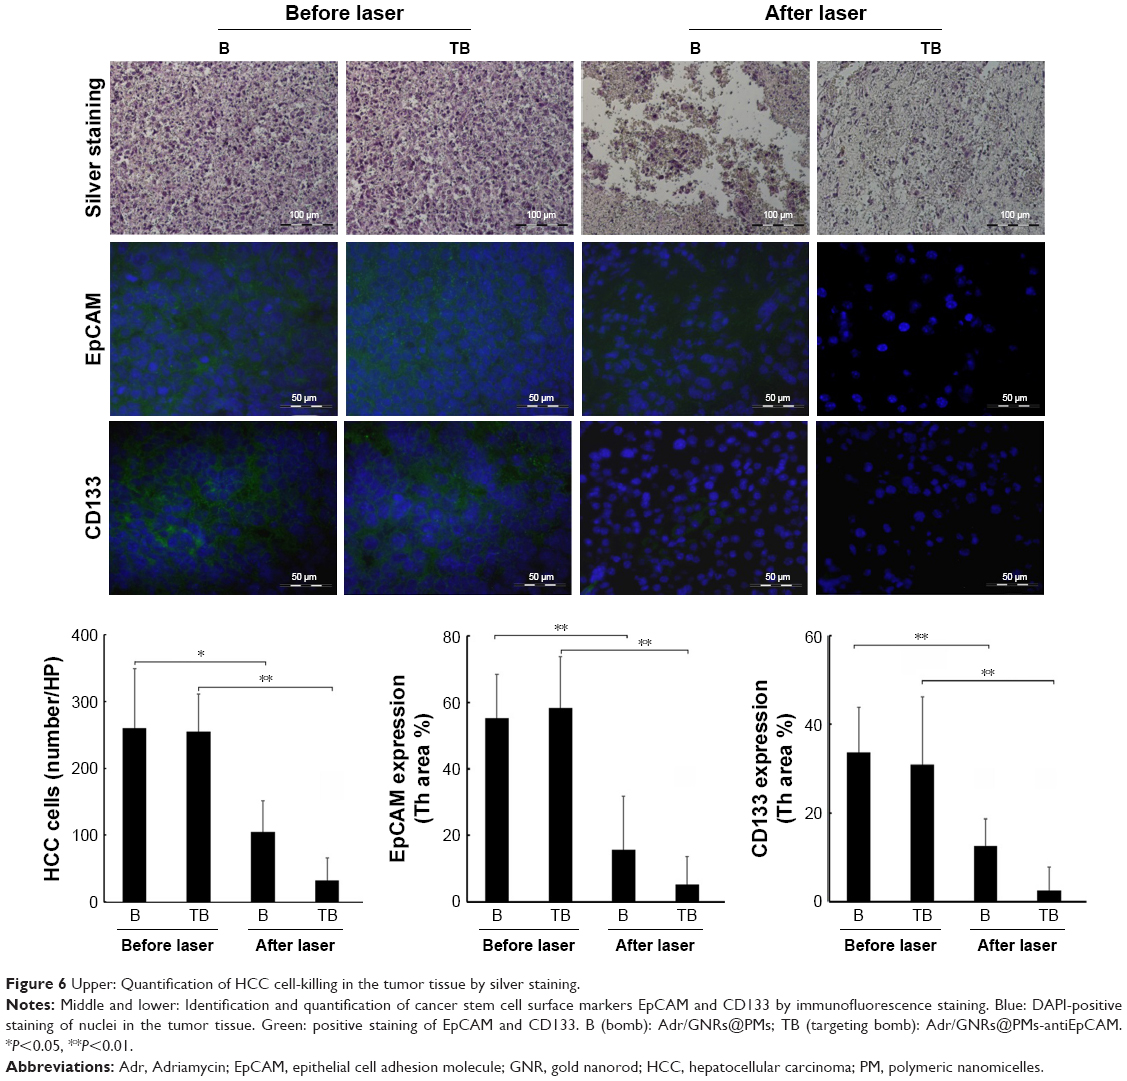 | Figure 6 Upper: Quantification of HCC cell-killing in the tumor tissue by silver staining. |
PA results
We report the patterns and the PA images acquired on different slices in Figure 7A–C. The typical PA spectra show two peaks around 700 and 800 nm over an increasing trend (PA intensity was between 0.05 and 0.15 a.u.) with respect to the increase of the wavelengths. 3D PA-US reconstruction of the whole healthy liver is shown in Figure 7D.
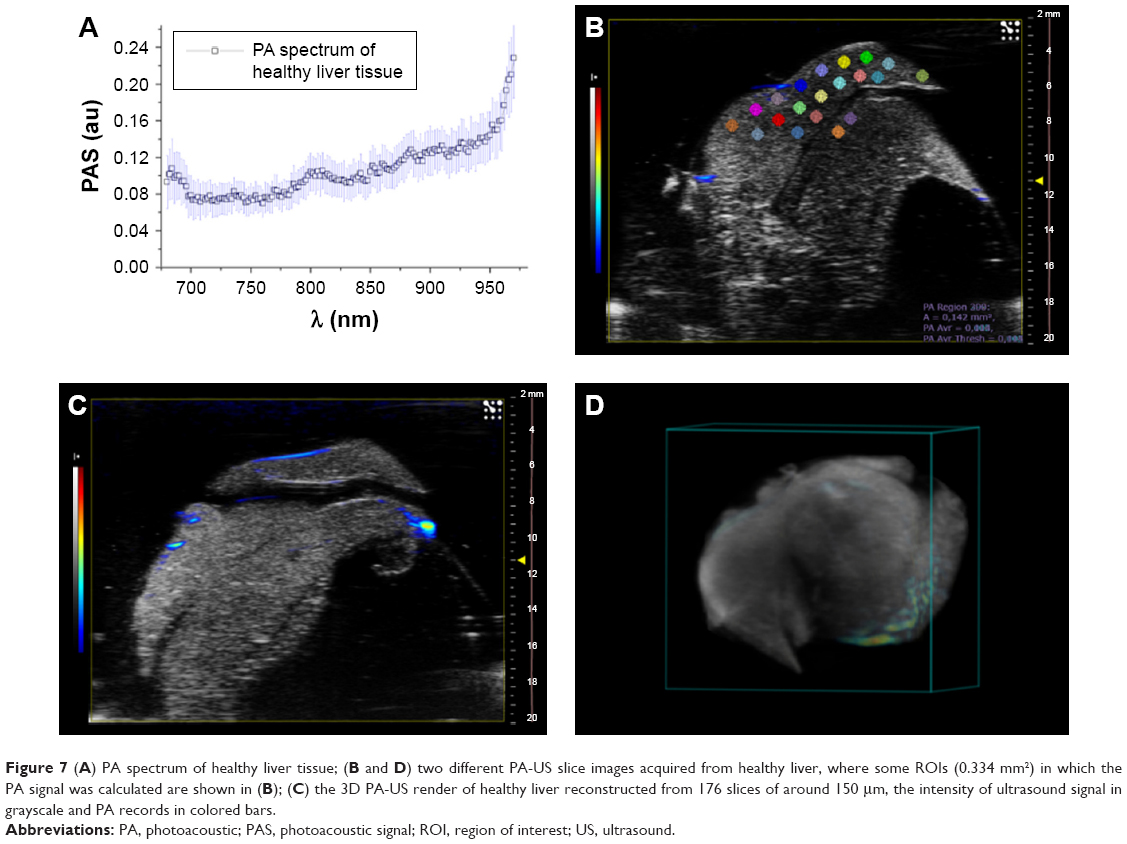 | Figure 7 (A) PA spectrum of healthy liver tissue; (B and D) two different PA-US slice images acquired from healthy liver, where some ROIs (0.334 mm2) in which the PA signal was calculated are shown in (B); (C) the 3D PA-US render of healthy liver reconstructed from 176 slices of around 150 μm, the intensity of ultrasound signal in grayscale and PA records in colored bars. |
The assessment of PA readouts in different slices of liver samples with tumor, injected with the functionalized nanoparticles, showed a different PA spectral patterns and intensity, compared with healthy liver tissues. As shown in Figure S1, the mean PA spectrum calculated on the EpCAM samples presented a Gaussian trend with peak around 860 nm. The plot also reported the mean normalized signal of GNRs (non-functionalized nanoparticles) found in in vitro characterization. The spectral shift in corresponding phantoms (test object been used) could be explained by the interaction of the functionalized GNRs and the biological environment in which the nanoparticles are distributed after the injection, which modifies the original GNR spectrum in terms of peak shift and shape (wideness).
To analyze and evaluate the different contributions of the liver tissues, endogenous chromophores, and potential physiological interactions in the PA US images of the EpCAM liver samples, we applied a commercial unmixing tool, available in the Vevo LAZR analysis software. As shown in Figure S2, we processed the PA images using three different spectra: the oxy- and deoxy- hemoglobin spectra and the PA spectrum of GNRs, extrapolated from previous in vitro tests.
By unmixing processing, we obtained a spatial distribution map of different spectral distributions that revealed the presence of PA signal of nanoparticles in the livers analyzed. Figure 8A–H reports two PA-US acquisition series of EpCAM1 (A–D) and EpCAM2 (E–H) liver samples in which the PA signal distribution (A and E) and their related result after spectral unmixing processing (B and F) were shown. The PA unmixed images (Figure 8B and F) showed the PA spectral contribution of deoxy-hemoglobin in blue color, the PA spectral contribution of oxy-hemoglobin in red color and the PA distribution due to the nanoparticles in green color. The 3D PA-US renders of whole liver sample (Figure 8D and G) were reported so as to better clarify the PA distribution inside the liver lobes. Figure 8D and H show the photos of liver samples, where the yellow circle represents the region of PA and US acquisition.
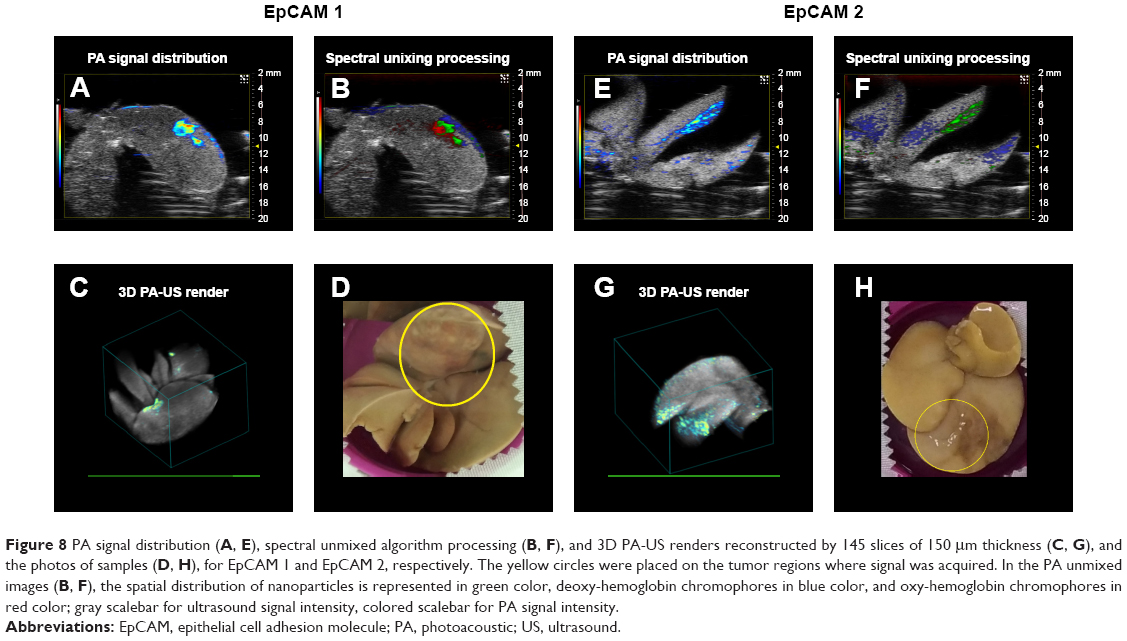 | Figure 8 PA signal distribution (A, E), spectral unmixed algorithm processing (B, F), and 3D PA-US renders reconstructed by 145 slices of 150 μm thickness (C, G), and the photos of samples (D, H), for EpCAM 1 and EpCAM 2, respectively. The yellow circles were placed on the tumor regions where signal was acquired. In the PA unmixed images (B, F), the spatial distribution of nanoparticles is represented in green color, deoxy-hemoglobin chromophores in blue color, and oxy-hemoglobin chromophores in red color; gray scalebar for ultrasound signal intensity, colored scalebar for PA signal intensity. |
Representative PA images (Figure S3A) and their unmixed processing (Figure S3B) of another slice of liver lobe of EpCAM 2 were reported in which we evaluated the PA spectral trend by covering the whole width of the liver lobe with nine ROIs placed from its upper side to its lower side (Figure S3C). The plots of PA signals (Figure S3C) confirmed that the nanoparticles were mainly distributed from the central region to the outside part of the liver lobe.
The major PA response was acquired from the EpCAM 2 sample in which the ICP-MS analysis found a higher concentration of gold equal to 9.42 μg/g vs 3.12 μg/g found in EpCAM 1 sample (Figure S4).
We examined the whole 3D PA-US acquisitions (Figure 9A and B): the PA signal average on a 3D volume representation of EpCAM 1 and EpCAM 2 found to be 0.132 and 0.534 au confirmed a similar trend with the ratio of the equivalent Au content found by ICP-MS assay.
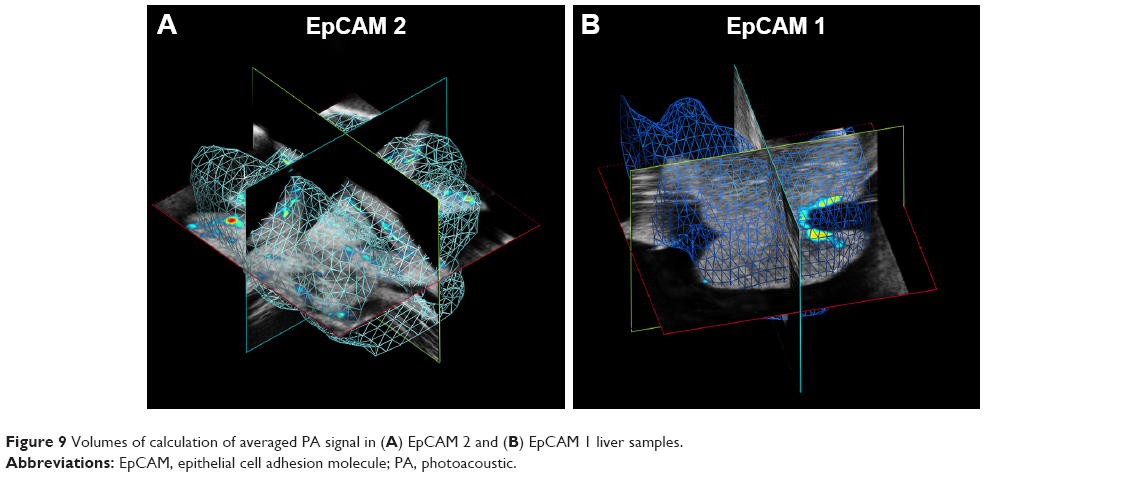 | Figure 9 Volumes of calculation of averaged PA signal in (A) EpCAM 2 and (B) EpCAM 1 liver samples. |
Although the number of samples was low, we tried to analyze the texture of the images to find a parameter that could describe the pattern of tumor tissue. The texture analysis, already tested in our previous work, was based on the study of 122 parameters. In this work, we applied the analysis on ten different slices of healthy, EpCAM 1, and EpCAM 2 liver samples.
Differences between the mean values of skewness evaluation (with maximum difference in the map3) of healthy liver sample in respect to the tumors were detected.
Discussion
An ideal chemo-drug would not be toxic to normal cells but able to kill the cancer cells at the local tumor site. In this study, the Adr/GNRs@PMs-antiEpCAM was designed to release the Adr drug and GNRs under the control of NIR light exposure.
In the literature, a number of studies describe the photo thermal effect generated by the light irradiation of gold nanoparticles in tumors.25–27 Indeed, production of plasmonic resonances can be stimulated and used to increase the local temperature drastically to provide heating capabilities to the nanoparticles to kill the cancer cells, without damage to the healthy tissue. This effect was extensively studied and demonstrated in different ways. In particular, Norouzi et al28 in 2018 reviewed the past studies of PTT using gold nanoparticles, underlining the efficacy of the methodology and how it is possible to apply PTT by manipulating the physical characteristics of gold nanoparticles, in terms of size, synthesis, and other reported parameters. The GNRs used in the present work, that is, Adr/GNRs@PM-antiEpCAM, have similar physical–chemical characteristics and optimized aspect ratio to those reported in literature, leading to a comparable heating performances vs quantum yield.
The important features of this nanosystem were biocompatibility and controlled release of drug on to target CSCs leading to their elimination. Our in vitro data indicated that Adr/GNRs@PMs-antiEpCAM was effective to kill the CSCs which were enriched by the spheroid assay. When administrated locally into the tumor, this Adr/GNRs@PMs-antiEpCAM also showed a tumor-killing effect, evidenced by extensive cell death in the tumor. Adr/GNRs@PMs-antiEpCAM could be more efficient to kill the CSCs via antiEpCAM targeting because EpCAM has been identified as a surface marker, which is associated with aggressive clinicopathological features and indicates poor prognosis in patients with HCC.29 Furthermore, the increase of local concentration of Adr by Adr/GNRs@PMs-antiEpCAM would increase the efficacy in tumor cell-killing. Unlike traditional administration of chemo-agents, the unique aspect of Adr/GNRs@PM-antiEpCAM could be the reduced toxicity to benign cells because it is targeted to the EpCAM-positive tumor cells, other than those EpCAM-negative hepatocytes.30 In addition, the GNRs in Adr/GNRs@PMs-antiEpCAM coupled with NIR light exposure could enable thermal-based ablation targeted specifically at the tumor site. Evidence has shown that cancer cells are more vulnerable to elevated temperatures (42°C–49°C) compared with healthy cells, due to the hypoxic environment and higher metabolic rates, which is supported by previous report.31,32 Taken together, our study shows that combination of Adr/GNRs@PMs-antiEpCAM with NIR exposure to treat liver cancer is technically feasible. Drug targeting using gold nanoparticles exhibit potential for use in the HCC patients who are not candidates for surgery and considerable study on this strategy remains to be carried out in the future.
Conclusion
In this work we prepared and characterized for the first time a binary nanostructured agent, containing both the Adr drug and GNRs, into a biocompatible nanocarrier further decorated with the targeting anti-EpCAM antibody, which was therefore effective in recognizing and killing CSCs.
The efficacy of the novel therapeutic agent Adr/GNRs@PMs-antiEpCAM was demonstrated both in vitro and in vivo. In the in vitro study, we performed combined PTT and laser-triggered drug (Adr) release. Upon laser exposure, GNRs generate hyperthermia leading both to cell porosity in combination with Adr-selective release from the micelles to the tumor site. This demonstrated that Adr/GNRs@PMs-antiEpCAM had a greater degree of tumor cell cytotoxicity.
The in vivo results also demonstrated that the Adr/GNRs@PMs-antiEpCAM preferentially bind to the HCC cells compared with nontarget Adr/GNRs@PMs, which lead to a higher cytotoxicity. After laser exposure, in vivo results confirmed that the possible reason for the extensive tumor destruction in Adr/GNRs@PMs-antiEpCAM treatment could be the synergistic effect of GNR thermal delivery and Adr cell cytotoxicity.
Acknowledgments
Research reported in this publication was partially supported by an Institutional Development Award (IDeA) from the National Institute of General Medical Sciences of the US National Institutes of Health under grant number P20GM113226. The content is solely the responsibility of the authors and does not necessarily represent the official views of the National Institutes of Health. The University of Bologna is also acknowledged.
Disclosure
The authors report no conflicts of interest in this work.
References
Jensen JB, Parmar M. Strengths and limitations of the neurosphere culture system. Mol Neurobiol. 2006;34(3):153–161. | ||
Schatton T, Frank MH. The in vitro spheroid melanoma cell culture assay: cues on tumor initiation? J Invest Dermatol. 2010;130(7):1769–1771. | ||
Vescovi AL, Reynolds BA, Fraser DD, Weiss S. bFGF regulates the proliferative fate of unipotent (neuronal) and bipotent (neuronal/astroglial) EGF-generated CNS progenitor cells. Neuron. 1993;11(5):951–966. | ||
Llovet JM, Montal R, Sia D, Finn RS. Molecular therapies and precision medicine for hepatocellular carcinoma. Nat Rev Clin Oncol. 2018;1. | ||
Lohitesh K, Chowdhury R, Mukherjee S. Resistance a major hindrance to chemotherapy in hepatocellular carcinoma: an insight. Cancer Cell Int. 2018;18(1):44. | ||
Lai CL, Lok ASF, Wu PC, Chan GCB, Lin HJ. Doxorubicin versus no antitumor therapy in inoperable hepatocellular carcinoma. A prospective randomized trial. Cancer. 1988;62(3):479–483. | ||
Li Y, Farmer RW, Yang Y, Martin RC. Epithelial cell adhesion molecule in human hepatocellular carcinoma cell lines: a target of chemoresistence. BMC Cancer. 2016;16(1):228. | ||
Locatelli E, Monaco I, Comes Franchini M. Surface modifications of gold nanorods for applications in nanomedicine. RSC Adv. 2015;5(28):21681–21699. | ||
Li W, Chen X. Gold nanoparticles for photoacoustic imaging. Nanomedicine. 2015;10(2):299–320. | ||
Manohar S, Ungureanu C, van Leeuwen TG. Gold nanorods as molecular contrast agents in photoacoustic imaging: the promises and the caveats. Contrast Media Mol Imaging. 2011;6(5):389–400. | ||
Huang X, El-Sayed IH, Qian W, El-Sayed MA. Cancer cell imaging and photothermal therapy in the near-infrared region by using gold nanorods. J Am Chem Soc. 2006;128(6):2115–2120. | ||
Alkilany AM, Thompson LB, Boulos SP, Sisco PN, Murphy CJ. Gold nanorods: their potential for photothermal therapeutics and drug delivery, tempered by the complexity of their biological interactions. Adv Drug Deliv Rev. 2012;64(2):190–199. | ||
Yang H, Zhao J, Wu C, Ye C, Zou D, Wang S. Facile synthesis of colloidal stable MoS2 nanoparticles for combined tumor therapy. Chem Eng J. 2018;351:548–558. | ||
Zhao J, Xie P, Ye C, et al. Outside-in synthesis of mesoporous silica/molybdenum disulfide nanoparticles for antitumor application. Chem Eng J. 2018;351:157–168. | ||
Martin RC, Locatelli E, Li Y, et al. Gold nanorods and curcumin-loaded nanomicelles for efficient in vivo photothermal therapy of Barrett’s esophagus. Nanomedicine. 2015;2015(10):1723–1733. | ||
Yamashita T, Budhu A, Forgues M, Wang XW. Activation of hepatic stem cell marker EpCAM by Wnt-beta-catenin signaling in hepatocellular carcinoma. Cancer Res. 2007;67(22):10831–10839. | ||
Locatelli E, Bost W, Fournelle M, et al. Targeted polymeric nanoparticles containing gold nanorods: a therapeutic approach against glioblastoma. J Nanoparticle Res. 2014;16(3):2304. | ||
Wang S, Huang S, Zhao X, et al. Enrichment of prostate cancer stem cells from primary prostate cancer cultures of biopsy samples. Int J Clin Exp Pathol. 2014;7(1):184–193. | ||
Hervé L. Non-negative Matrix Factorization: A Blind Spectra Separation Method for in Vivo Fluorescent Optical Imaging. J Biomed Opt. 2010;15(5):56009. | ||
Hyvärinen A, Karhunen J, Oja E. Independent component analysis. Appl Comput Harmon Anal. 2001;21:135–144. | ||
Armanetti P, Pocoví-Martínez S, Flori A, et al. Dual photoacoustic/ultrasound multi-parametric imaging from passion fruit-like nano-architectures. Nanomedicine. 2018;14(6):1787–1795. | ||
Gentili D, Ori G, Comes Franchini M. Double phase transfer of gold nanorods for surface functionalization and entrapment into PEG-based nanocarriers. Chem Comm. 2009;46(39):5874–5876. | ||
Locatelli E, Comes Franchini M. Biodegradable PLGA-b-PEG polymeric nanoparticles: synthesis, properties, and nanomedical applications as drug delivery system. J Nanopart Res. 2012;14(12):1316. | ||
Li Y, Shi X, Zhang J, Zhang X, Martin RCG. Hepatic protection and anticancer activity of Curcuma: a potential chemopreventive strategy against hepatocellular carcinoma. Int J Oncol. 2014;44(2):505–513. | ||
Huang X, El-Sayed MA. Plasmonic photo-thermal therapy (PPTT). Alex J Med. 2011;47(1):1–9. | ||
Huang X, El-Sayed IH, Qian W, El-Sayed MA. Cancer cell imaging and photothermal therapy in the near-infrared region by using gold nanorods. J Am Chem Soc. 2006;128(6):2115–2120. | ||
Bucharskaya AB, Maslyakova GN, Chekhonatskaya ML, et al. Plasmonic photothermal therapy: approaches to advanced strategy. Lasers Surg Med. 2018;50(10):1025–1033. | ||
Norouzi H, Khoshgard K, Akbarzadeh F. In vitro outlook of gold nanoparticles in photo-thermal therapy: a literature review. Lasers Med Sci. 2018;33(4):917–926. | ||
Aravalli RN, Steer CJ, Cressman ENK. Molecular mechanisms of hepatocellular carcinoma. Hepatology. 2008;48(6):2047–2063. | ||
Yahyazadeh Mashhadi SM, Kazemimanesh M, Arashkia A, et al. Shedding light on the EpCAM: an overview. J Cell Physiol. Epub 2019 Jan 9. | ||
Goldberg SN. Radiofrequency tumor ablation: principles and techniques. Multi-Treatment Modalities of Liver Tumours. Boston, MA: Springer; 2002:87–118. | ||
Li Y, Brown RE, Martin RC. Incomplete thermal ablation of hepatocellular carcinoma: effects on tumor proliferation. J Surg Res. 2013;181(2):250–255. |
Supplementary materials
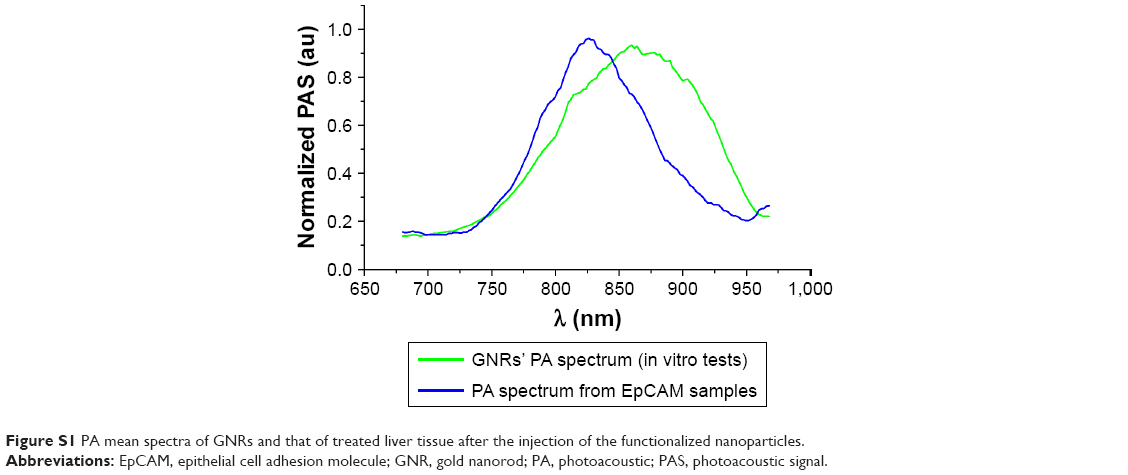 | Figure S1 PA mean spectra of GNRs and that of treated liver tissue after the injection of the functionalized nanoparticles. |
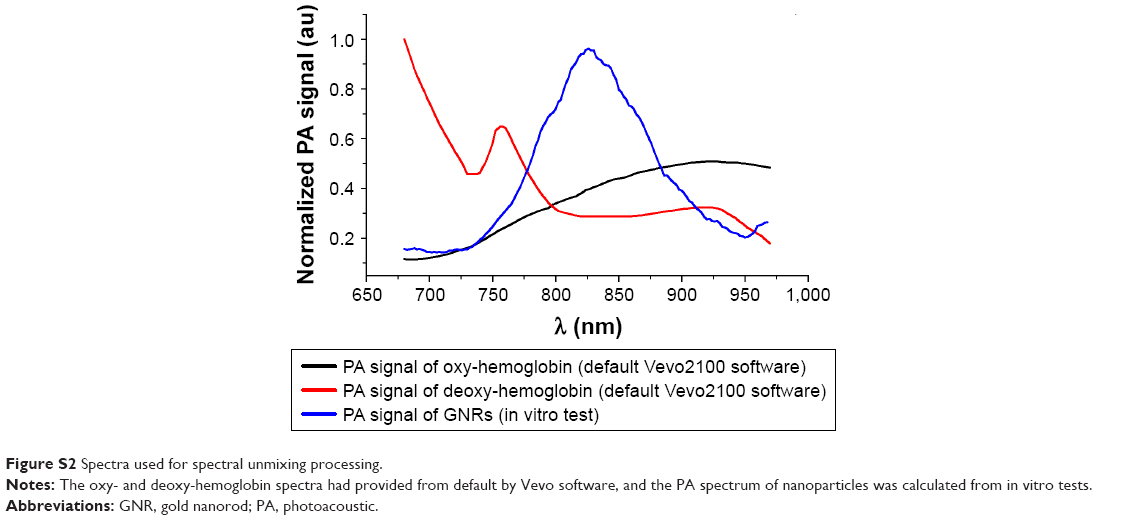 | Figure S2 Spectra used for spectral unmixing processing. |
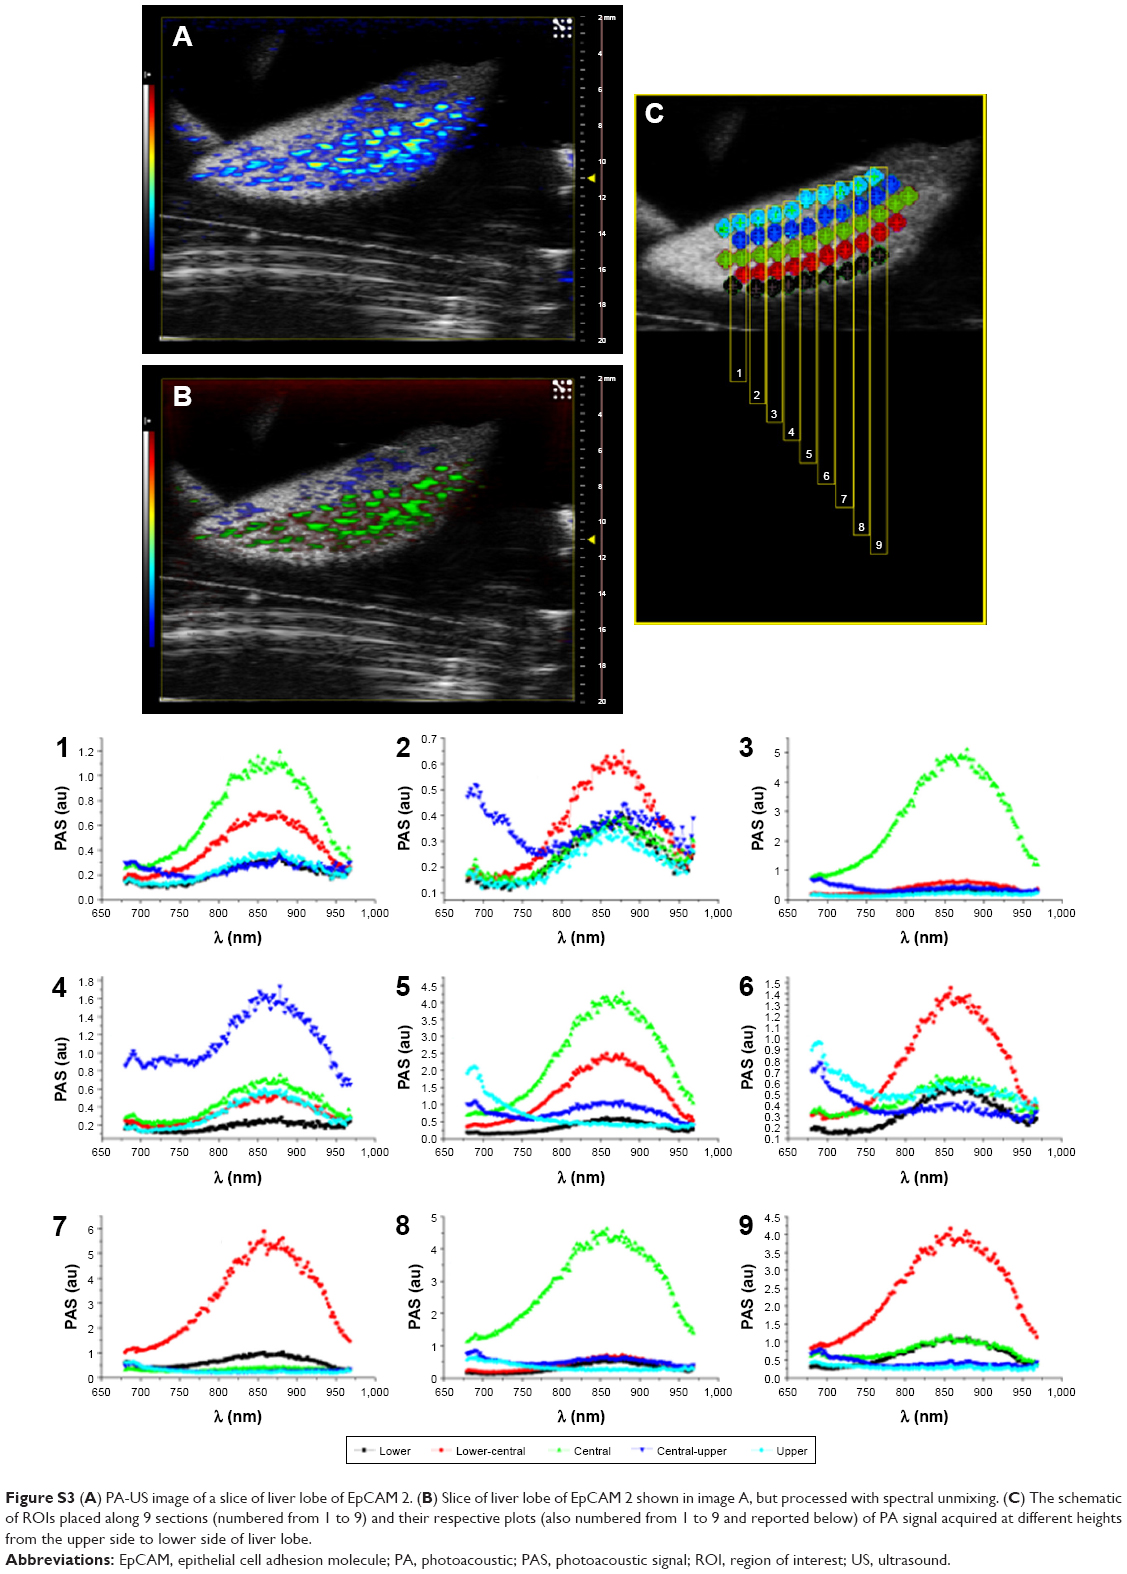 | Figure S3 (A) PA-US image of a slice of liver lobe of EpCAM 2. (B) Slice of liver lobe of EpCAM 2 shown in image A, but processed with spectral unmixing. (C) The schematic of ROIs placed along 9 sections (numbered from 1 to 9) and their respective plots (also numbered from 1 to 9 and reported below) of PA signal acquired at different heights from the upper side to lower side of liver lobe. |
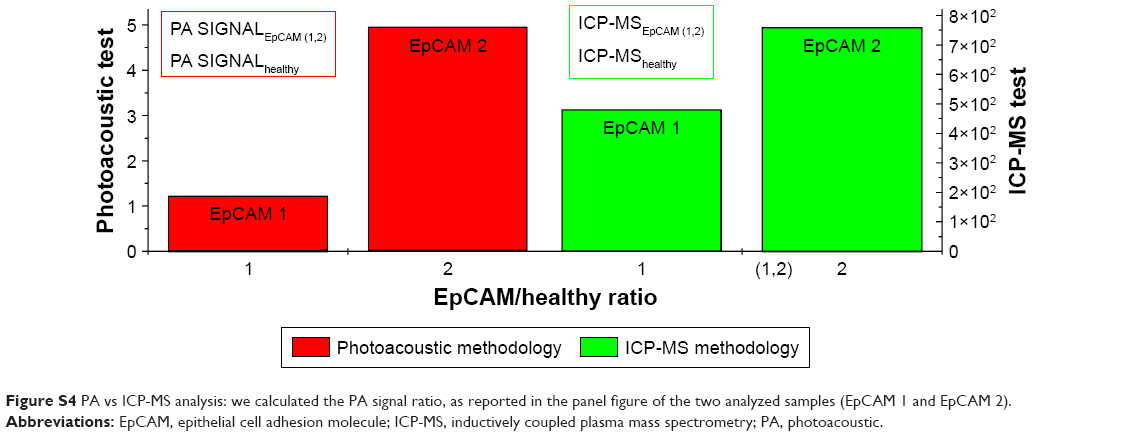 | Figure S4 PA vs ICP-MS analysis: we calculated the PA signal ratio, as reported in the panel figure of the two analyzed samples (EpCAM 1 and EpCAM 2). |
 © 2019 The Author(s). This work is published and licensed by Dove Medical Press Limited. The full terms of this license are available at https://www.dovepress.com/terms.php and incorporate the Creative Commons Attribution - Non Commercial (unported, v3.0) License.
By accessing the work you hereby accept the Terms. Non-commercial uses of the work are permitted without any further permission from Dove Medical Press Limited, provided the work is properly attributed. For permission for commercial use of this work, please see paragraphs 4.2 and 5 of our Terms.
© 2019 The Author(s). This work is published and licensed by Dove Medical Press Limited. The full terms of this license are available at https://www.dovepress.com/terms.php and incorporate the Creative Commons Attribution - Non Commercial (unported, v3.0) License.
By accessing the work you hereby accept the Terms. Non-commercial uses of the work are permitted without any further permission from Dove Medical Press Limited, provided the work is properly attributed. For permission for commercial use of this work, please see paragraphs 4.2 and 5 of our Terms.