")
Back to Journals » Drug Design, Development and Therapy » Volume 10
A clinical prognostic scoring system for resectable gastric cancer to predict survival and benefit from paclitaxel- or oxaliplatin-based adjuvant chemotherapy
Authors Qian J, Qian Y, Wang J, Gu B, Pei D, He S, Zhu F, Røe O, Xu J, Liu L, Gu Y, Guo R, Yin Y, Shu Y, Chen X
Received 18 May 2015
Accepted for publication 9 October 2015
Published 24 February 2016 Volume 2016:10 Pages 241—258
DOI https://doi.org/10.2147/DDDT.S88743
Checked for plagiarism Yes
Review by Single anonymous peer review
Peer reviewer comments 3
Editor who approved publication: Prof. Dr. Wei Duan
Jing Qian,1,* Yingying Qian,1,* Jian Wang,1 Bing Gu,2,3 Dong Pei,1 Shaohua He,1 Fang Zhu,1 Oluf Dimitri Røe,4–7 Jin Xu,8 Lianke Liu,1 Yanhong Gu,1 Renhua Guo,1 Yongmei Yin,1 Yongqian Shu,1 Xiaofeng Chen1
1Department of Oncology, The First Affiliated Hospital of Nanjing Medical University, Nanjing, 2Department of Laboratory Medicine, The Affiliated Hospital of Xuzhou Medical College, 3Medical Technology Institute, Xuzhou Medical College, Xuzhou, People’s Republic of China; 4Department of Cancer Research and Molecular Medicine, Norwegian University of Science and Technology (NTNU), Trondheim, Norway; 5Department of Oncology, Clinical Cancer Research Center, 6Department of Clinical Medicine, Aalborg University Hospital, Aalborg, Denmark; 7Department of Surgery, Cancer Clinic, Levanger Hospital, Nord-Trøndelag Hospital Trust, Levanger, Norway; 8Department of Molecular Cell Biology and Toxicology, Jiangsu Key Lab of Cancer Biomarkers, Prevention & Treatment, Cancer Center, Nanjing Medical University, Nanjing, People’s Republic of China
*These authors contributed equally to this work
Background: Gastrectomy with D2 lymphadenectomy is a standard procedure of curative resection for gastric cancer (GC). The aim of this study was to develop a simple and reliable prognostic scoring system for GC treated with D2 gastrectomy combined with adjuvant chemotherapy.
Methods: A prognostic scoring system was established based on clinical and laboratory data from 579 patients with localized GC without distant metastasis treated with D2 gastrectomy and adjuvant chemotherapy.
Results: From the multivariate model for overall survival (OS), five factors were selected for the scoring system: ≥50% metastatic lymph node rate, positive lymphovascular invasion, pathologic TNM Stage II or III, ≥5 ng/mL preoperative carcinoembryonic antigen level, and <110 g/L preoperative hemoglobin. Two models were derived using different methods. Model A identified low- and high-risk patients for OS (P<0.001), while Model B differentiated low-, intermediate-, and high-risk patients for OS (P<0.001). Stage III patients in the low-risk group had higher survival probabilities than Stage II patients. Both Model A (area under the curve [AUC]: 0.74, 95% confidence interval [CI]: 0.69–0.78) and Model B (AUC: 0.79, 95% CI: 0.72–0.83) were better predictors compared with the pathologic TNM classification (AUC: 0.62, 95% CI: 0.59–0.71, P<0.001). Adjuvant paclitaxel- or oxaliplatin-based or triple chemotherapy showed significantly better outcomes in patients classified as high risk, but not in those with low and intermediate risk.
Conclusion: A clinical three-tier prognostic risk scoring system was established to predict OS of GC treated with D2 gastrectomy and adjuvant chemotherapy. The potential advantage of this scoring system is that it can identify high-risk patients in Stage II or III who may benefit from paclitaxel- or oxaliplatin-based regimens. Prospective studies are needed to confirm these results before they are applied clinically.
Keywords: gastric carcinoma, prognostic factor, TNM classification, paclitaxel, oxaliplatin
Introduction
Gastric cancer (GC) is the fourth most common cancer, ranking second in cancer-related deaths worldwide. People’s Republic of China alone accounts for 42% of the total incidence of the disease.1 Despite the improved prognosis of patients with GC due to early diagnosis, radical surgery, and development of chemotherapy, the 5-year survival rate across all stages is <40%, except in Japan and South Korea, where the rates are higher.2,3 Surgery is the main curative treatment for localized disease. However, approximately one-third of patients undergoing radical resections relapse with a recurrence rate as high as 70% in advanced GC.4 To prevent recurrence, peri and postoperative therapy is widely used, but practices vary between countries due to different results in different populations.5 In Japan and in People’s Republic of China, adjuvant chemotherapy is recommended as the most frequent option for resectable GCs without distant metastases.6,7
Although adjuvant chemotherapy has been proved to improve survival and reduce relapse after curative resection in some large-scale Phase III trials,7–9 its limited survival benefit and impaired quality of life require a personalized evaluation of individual patients before commencing adjuvant chemotherapy. Identification of distinct prognostic factors could, therefore, facilitate optimization of treatment and improve survival after curative resection.
The pathologic TNM (pTNM) classification for GC formulated by the International Union Against Cancer (UICC)/American Joint Committee on Cancer (AJCC)10 is the current gold standard for therapeutic decision making and prognostic assessment in the adjuvant setting. However, the mortality risk varies substantially within stages, indicating a need of improved predictors for GC.11 Tumor size is also a well-known prognostic factor in patients, which has been shown to be a substitute for tumor invasion (T) in the pTNM staging system.12–17 In addition, the prognostic value of the number of involved lymph nodes (LNs) has been questioned, given that LN retrieval is frequently insufficient.18,19 Therefore, the lymph node ratio (LNR) has been proposed to address the problem.18–24 In addition to pTNM classification, serum tumor markers and hematological parameters easily accessible to clinicians preoperatively have been suggested to display prognostic potential in GC, eg, increased levels of carcinoembryonic antigen (CEA) and carbohydrate antigen 19-9 (CA19-9) and decreased levels of hemoglobin (Hb) or elevated white blood cell (WBC) count before treatment.25–29
Most of the previous prognostic studies focused only on a few variables, with limited prognostic accuracy. In the current study, we aimed to establish a more accurate and a practical, prognostic risk assessment scoring system by incorporating some of these clinical prognostic factors into the pTNM stage classification. Our findings may enable prediction of the benefit of adjuvant chemotherapy in subgroups of GC patients undergoing radical resection with a curative intent.
Materials and methods
Patient selection
The medical records of The First Affiliated Hospital of Nanjing Medical University were retrospectively searched from January 1, 2008, to August 31, 2012. Cases were included if they fulfilled the following criteria: pathologically verified locoregional GC without distant metastasis (Stage II, III, or I, except T1a) with risk factors including poor differentiation and lymphovascular or neural invasion; D2 lymphadenectomy with >15 LNs retrieved; at least two cycles of chemotherapy within at most 2 months after surgery; and available surgical pathological data, routine blood tests, and tumor markers CEA and CA19-9. Exclusion criteria were synchronous malignancies or gastrointestinal stromal tumor; neoadjuvant treatment or adjuvant radiochemotherapy; and incomplete clinicopathological data. The protocol was approved by the First Affiliated Hospital of Nanjing Medical University Ethics Committee prior to study initiation. Written informed consent was obtained from all patients.
Data collection and follow-up
Serum samples were obtained for the analysis of CEA25,26,30–32 and CA19-929 levels by enzyme immunoassay, and blood routine tests (WBC, red blood cell count, platelet count, and Hb level) were conducted within 1 week prior to surgery. Postoperative histological findings, including stage, grading, Borrmann type, tumor size, invasion depth, primary tumor location, positive LN number, metastatic LNR, lymphovascular invasion (LVI), perineural involvement (PNI), and resection margin that have been proposed as prognosticators,18,28,29,33–43 were determined retrospectively according to the 2010 UICC-pTNM stage10 by Cong Wang and Xiao Li (Pathology Department, The First Affiliated Hospital of Nanjing Medical University). The tumor size was defined by the longest diameter. Patient records and operation notes were reviewed for demographic data, operative details, and chemotherapy for a preoperative assessment of physical status (The American Society of Anesthesiologists score),44 type of gastrectomy, surgical complications, death within the first month after surgery due to postoperative complications, and adjuvant chemotherapy regimens. The date of surgery was regarded as the starting point of the survival follow-up until August 31, 2014. Overall survival (OS) was defined as the period from surgery to death or the last follow-up. Follow-up data were acquired from patient records, death certificates, or patients and their families by telephone calls. Patients underwent similar follow-up examinations at regular intervals. Data of patients without any event were censored as were the date of the final observation.
Cutoff determination
Cutoff values of serum levels of CEA and CA19-9 recommended by the manufacturers were 5 ng/mL and 35 units/mL, respectively.26,45 For blood routine analyses, 4×10⁹ cells/L, 4×10¹² cells/L, 110 g/L, and 300×109 cells/L were employed as cutoff points for WBC, red cell blood, Hb level, and platelet count, respectively, according to the latest standards published by the Ministry of Health of People’s Republic of China. A tumor size of 6 cm and LNR of 50% were determined as cutoffs, using the median values.
Statistics
Differences among groups were compared by chi-square and regarded as significant when P<0.05. Survival curves were visualized by the Kaplan–Meier method and examined by a log-rank test. Prognostic value of clinicopathological parameters was determined by multivariate analysis using Cox proportional hazards regression models with stepwise forward likelihood ratio selection (enter 0.05/0.1). In the final prognostic model, interactions were tested and the proportional hazard hypothesis was verified. A cross-validation technique was used to avoid overfitting of the final Cox regression model, which creates a resampling simulation set of at least 100 to obtain the Harrell’s concordance index (c-index).46
Each risk factor was assigned to a value derived from corresponding coefficients of significant variables from the multivariate Cox’s model by division by the smallest coefficient B and rounding to the nearest integer.47 Two risk score models were developed using different methods. The total risk score was determined by the sum of values of single factors. For Model A, the optimal cutoff point was determined by the maximally selected log-rank statistics, according to a previous study.48 For Model B, the prognostic score was grouped into three classes with an equal distance range of values. The area under the curve (AUC) was applied to both models by receiver–operating characteristic curve to further compare their prognostic value.49 All analyses were conducted using SPSS Version 18.0 statistical software (IBM Corporation, Armonk, NY, USA) and R Statistical Language Version 2.9 (R Foundation for Statistical Computing, Vienna, Austria).
Results
Patients and participants
A total of 579 patients were included in the study according to the prespecific eligibility criteria (Figure S1). The clinicopathological characteristics of patients are presented in Table 1. The primary tumor location sites included corpus (39%) and antrum (31.6%). Majority of the patients had adenocarcinoma (96.9%), poor differentiation (84.8%), T4 (57.3%), LN metastasis (74.6%) with The American Society of Anesthesiologists score <2 (98.9%), and had received adjuvant chemotherapy (regimen in Table S1) following subtotal gastrectomy (61.3%) plus D2 lymphadenectomy (92.1%). The incidence of postoperative complications was 37.0%. The rate of surgical mortality was 15.1%. The adjuvant chemotherapy regimens are displayed in Table S1, and 331 (57.2%) patients completed the prespecified regimens (Table S1). At an interval of 4–8 weeks after surgery, patients received adjuvant chemotherapy (median duration: 4 months, range: 2–8.5 months). The detailed dosing and regimens are shown in Table S2.
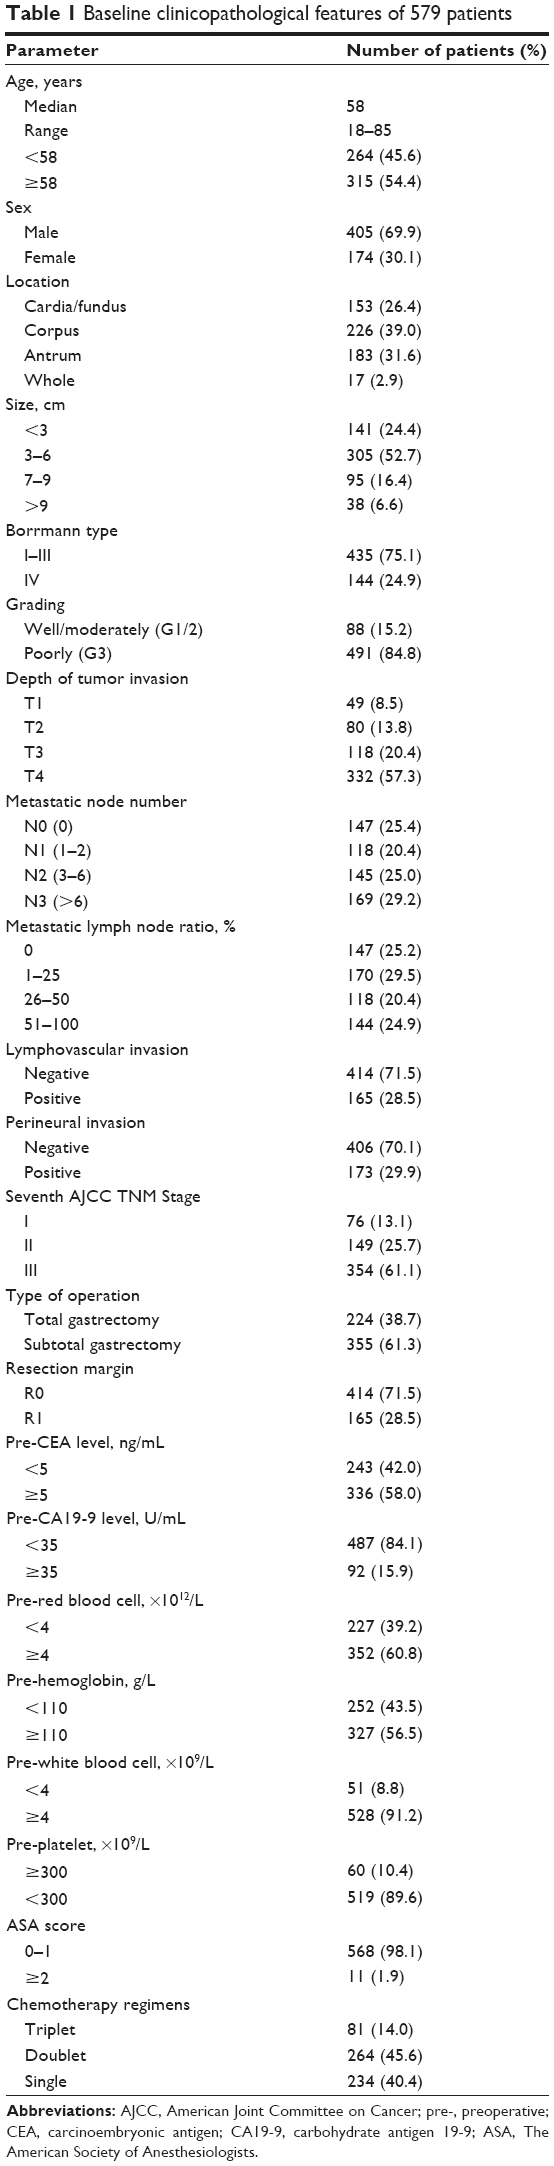 | Table 1 Baseline clinicopathological features of 579 patients |
Survival analysis
During a median follow-up of 44 months (range: 12–81 months), a total of 236 patients (41.8%) died and 16 (2.8%) were lost to follow-up. The median OS (mOS) was 52.4 months (95% confidence interval [CI]: 49.8–54.9 months), and 3- and 5-year survival rates were 62.9% and 50.1%, respectively. Eleven patients (1.9%) died of noncancer-related causes within the observation period.
Univariate analysis of baseline characteristics and laboratory factors revealed that tumor grade, depth of tumor invasion, tumor size, metastatic LN number, LNR, LVI, PNI, pTNM stage, surgical margin, type of gastrectomy, preoperative CEA, CA19-9, and Hb levels significantly affected OS (Figure 1 and Table 2). Variables were then selected by a forward stepwise selection method (P=0.05) with five factors showing independent correlation with poor prognosis in multivariate Cox regression model: LNR ≥50%, LVI positive, TNM Stage II or III, preoperative-CEA level ≥5 ng/mL, and preoperative Hb <110 g/L (Table 2). Cross-validation was further performed on the determined Cox model and a c-index value of 0.78 was acquired.
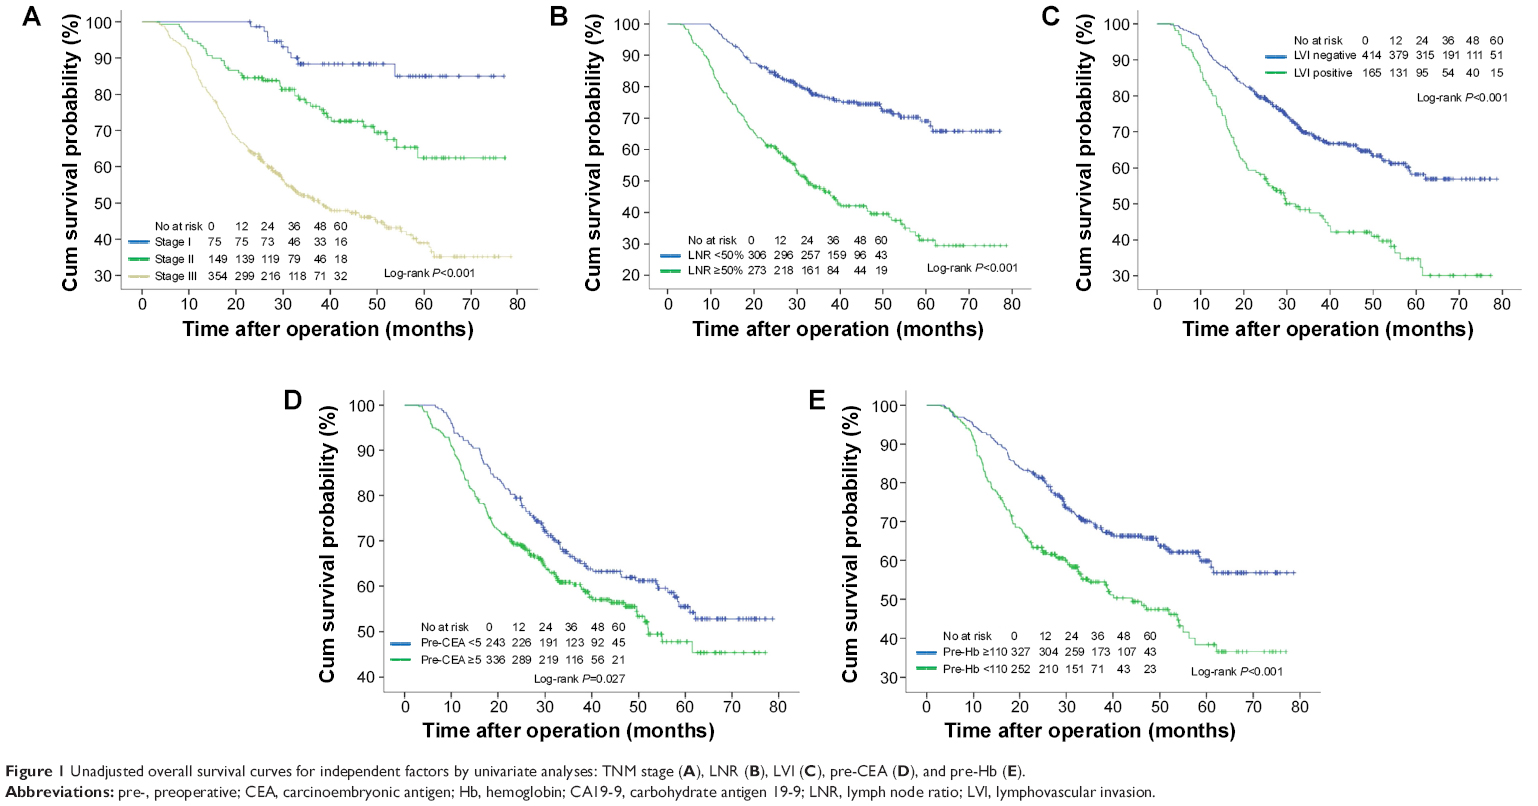 | Figure 1 Unadjusted overall survival curves for independent factors by univariate analyses: TNM stage (A), LNR (B), LVI (C), pre-CEA (D), and pre-Hb (E). |
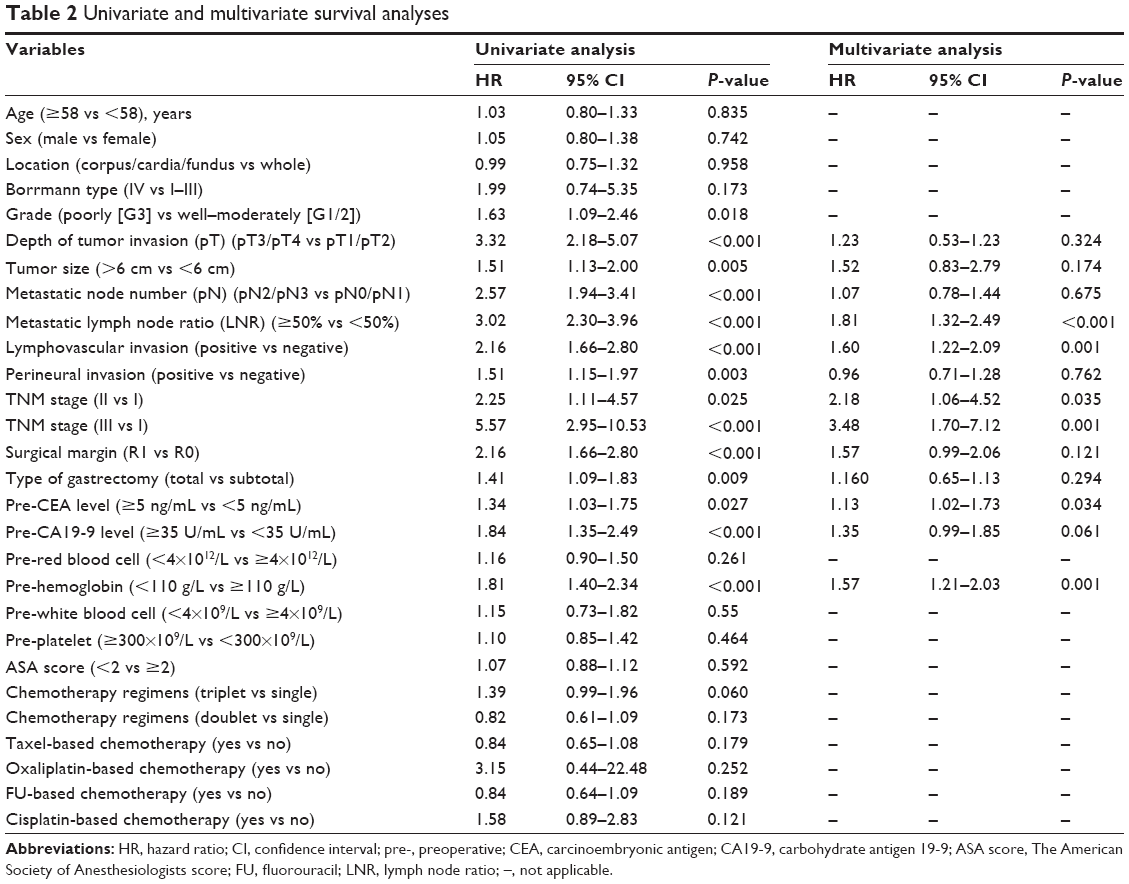 | Table 2 Univariate and multivariate survival analyses |
Prognostic scoring system
According to the results from the multivariate analysis, five factors were selected for the final prognostic scoring system. Each factor was assigned a score (points) ranging from 0 to 3, according to their hazard ratios (HRs; Table 3). Based on these points, we developed two risk stratification models for Stage I–III tumors. For Model A, the optimal cutoff point of dichotomization score was derived from the maximally selected log-rank statistics (Figure S2): 1) low risk of death: 0–6 (n=379) and 2) high risk of death: >6 (n=200). While three groups in Model B were cutoff by tertiles of the maximal total score: 1) low-risk group: <4 (n=152); 2) intermediate-risk group: 4–7 (n=289); and 3) high-risk group: >7 (n=138).
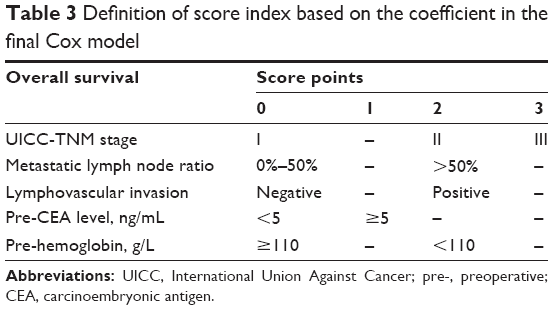 | Table 3 Definition of score index based on the coefficient in the final Cox model |
The survival analysis for risk score groups using the Kaplan–Meier method is presented in Table 4 and Figure 2. In Model A, the low-risk group (score 0–6) had a consistent and significantly better outcome than the high-risk group (score >6) (5-year survival: 64.6% and 20.8%, respectively, log-rank P<0.001). The mOS rates were 61.0 months (95% CI: 58.2–63.8 months) and 29.9 months (95% CI: 20.3–31.4 months), respectively. A prognostic difference was seen among three groups in Model B. The 5-year survival probability in Model B for patients in the low-risk group was 78.6%, significantly higher than that in intermediate-risk (50.5%, P<0.001) and high-risk groups (16.2%, P<0.001). The mOS rates were 66.4 months (95% CI: 63.0–69.8 months), 51.6 months (95% CI: 47.7–55.4 months), and 29.3 months (95% CI: 22.5–36.2 months), respectively.
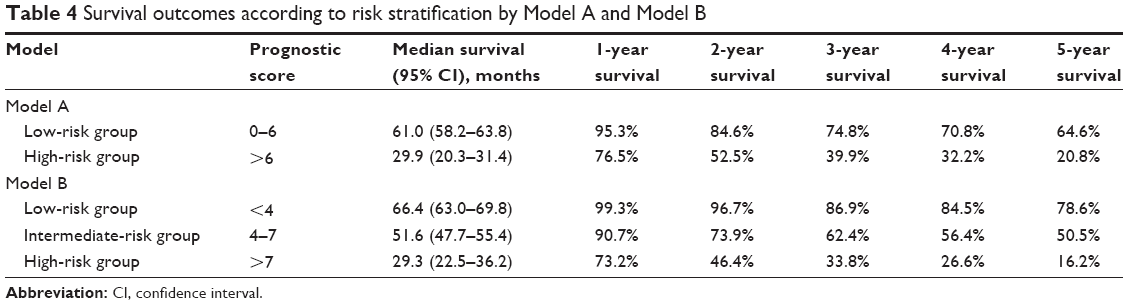 | Table 4 Survival outcomes according to risk stratification by Model A and Model B |
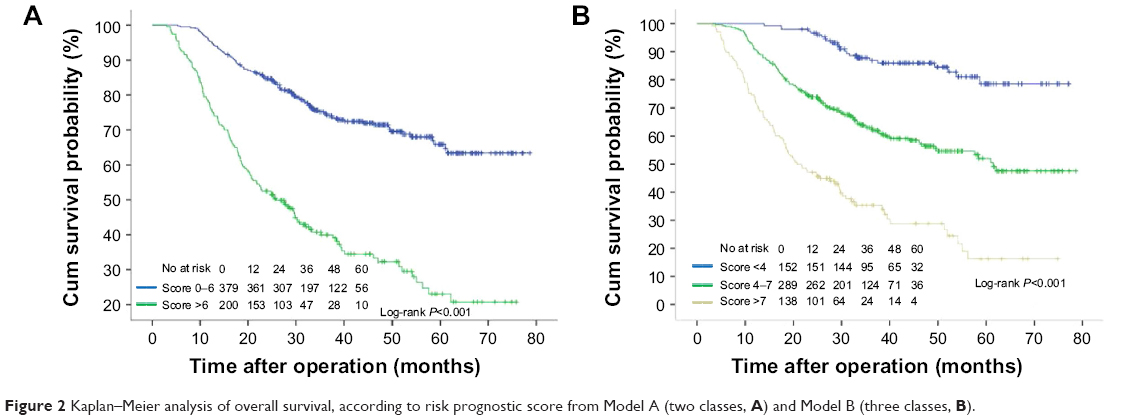 | Figure 2 Kaplan–Meier analysis of overall survival, according to risk prognostic score from Model A (two classes, A) and Model B (three classes, B). |
Receiver–operating characteristic curve analysis was adopted to further assess the prognostic performances. Both Model A (AUC: 0.74, 95% CI: 0.69–0.78) and Model B (AUC: 0.79, 95% CI: 0.72–0.83) showed a significantly higher prognostic performance compared with the TNM classification alone (AUC: 0.62, 95% CI: 0.59–0.71, P<0.001) (Figure S3).
We analyzed the 5-year survival probability predicted by the scoring system within each TNM stage (Figure 3). Both Model A and Model B had different 5-year survival probabilities in each stage (I–III). Moreover, in Model A, patients who were Stage III and in the low-risk group had higher survival probabilities than those who were Stage II. Similarly, in Model B, patients who were Stage III, but at low or intermediate risk, had better survival probability than those who were Stage II.
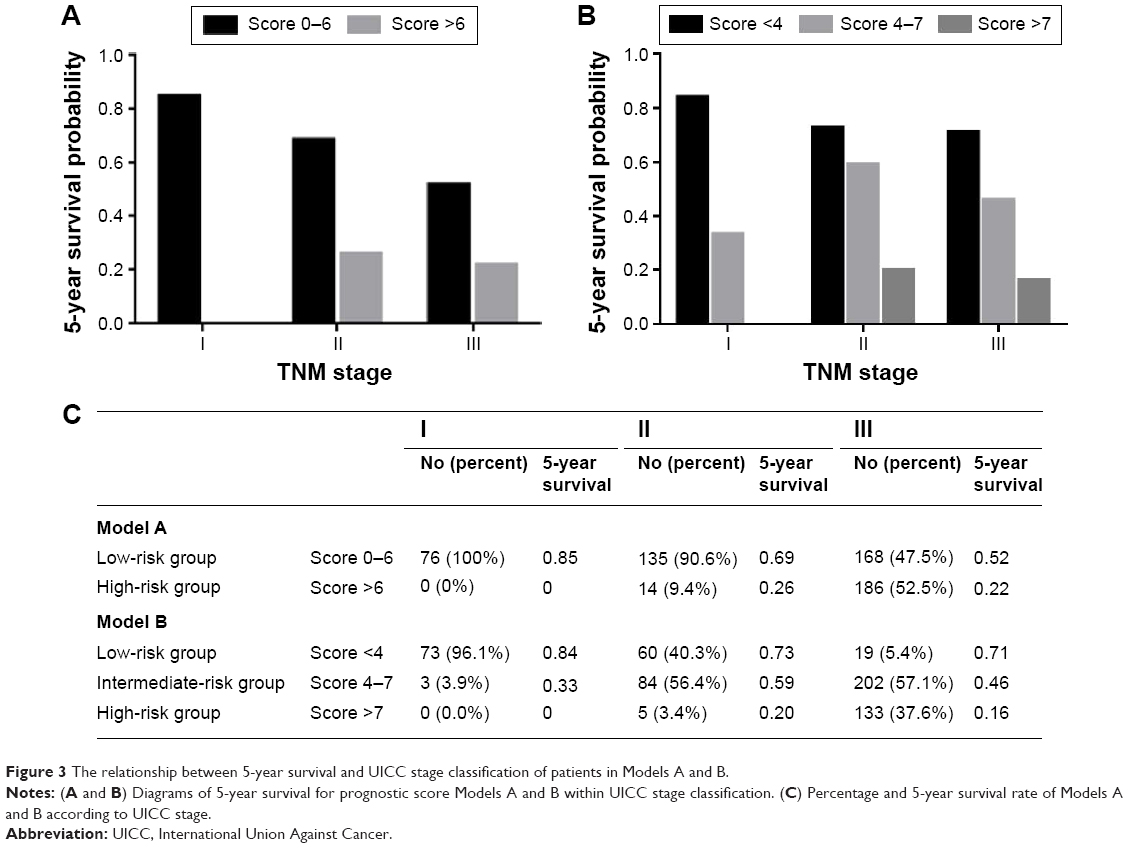 | Figure 3 The relationship between 5-year survival and UICC stage classification of patients in Models A and B. |
To further evaluate the role of the prognostic score within diverse adjuvant chemotherapy regimens, we also analyzed the survival difference of paclitaxel- (Taxol), oxaliplatin-, and cisplatin-based chemotherapies stratified by Model A (Figure 4) and Model B (Figure S4). The data showed that patients who received paclitaxel had better outcomes, but only in the high-score group (Model A score >6, log-rank P=0.001). No difference was observed in the low-score group (Model A score 0–6, log-rank P=0.169). A similar trend was found regarding oxaliplatin (Model A score 0–6, log-rank P=0.697; score >6, P=0.002). In Model B, patients in the high-risk group also seemed to benefit from paclitaxel- or oxaliplatin-based chemotherapy, but not those in the low- and intermediate-risk groups. In addition, patients in both low- and high-risk groups did not achieve any survival benefit from cisplatin-based chemotherapy in Model A and Model B. Given that only five patients did not receive 5-fluorouracil, the survival data could not be analyzed. The prognostic value of the number of cytotoxic agents was also examined within Model A and Model B. Triple chemotherapy correlated with a better prognosis compared with dual combination or monotherapy, but again only in high-risk subgroups according to Model A and Model B (Figure 5).
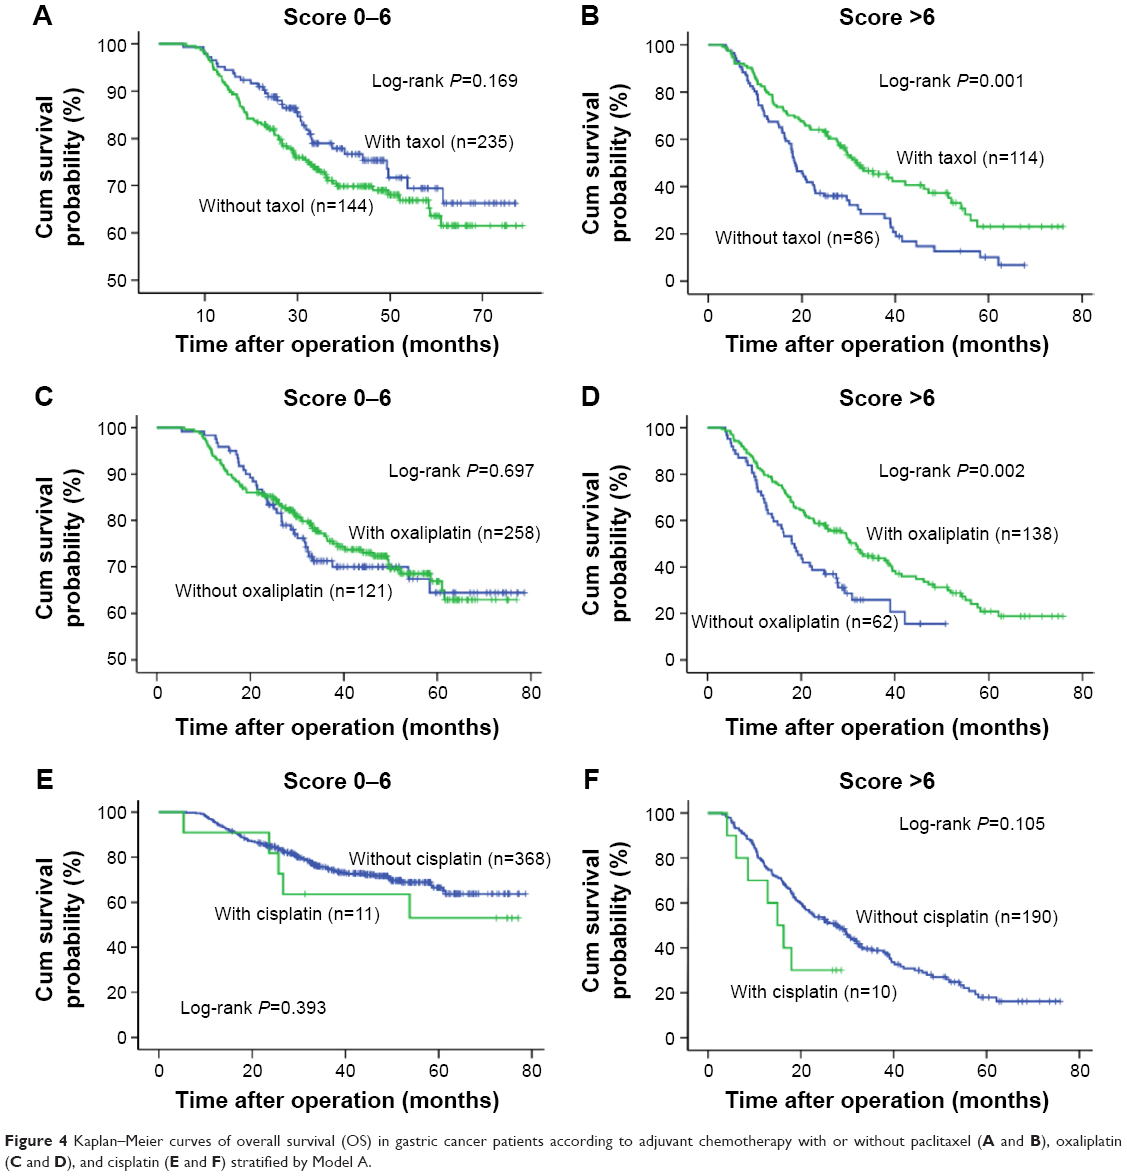 | Figure 4 Kaplan–Meier curves of overall survival (OS) in gastric cancer patients according to adjuvant chemotherapy with or without paclitaxel (A and B), oxaliplatin (C and D), and cisplatin (E and F) stratified by Model A. |
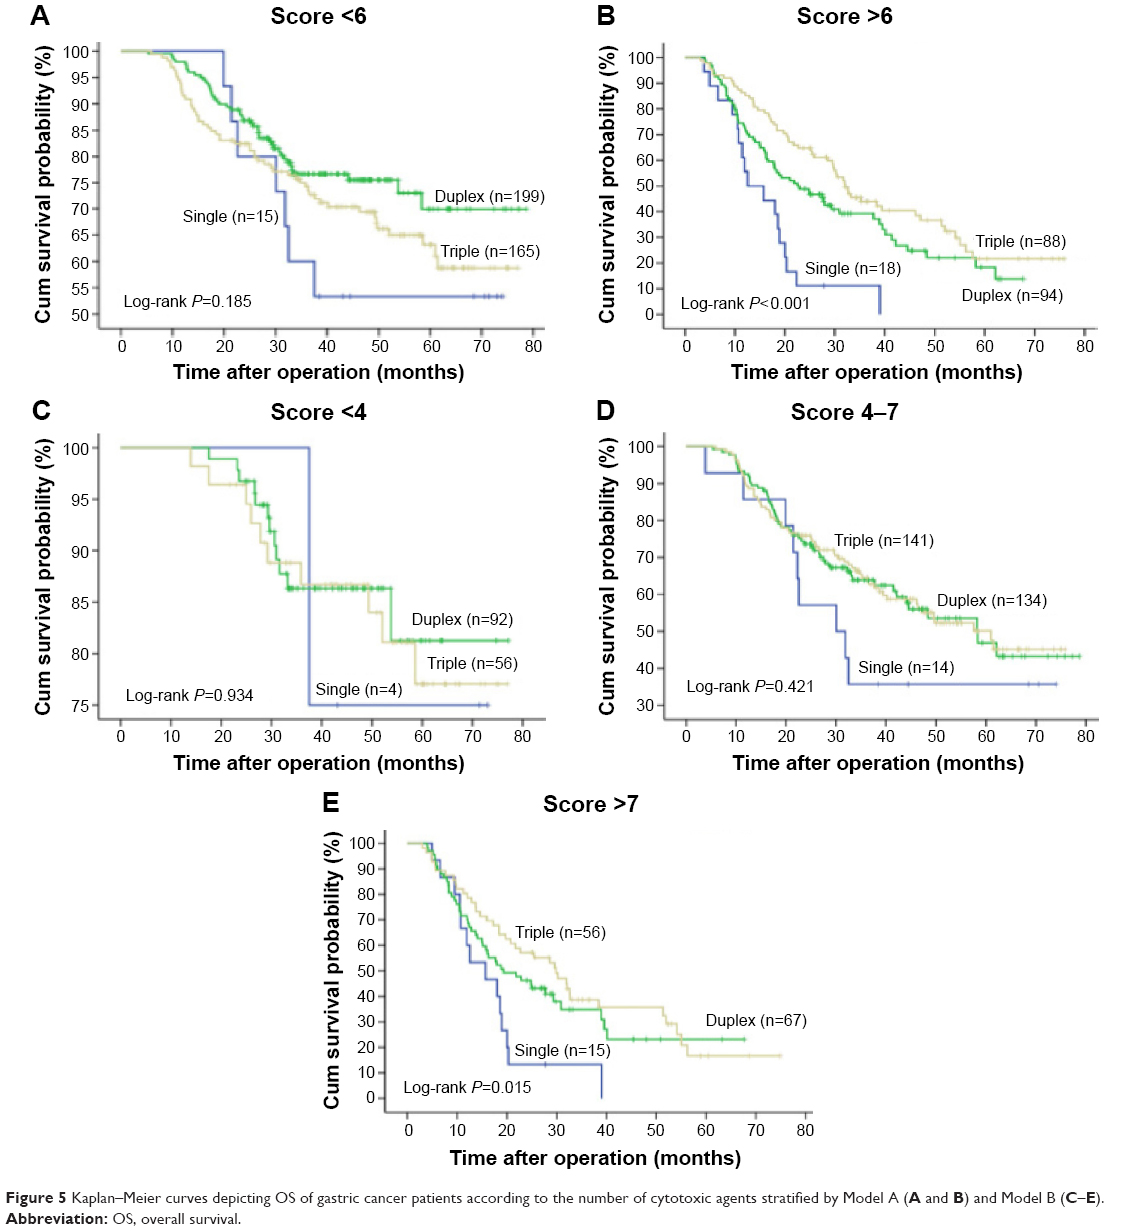 | Figure 5 Kaplan–Meier curves depicting OS of gastric cancer patients according to the number of cytotoxic agents stratified by Model A (A and B) and Model B (C–E). |
Discussion
Prognostic tools for the treatment of resectable GC are very important in selecting the best strategy and improving outcome. In the current study, we analyzed a large GC cohort retrospectively and developed two clinical prognostic models that improved the pTNM identification of high-risk subgroups that benefit from adjuvant chemotherapy. Both the models significantly discriminated the outcomes of patients, but the three-class Model B (AUC: 0.79) had a higher accuracy in long-term prognosis than Model A (AUC: 0.74). Therefore, the scoring system with the three-class model is recommended for predicting prognosis.
Although the benefit of gastrectomy for patients with resectable GC is clear, and that some kind of neoadjuvant, perioperative chemotherapy, or adjuvant therapy is needed to improve the survival,50–53 there is no international consensus on the best approach, resulting in varying guidelines in countries and regions.5 Several recent randomized controlled studies conducted in Asia7–9,54 showed significantly improved OS and progression-free survival after adjuvant chemotherapy, which thus became a treatment of choice in patients with resectable GC in these populations. Given the limited survival benefit and also the considerable adverse effects of adjuvant chemotherapy,7–9,11,54 accurate assessment of individual prognosis is important in making a therapeutic choice.
Among the several proposed prognostic factors, pTNM staging is the most widely used as it displays a strong prognostic value for GC. However, due to the limitations associated with pTNM staging, several alternative prognostic models for GC have been proposed,55–58 which showed improved prognostic ability. Some prognostic models have focused upon resectable gastric carcinoma. Becker et al55 investigated neoadjuvant-treated GC. Kattan et al proposed a nomogram predicting disease-free survival (DFS) after an R0 resection for gastric carcinoma.43 A multi-institutional cohort of gastric adenocarcinoma patients in USA was analyzed for nomogram to predict OS and DFS after R0 curative resection.58 Han et al built a prognostic nomogram of long-term survival after D2 lymphadenectomy of gastric carcinoma in Asian populations.59 However, to our knowledge, neither a prognostic model for adjuvant chemotherapy nor the role of preoperative serum markers has been published in this setting. Given the essential role of D2 gastrectomy60–62 and the survival benefit from adjuvant chemotherapy for resectable gastric carcinoma,7–9,54 we developed prognostic models for Chinese patients treated with standard D2 gastrectomy and adjuvant chemotherapy.
One major finding of this study is that the current scoring system identified patients with different long-term prognoses within each pTNM stage (I–III), suggesting that a number of high-risk patients are understaged using only the pTNM classification. These high-risk subgroups eventually benefit from a more intensive postoperative treatment.
Moreover, although the survival benefits from adjuvant treatment with various combinations of fluorouracil, oxaliplatin, and paclitaxel have been demonstrated for patients after gastrectomy in several recent randomized controlled trials,7–9,54 no consensus has been reached on the optimal treatment schedule. In general, for advanced disease, dual combinations are preferred. However, in selected patients, for example, those with a high tumor burden, triple regimens resulted in higher response rates and enhanced efficacy.63–65 In this study, we analyzed the prognostic value of a number of adjuvant cytotoxic agents and regimens, which were found to be independent prognostic factors. This result is similar to those of a previous study.59 However, when stratified by the current scoring system, high-risk patients (Model A: score >6 and Model B: score >7) obtained survival benefits from postoperative treatment with paclitaxel or oxaliplatin, while low-risk patients did not. Additionally, triple combination prolonged the outcome of high-risk patients compared with dual or single chemotherapy, but not for the low-risk subpopulation. Importantly, the variables included in the current scoring system were all confirmed prognostic factors that are usually available and easily accessible in the daily practice. Therefore, compared with high-throughput biomarker analysis, the current system is more simple, practical, and cost-effective.
LN metastasis confers poor prognosis in malignancies. In the TNM staging system, the N category was on the basis of the absolute number of involved nodes and can be influenced by the number of LNs retrieved.18,19 According to some studies, 15 LNs is the minimum number of harvested LNs for optimal LN assessment.18,19,66 Insufficient LN retrieval could result in stage migration, which might deprive postoperative patients of adjuvant therapy with poor prognosis as a consequence.20 In contrast, LNR showed little dependence on the number of LN resected and was superior to LN evaluation in GC.18,19,21,67 Our data also revealed that LNR has a stronger predictive potential than N category in local GC after D2 lymphadenectomy and adjuvant chemotherapy. The group of LNR <50% presented a significantly longer mOS (61.9 months vs 30.7 months) and 5-year survival (51.39% vs 18.1%) compared with the group of LNR >50% (P<0.0001). LNR is also a predictive factor for adjuvant chemotherapy in our system, which was supported by several previous studies. Significant benefits from postoperative chemoradiotherapy were achieved in the resected NSCLC patients with LNR >0.31 compared with adjuvant chemotherapy alone or no adjuvant therapy.68 A recent multicenter prospective study in the UK showed that colon cancer treated with curative resection, with a LNR within 0.05–0.19, was an indication for adjuvant chemotherapy.69 Advanced GC patients with LNR >0.65 showed a 3-year DFS following the adjuvant chemoradiation than the chemotherapy alone.70 Nevertheless, the optimal cutoff of LNR remains to be further validated in various scenarios.
LVI, indicating aggressive behavior of carcinomas, is an established strong negative prognostic factor,71,72 which was confirmed by our data. LVI also indicates the need for adjuvant therapy in gastric malignancies.73 In a study of 1,880 patients with Stage I GC, T2N0 with positive LVI may be candidates for adjuvant chemotherapy.73 In another larger data set of Stage I GC after curative resection, six risk factors, including age, sex, Stage IB, LVI, PNI, and elevated CEA level, were selected to identify the subgroup with high risk of recurrence or death, who may gain benefits of adjuvant chemotherapy.72
Elevated levels of serum CEA and CA19-9 have been used as markers to detect cancer progression after surgery.27 However, the prognostic value of preoperative CEA in GC is still debated.25–27,29,31,32,45,72 In the present study, despite a low HR for CEA compared with CA19-9 according to univariate analysis, elevated preoperative levels of CEA had a higher prognostic value than CA19-9 in the multivariate analysis. This phenomenon was probably due to other confounding factors affecting the unadjusted HR. Significant differences in the 3- and 5-year survival rates and median survival rates were also observed when comparing positive and negative levels of serum CEA (Figure 1D). High preoperative CEA levels can also be used to monitor the efficacy of paclitaxel in patients with advanced breast cancer and non-small cell lung cancer,30,74,75 assess response to irinotecan-based chemotherapy in metastatic colorectal cancer patients,76,77 and predict disease progression after irinotecan-containing neoadjuvant chemotherapy in GC.78 These are consistent with the current results that a score containing CEA can help predict the survival benefit of adjuvant chemotherapy. Preoperative CEA levels should thus be considered when selecting further chemotherapy after curative gastrectomy for gastric carcinoma.
Although posttherapy anemia mainly results from chemotherapy-induced myelosuppression, renal-related erythropoietin deficiency, or marrow involvement,79 anemia at diagnosis may be predominately due to chronic bleeding or nutritional dysfunction, consequently leading to poor tolerability of adjuvant chemotherapy and shorter survival.80 Preoperative low Hb level has been proposed as an independent prognostic factor for several cancers in recent studies.37,81–83 In gastric malignancy, iron-deficiency anemia was most frequent after gastrectomy84 and predicted an increased risk of developing surgical complications37 and unfavorable outcomes.81–83 In addition, preoperative anemia has been linked to poor control during paclitaxel-based chemotherapy, which was possibly due to paclitaxel-induced HO-1 gene expression,85 a microsomal enzyme catalyzing the breakdown of heme.86,87 Supporting this, preoperative Hb <110 g/L was closely associated with a poor outcome in our cohort with a mOS of 62.1 months compared with 52.0 months in patients with Hb >110 g/L. Preoperative Hb level could be informative in selecting optimal subpopulation who could most benefits from the specific chemotherapy regimen.
Our prognostic model with both preoperative and postoperative data could not account for other scenarios, eg, neoadjuvant, perioperative chemotherapy, or adjuvant radiochemotherapy. The prognostic value of preoperative data is appealing, as it can be used to predict the response of treatment prior to pre and perioperative approaches. However, considering the essential role of adjuvant chemotherapy in Asian patients with radically resected GC compared with those in USA and Europe,6,88–93 we felt the need to analyze the case of postoperative chemotherapy. Our postoperative data combined with preoperative data could be utilized for response prediction and patient selection before commencing adjuvant chemotherapy. Pre and perioperative treatments require additional investigation. Prognostic scoring systems are not “one-size fits all” and need to be tailored to various settings.
Given the discrepancy of surgical techniques and pathological examinations, and the differences in serum detection criteria and methods, our system cannot be generalized to other settings. In addition, there are other study limitations. First, comorbidity was not considered in the current model, although OS was defined as the final point. OS can be affected by comorbidity. Although carcinoma was the most frequent cause of death, to minimize the effect of comorbidity on the outcome, patients with synchronous malignancies were excluded from the study, and only eleven subjects died of noncancer causes before the end point. Therefore, comorbidity likely exerted little influence on the model. Second, some biological markers have recently been identified as prognostic factors, including Her2 (human epidermal growth factor receptor-2),94,95 Fhit (fragile histidine triad),47,96 TP53 mutations,97,98 and CDH1 (E-cadherin).99,100 In the future, biological markers will be inevitably incorporated in the decision-making process along with traditional clinicopathological parameters. Recently, Bria et al proposed a clinical–biological risk stratification model for resected GC in which the levels of HER2, Fhit, and APC combined with five clinical factors were used for evaluating survival.47 However, considering that the expression of certain genes may vary according to the genetic background, country of origin, and size of the mass, clinical–biological risk models should be validated using unified criteria in diverse populations. Third, the Lauren classification was absent in the current scoring system. In light of the influence of missing data on statistical power, during data collection, we excluded the Lauren classification, which is not routinely reported in our cancer center. Furthermore, a few GC prognostic studies failed to demonstrate a significant role of this classification in outcome prediction.59 Finally, due to inherent bias associated with a retrospective analysis, we cannot simply conclude that the prognostic risk scoring system is more accurate than TNM classification. Although we have conducted cross-validation and demonstrated good discriminative potential of the scoring models, a prospective multicenter external validation study of the scoring system with a larger sample size is needed.
Conclusion
In conclusion, a three-class prognostic risk assessment scoring system was established by integrating preoperative serum Hb, CEA levels, postoperative status of LVI, involved LNR into the seventh UICC-pTNM stage system with an elevated predictive ability for long-term survival of patients with local GC who have undergone D2 gastrectomy. This system can identify the high-risk subsets of Stage II or III patients who may be candidates for more intensive follow-up and predict potential benefits of paclitaxel- or oxaliplatin-based chemotherapy before administration of adjuvant chemotherapy. This system may be of value to oncologists for clinical decision making before adjuvant chemotherapy, although a prospective validation is needed.
Acknowledgments
We would like to thank Dr Richard L Schilsky from the University of Chicago for revising an earlier version of this manuscript. This study was funded by the National Natural Science Foundation of China (81301896), Natural Science Foundation of the Colleges and Universities in Jiangsu Province (13KJB320011), Program for Development of Innovative Research Teams, Jiangsu Province Clinical Science and Technology Projects (Clinical Research Center, BL 2012008), Priority Academic Program Development of Jiangsu Higher Education Institutions (PAPD), and Provincial Initiative Program for Excellency Disciplines, Jiangsu Province, People’s Republic of China.
Disclosure
The authors report no conflicts of interest in this work.
References
GLOBOCAN 2012 (IARC). Stomach Cancer-Estimated Incidence, Mortality and Prevalence Worldwide in 2012. GLOBOCAN 2012 (IARC), Section of Cancer Information; 2012. Lyon, France. | ||
Lambert R, Saito H, Lucas E, Sankaranarayanan R. Survival from digestive cancer in emerging countries in Asia and Africa. Eur J Gastroenterol Hepatol. 2012;24(6):605–612. | ||
Allemani C, Weir HK, Carreira H, et al; CONCORD Working Group. Global surveillance of cancer survival 1995–2009: analysis of individual data for 25,676,887 patients from 279 population-based registries in 67 countries (CONCORD-2). Lancet. 2015;385(9972):977–1010. | ||
Spolverato G, Ejaz A, Kim Y, et al. Rates and patterns of recurrence after curative intent resection for gastric cancer: a United States multi-institutional analysis. J Am Coll Surg. 2014;219(4):664–675. | ||
Bauer K, Schroeder M, Porzsolt F, Henne-Bruns D. Comparison of international guidelines on the accompanying therapy for advanced gastric cancer: reasons for the differences. J Gastric Cancer. 2015;15(1):10–18. | ||
Japanese Gastric Cancer Association. Japanese gastric cancer treatment guidelines 2010 (ver. 3). Gastric Cancer. 2011;14(2):113–123. | ||
Bang YJ, Kim YW, Yang HK, et al; CLASSIC trial investigators. Adjuvant capecitabine and oxaliplatin for gastric cancer after D2 gastrectomy (CLASSIC): a phase 3 open-label, randomised controlled trial. Lancet. 2012;379(9813):315–321. | ||
Cao J, Qi F, Liu T. Adjuvant chemotherapy after curative resection for gastric cancer: a meta-analysis. Scand J Gastroenterol. 2014;49(6):690–704. | ||
Sakuramoto S, Sasako M, Yamaguchi T, et al; ACTS-GC Group. Adjuvant chemotherapy for gastric cancer with S-1, an oral fluoropyrimidine. N Engl J Med. 2007;357(18):1810–1820. | ||
Sobin LHWC, Gospodarowicz M, editors. TNM Classification of Malignant Tumors (UICC). Vol. 73. 7th ed. New York: Wileye Blackwell; 2009:7. | ||
Miceli R, Tomasello G, Bregni G, Di Bartolomeo M, Pietrantonio F. Adjuvant chemotherapy for gastric cancer: current evidence and future challenges. World J Gastroenterol. 2014;20(16):4516–4525. | ||
Zu H, Wang F, Ma Y, Xue Y. Stage-stratified analysis of prognostic significance of tumor size in patients with gastric cancer. PLoS One. 2013;8(1):e54502. | ||
Quan J, Zhang R, Liang H, et al. The impact of tumor size on survival of patients with pT4aN0M0 gastric cancer. Am Surg. 2013;79(3): 328–331. | ||
Lu J, Huang CM, Zheng CH, et al. Consideration of tumor size improves the accuracy of TNM predictions in patients with gastric cancer after curative gastrectomy. Surg Oncol. 2013;22(3):167–171. | ||
Liu X, Xu Y, Long Z, Zhu H, Wang Y. Prognostic significance of tumor size in T3 gastric cancer. Ann Surg Oncol. 2009;16(7):1875–1882. | ||
Aoyama T, Yoshikawa T, Watanabe T, et al. Macroscopic tumor size as an independent prognostic factor for stage II/III gastric cancer patients who underwent D2 gastrectomy followed by adjuvant chemotherapy with S-1. Gastric Cancer. 2011;14(3):274–278. | ||
Im WJ, Kim MG, Ha TK, Kwon SJ. Tumor size as a prognostic factor in gastric cancer patient. J Gastric Cancer. 2012;12(3):164–172. | ||
Zhang BY, Yuan J, Cui ZS, Li ZW, Li XH, Lu YY. Evaluation of the prognostic value of the metastatic lymph node ratio for gastric cancer. Am J Surg. 2013;207(4):555–565. | ||
Xu DZ, Geng QR, Long ZJ, et al. Positive lymph node ratio is an independent prognostic factor in gastric cancer after d2 resection regardless of the examined number of lymph nodes. Ann Surg Oncol. 2009;16(2):319–326. | ||
Sun Z, Zhu GL, Lu C, et al. The impact of N-ratio in minimizing stage migration phenomenon in gastric cancer patients with insufficient number or level of lymph node retrieved: results from a Chinese mono-institutional study in 2,159 patients. Ann Oncol. 2009;20(5):897–905. | ||
Wong J, Rahman S, Saeed N, et al. Prognostic impact of lymph node retrieval and ratio in gastric cancer: a U.S. single center experience. J Gastrointest Surg. 2013;17(12):2059–2066. | ||
Costa WL Jr, Coimbra FJ, Fogaroli RC, et al. Adjuvant chemoradiotherapy after d2-lymphadenectomy for gastric cancer: the role of n-ratio in patient selection. results of a single cancer center. Radiat Oncol. 2012;7:169. | ||
Inoue K, Nakane Y, Iiyama H, et al. The superiority of ratio-based lymph node staging in gastric carcinoma. Ann Surg Oncol. 2002; 9(1): 27–34. | ||
Marchet A, Mocellin S, Ambrosi A, et al; Italian Research Group for Gastric Cancer Study (GIRCG). The prognostic value of N-ratio in patients with gastric cancer: validation in a large, multicenter series. Eur J Surg Oncol. 2008;34(2):159–165. | ||
Maehara Y, Sugimachi K, Akagi M, Kakegawa T, Shimazu H, Tomita M. Serum carcinoembryonic antigen level increases correlate with tumor progression in patients with differentiated gastric carcinoma following noncurative resection. Cancer Res. 1990;50(13):3952–3955. | ||
Mihmanli M, Dilege E, Demir U, Coskun H, Eroglu T, Uysalol MD. The use of tumor markers as predictors of prognosis in gastric cancer. Hepatogastroenterology. 2004;51(59):1544–1547. | ||
Sisik A, Kaya M, Bas G, Basak F, Alimoglu O. CEA and CA 19-9 are still valuable markers for the prognosis of colorectal and gastric cancer patients. Asian Pac J Cancer Prev. 2013;14(7):4289–4294. | ||
Aliustaoglu M, Bilici A, Ustaalioglu BB, et al. The effect of peripheral blood values on prognosis of patients with locally advanced gastric cancer before treatment. Med Oncol. 2010;27(4):1060–1065. | ||
Ucar E, Semerci E, Ustun H, Yetim T, Huzmeli C, Gullu M. Prognostic value of preoperative CEA, CA 19-9, CA 72-4, and AFP levels in gastric cancer. Adv Ther. 2008;25(10):1075–1084. | ||
Park BW, Oh JW, Kim JH, et al. Preoperative CA 15-3 and CEA serum levels as predictor for breast cancer outcomes. Ann Oncol. 2008;19(4):675–681. | ||
Kodera Y, Yamamura Y, Torii A, et al. The prognostic value of preoperative serum levels of CEA and CA19-9 in patients with gastric cancer. Am J Gastroenterol. 1996;91(1):49–53. | ||
Kim DY, Kim HR, Shim JH, Park CS, Kim SK, Kim YJ. Significance of serum and tissue carcinoembryonic antigen for the prognosis of gastric carcinoma patients. J Surg Oncol. 2000;74(3):185–192. | ||
Liang Y, Ding X, Wang X, et al. Prognostic value of surgical margin status in gastric cancer patients. ANZ J Surg. 2014;85(9):678–684. | ||
Liu Y, Chen XH, Meng XH, et al. Multivariate prognostic study on node-positive gastric cancer: is tumor size a prognostic indicator? Hepatogastroenterology. 2012;59(114):623–626. | ||
Bilici A, Seker M, Ustaalioglu BB, et al. Prognostic significance of perineural invasion in patients with gastric cancer who underwent curative resection. Ann Surg Oncol. 2010;17(8):2037–2044. | ||
Marrelli D, Morgagni P, de Manzoni G, et al; Italian Research Group for Gastric Cancer (IRGGC). Prognostic value of the 7th AJCC/UICC TNM classification of noncardia gastric cancer: analysis of a large series from specialized Western centers. Ann Surg. 2012;255(3):486–491. | ||
Fjortoft I, Furnes B, Hausken T, Storli KE, Eide GE, Sondenaa K. Pre-operative anaemia in colon cancer patients became normal after more than a year post-operatively but did not influence oncological outcome in the final analysis. Scand J Gastroenterol. 2013;48(6):663–671. | ||
Spolverato G, Ejaz A, Kim Y, et al. Prognostic performance of different lymph node staging systems after curative intent resection for gastric adenocarcinoma. Ann Surg. 2015;262(6):991–998. | ||
Lee S, Oh SY, Kim SH, et al. Prognostic significance of neutrophil lymphocyte ratio and platelet lymphocyte ratio in advanced gastric cancer patients treated with FOLFOX chemotherapy. BMC Cancer. 2013;13:350. | ||
Dikken JL, Jansen EP, Cats A, et al. Impact of the extent of surgery and postoperative chemoradiotherapy on recurrence patterns in gastric cancer. J Clin Oncol. 2010;28(14):2430–2436. | ||
Bickenbach KA, Gonen M, Strong V, Brennan MF, Coit DG. Association of positive transection margins with gastric cancer survival and local recurrence. Ann Surg Oncol. 2013;20(8):2663–2668. | ||
Kim Y, Spolverato G, Ejaz A, et al. A nomogram to predict overall survival and disease-free survival after curative resection of gastric adenocarcinoma. Ann Surg Oncol. 2014;22(6):1828–1835. | ||
Kattan MW, Karpeh MS, Mazumdar M, Brennan MF. Postoperative nomogram for disease-specific survival after an R0 resection for gastric carcinoma. J Clin Oncol. 2003;21(19):3647–3650. | ||
Vacanti CJ, VanHouten RJ, Hill RC. A statistical analysis of the relationship of physical status to postoperative mortality in 68,388 cases. Anesth Analg. 1970;49(4):564–566. | ||
Liu X, Cai H, Wang Y. Prognostic significance of tumor markers in T4a gastric cancer. World J Surg Oncol. 2012;10:68. | ||
Frank E, Harrell J, Kerry LL, Daniel BM. Tutorial in biostatistics multivariable prognostic models: issues in developing models, evaluating assumptions and adequacy, and measuring and reducing errors. Stat Med. 1996;15:361–387. | ||
Bria E, De Manzoni G, Beghelli S, et al. A clinical-biological risk stratification model for resected gastric cancer: prognostic impact of Her2, Fhit, and APC expression status. Ann Oncol. 2013;24(3):693–701. | ||
Boulesteix A-L, Strobl C. Maximally selected chi-squared statistics and non-monotonic associations: an exact approach based on two cutpoints. Comput Stat Data Anal. 2007;51(12):6295–6306. | ||
Andrew EB. The use of the area under the roc curve in the evaluation of machine learning algorithms. Pattern Recognit. 1997;30(7):1145–1159. | ||
Zhang YW, Zhang YL, Pan H, et al. Chemotherapy for patients with gastric cancer after complete resection: a network meta-analysis. World J Gastroenterol. 2014;20(2):584–592. | ||
GASTRIC (Global Advanced/Adjuvant Stomach Tumor Research International Collaboration) Group, Paoletti X, Oba K, et al. Benefit of adjuvant chemotherapy for resectable gastric cancer: a meta-analysis. JAMA. 2010;303(17):1729–1737. | ||
GASTRIC (Global Advanced/Adjuvant Stomach Tumor Research International Collaboration) Group, Oba K, Paoletti X, et al. Role of chemotherapy for advanced/recurrent gastric cancer: an individual-patient-data meta-analysis. Eur J Cancer. 2013;49(7):1565–1577. | ||
Liu TS, Wang Y, Chen SY, Sun YH. An updated meta-analysis of adjuvant chemotherapy after curative resection for gastric cancer. Eur J Surg Oncol. 2008;34(11):1208–1216. | ||
Sasako M, Sakuramoto S, Katai H, et al. Five-year outcomes of a randomized phase III trial comparing adjuvant chemotherapy with S-1 versus surgery alone in stage II or III gastric cancer. J Clin Oncol. 2011;29(33):4387–4393. | ||
Becker K, Reim D, Novotny A, et al. Proposal for a multifactorial prognostic score that accurately classifies 3 groups of gastric carcinoma patients with different outcomes after neoadjuvant chemotherapy and surgery. Ann Surg. 2012;256(6):1002–1007. | ||
Chau I, Norman AR, Cunningham D, Waters JS, Oates J, Ross PJ. Multivariate prognostic factor analysis in locally advanced and metastatic esophago-gastric cancer – pooled analysis from three multicenter, randomized, controlled trials using individual patient data. J Clin Oncol. 2004;22(12):2395–2403. | ||
Kanagavel D, Pokataev IA, Fedyanin MY, et al. A prognostic model in patients treated for metastatic gastric cancer with second-line chemotherapy. Ann Oncol. 2010;21(9):1779–1785. | ||
Dikken JL, Baser RE, Gonen M, et al. Conditional probability of survival nomogram for 1-, 2-, and 3-year survivors after an R0 resection for gastric cancer. Ann Surg Oncol. 2013;20(5):1623–1630. | ||
Han DS, Suh YS, Kong SH, et al. Nomogram predicting long-term survival after d2 gastrectomy for gastric cancer. J Clin Oncol. 2012; 30(31):3834–3840. | ||
Shinohara T, Kanaya S, Taniguchi K, Fujita T, Yanaga K, Uyama I. Laparoscopic total gastrectomy with D2 lymph node dissection for gastric cancer. Arch Surg. 2009;144(12):1138–1142. | ||
Huang JL, Wei HB, Zheng ZH, et al. Laparoscopy-assisted D2 radical distal gastrectomy for advanced gastric cancer. Dig Surg. 2010;27(4): 291–296. | ||
Shinohara T, Satoh S, Kanaya S, et al. Laparoscopic versus open D2 gastrectomy for advanced gastric cancer: a retrospective cohort study. Surg Endosc. 2013;27(1):286–294. | ||
Lordick F, Lorenzen S, Yamada Y, Ilson D. Optimal chemotherapy for advanced gastric cancer: is there a global consensus? Gastric Cancer. 2014;17(2):213–225. | ||
Kim ST, Park KH, Oh SC, et al. Is chemotherapy in elderly patients with metastatic or recurrent gastric cancer as tolerable and effective as in younger patients? Asia Pac J Clin Oncol. 2012;8(2):194–200. | ||
Kang H, Kauh JS. Chemotherapy in the treatment of metastatic gastric cancer: is there a global standard? Curr Treat Options Oncol. 2011;12(1):96–106. | ||
Seevaratnam R, Bocicariu A, Cardoso R, et al. How many lymph nodes should be assessed in patients with gastric cancer? A systematic review. Gastric Cancer. 2012;15(suppl 1):S70–S88. | ||
Tong LL, Gao P, Wang ZN, et al. Can lymph node ratio take the place of pN categories in the UICC/AJCC TNM classification system for colorectal cancer? Ann Surg Oncol. 2011;18(9):2453–2460. | ||
Cao Q, Zhang B, Zhao L, et al. The impact of positive nodal chain ratio on individualized multimodality therapy in non-small-cell lung cancer. Tumour Biol. 2015;36(6):4617–4625. | ||
Berger AC, Sigurdson ER, LeVoyer T, et al. Colon cancer survival is associated with decreasing ratio of metastatic to examined lymph nodes. J Clin Oncol. 2005;23(34):8706–8712. | ||
Li Q, Li G, Palmer JD, Zhang Z. Lymph node burden as a predictive factor for selective chemoradiotherapy in patients with locally advanced gastric cancer after a D2 dissection: a retrospective study. Am J Clin Oncol. Epub 2014 Dec 10. | ||
Jin LX, Moses LE, Squires MH 3rd, et al. Factors associated with recurrence and survival in lymph node-negative gastric adenocarcinoma: a 7-institution study of the US gastric cancer collaborative. Ann Surg. 2015;262(6):999–1005. | ||
Park JH, Ryu MH, Kim HJ, et al. Risk factors for selection of patients at high risk of recurrence or death after complete surgical resection in stage I gastric cancer. Gastric Cancer. Epub 2015 Jan 23. | ||
Kunisaki C, Makino H, Kimura J, et al. Impact of lymphovascular invasion in patients with stage I gastric cancer. Surgery. 2010; 147(2):204–211. | ||
MacRae R, Shyr Y, Johnson D, Choy H. Declining hemoglobin during chemoradiotherapy for locally advanced non-small cell lung cancer is significant. Radiother Oncol. 2002;64(1):37–40. | ||
Pang L, Wang J, Jiang Y, Chen L. Decreased levels of serum cytokeratin 19 fragment CYFRA 21-1 predict objective response to chemotherapy in patients with non-small cell lung cancer. Exp Ther Med. 2013; 6(2):355–360. | ||
An X, Ding PR, Xiang XJ, et al. Carcinoembryonic antigen surge in metastatic colorectal cancer patients responding to irinotecan combination chemotherapy. Biomarkers. 2010;15(3):243–248. | ||
Huh JW, Lee WY, Park YA, et al. Prognostic factors associated with primary cancer in curatively resected stage IV colorectal cancer. J Cancer Res Clin Oncol. 2014;140(3):435–441. | ||
Sun Z, Zhang N. Clinical evaluation of CEA, CA19-9, CA72-4 and CA125 in gastric cancer patients with neoadjuvant chemotherapy. World J Surg Oncol. 2014;12:397. | ||
Qiu MZ, Xu RH, Ruan DY, et al. Incidence of anemia, leukocytosis, and thrombocytosis in patients with solid tumors in China. Tumour Biol. 2010;31(6):633–641. | ||
Gilreath JA, Stenehjem DD, Rodgers GM. Diagnosis and treatment of cancer-related anemia. Am J Hematol. 2014;89(2):203–212. | ||
Wu CW, Hsieh MC, Lo SS, et al. Prognostic indicators for survival after curative resection for patients with carcinoma of the stomach. Dig Dis Sci. 1997;42(6):1265–1269. | ||
Shen JG, Cheong JH, Hyung WJ, Kim J, Choi SH, Noh SH. Pretreatment anemia is associated with poorer survival in patients with stage I and II gastric cancer. J Surg Oncol. 2005;91(2):126–130. | ||
Lim CH, Kim SW, Kim WC, et al. Anemia after gastrectomy for early gastric cancer: long-term follow-up observational study. World J Gastroenterol. 2012;18(42):6114–6119. | ||
Park JY, Kim YJ. Laparoscopic Roux-en-Y gastric bypass in obese Korean patients: efficacy and potential adverse events. Surg Today. Epub 2015 Apr 26. | ||
Choi BM, Kim YM, Jeong YR, et al. Induction of heme oxygenase-1 is involved in anti-proliferative effects of paclitaxel on rat vascular smooth muscle cells. Biochem Biophys Res Commun. 2004;321(1):132–137. | ||
Agarwal A, Bolisetty S. Adaptive responses to tissue injury: role of heme oxygenase-1. Trans Am Clin Climatol Assoc. 2013;124: 111–122. | ||
Fraser ST, Midwinter RG, Coupland LA, et al. Heme oxygenase-1 deficiency alters erythroblastic island formation, steady-state erythropoiesis and red blood cell lifespan in mice. Haematologica. 2015;100(5):601–610. | ||
Waddell T, Verheij M, Allum W, Cunningham D, Cervantes A, Arnold D. Gastric cancer: ESMO-ESSO-ESTRO clinical practice guidelines for diagnosis, treatment and follow-up. Eur J Surg Oncol. 2014;40(5):584–591. | ||
Smalley SR, Benedetti JK, Haller DG, et al. Updated analysis of SWOG-directed intergroup study 0116: a phase III trial of adjuvant radiochemotherapy versus observation after curative gastric cancer resection. J Clin Oncol. 2012;30(19):2327–2333. | ||
Macdonald JS, Smalley SR, Benedetti J, et al. Chemoradiotherapy after surgery compared with surgery alone for adenocarcinoma of the stomach or gastroesophageal junction. N Engl J Med. 2001; 345(10):725–730. | ||
Ychou M, Boige V, Pignon JP, et al. Perioperative chemotherapy compared with surgery alone for resectable gastroesophageal adenocarcinoma: an FNCLCC and FFCD multicenter phase III trial. J Clin Oncol. 2011;29(13):1715–1721. | ||
Ronellenfitsch U, Schwarzbach M, Hofheinz R, et al; GE Adenocarcinoma Meta-analysis Group. Perioperative chemo (radio)therapy versus primary surgery for resectable adenocarcinoma of the stomach, gastroesophageal junction, and lower esophagus. Cochrane Database Syst Rev. 2013;5:CD008107. | ||
Cunningham D, Allum WH, Stenning SP, et al; MAGIC Trial Participants. Perioperative chemotherapy versus surgery alone for resectable gastroesophageal cancer. N Engl J Med. 2006;355(1):11–20. | ||
Allgayer H, Babic R, Gruetzner KU, Tarabichi A, Schildberg FW, Heiss MM. c-erbB-2 is of independent prognostic relevance in gastric cancer and is associated with the expression of tumor-associated protease systems. J Clin Oncol. 2000;18(11):2201–2209. | ||
Begnami MD, Fukuda E, Fregnani JH, et al. Prognostic implications of altered human epidermal growth factor receptors (HERs) in gastric carcinomas: HER2 and HER3 are predictors of poor outcome. J Clin Oncol. 2011;29(22):3030–3036. | ||
Lee HS, Lee HK, Kim HS, Yang HK, Kim WH. Tumour suppressor gene expression correlates with gastric cancer prognosis. J Pathol. 2003;200(1):39–46. | ||
Kim B, Byun SJ, Kim YA, et al. Cell cycle regulators, APC/beta-catenin, NF-kappaB and Epstein-Barr virus in gastric carcinomas. Pathology. 2010;42(1):58–65. | ||
Wu MS, Shun CT, Wang HP, et al. Genetic alterations in gastric cancer: relation to histological subtypes, tumor stage, and Helicobacter pylori infection. Gastroenterology. 1997;112(5):1457–1465. | ||
Corso G, Carvalho J, Marrelli D, et al. Somatic mutations and deletions of the E-cadherin gene predict poor survival of patients with gastric cancer. J Clin Oncol. 2013;31(7):868–875. | ||
Wadhwa R, Song S, Lee JS, Yao Y, Wei Q, Ajani JA. Gastric cancer-molecular and clinical dimensions. Nat Rev Clin Oncol. 2013;10(11): 643–655. |
Supplementary materials
Method S1
Indications for adjuvant chemotherapy
Histologically confirmed gastric cancer of seventh UICC-TNM Stage II, III, or I (T1b/T2N0) with risk factors including poor differentiation; lymphovascular or neural invasion; adequate organ function (a leukocyte count of >4×10⁹/L or the lower limit of the normal range; a platelet count of >100×109/L; a total bilirubin level of <1.5 mg/dL, aspartate aminotransferase and alanine aminotransferase levels not more than two times the upper limit of the normal range; and a serum creatinine level no greater than the upper limit of the normal range); and an age of 20–85 years.
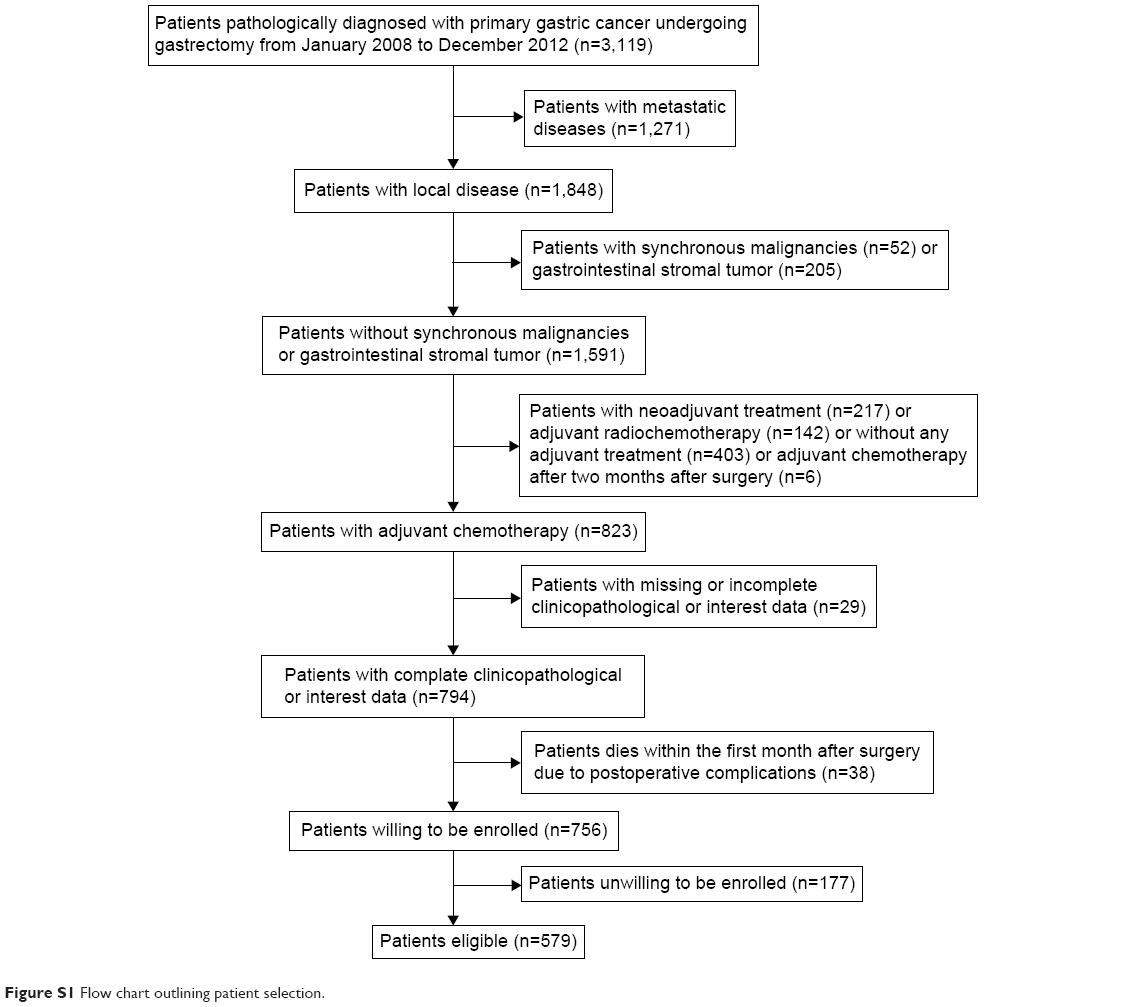 | Figure S1 Flow chart outlining patient selection. |
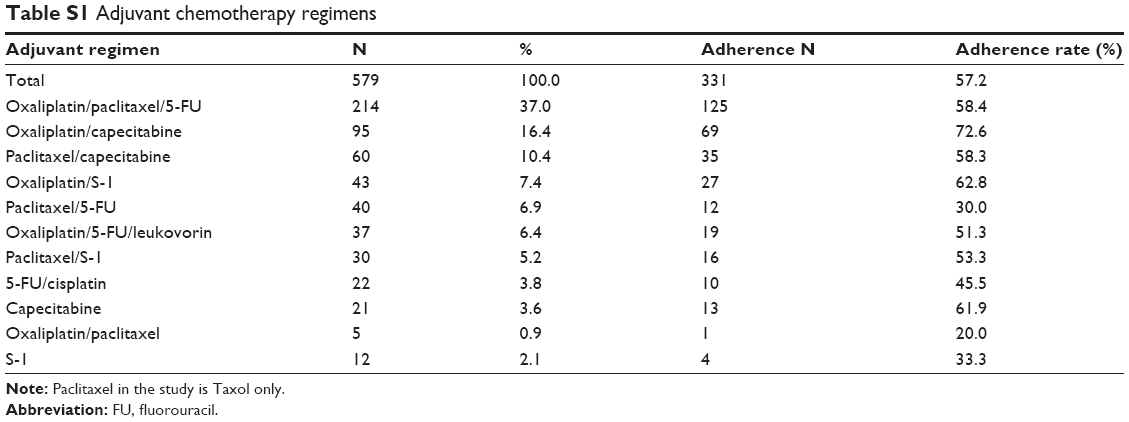 | Table S1 Adjuvant chemotherapy regimens |
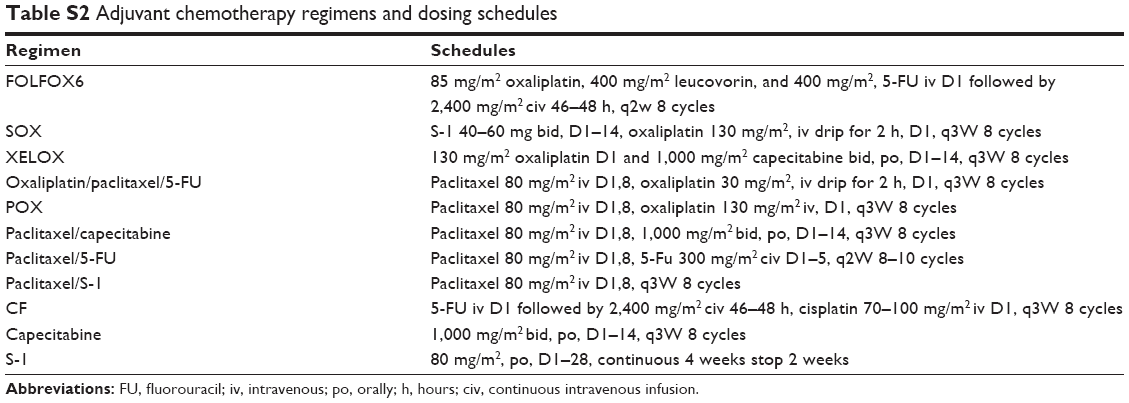 | Table S2 Adjuvant chemotherapy regimens and dosing schedules |
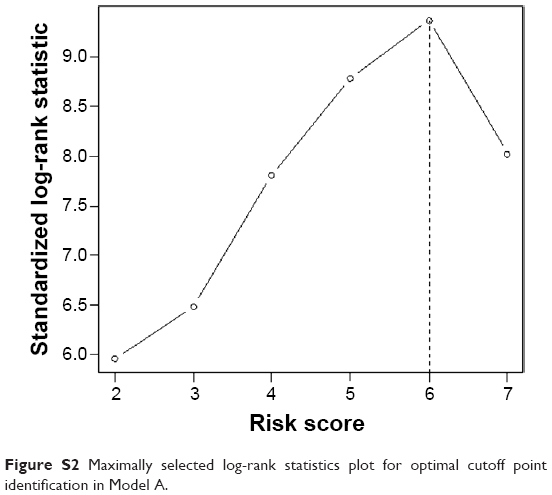 | Figure S2 Maximally selected log-rank statistics plot for optimal cutoff point identification in Model A. |
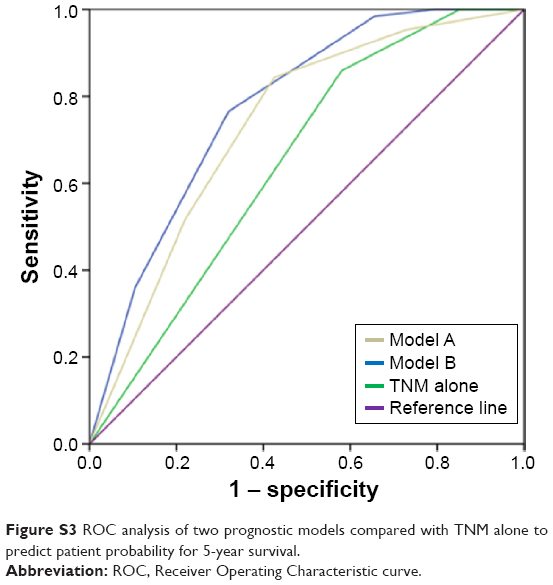 | Figure S3 ROC analysis of two prognostic models compared with TNM alone to predict patient probability for 5-year survival. |
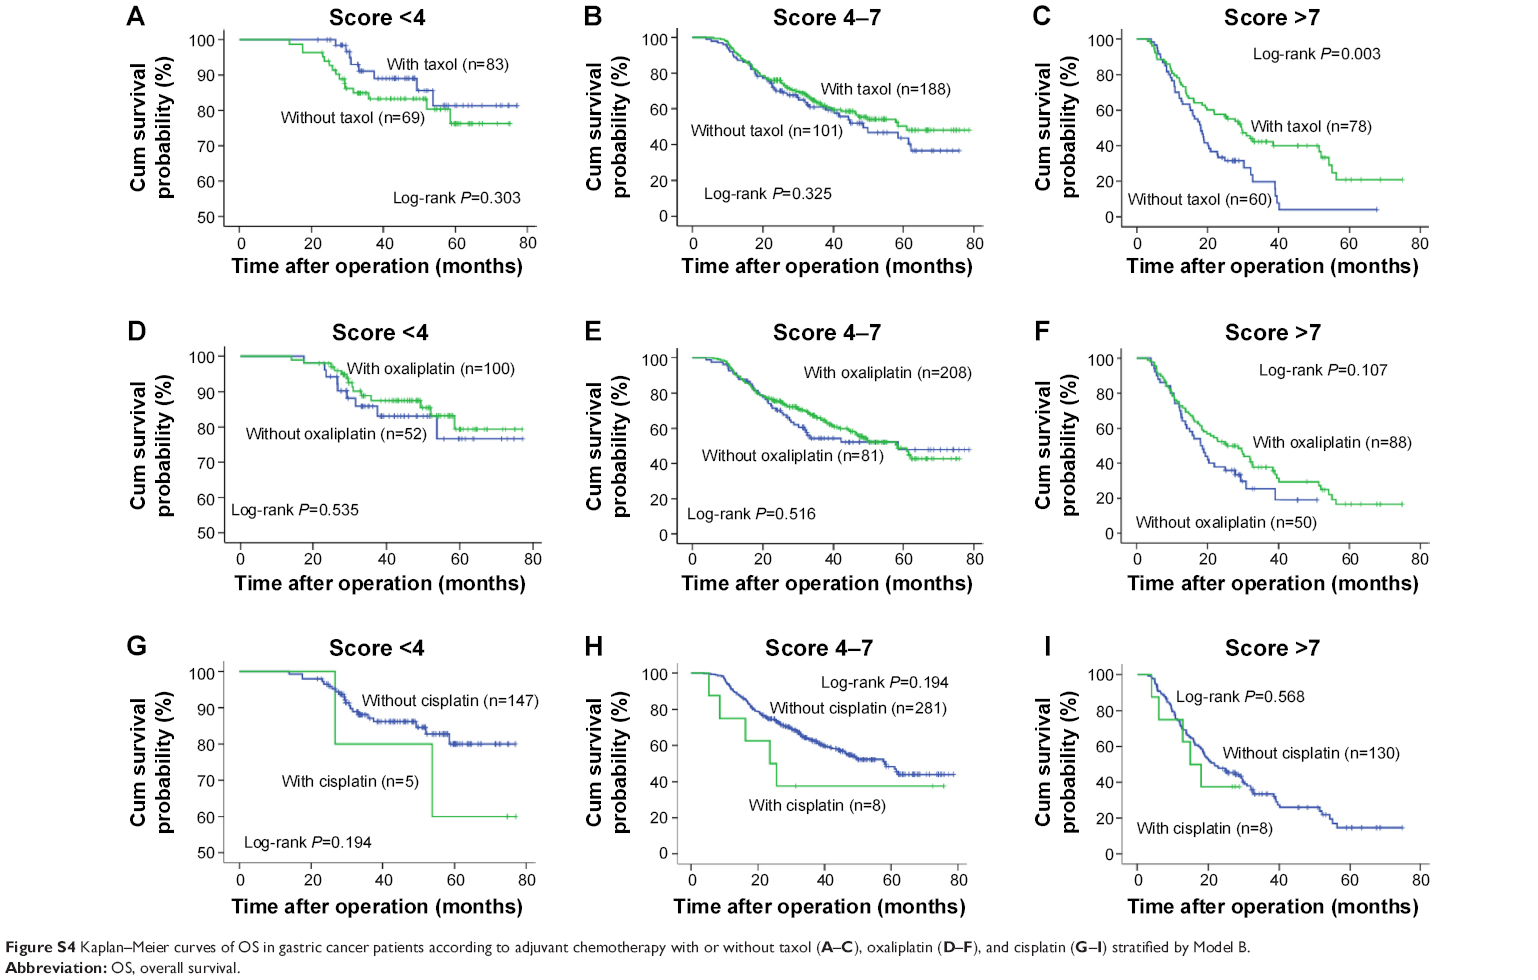 | Figure S4 Kaplan–Meier curves of OS in gastric cancer patients according to adjuvant chemotherapy with or without taxol (A–C), oxaliplatin (D–F), and cisplatin (G–I) stratified by Model B. |
 © 2016 The Author(s). This work is published and licensed by Dove Medical Press Limited. The full terms of this license are available at https://www.dovepress.com/terms.php and incorporate the Creative Commons Attribution - Non Commercial (unported, v3.0) License.
By accessing the work you hereby accept the Terms. Non-commercial uses of the work are permitted without any further permission from Dove Medical Press Limited, provided the work is properly attributed. For permission for commercial use of this work, please see paragraphs 4.2 and 5 of our Terms.
© 2016 The Author(s). This work is published and licensed by Dove Medical Press Limited. The full terms of this license are available at https://www.dovepress.com/terms.php and incorporate the Creative Commons Attribution - Non Commercial (unported, v3.0) License.
By accessing the work you hereby accept the Terms. Non-commercial uses of the work are permitted without any further permission from Dove Medical Press Limited, provided the work is properly attributed. For permission for commercial use of this work, please see paragraphs 4.2 and 5 of our Terms.