")
Back to Journals » Drug Design, Development and Therapy » Volume 11
A 6-month mixed-effect pharmacokinetic model for post-transplant intravenous anti-hepatitis B immunoglobulin prophylaxis
Received 14 February 2017
Accepted for publication 5 April 2017
Published 11 July 2017 Volume 2017:11 Pages 2099—2107
DOI https://doi.org/10.2147/DDDT.S134711
Checked for plagiarism Yes
Review by Single anonymous peer review
Peer reviewer comments 3
Editor who approved publication: Dr Qiongyu Guo
Seunghoon Han,1,2 Gun Hyung Na,3 Dong-Goo Kim3
1Department of Pharmacology, College of Medicine, The Catholic University of Korea, Seocho-gu, Seoul, South Korea; 2Pharmacometrics Institute for Practical Education and Training, The Catholic University of Korea, Seocho-gu, Seoul, South Korea; 3Department of Surgery, Seoul St Mary’s Hospital, The Catholic University of Korea, Seocho-gu, Seoul, South Korea
Background: Although individualized dosage regimens for anti-hepatitis B immunoglobulin (HBIG) therapy have been suggested, the pharmacokinetic profile and factors influencing the basis for individualization have not been sufficiently assessed. We sought to evaluate the pharmacokinetic characteristics of anti-HBIG quantitatively during the first 6 months after liver transplantation.
Methods: Identical doses of 10,000 IU HBIG were administered to adult liver transplant recipients daily during the first week, weekly thereafter until 28 postoperative days, and monthly thereafter. Blood samples were obtained at days 1, 7, 28, 84, and 168 after transplantation. Plasma HBIG titer was quantified using 4 different immunoassay methods. The titer determined by each analytical method was used for mixed-effect modeling, and the most precise results were chosen. Simulations were performed to predict the plausible immunoglobulin maintenance dose.
Results: HBIG was eliminated from the body most rapidly in the immediate post-transplant period, and the elimination rate gradually decreased thereafter. In the early post-transplant period, patients with higher DNA titer tend to have lower plasma HBIG concentrations. The maintenance doses required to attain targets in 90%, 95%, and 99% of patients were ~15.3, 18.2, and 25.1 IU, respectively, multiplied by the target trough level (in IU/L).
Conclusion: The variability (explained and unexplained) in HBIG pharmacokinetics was relatively larger in the early post-transplant period. Dose individualization based upon patient characteristics should be adjusted focusing quantitatively on the early post-transplant period.
Keywords: population pharmacokinetics, liver transplantation, DNA titer, individualized therapy, dosage regimen
Introduction
Anti-hepatitis B immunoglobulin (HBIG) has been a standard tool for post-transplant hepatitis B virus (HBV) prophylaxis in patients who receive a liver transplant because of severe liver disease caused by HBV.1–3 When the prophylaxis is not properly given, clinically significant graft reinfection followed by graft failure is highly likely to occur within 6–12 months after the transplantation.4,5 There has been notable improvement in antiviral agents during the past decades, and several reports of successful HBV defense using these agents alone have been published.6–9 However, in many cases, inferior outcome of HBV prophylaxis with antiviral agents alone or with short-term HBIG treatment has been compared with the standard combination of HBIG and antiviral agents.10–13 Experts consider that prophylaxis without HBIG is not sufficient to assure an optimal prognosis and, thus, that HBIG remains the mainstay of prophylaxis, particularly in endemic areas where the viral load of patients is relatively high.2,14
Efforts to diminish the contribution of HBIG in HBV prophylaxis have nevertheless continued for 2 major reasons: 1) HBIG is relatively expensive and 2) because HBIG is given parenterally, patients are required to visit a hospital for HBIG administration and this may result in noncompliance and/or additional medical expenses. These disadvantages are particularly problematic when high-dose HBIG is used and/or the treatment period of HBIG is prolonged. To balance the necessity and the inherent weakness of HBIG treatment, the HBIG regimen may be adjusted according to the risk of HBV recurrence in each patient.4,14 To facilitate this approach, a well-established exposure–response relationship for HBIG allowing an estimate of the HBIG dosing regimen and prior information regarding evidence-based risk assessment are required.
Various studies focusing on the probability of HBV recurrence by examining the underlying patient condition at the time of transplantation have been conducted.1,3,15,16 Surprisingly, only a few reports on the full pharmacokinetics (PK) of HBIG in post-transplant patients exist. Evidence required to link the exposure level (HBIG concentration or PK parameter) to the prediction of prophylaxis outcome is lacking. Various monitoring strategies to evaluate the adequacy of treatment, such as maintaining trough concentration over 300 or 150 IU/mL, are currently practiced at the physician’s discretion.14,17–19 As a first step to establish a quantitative exposure–response relationship, a patient-based PK study was designed using a sparse, repetitive, sampling technique to explore the PK properties of HBIG during the first 6 months after transplantation. The influence of baseline patient conditions including clinical and viral parameters was also evaluated. Because quantification methods for plasma HBIG are essential to monitor concentration, various assay methods were compared.
Materials and methods
Ethical considerations
This research was performed as a prospective PK study that was designed and monitored in accordance with the Good Clinical Practice of the International Conference on Harmonization and with the principles of the Declaration of Helsinki and its amendments. An independent institutional review board at The Catholic University of Korea Seoul St Mary’s Hospital approved the research protocol before execution of any research-related procedures. Written informed consent was obtained from all participants before their enrollment in this research. This clinical research was registered at ClinicalTrials.gov (NCT02125071).
Participants
Patients with hepatitis B aged >18 years who were positive for HBV surface antigen (HBsAg) and were to receive a liver transplant followed by HBV prophylaxis in The Catholic University of Korea Seoul St Mary’s Hospital were eligible to participate in this study. The exclusion criteria included multiorgan or repeated transplantation, end-stage renal disease, immune compromise or deficiency, human immunodeficiency virus and/or hepatitis C virus infection, use of any other immunoglobulin treatment, and pregnancy. The target number of participants was 20. This number was not calculated for securing statistical power because the study purpose was to explore HBIG PK, rather than to test a hypothesis.
Study design
Patients were screened within 4 weeks of the day planned for liver transplantation. When a patient met the inclusion/exclusion criteria, they were enrolled as a participant. After enrollment, clinical data that were routinely obtained to evaluate the adequacy of a patient’s medical condition for liver transplantation (eg, vital signs, laboratory test results, electrocardiography, and HBV drug resistance mutation) were recorded and used for baseline characteristics. As factors potentially influencing HBIG PK, the level of HBV DNA was measured quantitatively and the presence of HBsAg, antibody to HBsAg (HBsAb), HBV envelope antigen (HBeAg), and antibody to HBeAg (HBeAb) was assayed qualitatively at clinically determined intervals (7 points; before and immediately after the transplantation, 1, 7, 28, 84, and 168 days after transplantation).
The study drug used as the HBIG agent was Hepabig injection 200 IU/mL (Green Cross, Yongin, South Korea). An identical dose of 10,000 IU (50 mL as the study drug) was mixed with saline and infused over 1 h at every dosing for all participants. The first infusion was started within 30 min after the removal of infected liver during the transplantation. Subsequent doses were given daily until 7 postoperative days (PODs), weekly thereafter until 28 PODs, and monthly thereafter. The antiviral therapy that was commonly combined in all participants included nucleoside and nucleotide analogs. For the transplant, HBIG dosing, and clinical follow-up, the participants were generally hospitalized from several days before transplantation to ~3 weeks after transplantation according to their medical conditions and visited the study site on prescheduled dosing days within the allowed window.
The PK sampling was planned and performed based upon the assumption that the PK characteristics of HBIG would be described using a one-compartment model (log concentration would drop linearly from the end of infusion), which is generally used as a PK profile for immunoglobulin G products.20–22 Thus, a peak–trough sampling strategy was used at PODs 1, 7, 28, 84, and 168. For reference points, baseline PK samples were obtained within 3 days before the transplantation and at the end of intraoperative infusion (1 sample each). If a participant completed the participation per protocol, 12 samples would be obtained.
Quantification of serum anti-HB activities
Plasma HBIG titer was quantified using 4 different commercially available immunoassay methods (radioimmunoassay [RIA], chemiluminescent microparticle immunoassay [CMIA], electrochemiluminescence immunoassay [ECLIA], and enzyme-linked immunosorbent assay [ELISA]). The RIA (Beijing North Institute of Biological Technology Co., Beijing, China), CMIA (Architect System Anti-HBs; Abbott Ireland, Sligo, Ireland), and ECLIA (Cobas Anti-HBs; Roche Diagnostics GmbH, Mannheim, Germany) were performed according to the manufacturers’ instructions. The ELISA was conducted using Hepabig-gene ELISA 1.1, which was customized to quantify serum HBIG titer by Green Cross Corp. and manufactured by Green Cross Medical Science (Yongin, South Korea). Hepabig-gene ELISA 1.1 was optimized by decreasing background signals from human serum and consisted of an HBsAg-coated 96-well plate, horseradish peroxidase (HRP)-conjugated anti-human antibody as a secondary antibody, dilution reagents, and a washing reagent. The results of all HBIG immunoassays were normalized using the Korean National anti-Hepatitis B immunoglobulin reference (reference number 08/026; Ministry of Food and Drug Safety, South Korea).
PK analysis
A mixed-effect modeling and simulation using NONMEM (version 7.3; Icon Development Solutions, LLC, Hanover, MD, USA) was utilized in the PK analysis, which has been considered as a criterion standard to deal with sparse data. The data set consisted of patient identification number (ID), actual time of event (start of infusion or sampling), dosing amount, duration of infusion, HBIG concentration of the corresponding sample, and patient information at the event time including demographic, clinical, and viral characteristics. HBIG concentrations measured from all available samples were included. To compare the methods of quantification, modeling procedures were performed separately using concentration values from each analytical modality.
All PK parameters and their between-subject variability (BSV) were expressed as a submodel. For example, when exponential BSV was recruited, the submodel is
|

where Pij is the jth parameter estimate for the ith individual, θj is the typical population value of the jth parameter, and ηij is a random variable normally distributed with a mean of 0 and variance of  . The dispositional structure was fixed to be one compartment with linear elimination. To estimate parameters, the first-order conditional estimation with interaction option (FOCE-I) was used whenever possible.
The model was determined based on both numerical and visual criteria such as objective function value (OFV) and diagnostic plots, including goodness-of-fit and individual plots. In each modeling step, model improvement was checked with a likelihood ratio test, and a better model was selected when the OFV decreased >3.84 (P<0.05, df=1) or 5.99 (P<0.05, df=2) by the addition of a parameter(s). All the variables regarding patient information were screened numerically (eg, generalized additive modeling [GAM]) and visually (eg, scatterplots of parameters versus covariates) followed by an evaluation as a fixed structure in the model to identify meaningful influential factors. The final model was evaluated using a bootstrap procedure and visual predictive check (VPC).
A 48-week simulation to determine the dose–trough level relationship was performed based on the final PK model and parameter estimates. In each simulation scenario with varied doses, 500 replicates of the original data set, only with different dose levels, were produced to generate prediction intervals.
Results
Patient disposition, demographics, and data set
A total of 20 participants (18 men and 2 women) were screened and enrolled in this study. Among the participants, 18 completed the protocol (2 participants died during participation from myocardial infarction and esophageal varix bleeding, respectively). The participants were aged 53.60±9.48 years and weighed 72.51±9.94 kg (mean ± standard deviation). The use of concomitant medication that was likely to have a drug–drug interaction with HBIG was not reported (Table 1). The final analysis data set included 228 HBIG concentration data points; however, in actual practice, the intraoperative data were excluded because of inconsistency, so that 208 points remained in the data set (one concentration value for each participant was removed).
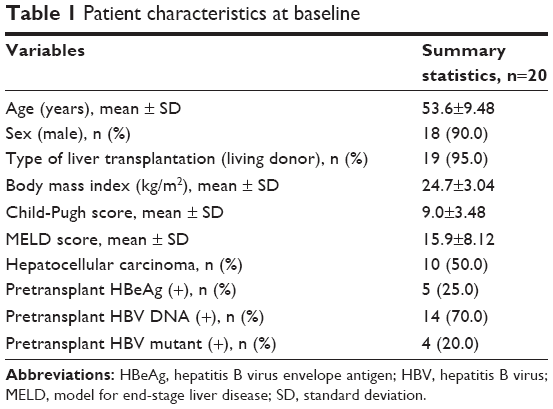 | Table 1 Patient characteristics at baseline |
Final PK model
The plasma concentration of HBIG measured using CMIA was chosen as the dependent variable for the final PK model (the reason will be discussed in the “Comparison of quantification methods” section). HBIG was found to be rapidly eliminated from the body in the periods relatively close to the time of transplantation, and the elimination rate gradually decreased thereafter. This trend in clearance (CL) was described using the sum of 2 exponentials, and the second exponential component decreased asymptotically to the final value for CL (0.0064 L/h). The first exponential component started from the value of 0.440 L/h and decreased rapidly with a half-life of 19.8 h resulting in a negligible value at around 4–5 days after transplantation. The typical value for volume of distribution (Vd) was estimated as 3.20 L. When considering the estimated final values for CL and Vd, the terminal half-life of HBIG at the maintenance period (when monthly dosing is given) was predicted to be 346.5 h.
A total of 130 sets (HBV DNA, HBsAg, HBsAb, HBeAg, and HBeAb) of covariate data were obtained from the subjects. The only covariate incorporated in the model was HBV DNA titer. HBV DNA titer was the highest before the transplantation (median 1,711 copies/mL, ranging from 17 to 515,898 copies/mL) and drastically decreased with the first administration of HBIG (median 233 copies/mL, ranging 0–16,032 copies/mL). The median titer was maintained below 20 copies/mL from POD 1. Under the assumption that the antigen–antibody binding would occur immediately after HBIG administration and the amount of antibody that formed the antigen–antibody complex would not be detectable in plasma,23 the effect of DNA titer was reflected in the relative fraction of HBIG detected (F). The submodel for F that produced the best fit was a sigmoid structure as follows:
|
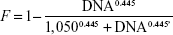
where DNA is the HBV DNA titer. According to this model, the initial dose should be doubled in patients who have a baseline HBV DNA titer of 1,050 copies/mL (when F =0.5) compared with patients in whom HBV DNA is not detectable. In addition, it could be confirmed that pre-dose HBIG level was negligible from the qualitative HBsAb assay that showed negative result for every subject.
The model structure and final parameter estimates are presented together in Table 2 with the bootstrap results. Figure 1 is a basic goodness-of-fit plot for the final model, and Figure 2 shows the results from VPC.
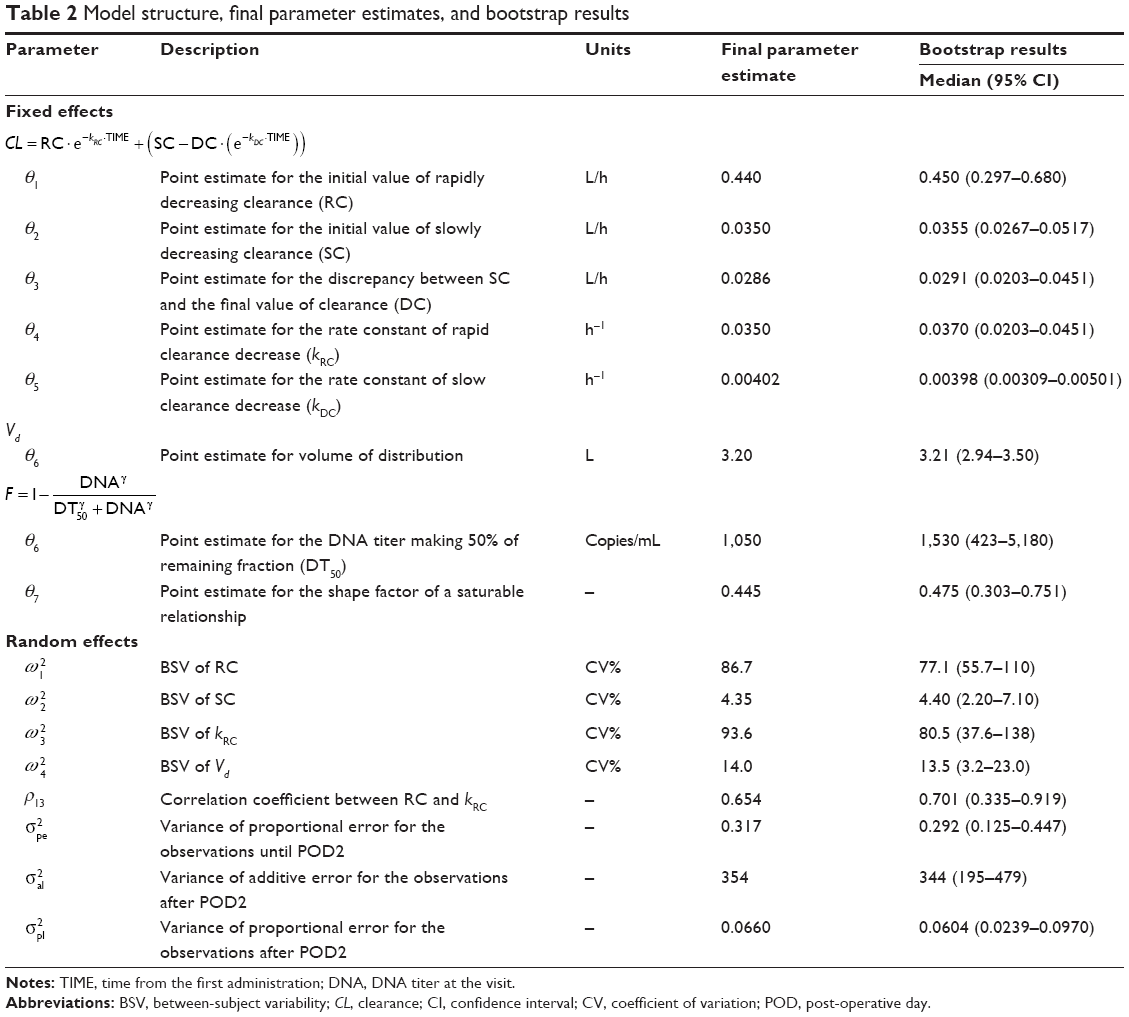 | Table 2 Model structure, final parameter estimates, and bootstrap results |
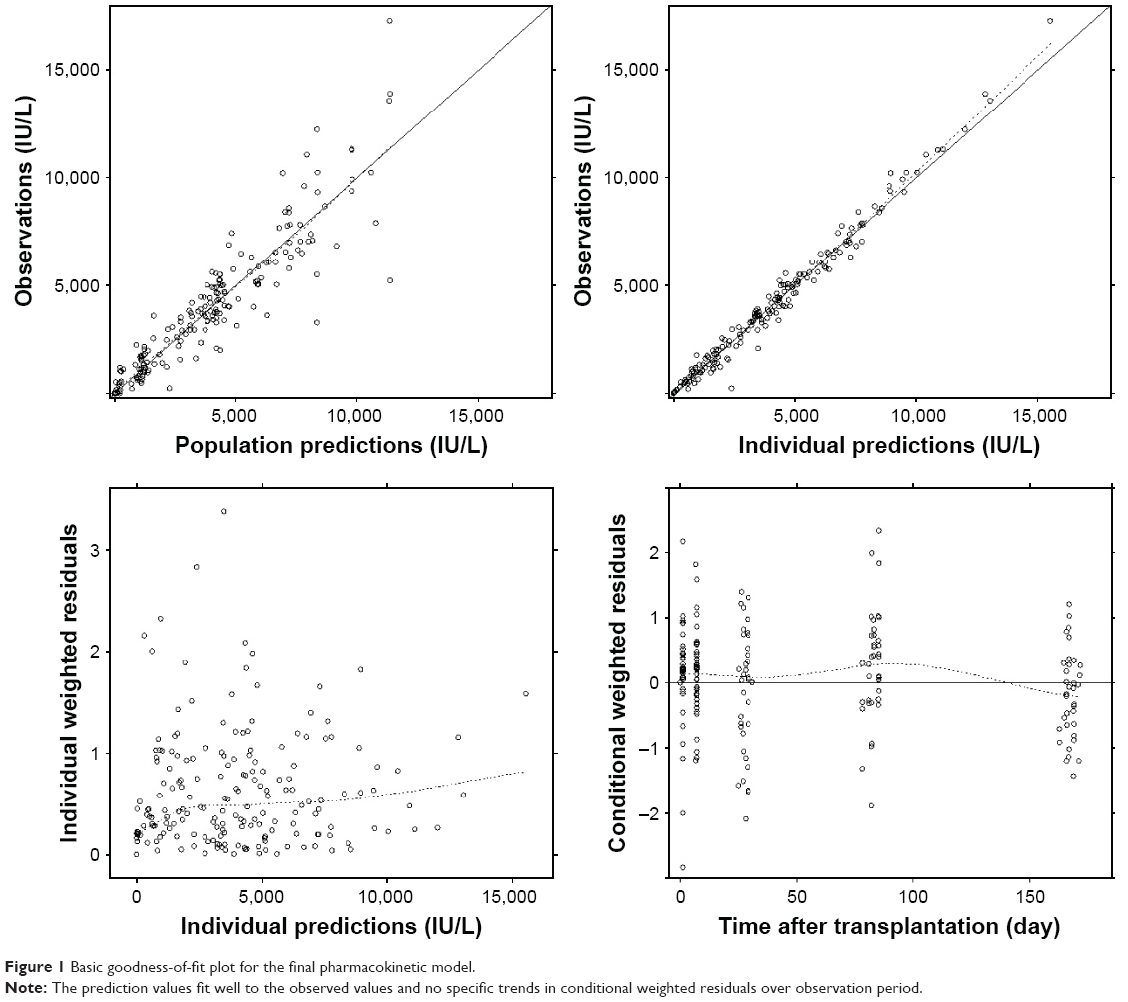 | Figure 1 Basic goodness-of-fit plot for the final pharmacokinetic model. |
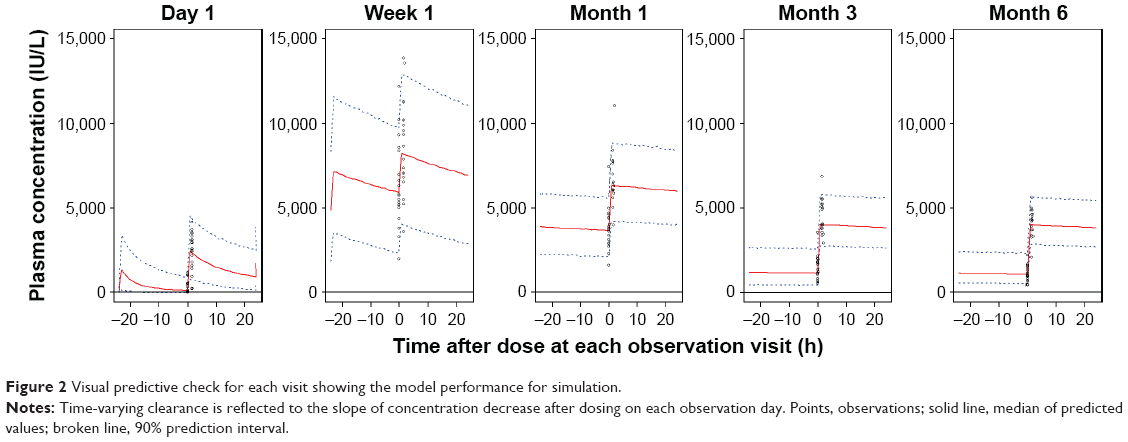 | Figure 2 Visual predictive check for each visit showing the model performance for simulation. |
Comparison of quantification methods
We selected CMIA as the best method, and the modeling results using CMIA concentration data are presented as representing outcome. This is because the minimized OFV was the smallest for the CMIA method (CMIA < ECLIA < ELISA < RIA). Accordingly, final model fit to the CMIA data had the least variance of residual error compared with that of the other methods (CMIA ≈ ECLIA < ELISA < RIA). When Vd was compared as a scaling factor, the relative magnitudes were 0.92, 0.62, and 0.73 for ELISA, ECLIA, and RIA, respectively (CMIA =1). That is, the concentration level determined by ELISA, ECLIA, and RIA was 1.09, 1.61, and 1.40 times higher than that of CMIA for the same plasma sample (Table 3).
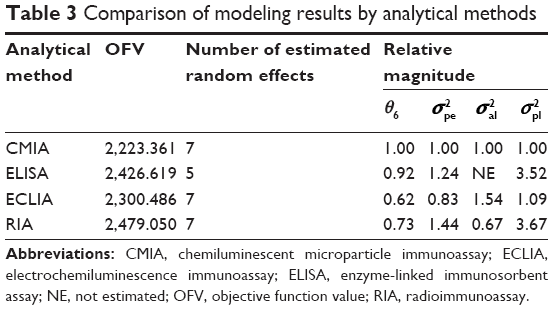 | Table 3 Comparison of modeling results by analytical methods |
Simulation of maintenance period
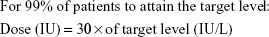
The simulation results at 48 weeks post-transplant are given in Figure 3. According to the results, we could determine the maintenance monthly dose (infused over 1 h at each dosing) required by the proportion of patients who would attain the target trough level. The maintenance doses (in IU) to ensure the target attainment in 90%, 95%, and 99% of patients were expected to be ~16.3 (0.84% coefficient of variation [CV]), 19.5 (1.28% CV), and 27.5 (2.77% CV) multiplied by the target trough level (in IU/L). For example, if a physician plans to maintain the trough level above 150 IU/mL with monthly HBIG dosing in 95% of patients, the required dose predicted by this simulation will be 2,730 IU or simply 3,000 IU for the ease of clinical practice.
 | Figure 3 Predicted concentration and trough level of anti-hepatitis B immunoglobulin 12 months post-transplant by maintenance dose. |
Discussion
We have investigated the PK profile of HBIG from the time immediately after liver transplantation to the 6-month follow-up visit including factors influencing PK parameters. With actual knowledge of the PK of immunoglobulin G, a one-compartment model could be used as a fixed structure. The application of this structure to our study was considered reasonable because 1) the PK profile in previous reports indicates linear elimination, 2) the final estimate for Vd is physiologically plausible (similar to serum volume in adults, ~50% of blood volume), and 3) the estimated terminal half-life is within the known range of HBIG half-life.20,24,25 Thus, the findings from this study generated using the one-compartment model can be justified.
CL is relatively higher in the early post-transplant period with largest BSV resulting in a broad range of trough levels among the patients. This may result from an increase in the metabolic rate after major surgery and the contribution of HBsAg to the elimination of HBIG.26,27 The influence of HBsAg on the HBIG CL is considered as a covariate for dose individualization during the first week or even month after the transplantation when the viral effect on the HBIG elimination may be significant. Although HBsAg did not show any clear relationship with the HBIG concentration in this study, we consider this is because of the insufficient data obtained at only one point per visit (for clinical reasons) and the test method is not adequate to generate data for quantitative analysis. Because HBsAg is the direct target of HBIG, there can be a target-mediated disposition between these molecules; thus, the influence of HBsAg on the HBIG CL needs to be quantified in future studies with an hourly sampling design to measure both HBsAg and HBIG levels during the immediate post-transplant period.
Because of the small number of observations for viral markers (titers for HBsAg, HBeAg, and HBV DNA), only one variable (HBV DNA) could be identified as a factor influencing the PK of HBIG. In the covariate screening step, because HBV DNA had the highest correlation with the CL and Vd of HBIG, it was considered more reasonable to include this variable as a covariate for F (making CL/F, Vd/F). This is a realization of the effect of binding of HBIG to the antigen, rather than a true bioavailability of HBIG, which was given intravenously. Nevertheless, this finding supports suggestions to individualize HBIG by HBV DNA titer.19 In addition, we could present a preliminarily quantitative relationship between HBV DNA titer and adjustment of dose.
In the maintenance period (>1 month from transplantation), the PK profile tends to be stabilized among patients because the magnitude of BSV in CL decreases and HBV DNA was undetectable in most patients. From this finding, the current fixed dosage regimen, which is equally applied to every patient, may be justified, and the recommended maintenance dose for 1-month dosing interval can be determined by the target trough HBIG titer. A rough guideline could be built from the simulation study results, which is more practical and can be clinically implemented as:
|
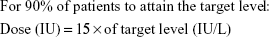
|

|
In many studies performed under clinical settings, the minimum monthly dose tends to be >2,000 IU when the target level is 100 IU/L.28 This dose–concentration relationship can be explained with our model that the predicted level of target attainment is 95%. Thus, the authors believe that our model reliably reflects the PK characteristics of HBIG and that it can be applied to the clinical practice. In other words, the relationship may be considered as a quantitative justification of long-term maintenance HBIG dose that is empirically decided in many cases.
Despite the finding that CMIA was the most precise method for HBIG quantification in terms of the residual error of the final model, there are considerable discrepancies between studies.29 In particular, the relative level of concentration between analytical methods may vary according to the analytical settings and assay kits used.
Conclusion
As seen from the few participants of this study whose HBIG concentration was <500 IU/L on POD 1, some patients may require an amount of HBIG higher than the current dose (10,000 IU) to achieve a level that is protective according to their patient characteristics (demographic, clinical, and viral) and current HBV DNA titer.3 By contrast, some patients may be unnecessarily burdened by the high cost of medication after administration of unnecessarily high doses of HBIG. We believe that this study may contribute to the quantitative individualization of HBIG therapy, particularly during the early post-transplantation period and that continuous efforts should be made to explore influential factors other than currently known qualitative variables to predict the PK profile in each patient and to determine an optimal dosage regimen for individuals.
Acknowledgment
This study was supported by Green Cross Corporation, Yongin, South Korea.
Disclosure
The authors report no conflicts of interest in this work.
References
Roche B, Samuel D. Prevention of hepatitis B virus reinfection in liver transplant recipients. Intervirology. 2014;57(3–4):196–201. | ||
Terrault N. Prophylaxis in HBV-infected liver transplant patients: end of the HBIG era? Am J Gastroenterol. 2013;108(6):949–951. | ||
Shouval D, Samuel D. Hepatitis B immune globulin to prevent hepatitis B virus graft reinfection following liver transplantation: a concise review. Hepatology. 2000;32:1189–1195. | ||
Roche B, Roque-Afonso AM, Nevens F, Samuel D. Rational basis for optimizing short and long-term hepatitis B virus prophylaxis post liver transplantation: role of hepatitis B immune globulin. Transplantation. 2015;99(7):1321–1334. | ||
Honaker MR, Shokouh-Amiri MH, Vera SR, et al. Evolving experience of hepatitis B virus prophylaxis in liver transplantation. Transpl Infect Dis. 2002;4(3):137–143. | ||
Malkan G, Cattral MS, Humar A, et al. Lamivudine for hepatitis B in liver transplantation: a single-center experience. Transplantation. 2000;69(7):1403–1407. | ||
Saab S, Ham MY, Stone MA, Holt C, Tong M. Decision analysis model for hepatitis B prophylaxis one year after liver transplantation. Liver Transpl. 2009;15(4):413–420. | ||
Stravitz RT, Shiffman ML, Kimmel M, et al. Substitution of tenofovir/emtricitabine for Hepatitis B immune globulin prevents recurrence of Hepatitis B after liver transplantation. Liver Int. 2012;32(7):1138–1145. | ||
Fung J, Chan S-C, Cheung C, et al. Oral nucleoside/nucleotide analogs without hepatitis B immune globulin after liver transplantation for hepatitis B. Am J Gastroenterol. 2013;108(6):942–948. | ||
Angus PW, Patterson SJ, Strasser SI, McCaughan GW, Gane E. A randomized study of adefovir dipivoxil in place of HBIG in combination with lamivudine as post-liver transplantation hepatitis B prophylaxis. Hepatology. 2008;48(5):1460–1466. | ||
Gane EJ, Patterson S, Strasser SI, McCaughan GW, Angus PW. Combination of lamivudine and adefovir without hepatitis B immune globulin is safe and effective prophylaxis against hepatitis B virus recurrence in hepatitis B surface antigen-positive liver transplant candidates. Liver Transpl. 2013;19(3):268–274. | ||
Teperman LW, Poordad F, Bzowej N, et al. Randomized trial of emtricitabine/tenofovir disoproxil fumarate after hepatitis B immunoglobulin withdrawal after liver transplantation. Liver Transpl. 2013;19(6):594–601. | ||
Cholongitas E, Goulis I, Antoniadis N, et al. New nucleos(t)ide analogue monoprophylaxis after cessation of hepatitis B immunoglobulin is effective against hepatitis B recurrence. Transpl Int. 2014;27(10):1022–1028. | ||
Kasraianfard A, Watt KD, Lindberg L, Alexopoulos S, Rezaei N. HBIG remains significant in the era of new potent nucleoside analogues for prophylaxis against hepatitis B recurrence after liver transplantation. Int Rev Immunol. 2016;35(4):312–324. | ||
Na GH, Kim DG, Han JH, et al. Prevention and risk factors of hepatitis B recurrence after living donor liver transplantation. J Gastroenterol Hepatol. 2014;29:151–156. | ||
Bae SK, Shimoda S, Ikegami T, et al. Risk factors for hepatitis B virus recurrence after living donor liver transplantation: a 17-year experience at a single center. Hepatol Res. 2015;45(12):1203–1210. | ||
Ohno Y, Mita A, Ikegami T, et al. Successful active immunization using a hepatitis B virus vaccination protocol for a recipient with hepatitis B core antibody-positive liver graft. Transplant Proc. 2014;46:721–725. | ||
Huprikar S, Danziger-Isakov L, Ahn J, et al. Solid organ transplantation from hepatitis B virus-positive donors: consensus guidelines for recipient management. Am J Transpl. 2015;15(5):1162–1172. | ||
Terrault N. Management of the hepatitis B virus in the liver transplantation setting: a European and an American perspective. Liver Transpl. 2005;11:716–732. | ||
Hooman N, Rifai K, Hadem J, et al. Antibody to hepatitis B surface antigen trough levels and half-lives do not differ after intravenous and intramuscular hepatitis B immunoglobulin administration after liver transplantation. Liver Transpl. 2008;14(4):435–442. | ||
Davis GL, Nelson DR, Terrault N, et al. A randomized, open-label study to evaluate the safety and pharmacokinetics of human hepatitis C immune globulin (Civacir) in liver transplant recipients. Liver Transpl. 2005;11(8):941–949. | ||
Ternant D, Mulleman D, Degenne D, et al. An enzyme-linked immunosorbent assay for therapeutic drug monitoring of infliximab. Ther Drug Monit. 2006;28(2):169–174. | ||
Boros P, Gondolesi G, Bromberg JS. High dose intravenous immunoglobulin treatment: mechanisms of action. Liver Transpl. 2005;11(12):1469–1480. | ||
Adler R, Safadi R, Caraco Y, et al. Comparison of immune reactivity and pharmacokinetics of two hepatitis B immune globulins in patients after liver transplantation. Hepatology. 1999;29(4):1299–1305. | ||
Dickson RC, Terrault NA, Ishitani M, et al. Protective antibody levels and dose requirements for IV 5% Nabi hepatitis B immune globulin combined with lamivudine in liver transplantation for hepatitis B-induced end stage liver disease. Liver Transpl. 2006;12(1):124–133. | ||
Desborough JP. The stress response to trauma and surgery. Br J Anaesth. 2000;85:109–117. | ||
Rosenau J, Kreutz T, Kujawa M, et al. HBsAg level at time of liver transplantation determines HBsAg decrease and anti-HBs increase and affects HBV DNA decrease during early immunoglobulin administration. J Hepatol. 2007;46(4):635–644. | ||
Dindoost P, Jazayeri SM, Alavian SM. Hepatitis B immune globulin in liver transplantation prophylaxis: an update. Hepat Mon. 2012;12(3):168–176. | ||
Villar LM, Cruz HM, Barbosa JR, Bezerra CS, Portilho MM, de Paula Scalioni L. Update on hepatitis B and C virus diagnosis. World J Virol. 2015;4(4):323–342. |
 © 2017 The Author(s). This work is published and licensed by Dove Medical Press Limited. The full terms of this license are available at https://www.dovepress.com/terms.php and incorporate the Creative Commons Attribution - Non Commercial (unported, v3.0) License.
By accessing the work you hereby accept the Terms. Non-commercial uses of the work are permitted without any further permission from Dove Medical Press Limited, provided the work is properly attributed. For permission for commercial use of this work, please see paragraphs 4.2 and 5 of our Terms.
© 2017 The Author(s). This work is published and licensed by Dove Medical Press Limited. The full terms of this license are available at https://www.dovepress.com/terms.php and incorporate the Creative Commons Attribution - Non Commercial (unported, v3.0) License.
By accessing the work you hereby accept the Terms. Non-commercial uses of the work are permitted without any further permission from Dove Medical Press Limited, provided the work is properly attributed. For permission for commercial use of this work, please see paragraphs 4.2 and 5 of our Terms.