")
Back to Journals » Clinical Interventions in Aging » Volume 9
Frequency analysis of ultrasonic echo intensities of the skeletal muscle in elderly and young individuals
Authors Nishihara K, Kawai H , Hayashi H, Naruse H, Kimura A, Gomi T, Hoshi F
Received 15 May 2014
Accepted for publication 21 June 2014
Published 3 September 2014 Volume 2014:9 Pages 1471—1478
DOI https://doi.org/10.2147/CIA.S67820
Checked for plagiarism Yes
Review by Single anonymous peer review
Peer reviewer comments 3
Ken Nishihara,1 Hisashi Kawai,2 Hiroyuki Hayashi,3 Hideo Naruse,4 Akihito Kimura,4 Toshiaki Gomi,5 Fumihiko Hoshi1
1Department of Physical Therapy, Saitama Prefectural University, Saitama, Japan; 2Health Promotion Management Office, Tokyo Metropolitan Geriatric Hospital and Institute of Gerontology, Tokyo, Japan; 3Center for University-wide Education, Saitama Prefectural University, Saitama, Japan; 4Faculty of Health Sciences, Tokyo Ariake University of Medical and Health Sciences, Tokyo, Japan, 5Faculty of Nursing, Tokyo Ariake University of Medical and Health Sciences, Tokyo, Japan
Background: The skeletal muscle echo intensity (EI) during ultrasound imaging has been investigated to evaluate the muscle quality. However, EI fluctuates according to the scanning conditions.
Methods: The motor functions and ultrasound images of 19 elderly (73±3.2 years) and 19 young (22±1.5 years) individuals were investigated and an EI frequency component was assessed for more reliable evaluations. Healthy elderly and young subjects participated in this study. The motor functions were assessed during walking and according to the knee extension muscle strength. The muscle thicknesses of rectus femoris (RF), vastus intermedius (VI), and quadriceps femoris (QF) were investigated. EIs were calculated and the mean frequencies of the regions of interest (MFROIs) for RF and VI were analyzed.
Results: EIs and MFROIs were greater in elderly subjects than in young subjects (P<0.01 for RF, and P<0.001 for VI, in EIs; and P<0.01 for RF, and P<0.05 for VI, in MFROIs). In young subjects, EI of RF was greater than that of VI; however, there was no difference between the RF and VI MFROIs in both elderly and young subjects. EIs of VI exhibited a significantly negative correlation with the QF thickness in both elderly and young subjects. RF MFROIs negatively correlated with the QF thickness and positively correlated with EI of VI in elderly subjects alone.
Conclusion: These findings suggest that MFROIs of elderly individuals would have a larger value than those of young individuals; moreover, MFROIs did not fluctuate greatly with the tissue depth and scanning conditions. MFROIs might be thus useful for further investigations of muscle quality and applications for the early prevention of age-related motor functional decline.
Keywords: elderly individual, motor function, muscle strength, ultrasound, echo intensity, frequency analysis
Introduction
Motor function is required for most activities of daily living, including locomotion. The initial stages of motor function decline are exacerbated in elderly individuals in whom these early declines lead to further muscular disuse. This age-related decline includes decreased muscle mass (eg, sarcopenia) and can accompany the accumulation of connective tissues (eg, adipose) in the affected muscles.1,2 The muscle mass can be measured using imaging methods such as magnetic resonance imaging or computed tomography.
Given its safety and accessibility, ultrasound has become a widely used imaging modality in many medical applications. Decreased muscle thickness indicates decreased muscle mass, and increased echo intensity (EI) of the muscle indicates increased adipose level.3–5 Cadore et al reported a relationship between EI and cardiovascular performance.6 Computer-aided grayscale ultrasound images have been analyzed to evaluate the skeletal muscle quality. However, EI fluctuates with changes in the applied location or angle of the ultrasonic probe relative to the observed organ. Moreover, ultrasound devices can modify EIs at different values to improve image quality or resolution. In ultrasound images, deeper tissues are usually modified using a larger EI value in order to adjust the echo attenuation. For these reasons, unstable EI values for observed tissue quality estimations are very difficult to standardize.
The frequency analysis method has been used to evaluate the value qualities for different fields of study. For example, in electromyography, frequency analysis has been used to evaluate the muscle activity quality.7,8 Frequency analysis of EIs of some muscle tissues might represent a more reliable method to evaluate the qualities of such tissues. Fast Fourier Transform (FFT) is the most general frequency analysis method; however, it was designed on the assumption that the calculated data range from −infinity to +infinity. Before analysis, the data are usually modified using some window function to correct the gap between the imaginary infinite data and real finite data if the amount of data is not sufficiently large.9,10 In the case of electromyography, several thousand temporal and linear data points are used for the analysis; however, only tens of spatial but two-dimensional data points are used because the pixel data from the region of interest (ROI) in each muscle must be calculated. FFT of EI would generate a data structure with a lower sensitivity and larger errors than would electromyography.
The aim of this study was to investigate and compare the motor functions and EI of related muscles in young and elderly individuals and to analyze the frequency component of EI using the maximum entropy method, which has primarily been used to analyze heart rate variability.11,12 However, using this method, frequency components can be calculated without the window function, which is appropriate for analyses of limited data. A newly designed muscle quality evaluation system was proposed in this study.
Methods
Subjects
We enrolled 19 elderly individuals aged ≥65 years (mean age ± standard deviation, 73±3.2 years; range, 65–77 years; 14 males, 5 females) with no history of neuromuscular disease and normal participation in the activities of daily living as well as 19 young university students (mean age, 22±1.5 years; range, 21–26 years; 14 males, 5 females) (Table 1). Approval for the study was obtained from the Saitama Prefectural University Ethics Committee. Only individuals who provided informed consent for participation were included.
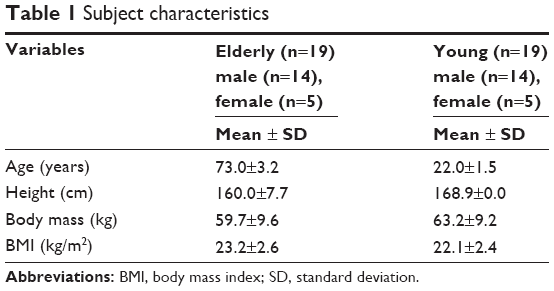 | Table 1 Subject characteristics |
Motor function measurement
Motor function measurements were collected in accordance with the “Appraisal standards for functional measures in independent elderly people” set by the Ministry of Health, Labor and Welfare, Japan. The method was demonstrated to the subjects before beginning the procedure, and the measurement process was begun only after the subjects adequately understood the procedure and after sufficient recovery periods were provided after the preliminary training and between the first and second trials. Four areas of motor function were measured as follows:
- Normal walking (5 m): the subject was asked to walk for a total distance >8 m. The time interval between when a foot first crossed the 3 m mark until the foot crossed the end of the measurement area was recorded. The standard instruction given to all subjects was to “Walk normally in a straight line.”
- Fastest walking (5 m): the subject was again asked to walk for a total distance >8 m; however, the standard instruction given to all subjects was “Walk as quickly as possible in a straight line.”
- Timed up and go (TUG) test: the subject began the test while seated on a chair with his/her back pressed against the back support; the time required to stand, walk to a marker placed 3 m away, turn the marker over, and return to a seated position was measured. The standard instruction given to all subjects was “Return to the seat as quickly as possible.”
- Muscle strength: the maximum isometric knee extension torque was measured in the dominant leg. The subject was seated in a chair with his/her hip and knee in the initial position of 90° flexion. A dynamometer for isometric contraction (μ Tas F-1, operation range 0–980 N; Anima, Tokyo, Japan) was used to measure the force. The subject’s ankle was attached to a belt that was fixed to both the dynamometer and the chair. The subject exerted maximum effort in an attempt to extend his/her knee for >3 seconds, during which the maximum exerted value was measured. The length between the lateral knee joint fissure gap and ankle attachment was measured. The knee extension torque was calculated as the strength multiplied by the length.
High intra-class correlation coefficients (ICCs) more than 0.95 have been reported for similar test with the normal walking, fastest walking, and TUG tests,13,14 and for similar tests for muscle strength.15
Each motor function area was measured twice per subject, and the results were averaged.
Ultrasound image recording
The cross-sectional echo images were recorded using a B-mode ultrasound device (Mysono U6; Samsung Medison, Seoul, Korea). A linear probe (5–12 MHz) was set to 8.8 MHz and placed on the skin perpendicular to the skin surface (Figure 1). All system settings and parameters remained constant for all subjects. The time-gain compensations according to the tissue depths were set to neutral. The fully relaxed subject was seated in a chair with his/her hip and knee at 90° flexion. The muscle strength measurement position was the midpoint between the lateral epicondyle of the femur and the ipsilateral greater trochanter. The probe was positioned perpendicularly to the longitudinal quadriceps femoris (QF) muscle axis, and a transverse plane scan was performed at a depth of 5 cm. The probe head was coated with a transmission gel that provided acoustical contact without compressing the skin surface.
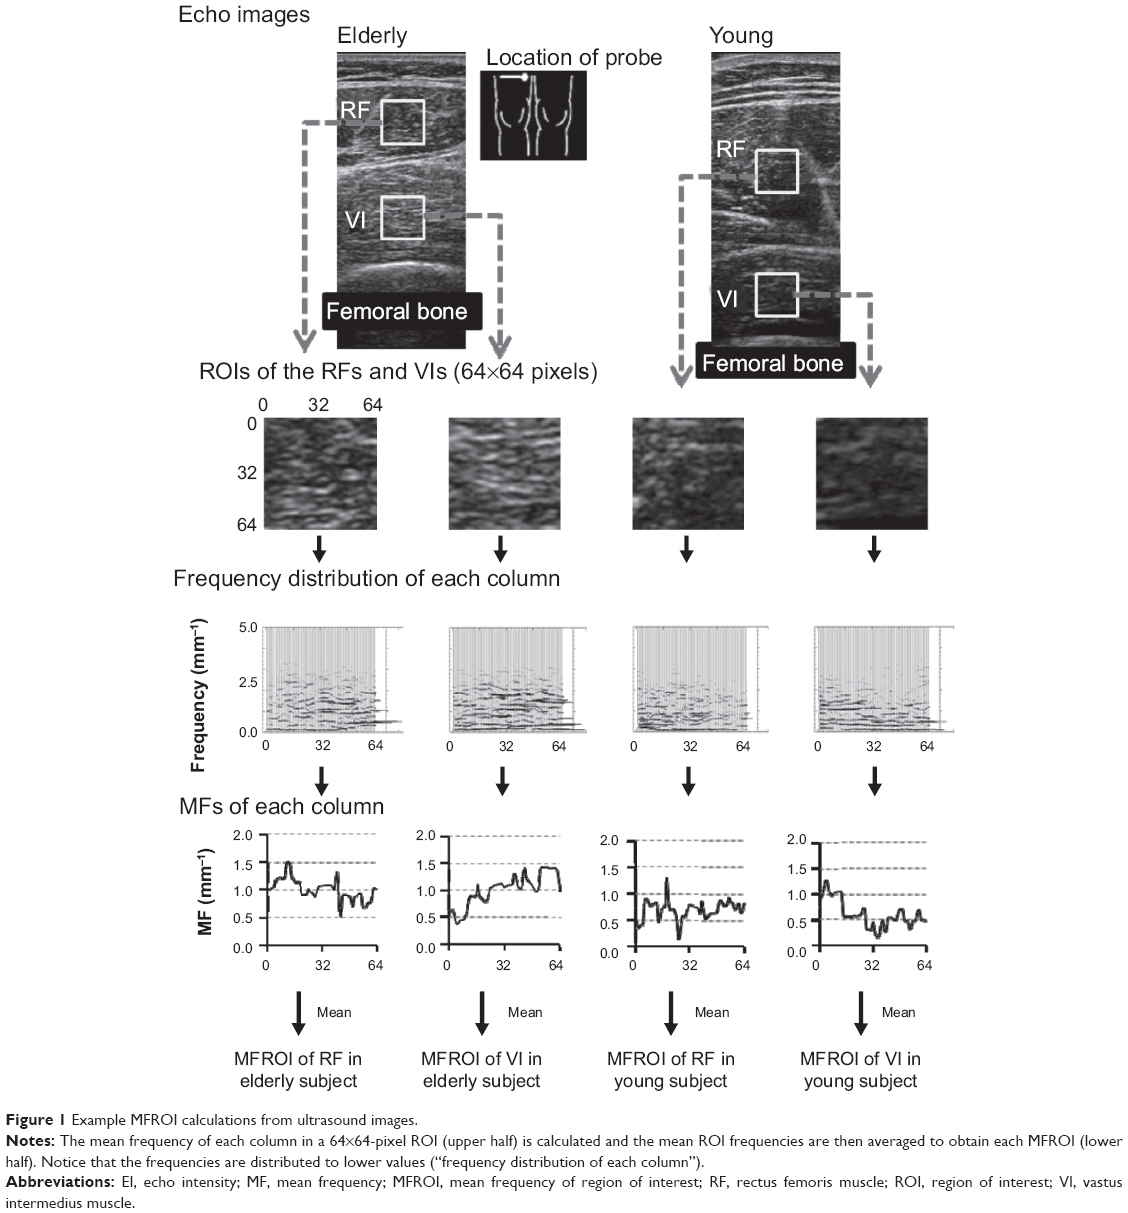 | Figure 1 Example MFROI calculations from ultrasound images. |
Ultrasound image analysis
An electric caliper was used to measure rectus femoris (RF) and vastus intermedius (VI) thicknesses on the recorded ultrasound images. QF thickness was defined as the sum of RF and VI thicknesses. If a fixed scanning depth of 5 cm was insufficient to display the entire muscle, the depth was widened to 5.2 cm for thickness measurements only (Figure 1).
The ultrasound images were exported in bitmap format to a personal computer to measure EI and allow more detailed analyses. Adobe Photoshop CS6 version 13.0 (Adobe Systems, San Jose, CA, USA) was used to extract 64×64-pixel ROIs around the central areas of RF and VI without multiple reflection areas to obtain ROIs of RF and VI. ROI pixel data were converted to a comma-separated value (CSV) format numeric table (64×64 row–column) using Origin Pro version 8.6.0 (Origin, Wheeling, IL, USA). EI of each muscle was determined using the mean grayscale values from 0–256, expressed in ROI values (0: black; 256: white).
The mean frequency of each column was analyzed according to the maximum entropy method using MemCalc version 2.0 (Suwa Trust, Tokyo, Japan).16 The grayscale values of each column comprised the superficial-to-deep 64 rows. The analyzed data comprised a space series of a row × column-pixel image of a single instant, not the temporal series (fluctuated data with the passage of time) generally used for this type of frequency analysis. In this study, the space interval between neighboring pixels (or grayscale values) was 0.1 mm. In MemCalc, a space series is assumed to comprise an underlying variation and fluctuating parts; the underlying variation is expressed as the function XUV(s), which can be described as a linear combination of sine and cosine functions, as follows:
| (1) |
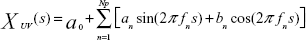
where fn is the frequency of the nth component, an and bn are the amplitudes of the nth periodic component, Np is the total number of components, and a0 is a constant that indicates the mean time series value. The value of fn is determined by peaks in the power spectral density. The estimated value P(f) can be expressed as follows:
|
|
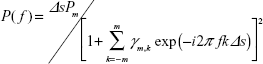
where Pm is the prediction error filter output power of the order m and γm,k is the corresponding filter coefficient m =0, 1, 2, …, M (M = optimum filter order). Pm and γm are determined by Yule–Walker equations, using Burg’s algorithm. The details of these equations and the optimum setting values have been described in previous references, in which this method was used to analyze temporal heart rate variability data.16,17 The calculated mean frequencies of the 64 columns were averaged as the mean frequency of ROI (MFROI; Figure 1).
High ICCs more than 0.90 have been reported for the muscle thickness and the EI.18
Statistical analyses
Statistical processing was conducted with SPSS version 17.0 (SPSS Inc., Chicago, IL, USA). The measured values have been reported as means ± standard deviations. Statistical significance was defined as a P-value <0.05. The non-parametric independent two-sample Mann–Whitney U-test was used to compare the motor functions and ultrasound images of elderly and young subjects; the non-parametric dependent two-sample Wilcoxon test was used to compare the ultrasound images of RF and VI ROIs. In both elderly and young subjects, Pearson correlation coefficients and two-tailed significance were used to estimate the correlations between the measured data of the areas with respect to the motor function, EI, and MFROI.
Results
Motor function comparison
Compared with young subjects, elderly subjects had reduced muscle strength (P<0.01) and slower 5 m fastest walking times (P<0.001) and TUG test times (P<0.001). There was no significant difference in the 5 m normal walking times (Table 2).
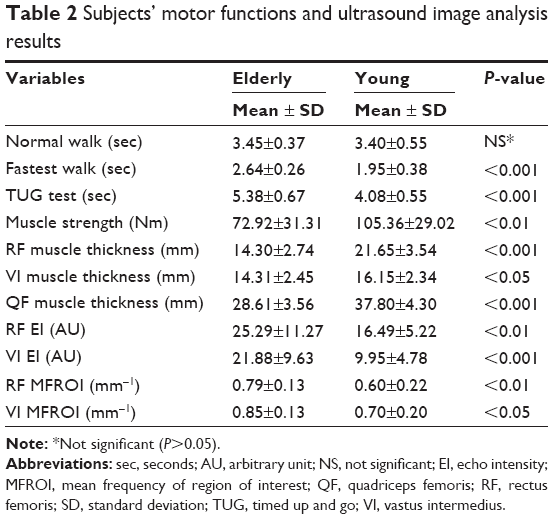 | Table 2 Subjects’ motor functions and ultrasound image analysis results |
Ultrasound image comparison
Compared with young subjects, elderly subjects had reduced RF (P<0.001), VI (P<0.05), and QF thicknesses (P<0.001; Table 2). EI values of RF and VI were significantly greater in elderly subjects than in young subjects (P<0.01 and P<0.001, respectively). MFROIs of RF and VI were also significantly greater in elderly subjects than in young subjects (P<0.01 and P<0.05, respectively). In a comparison of ROI EIs, RF EI significantly differed from the VI EI in young subjects but not elderly subjects (Figure 2A). In a comparison of ROI MFROIs, RF MFROI did not significantly differ from VI MFROI in both elderly and young subjects (Figure 2B).
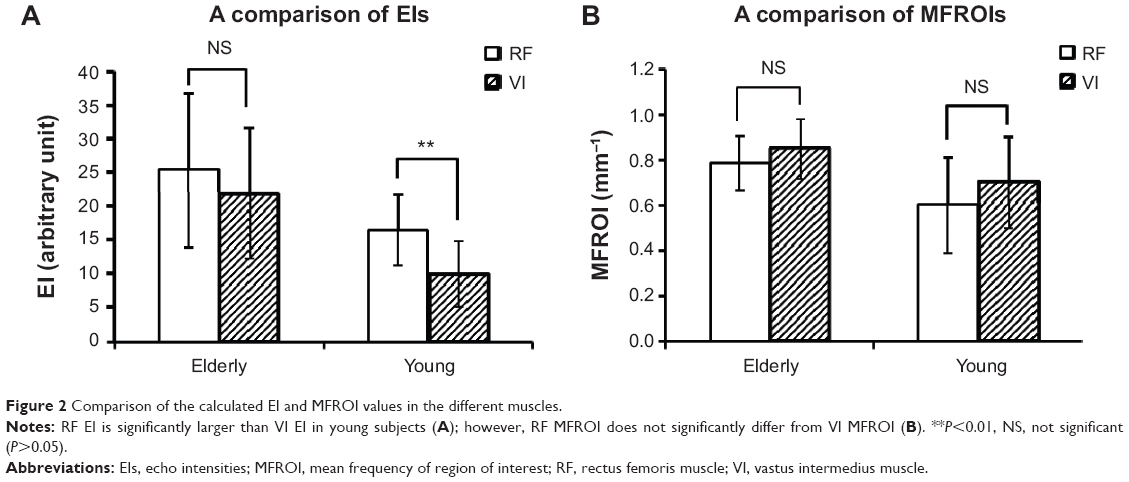 | Figure 2 Comparison of the calculated EI and MFROI values in the different muscles. |
Correlations between the motor functions, muscle thicknesses, EI, and MFROI
A significantly positive correlation was identified between fastest walk and normal walk in both elderly subjects and young subjects, and TUG exhibited significant positive correlations with normal walk and fastest walk in young subjects (Table 3). A significantly positive correlation was identified between RF thickness and muscle strength in both elderly subjects and young subjects, but no significant correlations were found between the other motor function and ultrasound image values, and QF thicknesses exhibited significant positive correlations with RF and VI thicknesses in both elderly subjects and young subjects. VI EIs exhibited significant negative correlations with VI and QF thicknesses in both elderly subjects and young subjects. RF MFROIs exhibited a significant negative correlation with VI and QF thicknesses and a positive correlation with VI EI in elderly subjects.
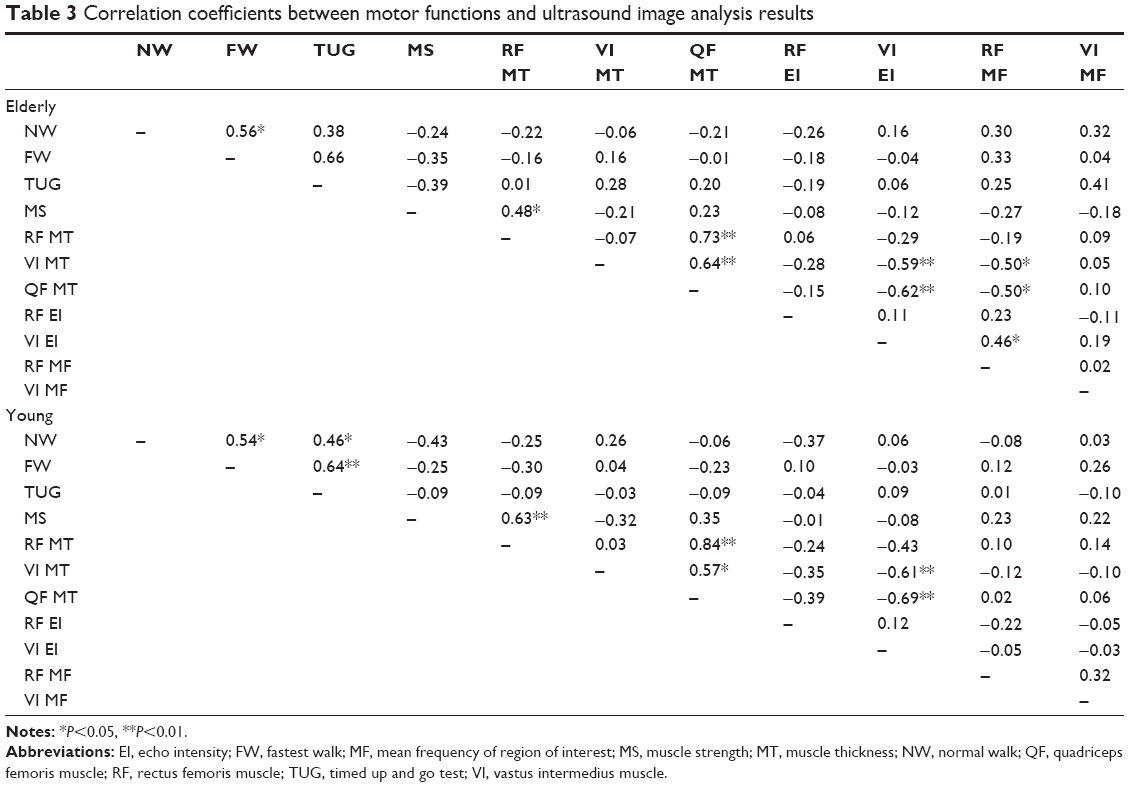 | Table 3 Correlation coefficients between motor functions and ultrasound image analysis results |
Discussion
The most novel proposal of this study was that of a method designed specifically to investigate muscle tissue quality using EI frequency analysis. Using this method, this study yielded three important findings. First, despite a lack of significant difference in normal walking, the healthy elderly subjects had significantly larger MFROI values than the young subjects. Secondly, the MFROIs did not appear to differ greatly between the superficial RF and the deeper VI of ROI relative to the EIs because RF EI was greater than VI EI in the elderly subjects but not significantly different in the young subjects; however, RF MFROIs did not significantly differ between the elderly and the young subjects. Thirdly, the relationships between the MFROIs and muscle thicknesses differed in the elderly and the young subjects because RF MFROIs exhibited a significant negative correlation with VI and RF thicknesses and VI EI in the elderly subjects; however, no significant correlations were observed with any analyzed echo image values in the young subjects.
EI value detection
This study investigated the skeletal muscle quality in healthy elderly and young subjects with grayscale analysis in a more detailed method compared to that used in previous studies. An identical ROI for each RF and VI was used to analyze EI in all subjects. The thinnest measured muscle was sufficiently thicker than the 64-pixel columns. The pixel data, which were collected near the surrounding muscle fascia, were not included for any of the subjects.
Li et al evaluated the EIs of 40×40-pixel ROIs around the forearm flexor muscles and reported that the superficial tissue EI values were significantly greater than those of deeper tissues in young subjects but that no such difference was observed in elderly subjects.19 Similarly, in this study, the RF EI value, which is located more superficially than VI EI, was significantly greater than VI EI in the young subjects but not in the elderly subjects (Figure 1; Figure 2). The decrease in EI according to the tissue depth in the ultrasound images did not correspond with EI attenuation because the ultrasound device had been contrived to improve the image quality regardless of the tissue depth. EI is influenced by the ultrasound device settings, meaning that the grayscale values cannot be generalized by simple value averaging. Therefore, Pillen et al attempted to normalize EI values to improve the reproducibility.20
Validation of the calculated MFROI
The probe scanning frequency is closely related to the echo image resolution and echo attenuation. The average sound velocity through human soft tissues is 1,540 m/s, which is the calibrated velocity for most ultrasound devices.21 The axial (ultrasound image column direction) EI frequency for the scanning of ultrasound images in this study was theoretically estimated as a maximum of 2.86 mm−1 with a probe frequency of 8.8 MHz (wavelength: 1/(1,540 m/s /8,800,000 Hz) =0.000175 m =0.175 mm; resolution: 1/0.175 mm =5.71 mm−1; maximum EI frequency: 5.71 mm−1 ×0.5 (Nyquist theorem) =2.86 mm−1). The real calculated EI frequencies correlated well with the theoretical values because most of the frequencies had distributions <2.86 mm−1 in all subjects (Figure 1; Table 2). The space interval of 0.1 mm indicates a space sampling frequency of 10 mm−1 (1/0.1 mm =10 mm−1). Therefore, the frequency was calculated from 0–5 mm−1 (10 mm−1 ×0.5 [Nyquist theorem] =5 mm−1) in this study (“Frequency distribution of each column” in Figure 1). Only the column direction frequencies were analyzed and averaged because in ultrasound imaging, the row direction resolution is inferior to the column direction resolution.
As a pilot test, the correlation coefficients were calculated using two images taken from the left and right halves of the 64×64-pixel ROIs and confirmed a high correlation (not shown in this study). More validation of this MFROI calculation method would also be needed to confirm the reproducibility as well as showing any measurement bias for further study.
Estimated advantage of MFROI calculation
RF and VI MFROIs in elderly subjects were significantly greater than those in young subjects. However, the calculated MFROIs did not differ between RF and VI EIs in both elderly and young subjects. MFROI might also be more depth-independent than EI. The mean EI frequency calculation could be a general method that is not largely influenced by the depth of the tissue in an ultrasound image.
In ultrasound images, the anterior thigh muscle usually appears as predominantly hypoechoic, although interspersed hyperechoic septa can be identified.22 The calculated MFROI would therefore reflect repetitions of the muscle fibers or fascicles and the septa. The large value of MFROI in an elderly individual would be related to increased levels of diffused adipose tissues in the muscle fibers or fascicles; this has been confirmed using computerized tomography and magnetic resonance imaging.12,23,24 The smaller muscle fibers or fascicles consequent to age-related muscular dystrophy might increase MFROI in elderly individuals.
The MFROI and EI could be caused by more age-related factors than the muscle strengths or muscle thicknesses because the muscle strengths exhibited no significant correlations with the MFROI or EI, although they exhibited significant correlations with the muscle thicknesses in both elderly and young individuals whose ages were narrowly ranged in each group.
We conclude that the ultrasound imaging EI increased in elderly subjects as a result of adipose and connective tissue accumulation that induced changes to frequencies higher than around 0.65 cycles/mm (the mean value of RF and VI MFROI in young subjects was 0.65 mm−1), although elderly subjects did not differ from healthy young subjects when walking at a normal speed. The negative correlation between QF thickness and RF MFROI suggests that age-related muscle mass decreases along with adipose and/or connective tissue accumulation, a correlation that was not observed in young subjects.
Based on these results, the main advantage of ultrasound image frequency analysis is apparent: the change in EI frequencies per mm could be directly related to the anatomical tissue structure, with only small influences from the scanning conditions of an ultrasound device.
These newly suggested methods could be useful for an easily accessible and safe method to evaluate muscle quality with aging that may offer more detailed information than only EI, and further investigations of muscle quality and applications for the early prevention of age-related motor functional declines.
Disclosure
The authors report no conflict of interest in this work.
References
Malafarina V, Uriz-Otano F, Iniesta R, Gil-Guerrero L. Sarcopenia in the elderly: diagnosis, physiopathology and treatment. Maturitas. 2012;71(2):109–114. | ||
Landi F, Liperoti R, Russo A, et al. Sarcopenia as a risk factor for falls in elderly individuals: results from the ilSIRENTE study. Clin Nutr. 2012;31(5):652–658. | ||
Pillen S, Tak RO, Zwarts MJ, et al. Skeletal muscle ultrasound: correlation between fibrous tissue and echo intensity. Ultrasound Med Biol. 2009;35(3):443–446. | ||
Arts IM, Pillen S, Schelhaas HJ, Overeem S, Zwarts MJ. Normal values for quantitative muscle ultrasonography in adults. Muscle Nerve. 2010;41(1):32–41. | ||
Watanabe Y, Yamada Y, Fukumoto Y, et al. Echo intensity obtained from ultrasonography images reflecting muscle strength in elderly men. Clin Interv Aging. 2013;8:993–998. | ||
Cadore EL, Izquierdo M, Conceição M, et al. Echo intensity is associated with skeletal muscle power and cardiovascular performance in elderly men. Exp Gerontol. 2012;47(6):473–478. | ||
McHugh MP, Tyler TF, Browne MG, Gleim GW, Nicholas SJ. Electromyographic predictors of residual quadriceps muscle weakness after anterior cruciate ligament reconstruction. Am J Sports Med. 2002;30(3):334–339. | ||
Bilodeau M, Schindler-Ivens S, Williams DM, Chandran R, Sharma SS. EMG frequency content changes with increasing force and during fatigue in the quadriceps femoris muscle of men and women. J Electromyogr Kinesiol. 2003;13(1):83–92. | ||
Pincivero DM, Coelho AJ, Campy RM. Contraction mode shift in quadriceps femoris muscle activation during dynamic knee extensor exercise with increasing loads. J Biomech. 2008;41(15):3127–3132. | ||
Hendrix CR, Housh TJ, Zuniga JM, et al. A mechanomyographic frequency-based fatigue threshold test. J Neurosci Methods. 2010; 187(1):1–7. | ||
Takusagawa M, Komori S, Umetani K, et al. Alterations of autonomic nervous activity in recurrence of variant angina. Heart. 1999;82(1):75–81. | ||
Kumar D, Karampinos DC, Macleod TD, at al. Quadriceps intramuscular fat fraction rather than muscle size is associated with knee osteoarthritis. Osteoarthritis Cartilage. 2014;22(2):226–234. | ||
Steffen TM, Hacker TA, Mollinger L. Age- and gender-related test performance in community-dwelling elderly people: Six-Minute Walk Test, Berg Balance Scale, Timed Up & Go Test, and gait speeds. Phys Ther. 2002;82(2):128–137. | ||
Peters DM, Fritz SL, Krotish DE. Assessing the reliability and validity of a shorter walk test compared with the 10-Meter Walk Test for measurements of gait speed in healthy, older adults. J Geriatr Phys Ther. 2013;36(1):24–30. | ||
Wang CY, Olson SL, Protas EJ. Test-retest strength reliability: hand-held dynamometry in community-dwelling elderly fallers. Arch Phys Med Rehabil. 2002;83(6):811–815. | ||
Murasato Y, Hirakawa H, Harada Y, Nakamura T, Hayashida Y. Effects of systemic hypoxia on R-R interval and blood pressure variabilities in conscious rats. Am J Physiol. 1998;275(3 Pt 2):H797–H804. | ||
Fukumoto Y, Ikezoe T, Yamada Y, et al. Skeletal muscle quality assessed from echo intensity is associated with muscle strength of middle-aged and elderly persons. Eur J Appl Physiol. 2012;112(4):1519–1525. | ||
Kanaya N, Hirata N, Kurosawa S, Nakayama M, Namiki A. Differential effects of propofol and sevoflurane on heart rate variability. Anesthesiology. 2003;98(1):34–40. | ||
Li X, Karmakar MK, Lee A, Kwok WH, Critchley LA, Gin T. Quantitative evaluation of the echo intensity of the median nerve and flexor muscles of the forearm in the young and the elderly. Br J Radiol. 2012;85(1014):e140–e145. | ||
Pillen S, van Dijk JP, Weijers G, Raijmann W, de Korte CL, Zwarts MJ. Quantitative gray-scale analysis in skeletal muscle ultrasound: a comparison study of two ultrasound devices. Muscle Nerve. 2009;39(6): 781–786. | ||
Curry RA, Tempkin BB. Ultrasonography: An Introduction to Normal Structure and Functional Anatomy. Philadelphia: W.B. Saunders Company; 1995. | ||
Jacobson JA. Fundamentals of musculoskeletal ultrasound. 2nd ed. Philadelphia: Elsevier Saunders; 2013. | ||
Wehrli NE, Bural G, Houseni M, Alkhawaldeh K, Alavi A, Torigian DA. Determination of age-related changes in structure and function of skin, adipose tissue, and skeletal muscle with computed tomography, magnetic resonance imaging, and positron emission tomography. Semin Nucl Med. 2007;37(3):195–205. | ||
Scafoglieri A, Deklerck R, Tresignie J, De Mey J, Clarys JP, Bautmans I. Assessment of regional adipose tissue depots: a DXA and CT comparison in cadavers of elderly persons. Exp Gerontol. 2013; 48(9):985–991. |
 © 2014 The Author(s). This work is published and licensed by Dove Medical Press Limited. The full terms of this license are available at https://www.dovepress.com/terms.php and incorporate the Creative Commons Attribution - Non Commercial (unported, v3.0) License.
By accessing the work you hereby accept the Terms. Non-commercial uses of the work are permitted without any further permission from Dove Medical Press Limited, provided the work is properly attributed. For permission for commercial use of this work, please see paragraphs 4.2 and 5 of our Terms.
© 2014 The Author(s). This work is published and licensed by Dove Medical Press Limited. The full terms of this license are available at https://www.dovepress.com/terms.php and incorporate the Creative Commons Attribution - Non Commercial (unported, v3.0) License.
By accessing the work you hereby accept the Terms. Non-commercial uses of the work are permitted without any further permission from Dove Medical Press Limited, provided the work is properly attributed. For permission for commercial use of this work, please see paragraphs 4.2 and 5 of our Terms.