")
Back to Journals » Integrated Blood Pressure Control » Volume 11
Free radical scavenging reverses fructose-induced salt-sensitive hypertension
Authors Zenner ZP , Gordish KL, Beierwaltes WH
Received 29 July 2017
Accepted for publication 8 November 2017
Published 19 December 2017 Volume 2018:11 Pages 1—9
DOI https://doi.org/10.2147/IBPC.S147674
Checked for plagiarism Yes
Review by Single anonymous peer review
Peer reviewer comments 4
Editor who approved publication: Dr Konstantinos Tziomalos
Zachary P Zenner, Kevin L Gordish, William H Beierwaltes
Department of Internal Medicine, Hypertension and Vascular Research Division, Henry Ford Hospital, Detroit, MI, USA
Abstract: We have previously reported that a moderate dietary supplementation of 20% fructose but not glucose leads to a salt-sensitive hypertension related to increased proximal sodium–hydrogen exchanger activity and increased renal sodium retention. We also found that while high salt increased renal nitric oxide formation, this was retarded in the presence of fructose intake. We hypothesized that at least part of the pathway leading to fructose-induced salt-sensitive hypertension could be due to fructose-induced formation of reactive oxygen species and inappropriate stimulation of renin secretion, all of which would contribute to an increase in blood pressure. We found that both 20% fructose intake and a high-salt diet stimulated 8-isoprostane excretion. The superoxide dismutase (SOD) mimetic tempol significantly reduced this elevated excretion. Next, we placed rats on a high-salt diet (4%) for 1 week in combination with normal rat chow or 20% fructose with or without chronic tempol administration. A fructose plus high-salt diet induced a rapid increase (15 mmHg) in systolic blood pressure and reversed high salt suppression of plasma renin activity. Tempol treatment reversed the pressor response and restored high salt suppression of renin. We conclude that fructose-induced salt-sensitive hypertension is driven by increased renal reactive oxygen species formation associated with salt retention and an enhanced renin–angiotensin system.
Keywords: reactive oxygen species, tempol, sodium, renin, oxidative stress
Introduction
Rats fed a high-fructose diet have been characterized as a model of insulin resistance and associated hypertension.1,2 An animal model was first reported by Hwang et al3 in rats fed with very high fructose (66% of their caloric intake) which developed type 2 diabetes, hyperinsulinemia, hypertriglyceridemia, metabolic syndrome, and hypertension within 2 weeks. Similar studies using glucose had no such effect. However, this model has been criticized because of the excessive amount of fructose required to produce these results. When similar studies have been carried out using just 20% fructose in the drinking water but without high salt (HS), it took much longer (8–12 weeks) to develop systolic hypertension, and this was accompanied by parameters such as obesity, hypertrophy of adipocytes, hypertriglyceridemia, and hyperglycemia.4
It has been suggested that fructose-induced hypertension results from excess renal salt retention.5 Our laboratories have previously shown that fructose, at levels consistent with those consumed by the upper 20th percentile of the human population, does not induce hypertension in rats during 2 weeks if consuming a normal salt intake (0.4% NaCl). However, combining fructose and an HS intake (4.0% NaCl) resulted in a rapid and significant rise in blood pressure (15–20 mmHg) within 1 week.6,7 We also reported that combining HS diet with 20% fructose (but not with glucose) intake led to significant sodium retention associated with the increase in blood pressure.7 Further, we reported6 that fructose but not glucose acutely stimulated luminal sodium–hydrogen exchanger activity in the proximal tubule. These studies led us to conclude that 20% fructose intake results in a predisposition for salt-sensitive hypertension well before the previously reported4 effects of a 20% fructose diet alone on blood pressure over 8–12 weeks.
The renin–angiotensin system is an important regulator of blood pressure.8,9 Inappropriate elevation of renin can cause both salt-sensitive and salt-independent hypertension. Renin activity is the rate-limiting step in the formation of angiotensin II (Ang II). Salt sensitivity of blood pressure in renin-dependent hypertension results largely from the effects of Ang II on the kidney primarily due to increases in sodium reabsorption by the nephron. Ang II increases activation and production of proinflammatory cytokines in the kidney, which are believed to play an important role in the development of salt-sensitive hypertension.10–12 Ang II induces the production of reactive oxygen species in the proximal tubule mainly through the activation of nicotinamide adenine dinucleotide phosphate (NADPH) oxidase, leading to tubulointerstitial injury.13 These products also mediate various signaling pathways involved in intrarenal inflammation and hypertension. Several studies have implicated activation of renin secretion by a high-fructose diet.14,15
We found7 that fructose acutely enhances the sensitivity of angiotensin-stimulated sodium–hydrogen exchanger activity in the rat proximal tubule. Queiroz-Leite et al16 have similarly found that fructose stimulates proximal sodium–hydrogen exchanger 3 (NHE3) activity. So, while Ang II may directly affect sodium reabsorption in this model, it is not known whether moderate fructose intake directly stimulates renin secretion or if it interacts with Ang II and an HS diet to cause hypertension, or a combination of both.
Reactive oxygen species such as superoxide (O2-) and hydrogen peroxide (H2O2) are increased in the renal cortex in genetic models of salt-sensitive hypertension.17 HS diet has also been shown to increase 8-isoprostane excretion, a marker for increased renal reactive oxygen species formation.18 Besides having intrinsic vasoconstrictor properties and decreasing the bioavailability of the intrinsic vasodilator and natriuretic nitric oxide,19,20 it has been reported that reactive oxygen species can stimulate the secretion of renin21 directly from the juxtaglomerular cells. Further, Ang II is a well-known stimulator of reactive oxygen species.18 High fructose has also been linked to increased reactive oxygen species production. In vitro, fructose added to the culture media of skeletal muscle cells22 provoked mitochondrial reactive oxygen species formation, mitochondrial dysfunction and progressive apoptosis. In vivo, fructose ingestion prior to aerobic exercise in male athletes resulted in a significant rise in oxidative stress,23 not seen with glucose ingestion. From all of these related observations, we hypothesized that at least part of the pathway leading to fructose-induced salt-sensitive hypertension could be due to fructose-induced increased reactive oxygen species and inappropriate stimulation of renin secretion, all of which would contribute to an increase in blood pressure.
Materials and methods
Our studies employed male Sprague Dawley rats initially weighing 220–300 g (8–10 weeks of age), which were obtained from Charles Rivers Laboratories (Kingston, NY, USA). All procedures were approved by the Henry Ford Health System Institutional Animal Care and Use Committee (IACUC) and adhered to the guiding principles in the care and use of experimental animals in accordance with the National Institute of Health (NIH) guidelines. Henry Ford Hospital operates an American Association for Laboratory Animal Care (AALAC)-certified animal care facility.
Protocol 1: urinary 8-isoprostane excretion with fructose and HS rats
Groups
This study was gleaned from data obtained over 2 years using identical protocols of 2-week duration, including all rats from protocol 2. After the initial training period, rats were placed on one of six diet permutations including 1) a control (C) diet, eating standard rat chow containing 0.4% NaCl (Harlan Teklad, Madison, WI, USA) over 2 weeks (n = 9), 2) an HS diet, in which the standard diet was replaced by an HS diet (4% NaCl; Harlan Teklad) during the second week of the protocol (n = 17), 3) an HS plus tempol (HS + T) treatment, where the rats received the free radical scavenger tempol (Sigma-Aldrich Co., St Louis, MO, USA) in the drinking water (15 mg tempol/400 g rat/day) throughout the 2 weeks and were switched to the HS diet during the second week (n = 9), 4) fed with fructose (F), in which the rats received the normal rat chow, but their drinking water was supplemented with 20% fructose (Sigma-Aldrich Co.) throughout the 2-week study period (n = 9), 5) HS plus fructose (HS + F), in which the rats received the 20% fructose drinking water throughout the 2 weeks and were switched to the HS diet during the second week of the study (n = 27), and 6) HS plus fructose plus tempol (HS + F + T) treatment, in which the rats received both 20% fructose plus tempol in their drinking water throughout the 2 weeks and were switched to the HS diet during the second week (n = 7). During the final 48 h of the study period, the rats were moved to metabolic caging and allowed to acclimate to the new environment for 1 day. For the second 24 h, urine was collected and the volume was measured gravimetrically.
Urinary 8-isoprostane excretion
A portion of each urine sample was assayed for urinary excretion of 8-isoprostane, a marker of oxidative stress.24 Urine collection vials contained 200 µL of anti-anti, an antifungal, antimicrobial agent (Thermo Fisher Scientific, Waltham, MA, USA). Collected urine samples were centrifuged to eliminate particulate contamination. An 8-isoprostane enzyme-linked immunosorbent assay (ELISA) kit was used to measure urinary concentration (Cayman Chemical, Ann Arbor, MI, USA). Urinary concentrations were multiplied by urine volumes to obtain 24 h 8-isoprostane excretion values, expressed as ng/24 h.
Protocol 2: systolic blood pressure with tempol treatment of fructose- and HS-fed rats
Male Sprague Dawley rats weighing 226–251 g were housed in standard caging. Prior to the beginning of the protocol, rats were allowed free access to distilled water and normal rat chow containing 0.4% sodium chloride (Harlan Teklad). In addition, rats were pretrained over 7–10 days on a noninvasive tail cuff plethysmography multichannel system (Kent Scientific, Torrington, CT, USA). When the protocol commenced, systolic blood pressure was measured every other day for the duration of the 2-week protocol. In our experience, with proper training and consistent methodology, tail cuff systolic blood pressure measurements are reliable and match systolic blood pressure data obtained using telemetry.
Rats were distributed into one of four treatment groups. These included 1) the HS diet control group (HS-C), in which the standard diet was replaced by an HS diet (4% NaCl) during the second week of the protocol (n = 8); 2) the HS + T-treated group, where the rats received the free radical scavenger tempol (Sigma-Aldrich Co.) in the drinking water (15 mg tempol/400 g rat/day) throughout the 2 weeks and were switched to the HS diet during the second week (n = 9); 3) the HS + F group, in which the rats received drinking water containing 20% fructose in their drinking water throughout the 2 weeks and were switched to the HS diet during the second week of the study (n = 9); and 4) the HS + F + T group, in which the rats received both 20% fructose plus tempol in their drinking water throughout the 2 weeks and were switched to the HS diet during the second week (n = 8). We did not include any groups on a normal salt diet as we have previously documented their responses extensively in comprehensive metabolic balance studies7 and blood pressure did not change within this 2-week time frame.
Diet and body weight
During the first week of the 14-day protocol, all rats were fed normal rat chow (0.4% NaCl). For the second week, the diet in every group was switched to HS (4.0% NaCl). Both the normal rat chow and the HS diets were obtained from Harlan Teklad, and otherwise were identical in nutrient and caloric content. The rat chow had an energy density of 3 kcal/g (Harlan Data Sheet #8640). The energy density of fructose is 4 kcal/g.
Body weight was recorded every other day using a covered rodent triple-beam balance (Ohaus, Parsippany, NJ, USA).
Drinking water/tempol + fructose administration
Prior to the 2-week protocol, an initial training period of 1 week was run. Rats were then assigned to one of four dietary treatment groups. To assure consistent drug intake, all rats were given a volume of 35 mL of their assigned drinking water once every 24 h for week 1 of the protocol. When scheduling allowed, rats of all groups were given free access to distilled water but only after drinking their initial treatment volume. For the second week of the protocol, assigned drinking water doses were increased in volume from 35 mL to 45 mL. This change was designed to accommodate an anticipated greater thirst with the change to an HS diet in the second week of the protocol. Each group’s drinking water solution was prepared every 2–3 days apart and stored in a refrigerator to limit microbial growth.
Sodium excretion
Two 24 h urine collections were obtained over the final 48 h of the 2-week protocol. The rats were placed in metabolic cages. In these, their urine drained freely through the wire mesh bottom of the cage, then through a wire mesh feces trap, and into a 50 mL conical tube containing 200 mL of antibiotic–antimycotic solution to prevent growth of bacteria (Thermo Fisher Scientific). All the initial 24 h urine collection samples were discarded, and only the urines from the final 24 h of the protocol were analyzed. The volume of these final 24 h urine samples was measured by weight using an Ohaus electronic balance (Mettler Toledo, Columbus, OH, USA). Urine samples were spun at 3500 rpm at 4°C for 10 min to remove sediment. Samples were transferred to Eppendorf tubes and placed in a -80° freezer. Sodium excretion was calculated from 24 h urine volumes and sodium concentrations measured by a Nova Biomedical 1 electrolyte analyzer (Nova Biomedical, Waltham, MA, USA).
Plasma renin activity (PRA)
At the end of the protocol, rats were euthanized via decapitation using a rat guillotine (Harvard Bioscience, Cambridge, MA, USA). Promptly after decapitation, the first 3 s of trunk blood were collected for PRA analyses in 15 mL tubes containing 200 μL of 6% EDTA in 0.9% NaCl. This collection method has been approved by our IACUC as it avoids the abnormal stimulation of PRA by the renal baroreceptor reflex and by anesthesia, which would otherwise abnormally increase PRA.25 Additional blood samples were taken using either 200 μL of 6% EDTA (Sigma-Aldrich Co.), or 100 µL of sodium heparin (Sagent Pharmaceuticals, Schaumburg, IL, USA) as anticoagulants. Blood samples were spun at 1,000× g at 4°C for 10 min, and the plasma was separated and stored at −80°C until further analysis.
PRA was analyzed by generation of angiotensin I (Ang I; ng Ang I×mL−1×h−1×min−1) using a Gamma Coat RIA kit (DiaSorin, Stillwater, MN, USA) as previously described26 and according to the manufacturer’s instructions. Following blood collection, the kidneys were excised, decapsulated, blotted, weighed, split, and inspected for gross abnormalities (hydronephrosis, lobular appearance, ischemic areas, etc), and none were found. In previous studies characterizing this model, within this 2-week protocol duration, we did not observe any microscopic histological changes nor proteinuria.
Blood glucose
Blood glucose was measured at the end of the protocol. For 24 h prior to euthanasia, the rat groups were fasted, but allowed access to water. Following euthanasia, blood droplets were collected from trunk blood to measure fasting plasma glucose levels. Blood glucose was measured with a True Result Blood Glucose Monitor (CVS, Woonsocket, RI, USA).
Statistical treatments
Single comparisons were run using a Student’s t-test. Change between two periods was evaluated using a paired t-test. Multiple comparisons were run using analysis of variance (ANOVA) or ANOVA with repeated measures. For a post hoc test, we used the Newman–Keuls test. Statistical significance was established by a p-value of at least 0.05.
Results
Protocol 1: urinary 8-isoprostane excretion with fructose and HS rats
To test the effect of 20% fructose and an HS diet on renal oxidative stress, we measured 24 h urinary 8-isoprostane excretion. 8-Isoprostane excretion in the six study groups (Figure 1) were: 1) (C) 16.38 ± 1.30, 2) (HS) 26.69 ± 0.51, 3) (HS + T) 26.86 ± 4.60, 4) (F) 32.18 ± 3.89 5) (HS + F) 29.84 ± 1.96, and 6) (HS + F + T) 20.80 ± 3.40 ng/24 h. By the end of the 2-week study period, 8-isoprostane was significantly higher by 80–90% (p < 0.01) in all groups fed either HS, 20% fructose, or a combination of the two (Figure 1) compared to controls. There were no differences among the different HS or fructose-fed groups with elevated 8-isoprostane excretion. Tempol treatment did not affect the increased 8-isoprostane excretion in the HS-only group, but significantly reduced 8-isoprostane excretion in the HS + F + T group by 40% (p < 0.028; Figure 1). Thus, both HS and 20% fructose increased this marker for oxidative stress, but when combined the effects were not additive. Tempol treatment reduced this elevation of 8-isoprostane only when both HS and fructose were present.
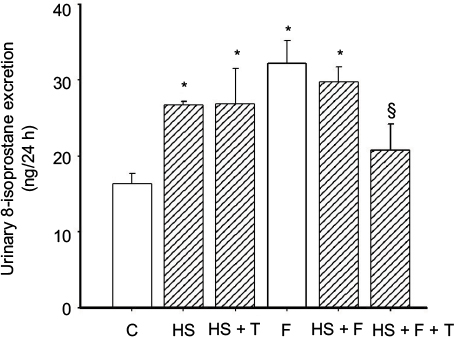 | Figure 1 Protocol 1: 8-isoprostane excretion in the six different groups. Notes: C = control, normal salt (0.4% NaCl) diet; HS (4.0% NaCl) diet; HS + T, HS plus tempol-treated; F = 20% fructose-fed group; HS + F, 20% fructose-fed plus an HS diet; HS + F + T, 20% fructose-fed plus an HS diet and treated with tempol. *p < 0.01 vs C (adjusted for multiple comparisons), §p < 0.028 vs HS + fructose-fed group. Abbreviations: C, control; F, fructose; HS, high salt; T, tempol. |
Protocol 2: systolic blood pressure with tempol treatment of fructose and HS rats
Diet and body weight
Body weights between the four groups were similar both at the beginning and at the end of the 2-week protocol (Table 1). Thus, growth rate was also similar among the four groups (Table 1). While growth in the two groups treated with tempol appeared somewhat slower, none of these differences were statistically significant. Kidney weights at the end of the study period were also similar among the four groups.
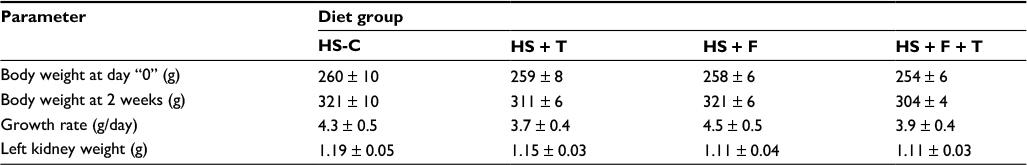 | Table 1 Protocol 2: body weight and kidney weight Abbreviations: C, control; F, fructose; HS, high salt; T, tempol. |
Systolic blood pressure
The mean systolic blood pressures within the four groups (138 ± 2 mmHg) were similar at the beginning of the protocol after the training period and were not still not different from each other after a week on the high-fructose diet (Figure 2A): the HS-C group, 144 ± 6 mmHg; the HS + T-treated group, 142 ± 4 mmHg; the HS + F group, 142 ± 4 mmHg; the HS + F + T-treated group, 132 ± 12 mmHg. Over the final week, when HS was added to the diets, the blood pressure in the HS + F group began increasing within 4 days (150 ± 5 mmHg, p < 0.05) and increased even further (Figure 2A) by the end of the protocol. After a week of receiving both 20% fructose and HS, the blood pressure was increased by over 15 mmHg (156 ± 6 mmHg, p < 0.01); a rise similar to what we have previously reported.7 Blood pressure in the other three groups remained unchanged after 7 days on HS: HS-C group, 139 ± 4 mmHg; HS + T-treated group, 138 ± 3 mmHg; HS + F + T-treated group, 136 ± 3 mmHg. Thus, tempol treatment completely reversed the increase in blood pressure seen with the combination of 20% fructose and HS (Figure 2B).
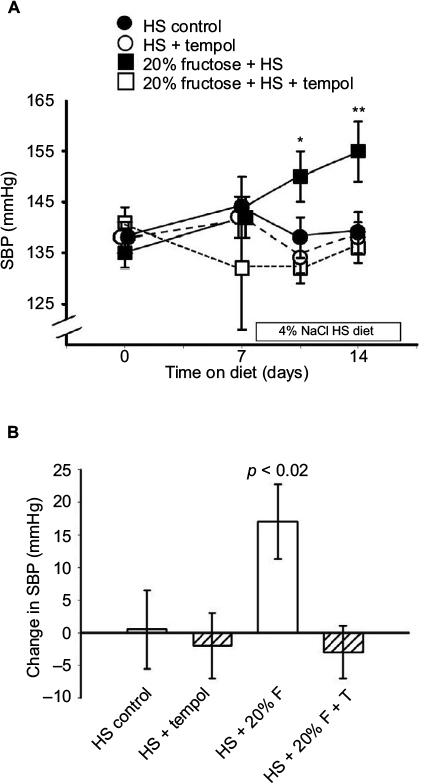 | Figure 2 Effect of the different diets/treatments on systolic blood pressure. Notes: Protocol 2: (A) the SBP over 2 weeks on 20% fructose with HS diet during the second week and the effects of tempol treatment. *p < 0.05, **p < 0.01 vs control SBP at day “0.” (B) The changes in SBP over the 2 weeks of the study in each group. Abbreviations: F, fructose; HS, high salt; SBP, systolic blood pressure; T, tempol. |
Drinking water/tempol + fructose administration
Sodium and water excretion
The 24 h sodium excretion in the four groups on the last day of the 2-week protocols was not statistically different from each other. The values were 1) HS-C, 2.20 ± 0.65 mM/24 h; 2) HS + T, 3) 1.63 ± 0.25 mM/24 h; 4) HS + F, 1.74 ± 0.27 mM/24 h, and HS + F + T, 2.14 ± 0.24 mM/24 h.
The 24 h urinary excretion in the four groups on the last day of the 2-week protocols were 1) HS-C, 27.3 ± 3.9 mL/24 h; 2) HS + T, 12.0 ± 2.7 mL/24 h; 3) HS + F, 25.7 ± 1.1 mL/24 h, and 4) HS + F + T, 21.1 ± 2.7 mL/24 h. The volume output was similar in all groups except the HS + T group, which had a volume only half that of the other groups (p < 0.02). We found that the rats did not like tempol in their water, which led to reduced intake and greater variability in the HS + T group. However, when fructose was added (in the HS + F + T group), the sweetness overcame this distaste and water intake was normalized.
PRA
PRA in the HS-C group was 2.28 ± 0.53 ng Ang I/mL/h. The HS + T group was similar at 1.84 ± 0.27 ng Ang I/mL/h. The addition of 20% fructose combined with HS tended to increase PRA to 3.57 ± 0.52 ng Ang I/mL/h (Figure 3) as we have reported previously,7 this increase did not reach a statistically significant difference from HS-C. However, the combination of 20% fructose plus HS treated with tempol decreased PRA by 50% compared to the same treatment without tempol (p < 0.025) to a value of 1.79 ± 0.37 ng Ang I/mL/h, and this value was similar to HS-C with or without tempol (Figure 3).
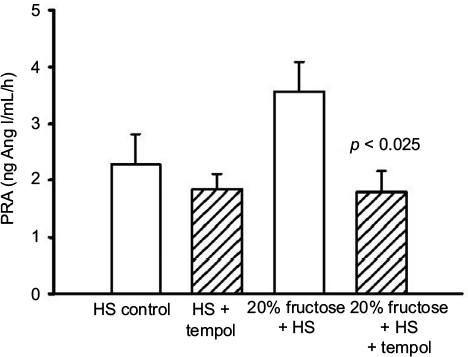 | Figure 3 Protocol 2: PRA at the end of the experimental protocol. Note: p-value vs similar diet without tempol treatment. Abbreviations: Ang I, angiotensin I; HS, high salt; PRA, plasma renin activity. |
Blood glucose
Fasting blood glucose levels at the end of the protocol were not significantly different between the four groups: HS-C, 52 ± 2 mg/dL; HS + T, 53 ± 2 mg/dL; HS + F, 58 ± 2 mg/dL; and HS + F + T, 57 ± 2 mg/dL.
Discussion
We have previously reported6,7 that a diet supplemented with 20% fructose in the drinking water of rats over a duration of just 2 weeks, when combined with an HS diet, can induce salt-sensitive hypertension prior to the onset of other metabolic alterations. This was coincident with increased renal proximal NHE3 activity and enhanced sensitivity to Ang II in isolated proximal tubules,6 as well as increased sodium retention, decreased renal nitric oxide,7 and diminished suppression of PRA with an HS diet.7 In the current study, we again found that the combination of 20% fructose and an HS diet led to significant increases in systolic blood pressure in only 1 week. Likewise, HS suppression of PRA was blunted by fructose intake. We also now report that both an HS diet and 20% fructose intake increase urinary 8-isoprostane excretion suggesting each lead to an increase in renal reactive oxygen species formation. Because of this, we tested if the oxygen-free radical scavenging, superoxide dismutase (SOD) mimetic tempol, would affect the increase in blood pressure seen with a combination of these two dietary challenges of reactive oxygen species. We hypothesized that at least part of the pathway leading to fructose-induced salt-sensitive hypertension could be due to fructose-induced formation of reactive oxygen species and inappropriate stimulation of renin secretion, all of which would contribute to an increase in blood pressure. What we found was a rapid and dramatic increase in systolic blood pressure in response to the combination of 20% fructose and HS, similar to what we have previously reported,6,7 and further that this was completely reversed in rats chronically treated with tempol. Further, while we found (as before7) that fructose blunted the HS suppression of PRA, but now we found that this effect on PRA was significantly reduced (reversed) with the addition of tempol. Our data suggest that the factors leading to fructose-induced, salt-sensitive hypertension may be in part driven by increased renal oxygen free radical formation.
HS diet is known to increase renal cortical reactive oxygen production,27,28 as well as cortical nitric oxide synthesis.29 We and others have previously reported7,28 an important interaction between nitric oxide and superoxide in maintaining both renal blood flow and sodium excretion in normotensive rats. Nitric oxide is known to be an important natriuretic factor in the proximal tubule.30 We have also reported7 that HS intake dobles the NO2/NO3 excretion (as a marker of renal NO production), presumably because of its natriuretic properties,30 but in the presence of 20% fructose this response is significantly attenuated. This suggests that the fructose intake either directly or indirectly diminishes nitric oxide bioavailability.
It is well established that renal production of reactive oxygen species, primarily by NADPH oxidase in the kidney, is an important factor in regulating renal function,27 and excesses in its activity could lead to renal dysfunction and hypertension. As little as 10% fructose in the drinking water of rats leads to systemic oxidative stress and related pro-inflammatory conditions.31
Tempol is a cell-permeable SOD mimetic which scavenges free radicals and attenuates superoxide anion and peroxynitrite-induced inflammation.32 It is water soluble and can be easily administered in the drinking water.33 Tempol is a redox-cycling nitroxide which metabolizes many reactive oxygen species.34 Thus, it does not have selectivity so that the specific reactive oxygen species generated cannot be determined from these results. Tempol has been reported to have antihypertensive properties in various rat models of hypertension.27 In the spontaneously hypertensive rat, Yanes et al33 found that 2 weeks of tempol treatment reduced oxidative stress and reduced mean arterial pressure. This response was found to be nitric oxide dependent but independent of the renin–angiotensin system. In 2K1C renovascular hypertension,35 3 weeks after clipping the blood pressure, PRA and urinary 8-isoprostane were all elevated. Acute tempol administration reduced blood pressure and increased renal perfusion suggesting a significant role for superoxide in regulating renal hemodynamics in this model of renal hypertension. About 20 weeks of 20% high fructose and 8% high sodium has been reported to elevate oxidative stress and induce hypertension.36 Cowley et al27 have elegantly reviewed how increased reactive oxygen species or reduced scavenging of reactive oxygen species results in reduced renal medullary blood flow and retarded sodium excretion resulting in hypertension. Nishimoto et al37 found that high dietary fructose diminished renal medullary endothelial nitric oxide synthase in salt-sensitive rats. While we do not have urinary NO2/NO3 measurements in the current data, the combination of elevated reactive oxygen species and our previously reported7 diminished NO bioavailability should lead to increased renal vascular resistance35 and decreased natriuresis,7,20 both of which could contribute to the hypertension. Tempol treatment should reverse this trend, and thereby explain the antihypertensive response we observed in our fructose plus HS rats.
Renin, the rate-limiting enzymatic step in the formation of Ang II, is inhibited by high renal perfusion pressure and by HS intake.8,9 The bioactive molecule of this system is Ang II, which has intrinsic vasoconstrictor properties, is a potent pressor factor8 and has been found to have a sensitive interaction with the vasodilator and natriuretic nitric oxide in the regulation of renal perfusion.38,39 Ang II is one of the most potent endogenous stimuli for oxygen-free radical formation.40–42 High fructose and HS intake has been shown to induce renin–angiotensin-stimulated renal reactive oxygen species.43 In addition, it has been reported that reactive oxygen species can stimulate the secretion of renin21 directly from renin-synthesizing juxtaglomerular cells. We have found previously7 as well as in the current study that 20% fructose intake reverses the inhibition of renin by HS and high renal perfusion pressure such that it remains inappropriately normal. We have also seen (unpublished observations) that after 4 weeks of HS, a further 80% suppression of renin, and this is also reversed and elevated by coincident salt plus 20% fructose intake. This increase is not seen with 20% fructose and normal salt.7 Several reports have found that pharmacologic suppression of the renin angiotensin system blunts or reverses fructose-induced hypertension,14,15,44 suggesting that the inappropriate maintenance of PRA may contribute to this hypertension. Note that our results are from only the first 2 weeks of 20% fructose administration and may be quite different by 8–12 weeks of 20% fructose when the model is complicated by the development of metabolic syndrome.4 Thus, one might envision a vicious positive feedback cycle in which fructose-induced free radical formation directly stimulates renin secretion, elevates Ang II, which in turn increases blood pressure, and further stimulates reactive oxygen species formation. These all would diminish nitric oxide bioavailability and amplify the pro-hypertensive factors, all of which are consistent with our current and previous results.6,7 Scavenging reactive oxygen species with tempol should reverse all of this, and we found that it did reverse the hypertension and restored the appropriate renin response to HS intake. We did not see any effect of tempol treatment on PRA in the HS + T group. Since HS had already suppressed PRA, it would be difficult to further determine whether tempol exerted any additional effect in this group.
Conclusion
We hypothesized that at least part of the pathway leading to fructose-induced salt sensitive hypertension could be due to fructose-induced reactive oxygen species formation and inappropriate stimulation of renin secretion that would be reversed by the SOD mimetic tempol. We found that tempol treatment completely reversed the fructose-induced salt-sensitive hypertension, diminished the excretion of 8-isoprostane, and restored the appropriate HS suppression of renin secretion. Thus, we conclude that much of the effect of fructose-induced salt-sensitive hypertension is driven by renal formation of reactive oxygen species.
Acknowledgment
This research was supported by funding from the National Institutes of Health Grant 5P01HL090550-05 and funds from Henry Ford Hospital.
Disclosure
The authors report no conflicts of interest in this work.
 © 2017 The Author(s). This work is published and licensed by Dove Medical Press Limited. The full terms of this license are available at https://www.dovepress.com/terms.php and incorporate the Creative Commons Attribution - Non Commercial (unported, v3.0) License.
By accessing the work you hereby accept the Terms. Non-commercial uses of the work are permitted without any further permission from Dove Medical Press Limited, provided the work is properly attributed. For permission for commercial use of this work, please see paragraphs 4.2 and 5 of our Terms.
© 2017 The Author(s). This work is published and licensed by Dove Medical Press Limited. The full terms of this license are available at https://www.dovepress.com/terms.php and incorporate the Creative Commons Attribution - Non Commercial (unported, v3.0) License.
By accessing the work you hereby accept the Terms. Non-commercial uses of the work are permitted without any further permission from Dove Medical Press Limited, provided the work is properly attributed. For permission for commercial use of this work, please see paragraphs 4.2 and 5 of our Terms.