")
Back to Journals » Cancer Management and Research » Volume 12
Free Fatty Acids Promote the Development of Prostate Cancer by Upregulating Peroxisome Proliferator-Activated Receptor Gamma
Authors Ha X, Wang J, Chen K, Deng Y, Zhang X, Feng J, Li X, Zhu J, Ma Y, Qiu T, Wang C, Xie J, Zhang J
Received 28 October 2019
Accepted for publication 31 January 2020
Published 24 February 2020 Volume 2020:12 Pages 1355—1369
DOI https://doi.org/10.2147/CMAR.S236301
Checked for plagiarism Yes
Review by Single anonymous peer review
Peer reviewer comments 2
Editor who approved publication: Dr Xueqiong Zhu
Xiaodan Ha,* Jingzhou Wang,* Keru Chen, Yuchun Deng, Xueting Zhang, Jiale Feng, Xue Li, Jiaojiao Zhu, Yinghua Ma, Tongtong Qiu, Cuizhe Wang,* Jianxin Xie, Jun Zhang
Shihezi University School of Medicine, Bei-Er-Lu, Shihezi, Xinjiang 832000, People’s Republic of China
*These authors contributed equally to this work
Correspondence: Jun Zhang; Jianxin Xie Email [email protected]; [email protected]
Introduction: As one of the most common forms of cancer that threatens men’s health, prostate cancer (PCa) is under a trend of increasing morbidity and mortality in most countries. More and more studies have pointed out that obesity is closely linked to the occurrence and development of PCa, although there are still many undiscovered molecular mechanisms between the two.
Methods: In the present study, we compare serum lipid levels in patients with PCa and normal individuals. PCa cells (PC3 and 22RV1) were cultured in vitro, the TC/TG/HDL/GLU assay kit was used to detect the glucose and lipid metabolism level of PCa cells, the flow cytometry technique was used to detect the proliferation ability of PCa cells, and the Transwell was used to detect the invasion and migration ability of PCa cells. Western blot/quantitative real-time PCR was used to detect peroxisome proliferator-activated receptor γ (PPARγ) and vimentin/vascular endothelial growth factor-A (VEGF-A) expression levels, and immunohistochemistry was used to observe tumor-associated gene expression levels in nude mice. All data were analysed using the Independent samples t-test or rank sum test.
Results: We found higher levels of FFA in the serum of patients with PCa. In vitro experiments have demonstrated that high levels of FFA can promote the proliferation, migration and invasion of two PCa cells (PC3 and 22RV1) and affect the energy metabolism of PCa cells. The upregulated PPARγ plays a key role in this process, and vimentin may be involved in this signaling pathway.
Conclusion: We infer that high levels of FFA may promote PCa development by upregulating PPARγ expression.
Keywords: free fatty acids, peroxisome proliferator-activated receptor γ, prostate cancer, vimentin, vascular endothelial growth factor-A
Introduction
As the most commonly diagnosed form of cancer among middle-aged and elderly men, PCa ranks second in male mortality,1,2 and with the aging of the population, the incidence of PCa in most countries is increasing.3 Earlier studies have pointed out that there is a direct relationship between the increase of body mass index and PCa mortality.4 In PCa patients, tumor volume is significantly associated with body mass index, and obesity is associated with more aggressive PCa and higher post-treatment disease recurrence rates.5
Dyslipidemia, especially increased blood FFA levels, is an important manifestation in obese patients.6–8 Previous studies have shown that high levels of FFA can promote the occurrence and development of a variety of tumors.9,10 Existing literature has suggested that in the presence of palmitate, the glucose metabolism levels of PCa cells PC3 and CWR22RV1 are significantly increased.11 Other literature has suggested that OA promotes an aggressive phenotype in PCa cells via FFA1/GPR40, calcium and PI3K/Akt signaling.12 In addition, fatty acids can also act as specific receptors that affect intracellular signaling, thereby regulating castration resistance and metastasis of PCa.13 The above literature shows that dyslipidemia, especially the increase of FFA content, can be used as energy substance and signal molecule to promote the occurrence and development of PCa. However, its specific molecular mechanism is still not very clear.
Peroxisome proliferator-activated receptors (PPARs) are members of the nuclear receptor transcription factor superfamily that regulates the expression of target genes. According to the structure, PPAR can be divided into three types: α, β (or δ) and γ. PPARγ is mainly expressed in the adipose tissue and the immune system.14,15 PPARγ plays a major role in fat formation, glycolipid metabolism, and the immune system by regulating the transcriptional activity of target genes.16 A large amount of literature shows that PPARγ has a comprehensive anticancer activity due to its anti-proliferative, differentiation-promoting and pro-apoptotic functions.17 The use of PPARγ-selective ligand troglitazone can inhibit the proliferation of tumor cells such as human colon cancer cells and breast cancer cells, induce differentiation, and reduce tumor volume in nude mice.18 Recently, Orootan et al found that inhibiting the expression of PPARγ in PCa cells can significantly reduce proliferation (53%), invasiveness (89%), and non-hormone-dependent growth rate (94%).19 These results indicate that PPARγ has a completely opposite effect in the development of different tumors, and the role of PPARγ in FFA-induced PCa has not been reported in the literature.
In this study, we want to evaluate the role of PPARγ in the development of PCa caused by increased FFA due to obesity and elucidate its possible molecular mechanism. The implementation of this study will provide a new theoretical basis for explicating the possible mechanism of obesity-induced PCa. At the same time, it will provide a new experimental basis for clarifying the role of PPARγ in the development of PCa.
Materials and Methods
Collection of General Information and Serum Samples of Clinical Individuals
From September 2017 to March 2018, in the Department of Urology, First Affiliated Hospital of Shihezi University School of Medicine, 10 blood samples from prostate cancer patients with a clear diagnosis were collected, aged 55 to 85 years. After strict matching the age of tumor patients, 10 blood samples were collected from the physical examination in the clinic as controls that they excluded patients with prostate disease and various types of tumors. General data on height, weight, body mass index (BMI), were collected. BMI was calculated according to the formula BMI = body weight (kg)/height (m)2.
To avoid circadian rhythm changes, blood samples were taken from 8:00 to 10:30 a.m. after an overnight fast of at least 8 hrs. Venous blood was immediately placed in a separate gel accelerating tube for centrifugation (4000 RPM x 10 min). Some serum was used to detect the relevant biochemical indicators. The remaining serum was immediately kept at −80°C.
Serum TC/TG/HDL/GLU Analysis
Non-esterified fatty acids Kit (A042-2-1)/Triglycerides Assay Kit (F001-1-1)/Total cholesterol Assay Kit (F002-1-1)/High density lipoprotein cholesterol Assay Kit (F003-1-1)/Low-density lipoprotein cholesterol assay kit/(A113-1-1) from Nanjing Jiancheng Bioengineering Institute, China, was used to detect the concentration of FFA/TG/TC/HDL/LDL in the serum of patients. The serum concentration of GLU in the patient’s serum was measured using the Glucose Assay Kit (CAT: 361500) of Shanghai Rongsheng Biopharmaceutical Co., Ltd., China. The metabolomic platform of Tsinghua University in China used Liquid chromatography-mass spectrometry to quantitatively analyze various fatty acid components in the serum of all PCa patients and normal individuals.
Cell Lines and Cell Culture
Human PCa cells (PC3 and 22RV1) were obtained from the Shanghai Cell Bank of the Chinese Academy of Sciences. PC3 cells were cultured in F12 medium containing 10% FBS, 1% penicillin-streptomycin. 22RV1 cells were cultured in 1640 medium containing 10% FBS, 1% penicillin-streptomycin. The overexpression plasmid and siRNA interference fragment used for cell transfection were purchased from Shanghai GenePharma Company, China.
FFA Configuration
FFA in preparation for oleic acid/palmitic acid = 2/1 (OA: PA = 2:1), of which OA was dissolved in DMSO for 0.67 mol/L, and PA was dissolved in DMSO for 0.33 mol/L. Using the culture medium containing 1% BSA to dilute FFA to 1.5mM (PC3) or 1.0mM (22RV1).
Intracellular TC/TG/HDL/GLU Analysis
After washing PCa cells of different groups with PBS twice, trypsinize and centrifuge at 1000 rpm for 5 mins. Wash and centrifuge for 5 mins. After resuspending the cells in 300 μL PBS, immediately put them into liquid nitrogen for 5 s and then take out the room temperature to thaw. After repeated freezing and thawing 3 times, add the working solution according to the kit instructions. After incubation at 37°C, check the OD value and calculate the final TC/TG/HDL/GLU concentration according to the announcement. Triglycerides Assay Kit (F001-1-1)/Total cholesterol Assay Kit (F002-1-1)/High density lipoprotein cholesterol Assay Kit (F003-1-1) from Nanjing Jiancheng Bioengineering Institute, China, was used to detect the concentration of TG/TC/HDL in the PCa cells. The concentration of GLU in the PCa cells was measured using the Glucose Assay Kit (CAT: 361500) of Shanghai Rongsheng Biopharmaceutical Co., Ltd., China.
Plasmid Transfection
Transfected PCa cells with over-expressed PPARγ plasmid constructed by GenePharma to upregulate PPARγ in PCa cells. The Ad-PPARγ group used pcDNA3.1 (+) PPARγ plasmid, the mock group used pcDNA3.1 (+) NC plasmid (which does not contain the PPARγ promoter region), and the blank group did not use pcDNA3.1 plasmid. During the transfection process, DNA-lipofectamine complex of three plasmids was formed with P3000 and Lipofectamine3000 as vectors at a concentration of 1 g/mL at room temperature, incubated in FBS-free medium for 4 h, and then cultured cells with FBS containing cell cultures for 48 h.
Flow Cytometry
PC3 and 22RV1 cells were transfected with different experimental conditions for 48 hrs, followed by trypsinization and collection. The single cell suspension was fixed with 70% ethanol (added drop-wise) and stored overnight at 4°C. The fixed cells were then washed twice with ice-cold PBS and stained with PI (33 µg/mL with 0.1% Triton X–100) in the presence of 500 µg/mL RNase A in the dark for 1 hr at room temperature. DNA content was analyzed on a flow cytometer. The derived data were analyzed with Software to estimate the percentages of cells in G0/G1, S, and G2/M phases.
Cell Invasion
A Transwell chamber with a pore size of 8 μm and a diameter of 6.5 mm was used to coat the upper chamber of the Transwell chamber with Matrigel and incubated for 48hrs in a 37°C incubator. PC3 and 22RV1 cells were transfected with different experimental conditions for 48 hrs, the cells of were digested and counted, and a single cell suspension was prepared by using a serum-free medium transferred to the upper chamber of the Transwell chamber (3×10⁴cells/chamber), while a medium containing 10% FBS transferred in the lower chamber. After 48 hrs of routine culture, cells that had moved to the lower surface of the membrane were stained using Giemsa for 7 to 8 mins and counted microscopically. The mean average value was calculated based on five different observation fields.
Cell Migration
PC3 and 22RV1 cells were transfected with different experimental conditions for 48 hrs, the cells of were digested and counted, and transferred to the upper chamber of the Transwell chamber (3×10⁴cells/room) that is a pore size of 8 μm and a diameter of 6.5 mm with a serum-free cell suspension, while the medium in the lower chamber contained 10% FBS. After 48hrs incubation, the upper surface of the Transwell membrane was gently wiped with a cotton swab to remove nonmigrating cells. Cells that had settled in the lower surface of the membrane were stained using Giemsa for 7 to 8 mins and counted microscopically. The mean average value was calculated based on five different observation fields.
Western Blot
Protein was lysed by using lysis buffer containing 1% PMSF in RIPA to extract the total cellular protein. Then, the protein concentration was tested and adjusted. The 4×SDS-PAGE loading buffer added to each sample was one-third of the protein volume. The protein was heated at 100°C for 10 mins. The β-actin protein expression was used as an internal control. Membranes were incubated at 4°C overnight with antibodies to β-actin (36 kDa; Zhongshan Jinqiao, China) and PPARγ (58kDa; Abcam), at a working ratio of 1:1000. A second antibody was incubated at room temperature for 2hrs at a working ratio of 1:10,000. The chemiluminescence reagent (SuperSignal West Femto Maximum Sensitivity Substrate; Thermo Scientific) was used and detected with a ChemiScope mini-imaging system.
Quantitative Real-Time PCR
Cells were lysed with TRIzol reagent and the total RNA was extracted. RNA purity was determined by using an Agilent 2100 Bioanalyzer (Agilent Technologies, Santa Clara, CA, USA). The amount of RNA used to reverse transcribe 20μL of cDNA was 1μg. The reverse transcription (Eppendorf AG, Germany) program settings were 42°C for 60 mins and 70°C for 15 mins. The mRNA expression was detected by using a qRT-PCR instrument (QIAGEN, Hilden, Germany) with the following program settings: 95°C for 3 mins, 45 cycles at 95°C for 10 s, and 60°C for 30 s. GAPDH was used as an internal control. Data were obtained as Ct values, and the 2- ΔΔ Ct(ΔΔ Ct = single sampleΔCt – averageΔCt of all samples in this group; ΔCt = single target gene Ct – single sample GAPDH Ct)method was used in the analysis. Gene expression was quantified using a relative method. Table 1 shows the primer sequences used.
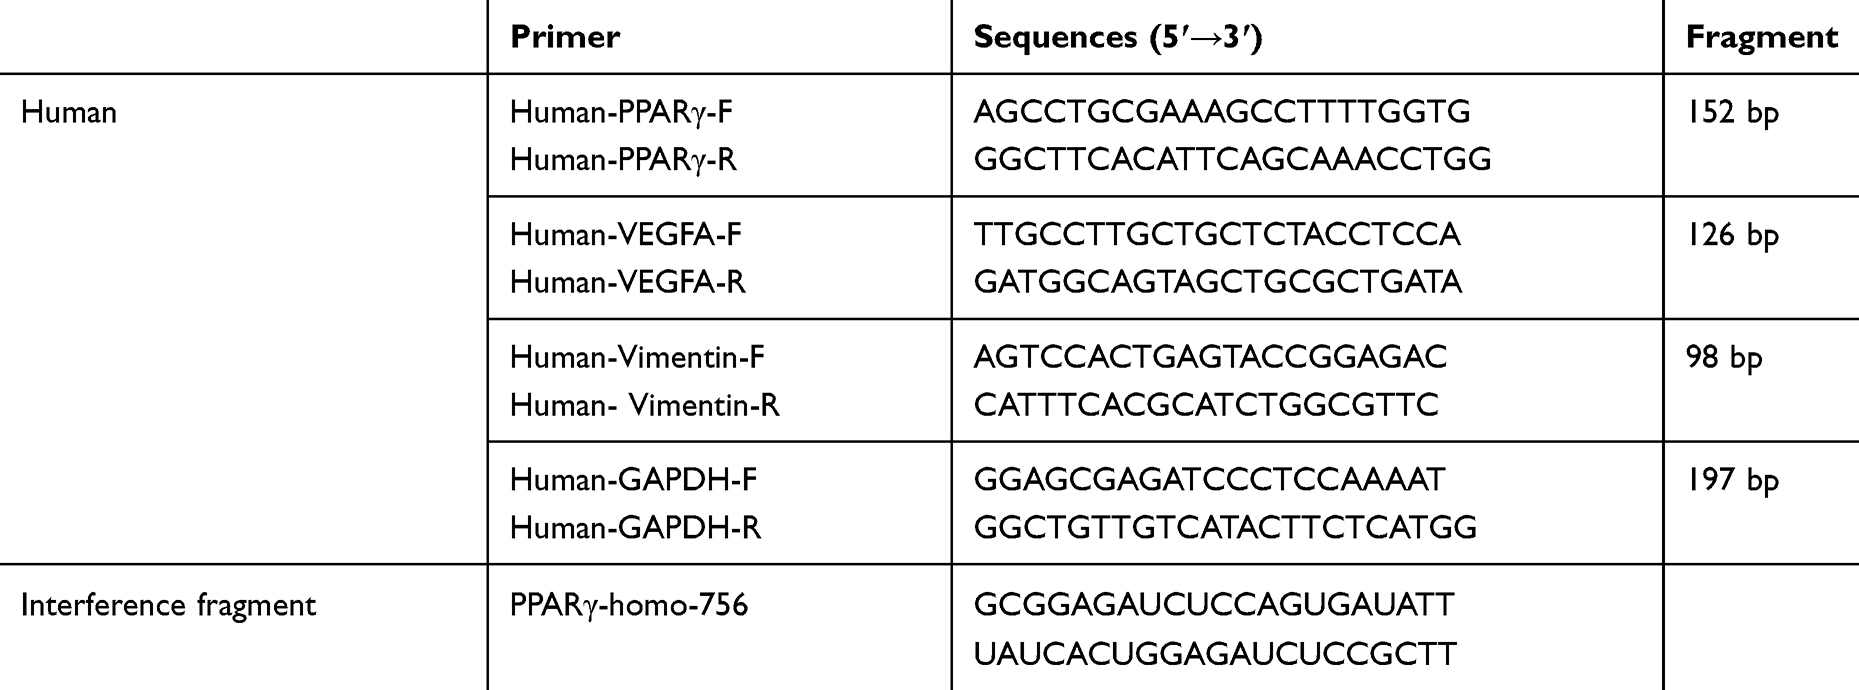 |
Table 1 Primer Sequences |
Animals Feeding
Twelve 4-week old male nude mice (BALB/c-nu, Vital River, Beijing, China) were housed in SPF-level animal house laminar flow frames. After one week of adaptive feeding, 5×10⁵ PC3 cells were injected into the prostate of each nude mouse.20 Six days after the experiment, three were fed with normal fat containing 10% fat, and nine were fed with high-fat diet containing 60% fat (Medicine, Jiangsu, China). All food and drinking water are strictly sterilized and free to ingest. After 12 weeks, they were anesthetized, surgically harvested the intra-abdominal tumor tissue, measured tumor length and width using vernier caliper, calculated tumor volume (V=1/2length*width2), and weighed (g) the tumor using analytical balance.
Immunohistochemistry Staining
All specimens were set in 10% neutral formalin and embedded in paraffin, 4 μm thick sections. After dewaxing the sections, the antigen was repaired with sodium citrate buffer, washed in 1×PBS buffer, diluted 1:100 PPARγ antibody (Abcam, 41928), 1:100 VEGF-A antibody (Abcam, ab1316) and 1:100 The Vimentin antibody (Cell Signaling Technology, D21H3) was incubated overnight at 4°C, and the next day, the anti-mouse HRP secondary antibody (DAKO) was incubated at 37°C for 30 mins, and the results were observed after DAB color development. The scores were evaluated by two pathologists in the First Affiliated Hospital of Shihezi University School of Medicine. The scoring criteria were: the percentage of positive cells (0–5%, 0; 6–25%, 1; 26–50%, 2; 51–75%, 3; 76–100%, 4), positive staining intensity (negative, 0; yellow, 1; brownish yellow, 2; brown, 3), and the final total score is equal to the percentage of positive cells multiplied by the positive staining intensity.
Statistical Analysis
SPSS (v. 17.0) computer software was used for all statistical analysis. Mean and standard deviation were determined as the main parameters, and the average of data between the experimental and control groups were compared using independent samples t-test or Rank sum test. Determine Sig. <0.05 as a standard of significant difference.
Results
Serum FFA Level of PCa Patients Was Higher Than Non-Cancer Individuals
Serum samples from ten PCa patients and ten non-cancer individuals were collected from the first affiliated hospital of Shihezi University Medical College. General data of subjects were collected and blood lipid and FFA levels were measured. Our results showed that the serum TPSA and FFA level is significantly higher in PCa patients compared with non-cancer individuals (P<0.05), even though the body weight and BMI have been significantly over-consumed due to disease progression, as shown in Table 2.
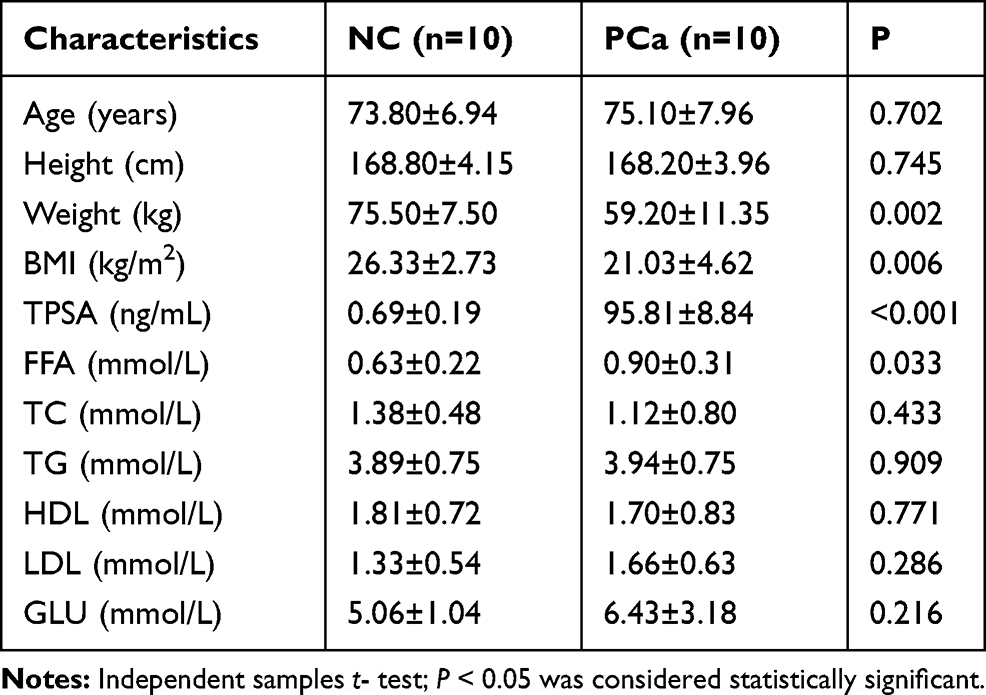 |
Table 2 Patient Characteristics |
In addition, liquid chromatography-mass spectrometry was used to detect FFA profiles in plasma of subjects, and to compare the differences between non-cancerous individuals and PCa patients. The results show that the various components of the total FFA represent a large proportion of saturated fatty acids (PA (16:0)) and unsaturated fatty acids (OA (18:1)), and in the serum of PCa patients as shown in Figure 1A.
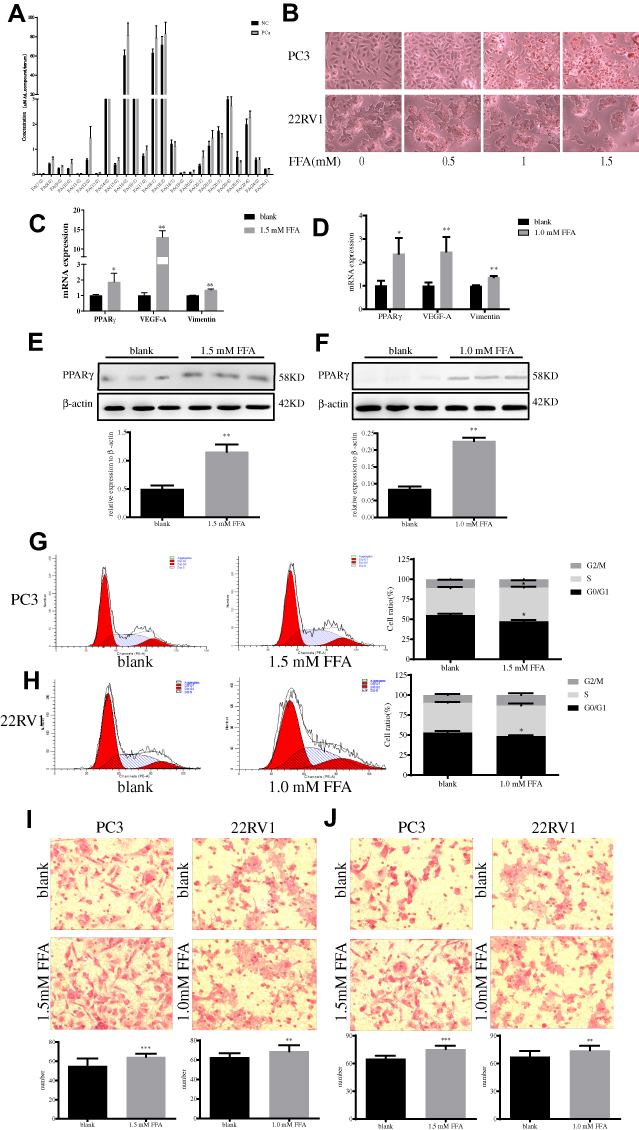 |
Figure 1 Elevated concentrations of free fatty acids result in elevated levels of PPARγ and change prostate cancer cells` biological behavior. (A). Liquid chromatography-mass spectrometry was used to detect the level of 25 fatty acids in serum of 10 prostate cancer patients and 10 non-cancer individuals. (B). Oil red O staining results on PC3 and 22RV1 cells with different concentrations of FFA as 0mM, 0.5mM, 1mM and 1.5mM (200×). (C). After 48 hrs of stimulation to PC3 cells with 1.5 mM FFA, real-time quantitative PCR showed mRNA expression levels of PPARγ, VEGF-A and Vimentin. (D). After 48 hrs of stimulation to 22RV1 cells with 1.0 mM FFA, real-time quantitative PCR showed mRNA expression levels of PPARγ, VEGF-A and Vimentin. (E). After 48 hrs of stimulation to PC3 cells with 1.5 mM FFA, Western Bolt showed protein expression levels of PPARγ. (F). After 48 hrs of stimulation to 22RV1 cells with 1.0 mM FFA, Western Bolt showed protein expression levels of PPARγ. (G). Flow cytometry results of PC3 cells in blank control group without FFA stimulation, and experimental group after 1.5mM FFA stimulation. Then compare the G0/G1 phase, S phase and G2/M phase of PC3 cells between two groups. (H). Flow cytometry results of 22RV1 cells in blank control group without FFA stimulation, and experimental group after 1.0 mM FFA stimulation. Then, compare the G0/G1 phase, S phase and G2/M phase of PC3 cells between two groups. (I). PC3 and 22RV1 cells` migration results after stimulation with free fatty acids using transwell experiment (200×). (J). PC3 and 22RV1 cells` invasion results after stimulation with free fatty acids using transwell experiment (200×). Independent samples t-test. *P<0.05, **P<0.01, ***P<0.001 was considered statistically significant. |
High Concentration of FFA Promoted the Expression Level of PPARγ and Resulted in the Change of Biological Behavior in PCa Cells
High Levels of FFA Can Promote PPARγ Expression in PCa Cells
PC3 and 22RV1 were stimulated with different concentrations of FFA (OA: PA = 2:1) for 24hrs (Table 3). We found that FFA greater than 1.5mM inhibited both PCa cells. Next, we used oil red O staining (Figure 1B) and cell glucose and lipid metabolism kit (Table 4) to observe the effects of 0mM, 0.5mM, 1mM, and 1.5mM FFA on lipid synthesis and energy utilization capacity of two PCa cells. Finally, combined with the results of Table 3, Figure 1B and Table 4, we chose the highest concentration without inhibiting cell growth, and the strongest ability to promote cell lipid synthesis and energy utilization 1.5mM and 1mM acting on PC3 Cells and 22RV1 cells. PCa cells were stimulated with different concentrations of FFA (OA: PA = 2:1) for 48hrs, and the expression of PPARγ, VEGF-A, and Vimentin was detected. The results showed that the mRNA and protein expression levels of PPARγ were significantly increased under the stimulation of high concentration FFA in PC3 and 22RV1 cells (P<0.05), as shown in Figure 1C–F. In addition, the mRNA expression levels of VEGF-A and Vimentin were also significantly increased under the stimulation of high concentration FFA (P<0.01), and the results are shown in Figure 1C and D.
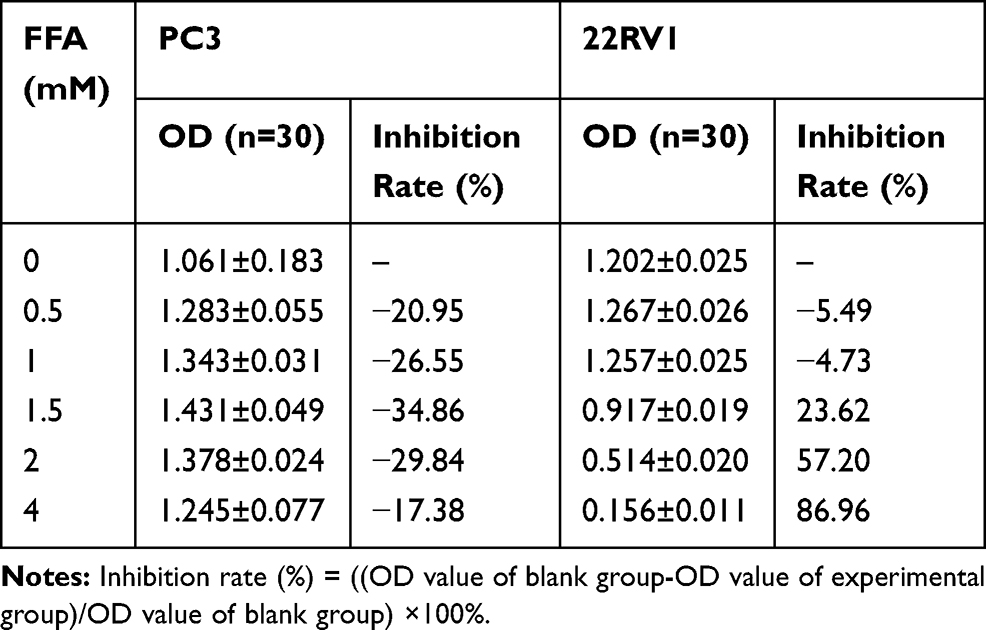 |
Table 3 The Inhibition Rate on PCa Cells with Different Concentrations of FFA |
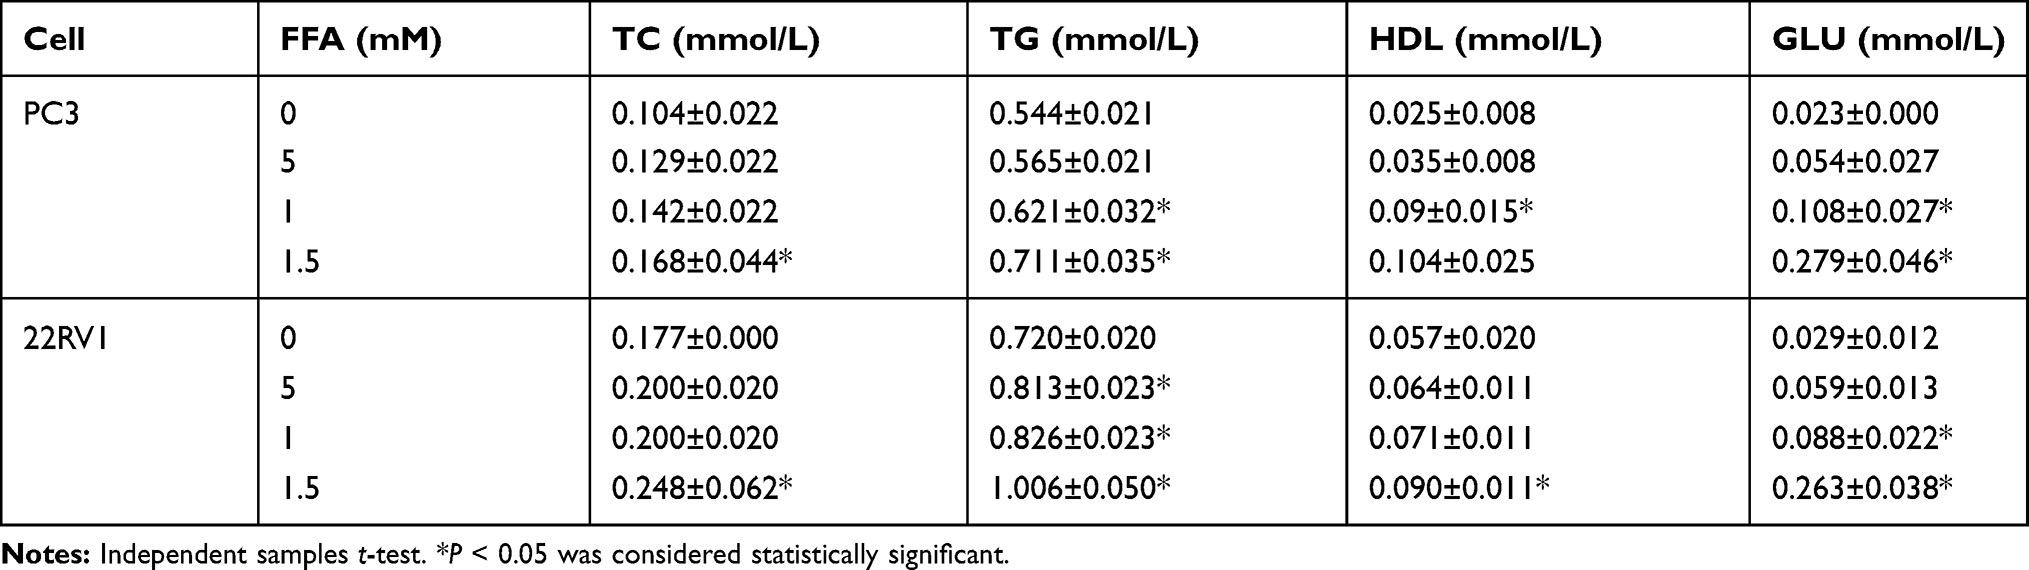 |
Table 4 The Lipid Content in Prostate Cancer Cells with Different Concentrations of FFA |
High Concentration of FFA Enhanced the Ability of Proliferation, Migration and Invasion of PCa Cells
As demonstrated in Figure 1G, after high concentration FFA (OA: PA = 2:1) stimulated PC3 cells, the proportion of cells in G0/G1 phase was significantly reduced, while that in S phase was significantly increased (P<0.05). Same case happened after high concentration FFA stimulated 22RV1 cells, as shown in Figure 1H. The above results showed that high concentration of FFA might promote the proliferation of PCa cells by regulating the phases of the cell cycle. As shown in Figure 1I and J, after high concentration FFA stimulated PC3 and 22RV1 cells, the migration and invasion ability of cells were also significantly enhanced (P<0.05).
PPARγ Can Promote the Metabolism of Glucose, Lipid, and the Biological Behavior of PCa Cells
PPARγ Can Promote the Metabolism of Glucose and Lipid in PCa Cells
After upregulation of PPARγ in Figure 2A and B, the levels of TC, TG and GLU in both types of cells were significantly increased (P<0.05), and the level of HDL in 22RV1 cells was also significantly increased (P<0.05), as shown in Table 5. In addition, it was found that after down-regulation of PPARγ in Figure 3A and B, the levels of TC, TG and HDL in both types of cells were significantly decreased (P<0.05). In PC3 cells, the level of GLU was significantly increased (P<0.05), as shown in Table 6.
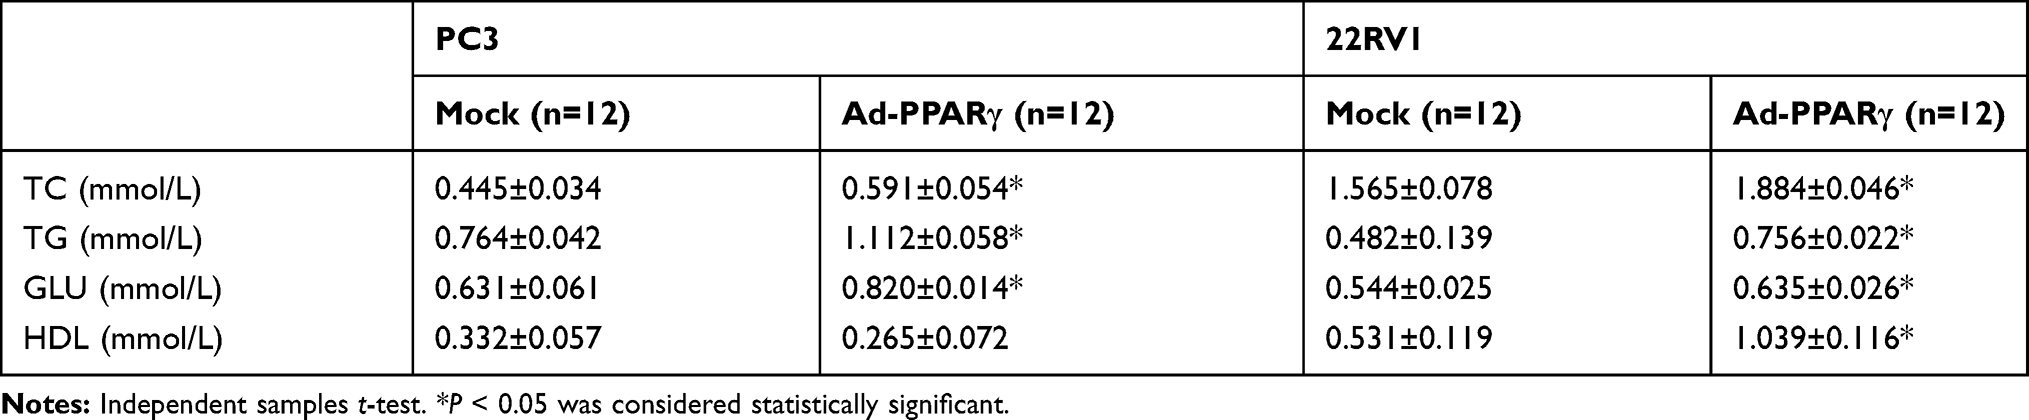 |
Table 5 The Lipid Content in PCa Cells with PPARγ Up-Expression |
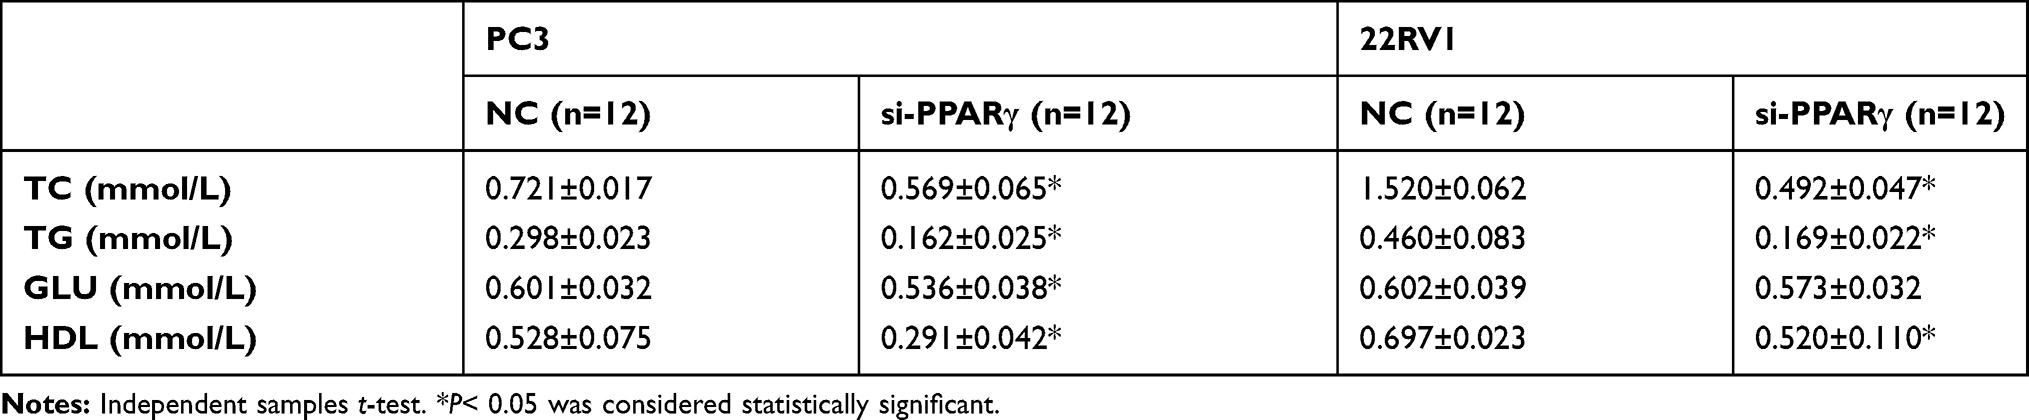 |
Table 6 The Lipid Content on PCa Cells with PPARγ Down-Expression |
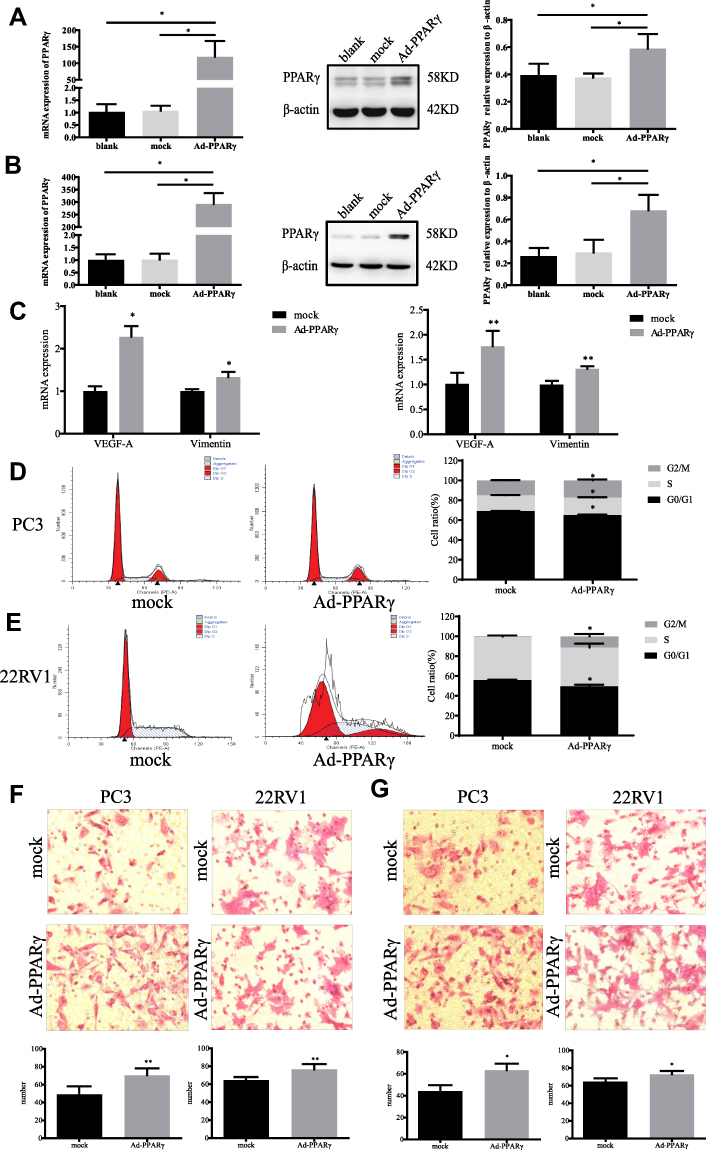 |
Figure 2 Changes of biological behavior in prostate cancer cells after up-regulation of PPARγ. (A). PC3 cells were transformed with fluorescent over expression vector and an empty vector for 48 hrs, real-time quantitative PCR was used to detect the mRNA level of PPARγ in the blank control group, the empty control group and the overexpressed PPARγ group. Western Blot was intended to detect the protein expression level of PPARγ among three groups. (B). 22RV1 cells were transformed with fluorescent overexpression vector and an empty vector for 48 hrs, real-time quantitative PCR was utilized to detect the mRNA level of PPARγ in the blank control group, the empty control group and the overexpressed PPARγ group. Western Blot was intended to detect the protein expression level of PPARγ among three groups. (C). After overexpression PPARγ 48 hrs, real-time quantitative PCR was utilized to detect mRNA levels of VEGF-A and Vimentin in PC3 cells (left) and 22RV1 cells (right). (D). Flow cytometry results of PC3 cells in blank control group after empty vector for 48 hrs, and experimental group after overexpression vector of PPARγ for 48 hrs. Then compare the G0/G1 phase, S phase and G2/M phase of PC3 cells between two groups. (E). Flow cytometry results of 22RV1 cells in blank control group after empty vector for 48 hrs, and experimental group after overexpression vector of PPARγ for 48 hrs. Then compare the G0/G1 phase, S phase and G2/M phase of 22RV1 cells between two groups. (F). PC3 and 22RV1 cells` migration results after overexpression PPARγ 48 hrs using transwell experiment (200×). (G). PC3 and 22RV1 cells` invasion results after overexpression PPARγ 48 hrs using transwell experiment (200×). Independent samples t-test. *P<0.05, **P<0.01 was considered statistically significant. |
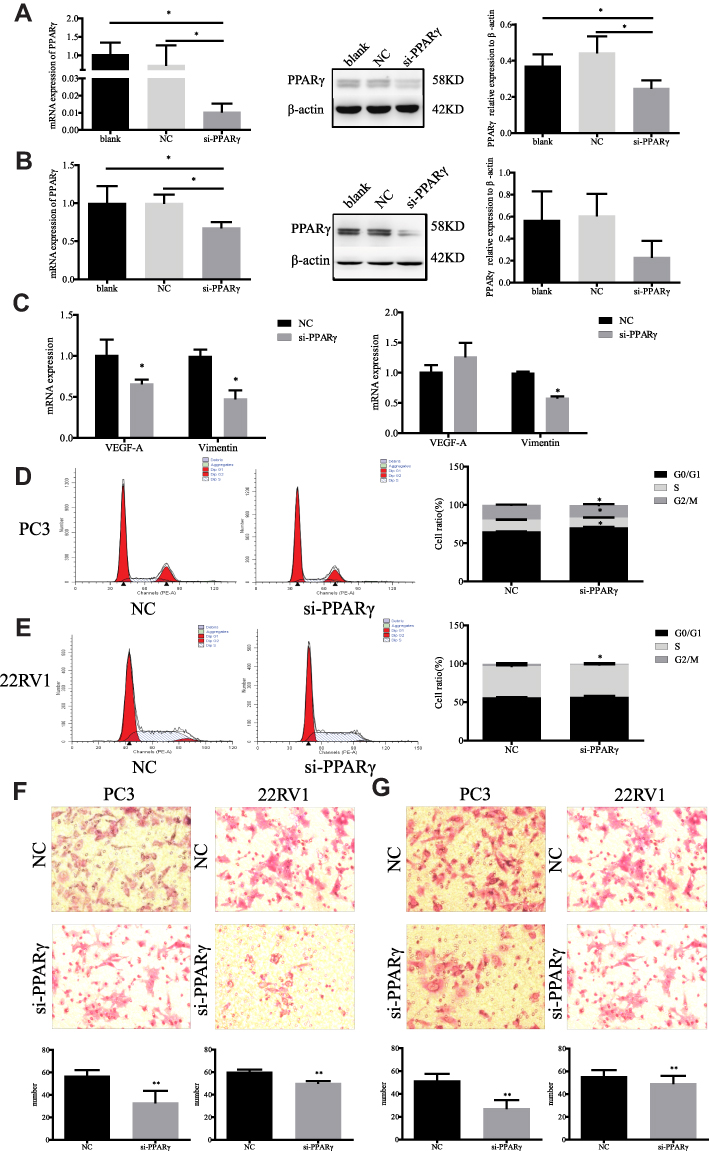 |
Figure 3 Changes of biological behavior in prostate cancer cells after down-regulation of PPARγ. (A). PPARγ was interfered in PC3 cells use si-RNA for 48 hrs, real-time quantitative PCR was used to detect the mRNA level of PPARγ in blank group, control group and si- PPARγ group. The Western blot was designed to detect the protein expression level of PPARγ among three groups. (B). PPARγ was interfered in 22RV1 cells use si-RNA for 48 hrs. Real-time quantitative PCR was used to detect the mRNA level of PPARγ in blank group, control group and si-PPARγ group. The Western blot was designed to detect the protein expression level of PPARγ among three groups. (C). After si-PPARγ 48 hrs, real-time quantitative PCR was used to detect mRNA levels of VEGF-A and Vimentin in PC3 cells (left) and 22RV1 cells (right). (D). Flow cytometry results of PC3 cells in control group after 48 hrs, and experimental group after si- PPARγ for 48 hrs. Then, compare the G0/G1 phase, S phase and G2/M phase of PC3 cells between two groups. (E). Flow cytometry results of 22RV1 cells in control group after 48 hrs, and experimental group after si- PPARγ for 48 hrs. Then compare the G0/G1 phase, S phase and G2/M phase of 22RV1 cells between two groups. (F). PC3 and 22RV1 cells` migration results after si-PPARγ 48 hrs using transwell experiment (200×). (G). PC3 and 22RV1 cells` invasion results after si-PPARγ 48 hrs using transwell experiment (200×). Independent samples t-test. *P<0.05, **P<0.01 was considered statistically significant. |
PPARγ Enhanced the Ability of Proliferation, Migration and Invasion of PCa Cells
After upregulation of PPARγ, the mRNA expression levels of VEGF-A and Vimentin of all types of cells were also significantly increased in Figure 2C. As depicted in Figure 2D and E, after upregulation of PPARγ, the proportion of PC3 cells at G0/G1 phase was significantly decreased, and G2/M phase and S phase were significantly increased. In 22RV1 cells, the proportion of G0/G1 phase was significantly decreased, and the proportion of G2/M phase was significantly increased (P<0.05). At the same time, both the migration and invasion abilities of the two kinds of cells were significantly enhanced after upregulation of PPARγ, as illustrated in Figure 2F and G.
After down-regulation of PPARγ, the mRNA expression levels of VEGF-A and Vimentin of PC3 cells were significantly reduced, and the mRNA expression levels of Vimentin of 22RV1 cells were also significantly reduced in Figure 3C. The proportion of G0/G1 phase was significantly increased, and the proportion of S phase and G2/M phase was significantly reduced in PC3 cells (P<0.05). The proportion of G2/M phase was significantly reduced in 22RV1 cells (P<0.05), as shown in Figure 3D and E. At the same time, after down-regulation PPARγ, the migration and invasion abilities of both types of cells were significantly inhibited (P<0.01), as demonstrated in Figure 3F and G.
The Expression of PPARγ Was Significantly Higher in Nude Mice with PCa After High-Fat Diet
PC3 cells were injected in situ into the prostate of nude mice. They were fed a high-fat diet (HFD) and a normal control diet (NC) for 12 weeks, as shown in Figure 4A–C. The tumor volume and weight in HFD group (n = 9) are higher than the NC group (n = 3). As displayed in Figure 4D, the results of immunohistochemistry showed that the expression level of PPARγ/VEGF-A/Vimentin was significantly higher than that of NC group (P <0.01). This further indicates that overexpression of PPARγ in PCa tissues is associated with PCa under a high-fat diet.
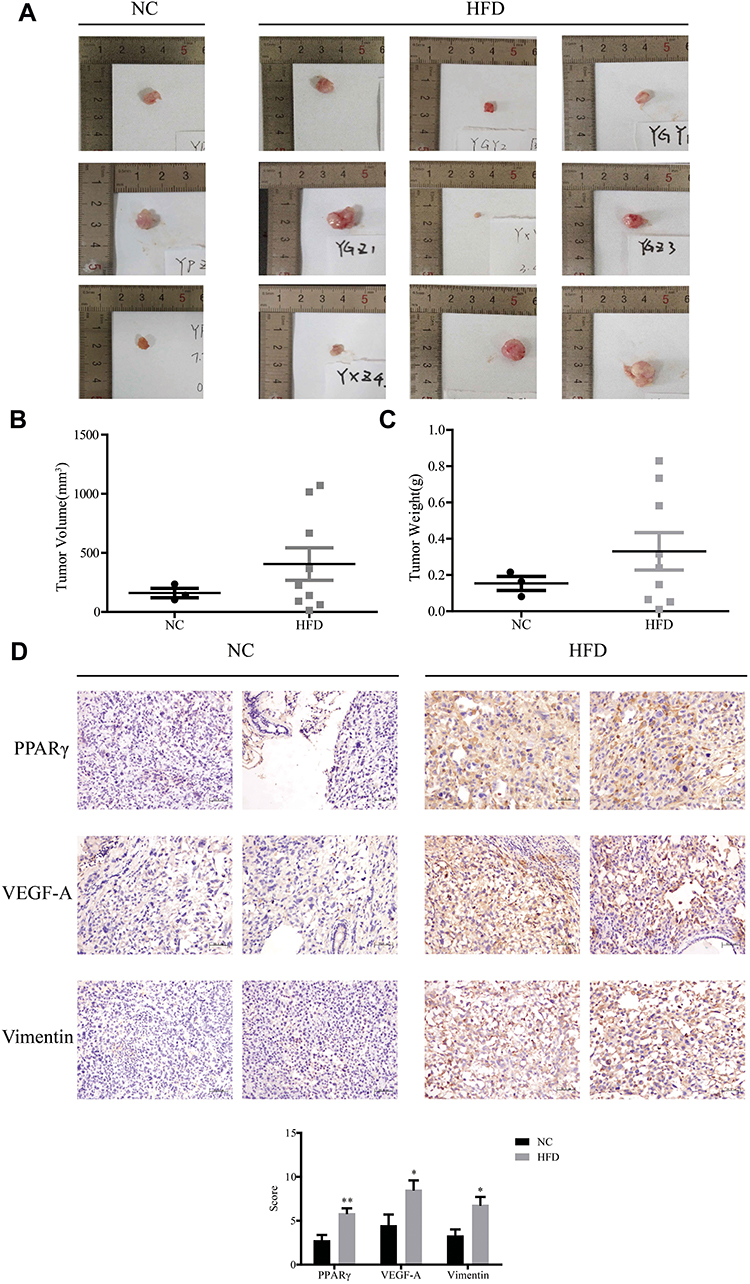 |
Figure 4 PPARγ may promote prostate cancer in vivo after a high-fat diet. Prostate cancer was induced by injected PC3 cells into the prostate of nude mice. (A). After 12 weeks of feeding, the tumor took out. Compared two groups` tumor volume (B) and weight (C). (D). The expression of PPARγ/VEGF-A/Vimentin in the tissues was observed by immunohistochemistry (200×). Finally, the results of immunohistochemistry were scored, and the difference of PPARγ, VEGF-A, vimentin expression between the high-fat diet group and the normal diet group was compared. Independent samples t- test. *P<0.05, **P<0.01 the difference was statistically significant. |
Discussion
Obesity is closely related to the occurrence of tumors and has been identified as one of the causes of the occurrence and development of esophageal cancer, colon cancer, endometrial cancer, kidney cancer and postmenopausal breast cancer, as well as an important risk factor for PCa, pancreatic cancer and non-hodgkin’s lymphoma.21,22
Obesity promoting the development of PCa is mainly attributed to the high levels of serum FFA. Interestingly, the dominant uptake of PCa cell is fatty acid,23 which suggests that FFA may play a significant role in the development of PCa. In our recent study, we found that although PCa patients have lower body weight and BMI than non-cancer individuals (which may be related to cachexia in the progression of tumor patients), the serum FFA levels of PCa patients were significantly higher. These results further confirm that increased FFA levels may be an important risk factor for obesity-induced PCa.
Studies have shown that fatty acids in human body can have multiple subtypes according to their carbon chain length and spatial structure, and non-similar fatty acids play different roles in tumor development and progression.24,25 Moreover, Omega-3 polyunsaturated fatty acids can induce apoptosis of breast cancer cells, and eicosapentaenoic acid can inhibit metastasis of colorectal cancer cells by inhibiting PGE-dependent cell movement.26,27 OA induces the regulatory phenotype of myeloid suppressor cells to promote immune escape of tumors.28 In addition, OA and PA are both involved in the proliferation of PCa cells.10,29-33 The above literature suggests that OA and PA may play an important role in the development of PCa. In this study, we compared the serum fatty acid subtypes in non-cancer patients and PCa patients. The results showed that the most fatty acid subtypes in both non-cancer and tumor patients were OA and PA. And the serum levels of OA and PA in tumor patients are higher than non-cancer individuals. These results remind us that OA and PA may play an important role in the development of obesity-related PCa.
Previous literature has shown that the increased FFA level in obesity cannot only provide the energy source for tumor cells, but also act as a signal transduction molecule.10 Therefore, in our present study, we first analyzed and compared the changes in the fatty acid difference spectrum in serum of patients with PCa, combined with the existing literature, OA/PA = 2/1 was used to simulate the PC3 and 22RV1 cells.11,34–36 The results showed that a high concentration of FFA can significantly enhance the ability of proliferation, migration, and invasion of PCa cells. The above results suggest that the increase of serum OA and PA may be an important risk factor for the development of obesity-related PCa. However, its specific mechanism is still unclear.
Peroxisome Proliferator-activated Receptor γ (PPARγ) plays an important role in fat formation, glycolipid metabolism and immune system.37 Peroxisome proliferator-activated receptor gamma (PPARγ) is a member of the nuclear receptor superfamily of ligand-inducible transcription factors that regulate adipogenesis, lipid metabolism, cell proliferation, inflammation and insulin sensitization.38 More and more studies have also pointed out that PPARγ plays an important role in tumors, but the role of PPARγ in tumor development is controversial. For example: In colon cancer, cladosporol A, secondary metabolites from cladosporium tenuissimum characterized for their ability to control cell proliferation, inhibits proliferation of human colon cancer cells through a PPARγ-mediated modulation of gene expression.39 Pioglitazone as a PPARγ agonist may inhibit growth and invasion of HCC cells via blockade of the RAGE signaling.40 In esophageal cancer, rosiglitazone, an agonist of PPARγ, can inhibit the proliferation of esophageal cancer cells and promote their apoptosis. After treatment of esophageal cancer cells with PPAR-γ antagonist GW9662, the cell proliferation ability is significantly enhanced41 Similarly, Srivastava et al found that patients with high expression of PPARγ in lung cancer have higher survival rates, suggesting that PPARγ has an antitumor effect in lung cancer.42
On the other hand, studies have pointed out that the PPARγ/RXRα pathway constitutes a tumor-intrinsic mechanism underlying immune evasion in muscle-invasive bladder cancer by inhibiting CD8 + T-cell recruitment.43 In addition, in a study by Chaoyang Zhu et al, it was found that PPARγ was significantly overexpressed in tumor tissues of patients with high malignancy and lymph node metastasis, and patients with high PPARγ expression had lower prognosis.44 It is worth noting that although some literatures have suggested that PPARγ has potential to modulate NF-κB activity and oxidative stress in E2-deprived breast cancer cell lines and anti-PPARγ therapy is a novel strategy to improve the therapeutic effects of E2-induced apoptosis in E2-deprived breast cancer.45 However, most studies have pointed out that PPARγ has an antitumor effect in breast cancer. For example, Xu et al proposed that PPARγ can inhibit tumor cell proliferation by regulating the ptprf gene, and Suzuki et al proposed that PPARgamma is mainly expressed in well-differentiated and ER-positive breast cancers.46,47 In response to the phenomenon that PPARγ plays different roles in tumor cells, some studies have explained that the effect of PPARγ on tumorigenesis is determined by the cell type that activates PPARγ. When PPARγ is activated in epithelial cancer cells, tumor growth is inhibited, but tumor growth is enhanced when PPARγ is activated in stromal cells.48 Interestingly, the role of PPARγ in the occurrence and development of PCa has also been reported in recent years. L. Qin et al found that PPARγ agonists can induce apoptosis of PCa cells through the CXCR4/CXCL12 axis, in which its process may depend on the transduction of androgen receptors.49,50 Our results showed that PPARγ could improve glucose and lipid metabolism, enhance the ability of proliferation, migration and invasion in PCa cells, which may remind that PPARγ promoted the occurrence and development of PCa relying on the energy metabolism pathway instead of androgens. The role of PPARγ in the development of obesity-related PCa remains unclear. Our results suggested that the increased level of FFA induced by obesity may lead to the occurrence and development of PCa by promoting the expression of PPARγ, while the specific mechanism is not yet defined.
Vimentin, which is a major intermediate filament protein, plays an important role in cell adhesion, migration, angiogenesis and neurite extension.51 In PCa patients, the vimentin expression is positively correlated with pathological stage, poor prognosis, cell invasion and migration ability.52–54 Previous studies have found that vimentin interacts with PPARγ via a proteasomal degradation process.55 Consequently, our results showed that PPARγ could promote the mRNA expression level of vimentin, while it could be reversed by the downregulation of PPARγ. The above results suggest that a high level of FFA may promote the expression of vimentin by upregulating PPARγ, which ultimately leads to the occurrence and development of PCa.
Vascular endothelial growth factor-A (VEGF-A) can promote the new blood vessel formation and increase vascular permeability resulting in the growth and metastasis of tumor cells. As one of the most effective tumor angiogenesis factors, VEGF-A plays a key role in the process of the formation and metastasis of the malignant tumor.56 Previous literature has shown that PPARγ can promote the ability of proliferation and invasion by upregulating VEGF-A expression in PCa cells.13 Our study suggested that high-level FFA may promote the expression of VEGF-A by upregulating PPARγ in PC3 and 22RV1 cells, which also ultimately leads to the occurrence and development of PCa.
In addition, in our present study, we built a BALB/c-nu mice model with PCa in situ, feeding on a high-fat diet (HFD) and normal control diet (NC). Then, we compared the protein expression of PPARγ/Vimentin/VEGF-A in PCa tissues of the two groups of mice. The results showed that the expression level of PPARγ/Vimentin/VEGF-A was all significantly higher in the HFD group than the NC group. These results further support that high levels of PPARγ, Vimentin, and VEGF-A may be involved in the development and progression of PCa in obese conditions.
Conclusion
Our study found that under the condition of obesity, high level of FFA can promote the expression of VEGF-A and Vimentin by upregulating PPARγ, which ultimately leads to the occurrence and development of PCa. PPARγ may become a new target for the development and progression of obesity-related PCa.
Abbreviations
PCa, prostate cancer; FFA, free fatty acid; OA, oleic acid; PA, palmitic acid; PPARγ, peroxisome proliferator-activated receptor γ; VEGF-A, vascular endothelial growth factor-A.
Ethical Approval and Consent to Participate
Ethical approval was given by the medical ethics committee of First Affiliated Hospital, Shihezi University School of Medicine with the following reference number: 2017-049-01, A2017-115-01. In addition, animal models are based on the guidance given by the Department of Urology, University of Michigan, Ann Arbor, MI, USA (Dai, J., 2016).
Data Sharing Statement
The datasets generated and/or analysed during the current study are not publicly available (the data belongs to our group) but are available from the corresponding author on reasonable request.
Author Contributions
All authors contributed to data analysis, drafting or revising the article, gave final approval of the version to be published, and agree to be accountable for all aspects of the work.
Funding
The National Natural Science Foundation of China (grant number 81760518), Corps International Cooperation Project (grant number 2016AH005), and Xinjiang Production and Construction Corps Key Areas Innovation Team Project (2018CB002).
Disclosure
The authors declare that they have no competing interests.
References
1. Siegel RL, Miller KD, Jemal A. Cancer statistics, 2018. CA Cancer J Clin. 2018;68(1):7–30. doi:10.3322/caac.21442
2. Garg R, Blando JM, Perez CJ, et al. COX-2 mediates pro-tumorigenic effects of PKCepsilon in prostate cancer. Oncogene. 2018;37(34):4735–4749. doi:10.1038/s41388-018-0318-9
3. Wong MCS, Goggins WB, Wang HHX, et al. Global incidence and mortality for prostate cancer: analysis of temporal patterns and trends in 36 countries. Eur Urol. 2016;70(5):862–874. doi:10.1016/j.eururo.2016.05.043
4. Amling CL. Relationship between obesity and prostate cancer. Curr Opin Urol. 2005;15(3):167–171. doi:10.1097/01.mou.0000165550.94663.fb
5. Mackenzie H, Markar SR, Askari A, et al. Obesity surgery and risk of cancer. Br J Surg. 2018;105(12):1650–1657. doi:10.1002/bjs.2018.105.issue-12
6. Arner P, Ryden M. Fatty acids, obesity and insulin resistance. Obes Facts. 2015;8(2):147–155. doi:10.1159/000381224
7. Liu TW, Heden TD, Matthew Morris E, Fritsche KL, Vieira-Potter VJ, Thyfault JP. High-fat diet alters serum fatty acid profiles in obesity prone rats: implications for in vitro studies. Lipids. 2015;50(10):997–1008. doi:10.1007/s11745-015-4061-5
8. Ebbert JO, Jensen MD. Fat depots, free fatty acids, and dyslipidemia. Nutrients. 2013;5(2):498–508. doi:10.3390/nu5020498
9. Asare GA, Owusu-Boateng E, Asiedu B, Amoah BY, Essendoh E, Otoo RY. Oxidised low-density lipoprotein, a possible distinguishing lipid profile biomolecule between prostate cancer and benign prostatic hyperplasia. Andrologia. 2019;51:e13321.
10. Wu Y, Yu X, Yi X, et al. Aberrant phosphorylation of SMAD4 Thr277-mediated USP9x-SMAD4 interaction by free fatty acids promotes breast cancer metastasis. Cancer Res. 2017;77(6):1383–1394. doi:10.1158/0008-5472.CAN-16-2012
11. Andersen KF, Divilov V, Sevak K, Koziorowski J, Lewis JS, Pillarsetty N. Influence of free fatty acids on glucose uptake in prostate cancer cells. Nucl Med Biol. 2014;41(3):254–258. doi:10.1016/j.nucmedbio.2013.12.005
12. Liotti A, Cosimato V, Mirra P, et al. Oleic acid promotes prostate cancer malignant phenotype via the G protein-coupled receptor FFA1/GPR40. J Cell Physiol. 2018;233(9):7367–7378. doi:10.1002/jcp.26572
13. Maly IV, Hofmann WA. Fatty acids and calcium regulation in prostate cancer. Nutrients. 2018;10(6):788. doi:10.3390/nu10060788
14. Lasar D, Rosenwald M, Kiehlmann E, et al. Peroxisome proliferator activated receptor gamma controls mature brown adipocyte inducibility through glycerol kinase. Cell Rep. 2018;22(3):760–773. doi:10.1016/j.celrep.2017.12.067
15. Su M, Cao J, Huang J, et al. The in vitro and in vivo anti-inflammatory effects of a phthalimide PPAR-gamma agonist. Mar Drugs. 2017;15(1). doi:10.3390/md15010007
16. van Eijk M, Aten J, Bijl N, et al. Reducing glycosphingolipid content in adipose tissue of obese mice restores insulin sensitivity, adipogenesis and reduces inflammation. PLoS One. 2009;4(3):e4723. doi:10.1371/journal.pone.0004723
17. Sikka S, Chen L, Sethi G, Kumar AP. Targeting PPARgamma signaling cascade for the prevention and treatment of prostate cancer. PPAR Res. 2012;2012:968040. doi:10.1155/2012/968040
18. Suh N, Wang Y, Williams CR, et al. A new ligand for the peroxisome proliferator-activated receptor-gamma (PPAR-gamma), GW7845, inhibits rat mammary carcinogenesis. Cancer Res. 1999;59(22):5671–5673.
19. Forootan FS, Forootan SS, Gou X, et al. Fatty acid activated PPARgamma promotes tumorigenicity of prostate cancer cells by up regulating VEGF via PPAR responsive elements of the promoter. Oncotarget. 2016;7(8):9322–9339. doi:10.18632/oncotarget.6975
20. Dai J, Hensel J, Wang N, Kruithof-de Julio M, Shiozawa Y. Mouse models for studying prostate cancer bone metastasis. Bonekey Rep. 2016;5:777. doi:10.1038/bonekey.2016.4
21. Gong Y, Dou LJ, Liang J. Link between obesity and cancer: role of triglyceride/free fatty acid cycling. Eur Rev Med Pharmacol Sci. 2014;18(19):2808–2820.
22. Unamuno X, Gomez-Ambrosi J, Rodriguez A, Becerril S, Fruhbeck G, Catalan V. Adipokine dysregulation and adipose tissue inflammation in human obesity. Eur J Clin Invest. 2018;48(9):e12997. doi:10.1111/eci.2018.48.issue-9
23. Itkonen HM, Poulose N, Walker S, Mills IG. CDK9 inhibition induces a metabolic switch that renders prostate cancer cells dependent on fatty acid oxidation. Neoplasia. 2019;21(7):713–720. doi:10.1016/j.neo.2019.05.001
24. Hopkins MM, Meier KE. Free fatty acid receptors and cancer: from nutrition to pharmacology. Handb Exp Pharmacol. 2017;236:233–251.
25. de Jong AJ, Kloppenburg M, Toes RE, Ioan-Facsinay A. Fatty acids, lipid mediators, and T-cell function. Front Immunol. 2014;5:483. doi:10.3389/fimmu.2014.00483
26. Hawcroft G, Volpato M, Marston G, et al. The omega-3 polyunsaturated fatty acid eicosapentaenoic acid inhibits mouse MC-26 colorectal cancer cell liver metastasis via inhibition of PGE2-dependent cell motility. Br J Pharmacol. 2012;166(5):1724–1737. doi:10.1111/j.1476-5381.2012.01882.x
27. Zhu S, Jiang X, Jiang S, et al. GPR120 is not required for omega-3 PUFAs-induced cell growth inhibition and apoptosis in breast cancer cells. Cell Biol Int. 2018;42(2):180–186. doi:10.1002/cbin.10883
28. Wu H, Weidinger C, Schmidt F, et al. Oleate but not stearate induces the regulatory phenotype of myeloid suppressor cells. Sci Rep. 2017;7(1):7498. doi:10.1038/s41598-017-07685-9
29. Sapandowski A, Stope M, Evert K, et al. Cardiolipin composition correlates with prostate cancer cell proliferation. Mol Cell Biochem. 2015;410(1–2):175–185. doi:10.1007/s11010-015-2549-1
30. Liu N, Yang G, Hu M, et al. Adipose triglyceride lipase gene polymorphisms is not associated with free fatty acid levels in chinese han population. Metab Syndr Relat Disord. 2017;15(9):474–479. doi:10.1089/met.2017.0071
31. Yang G, Liu N, Hu M, et al. A variant in adipor2 is associated with increased free fatty acid levels in Chinese population. Metab Syndr Relat Disord. 2016;14(7):368–371. doi:10.1089/met.2016.0005
32. Calastretti A, Gatti G, Lucini V, et al. Melatonin analogue antiproliferative and cytotoxic effects on human prostate cancer cells. Int J Mol Sci. 2018;19(5):1505. doi:10.3390/ijms19051505
33. Woods-Burnham L, Basu A, Cajigas-Du Ross CK, et al. The 22Rv1 prostate cancer cell line carries mixed genetic ancestry: implications for prostate cancer health disparities research using pre-clinical models. Prostate. 2017;77(16):1601–1608. doi:10.1002/pros.v77.16
34. Lee MR, Yang HJ, Park KI, Ma JY. Lycopus lucidus Turcz. ex Benth. Attenuates free fatty acid-induced steatosis in HepG2 cells and non-alcoholic fatty liver disease in high-fat diet-induced obese mice. Phytomedicine. 2019;55:14–22. doi:10.1016/j.phymed.2018.07.008
35. Kheder RK, Hobkirk J, Stover CM. In vitro modulation of the LPS-induced proinflammatory profile of hepatocytes and macrophages- approaches for intervention in obesity? Front Cell Dev Biol. 2016;4:61. doi:10.3389/fcell.2016.00061
36. Furukawa H, Carroll RJ, Swift HH, Steiner DF. Long-term elevation of free fatty acids leads to delayed processing of proinsulin and prohormone convertases 2 and 3 in the pancreatic beta-cell line MIN6. Diabetes. 1999;48(7):1395–1401. doi:10.2337/diabetes.48.7.1395
37. Lapsys NM, Kriketos AD, Lim-Fraser M, et al. Expression of genes involved in lipid metabolism correlate with peroxisome proliferator-activated receptor gamma expression in human skeletal muscle. J Clin Endocrinol Metab. 2000;85(11):4293–4297. doi:10.1210/jcem.85.11.6973
38. Wang Q, Imam MU, Yida Z, Wang F. Peroxisome proliferator-activated receptor gamma (PPARgamma) as a target for concurrent management of diabetes and obesity-related cancer. Curr Pharm Des. 2017;23(25):3677–3688. doi:10.2174/1381612823666170704125104
39. Zurlo D, Ziccardi P, Votino C, et al. The antiproliferative and proapoptotic effects of cladosporols A and B are related to their different binding mode as PPARgamma ligands. Biochem Pharmacol. 2016;108:22–35. doi:10.1016/j.bcp.2016.03.007
40. Yang Y, Zhao LH, Huang B, et al. Pioglitazone, a PPARgamma agonist, inhibits growth and invasion of human hepatocellular carcinoma via blockade of the rage signaling. Mol Carcinog. 2015;54(12):1584–1595. doi:10.1002/mc.22231
41. Wu K, Yang Y, Liu D, et al. Activation of PPARgamma suppresses proliferation and induces apoptosis of esophageal cancer cells by inhibiting TLR4-dependent MAPK pathway. Oncotarget. 2016;7(28):44572–44582. doi:10.18632/oncotarget.10067
42. Srivastava N, Kollipara RK, Singh DK, et al. Inhibition of cancer cell proliferation by PPARgamma is mediated by a metabolic switch that increases reactive oxygen species levels. Cell Metab. 2014;20(4):650–661. doi:10.1016/j.cmet.2014.08.003
43. Korpal M, Puyang X, Wu Z, et al. Evasion of immunosurveillance by genomic alterations of PPARgamma/RXRalpha in bladder cancer. Nat Commun. 2017;8(1):103. doi:10.1038/s41467-017-00147-w
44. Zhu C, Wei J, Tian X, Li Y, Li X. Prognostic role of PPAR-gamma and PTEN in the renal cell carcinoma. Int J Clin Exp Pathol. 2015;8(10):12668–12677.
45. Fan P, Abderrahman B, Chai TS, Yerrum S, Jordan VC. Targeting peroxisome proliferator-activated receptor gamma to increase estrogen-induced apoptosis in estrogen-deprived breast cancer cells. Mol Cancer Ther. 2018;17(12):2732–2745. doi:10.1158/1535-7163.MCT-18-0088
46. Xu YY, Liu H, Su L, et al. PPARgamma inhibits breast cancer progression by upregulating PTPRF expression. Eur Rev Med Pharmacol Sci. 2019;23(22):9965–9977. doi:10.26355/eurrev_201911_19563
47. Suzuki T, Hayashi S, Miki Y, et al. Peroxisome proliferator-activated receptor gamma in human breast carcinoma: a modulator of estrogenic actions. Endocr Relat Cancer. 2006;13(1):233–250. doi:10.1677/erc.1.01075
48. Avena P, Anselmo W, Whitaker-Menezes D, et al. Compartment-specific activation of PPARgamma governs breast cancer tumor growth, via metabolic reprogramming and symbiosis. Cell Cycle. 2013;12(9):1360–1370. doi:10.4161/cc.24289
49. Qin L, Gong C, Chen AM, et al. Peroxisome proliferator-activated receptor gamma agonist rosiglitazone inhibits migration and invasion of prostate cancer cells through inhibition of the CXCR4/CXCL12 axis. Mol Med Rep. 2014;10(2):695–700. doi:10.3892/mmr.2014.2232
50. Moss PE, Lyles BE, Stewart LV. The PPARgamma ligand ciglitazone regulates androgen receptor activation differently in androgen-dependent versus androgen-independent human prostate cancer cells. Exp Cell Res. 2010;316(20):3478–3488. doi:10.1016/j.yexcr.2010.09.015
51. Dave JM, Bayless KJ. Vimentin as an integral regulator of cell adhesion and endothelial sprouting. Microcirculation. 2014;21(4):333–344. doi:10.1111/micc.2014.21.issue-4
52. Burch TC, Watson MT, Nyalwidhe JO. Variable metastatic potentials correlate with differential plectin and vimentin expression in syngeneic androgen independent prostate cancer cells. PLoS One. 2013;8(5):e65005. doi:10.1371/journal.pone.0065005
53. Satelli A, Batth I, Brownlee Z, et al. EMT circulating tumor cells detected by cell-surface vimentin are associated with prostate cancer progression. Oncotarget. 2017;8(30):49329–49337. doi:10.18632/oncotarget.v8i30
54. Lindsay CR, Le Moulec S, Billiot F, et al. Vimentin and Ki67 expression in circulating tumour cells derived from castrate-resistant prostate cancer. BMC Cancer. 2016;16:168. doi:10.1186/s12885-016-2192-6
55. Tsai YC, Tsai SH, Chang EY, et al. Cytoskeletal protein vimentin interacts with and regulates peroxisome proliferator-activated receptor gamma via a proteasomal degradation process. J Cell Biochem. 2013;114(7):1559–1567. doi:10.1002/jcb.24497
56. Chiang KC, Yeh CN, Yeh TS, et al. MART-10, a 1alpha,25(OH)2D3 analog, potently represses metastasis of ER(+) breast cancer cells with VEGF-A overexpression. Anticancer Res. 2018;38(7):3879–3887. doi:10.21873/anticanres.12672
 © 2020 The Author(s). This work is published and licensed by Dove Medical Press Limited. The full terms of this license are available at https://www.dovepress.com/terms.php and incorporate the Creative Commons Attribution - Non Commercial (unported, v3.0) License.
By accessing the work you hereby accept the Terms. Non-commercial uses of the work are permitted without any further permission from Dove Medical Press Limited, provided the work is properly attributed. For permission for commercial use of this work, please see paragraphs 4.2 and 5 of our Terms.
© 2020 The Author(s). This work is published and licensed by Dove Medical Press Limited. The full terms of this license are available at https://www.dovepress.com/terms.php and incorporate the Creative Commons Attribution - Non Commercial (unported, v3.0) License.
By accessing the work you hereby accept the Terms. Non-commercial uses of the work are permitted without any further permission from Dove Medical Press Limited, provided the work is properly attributed. For permission for commercial use of this work, please see paragraphs 4.2 and 5 of our Terms.