")
Back to Journals » Clinical Interventions in Aging » Volume 13
Frailty transitions and types of death in Chinese older adults: a population-based cohort study
Authors Liu ZY, Wei YZ, Wei LQ, Jiang XY, Wang XF, Shi Y, Hai H
Received 15 November 2017
Accepted for publication 16 March 2018
Published 16 May 2018 Volume 2018:13 Pages 947—956
DOI https://doi.org/10.2147/CIA.S157089
Checked for plagiarism Yes
Review by Single anonymous peer review
Peer reviewer comments 2
Editor who approved publication: Dr Richard Walker
Zu-yun Liu,1,* Yin-zhi Wei,2,* Li-qing Wei,3,* Xiao-yan Jiang,4 Xiao-feng Wang,5 Yan Shi,6 Hua Hai7
1Department of Internal Medicine, Yale School of Medicine, New Haven, CT, USA; 2Department of Geriatrics, Huangshi Central Hospital, Edong Healthcare Group, Huangshi, China; 3Department of Medical Laboratory, The Central Hospital of Wuhan, Tongji Medical College, Huazhong University of Science and Technology, Wuhan, China; 4Key Laboratory of Arrhythmias of the Ministry of Education of China, Tongji University School of Medicine, Shanghai, China; 5Unit of Epidemiology, Ministry of Education Key Laboratory of Contemporary Anthropology, School of Life Sciences, Fudan University, Shanghai, China; 6Department of Emergency, Huai’an Second People’s Hospital and the Affiliated Huai’an Hospital of Xuzhou Medical University, Huai’an, China; 7Department of Intensive Care Unit, Xuyi People’s Hospital, Xuyi, China
*These authors contributed equally to this work
Background: Little is known about the adverse effects of frailty transitions. In this study, we aimed to characterize the transitions between frailty states and examine their associations with the type of death among older adults in China, a developing country with a rapidly growing aging population.
Methods: We used data of 11,165 older adults (aged 65–99 years) from the 2002 and 2005 waves of the Chinese Longitudinal Healthy Longevity Survey (CLHLS). Overall, 44 health deficits were used to construct frailty index (FI; range: 0–1), which was then categorized into a three-level variable: nonfrail (FI ≤0.10), prefrail (0.10< FI ≤0.21), and frail (FI >0.21). Outcome was four types of death based on bedridden days and suffering state (assessed in the 2008 wave of CLHLS).
Results: During the 3-year period, 3,394 (30.4%) participants had transitioned between different frailty states (nonfrail, prefrail, and frail), one-third transitioned to death, and one-third remained in previous frailty states. Transitions to greater frailty (ie, “worsening”) were more common than transitions to lesser frailty (ie, “improvement”). Among four categories of frailty transitions, “worsening” and “remaining frail” had increased risks of painful death, eg, with odds ratios of 1.92 (95% confidence interval [CI] =1.41, 2.62) and 4.75 (95% CI =3.32, 6.80), respectively, for type 4 death (ie, ≥30 bedridden days with suffering before death).
Conclusion: This large sample of older adults in China supports that frailty is a dynamic process, characterized by frequent types of transitions. Furthermore, those who remained frail had the highest likelihood of experiencing painful death, which raises concerns about the quality of life in frail populations.
Keywords: frailty, transition, older adult, death
Introduction
Frailty, a state of increased vulnerability to minor stressor events, confers high risks for adverse outcomes such as hospitalizations and mortality.1,2 Recent studies have demonstrated that frailty is a dynamic condition, characterized by frequent transitions between different states.3–6 For example, Gill et al found that 57.6% of older adults had at least one transition during 54-month follow-up period.3 Characterizing the dynamic process of frailty would advance a better understanding of frailty and provide clues for future clinical care planning and thereby reduce the financial burdens of family and governments.
An important issue of frailty transitions is to distinguish their adverse effects on health outcomes (eg, death). For example, it is unknown that whether older persons who have been frail for a long time have higher likelihood of experiencing adverse outcomes compared with those developed frailty from normal. Furthermore, a growing body of studies has paid attention to the quality of death in late life, such as the extent of suffering (pain and discomfort) and number of bedridden days.7–10 Little is known about whether persons experiencing different frailty transitions demonstrated different quality of death. The answers to these questions would help to recognize the prognostic value of distinct frailty transitions and then manage clinical care and interventions more effectively.
China is a country with a rapidly growing aging population. The largest older population (mainly in mainland) is particularly unique as they have experienced equities and inequities in socioeconomic variables, lifestyles, and psychosocial stress over the past few decades, leading to variations in their aging processes. Increasing academic attention has been drawn to the pattern of chronic conditions (eg, hypertension and diabetes) in this unique population. However, with one exception (in Hong Kong),6 little is known about frailty transitions in Chinese older adults; none is known about their distinct effects. Therefore, based on data from the 2002, 2005, and 2008 waves of the Chinese Longitudinal Healthy Longevity Survey (CLHLS), the largest national sample of older adults in China, we set out a prospective cohort study to characterize the transitions between frailty states and examine their associations with the types of death in Chinese older adults.
Methods
Study population
The CLHLS is an ongoing nationwide survey of older adults in China, and the details of the sampling design, response rates, attrition, and systematic assessments of data quality across numerous measures were described elsewhere.11–13 Briefly, the survey began with interviewing the oldest old (≥80 years) with informed consent in 1998 from half of the counties and cities selected in 22 provinces in China. The collected information included demographics, lifestyle, diet, self-reported health, activities of daily living (basic and instrumental), chronic diseases, and a myriad physical and cognitive health conditions. Follow-up interviews of the original sample and newly added samples – including adults aged ≥65 to replenish participants who had died or were lost to follow-up – were carried out in 2000, 2002, 2005, 2008, and 2011.
The current study used data from the 2002, 2005, and 2008 waves of the CLHLS (only the oldest old were recruited in 1998 and 2000 waves). Considering the definition of outcome (see below, assessed in 2008 wave), older adults aged ≥100 years in 2002 were excluded. Of the 12,831 interviewees (aged 65–99 years) in 2002, 1,666 were lost to follow-up and the remaining 11,165 were included in the transition analysis. Of the 11,165 participants, 3,787 died before 2005 wave and 7,378 were alive in 2005 wave. Of the 7,378 participants, 1,464 were lost to follow-up before 2008 wave and the remaining 5,914 were included in the subsequent survival analysis. The CLHLS was approved by the Ethical Committee of Social Science Division of Peking University and was carried out in accordance with the approved guideline. Data from the CLHLS are publicly available, from either the Center for Healthy Aging and Development Studies (Peking University, China) or the National Archive of Computerized Data on Aging (University of Michigan, Ann Arbor, MI, USA; http://www.icpsr.umich.edu/icpsrweb/NACDA/studies/36179#usage). The current study based on the CLHLS data was exempt from ethical approval.
Frailty index (FI)
According to the standard procedure proposed by Searle et al,14 we used 44 health deficits including activities of daily living (basic and instrumental), chronic diseases, and the psychological functions to construct an FI (Table S1). Each deficit variable was dichotomized or polychotomized and mapped to the interval 0–1 (eg, for the daily task – bathing, “without assistance” was coded as 0, “partial assistance” as 0.5, and “need assistance” as 1) to represent the severity of the deficit. Then, the FI was calculated by summing all deficits and dividing the sum by the total number of deficits (n=44), with the range from 0 to 1. Although different numbers of deficits were used to construct an FI, the pattern of frailty with age remained consistent as long as the major domains of health, such as activities of daily living, were included.10 Furthermore, the deficits in this study were comparable with those used in other studies based on CLHLS10,15–17 and in studies conducted in the USA,18 Canada,19 and Hong Kong.20 According to Blodgett et al21 and Hoover et al,22 we categorized the FI score into a three-level variable: nonfrail (FI ≤0.10), prefrail (0.10< FI ≤0.21), and frail (FI >0.21).
Frailty transitions
Following Gill et al,3 nine transitions were possible – six among the three frailty states (nonfrail, prefrail, and frail) and three from each of the three frailty states to death. To better present the adverse effects of transitions, the six transitions between the three frailty states (because the transitions to death cannot be linked to the quality of death that was assessed in 2008 wave) were then classified into four mutually exclusive categories: “remaining nonfrail and prefrail” (because the two states were generally regarded as “healthy”), “improvement” (ie, transitions to lesser frailty), “worsening” (ie, transitions to greater frailty), and “remaining frail.”
Outcome
The outcome was the type of death defined by bedridden days and suffering state based on an evaluation of the decedents’ next of kin reported in the 2008 wave, described in detail elsewhere.10 Briefly, Dupre et al10 integrated an objective indicator of physical failure with a subjective indicator of suffering before death to develop several categorizations of the type of death. First, bedridden days before death were classified into two categories: <30 days vs ≥30 days. Second, subjective painfulness of death was based on answers from the decedents’ next of kin to the question, “Did the deceased elder feel pain when death was coming?”. It was considered “nonpeaceful” (ie, suffering) if the next of kin answered, “very painful” and “relatively painful,” vice versa. Since most Chinese elderly people reside in the community, it provides the unique opportunity for the next of kin to report on the participant’s suffering immediately before death.10,23 Finally, based on the participants’ last month of life, death was classified into four types: type 1: <30 bedridden days with no suffering; type 2: <30 bedridden days with suffering; type 3: ≥30 bedridden days with no suffering; and type 4: ≥30 bedridden days with suffering. These measurements based on responses from family members have been demonstrated to be reliable for assessing the quality of death in older adults.24
Statistical analyses
The characteristics of the study populations in 2002 and 2005 waves were summarized using mean (±standard deviation) or counts (percentages). We then determined the number and rates for each of the frailty transitions between 2002 and 2005 waves.
To calculate odds ratios (ORs) and 95% confidence intervals (CIs) of four mutually exclusive transition categories for the type of death, two multinomial logistic regression models were fit. Model 1 adjusted for age and sex; model 2 additionally adjusted for race/ethnicity (Han vs others), residence (rural vs others), marital status (currently married vs others), education (illiterate vs literate), primary lifetime occupation (white collar occupation vs other), smoking status (smoked in the past 5 years vs others), regular exercise (yes vs no), religious involvement (yes vs no), economic independence (yes vs no), family in good economic standing (self-rated as rich compared with other families in the community, yes vs no), and being in receipt of adequate medication for any illness (yes vs no).
To test the robustness of our findings, we performed several sensitivity analyses. First, we compared participants included at baseline (n=11,165) with those who were lost (n=1,666) and participants who completed the follow-up period until death or 2008 (n=5,914) with those who were lost to follow-up before 2008 wave (n=1,464). Second, we used another cutoff for FI score that was suggested in previous studies.25 That is, the participants were classified as nonfrail (FI <0.08), prefrail (0.08≤ FI <0.25), and frail (FI ≥0.25). Third, to account for the loss to follow-up before 2008 wave, we used an inverse probability weighting (IPW) approach26 to refit our models. Fourth, we refitted the models in males and females separately in terms of the possible effect of sex on frailty.
All analyses were performed using SAS software (Version 9.3; SAS Institute, Cary, NC, USA). A P-value of <0.05 (two-tailed) was considered statistically significant.
Results
The characteristics of the study participants are summarized in Table 1. In 2002 wave, the mean age was 82.6 years, and about 52.0% (n=5,800) of study participants were female. The majority were Han ethnicity (93.8%), and more than half were illiterate (57.4%). Only a small percentage had white collar occupation (9.4%), and about 30% had economic independence. Those who survived in 2005 wave were comparable to those in 2002 wave, except they were younger (79.8 vs 82.6 years) and had higher proportions of regular exercise (38.6% vs 34.6%) and economic independence (34.9% vs 29.2%).
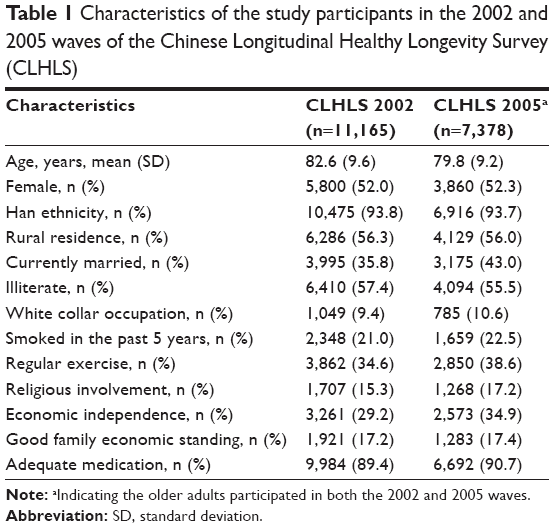 | Table 1 Characteristics of the study participants in the 2002 and 2005 waves of the Chinese Longitudinal Healthy Longevity Survey (CLHLS) |
Table 2 shows the numbers and rates of transitions between frailty states. In 2002 wave, about 20.2% of participants were classified as nonfrail, 47.9% as prefrail, and 31.9% as frail. Of the 11,165 participants, 3,394 (30.4%) had transitioned between different frailty states (nonfrail, prefrail, and frail), one-third transitioned to death, and the other one-third remained in previous frailty states. Transitions to greater frailty (ie, “worsening”) were more common than transitions to lesser frailty (ie, “improvement”). For example, the rates of transitions were 46% from nonfrail to prefrail and 10% from nonfrail to frail, whereas only 11.6% from prefrail to nonfrail and 10.1% from frail to prefrail, and 1.3% from frail to nonfrail. As expected, the rate of transitions to death increased from nonfrail to frail (Table 2).
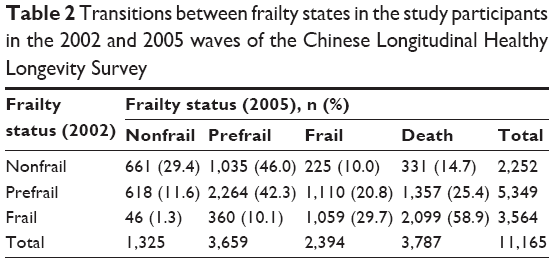 | Table 2 Transitions between frailty states in the study participants in the 2002 and 2005 waves of the Chinese Longitudinal Healthy Longevity Survey |
Table 3 presents the associations between transition categories and the type of death. We found that “worsening” and “remaining frail” had significantly higher risks of all types of death compared with “remaining nonfrail and prefrail.” For example, “worsening” and “remaining frail” had ORs of 1.92 (95% CI =1.41, 2.62) and 4.75 (95% CI =3.32, 6.80), respectively, for type 4 of death (ie, ≥30 bedridden days with suffering before death). The association between “improvement” and the type of death was not statistically significant (Table 3). When all types of death were combined together, the corresponding ORs were 1.84 (95% CI =1.58, 2.13) for “worsening,” 1.06 (95% CI =0.86, 1.30) for “improvement,” and 3.22 (95% CI =2.64, 3.92) for “remaining frail” (data not shown, adjusted for all covariates).
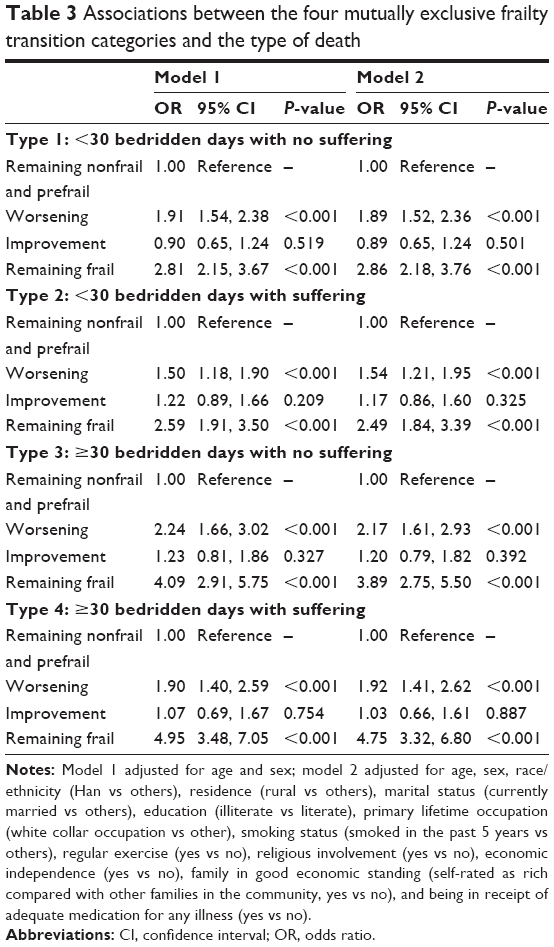 | Table 3 Associations between the four mutually exclusive frailty transition categories and the type of death |
In sensitivity analyses, we found that 1) the characteristics of participants included at baseline (2002 and 2005 waves) and those who were lost to follow-up from 2002 to 2005 waves were generally similar, but with higher percentages for urban residence, white collar occupation, and economic independence observed in the latter group (Table S2). Similar results were observed when comparing participants who completed the follow-up period until death or 2008 wave and those who were lost to follow-up before 2008 wave (Table S3); 2) by applying another cutoff (0.08 and 0.25) for FI score showed similar results; 3) using IPW approach with all covariates included, similar associations between transition categories and the type of death were observed with two exceptions for “worsening” (Table S4); and 4) there were no substantial differences in the observed associations above between males and females (data not shown).
Discussion
To the best of our knowledge, this is the first large-scale study to examine frailty transitions and their associations with adverse outcomes. In this prospective study, we found that, during 3-year period, about one-third of the participants remained in previous frailty states (eg, 29.4% remained nonfrail). Transitions to greater frailty (ie, “worsening”) were more common than transitions to lesser frailty (ie, “improvement”). Among the four mutually exclusive frailty transition categories, “worsening” and “remaining frail” had increased risks of painful death. These findings provide new insights into the harmful effects of certain frailty transitions and clues for subsequent clinical care and interventions in older adults.
The rates of frailty transitions in this study were consistent with those from previous studies, although they might differ slightly regarding certain transitions. Specifically, nearly all prior studies demonstrated that transitions to greater frailty (ie, “worsening”) were more common than transitions to lesser frailty (ie, “improvement”).3,5,6,27 Only about 2% of transitions from frail to nonfrail were observed in the study of Hong Kong older adults,6 and the corresponding proportion was 1.3% in this study. Regarding remaining previous frailty states, Lee et al6 reported that about 24.2%–25.5% remained frail as opposed to the proportion (29.7%) shown in this study. However, we noticed that a higher proportion remained nonfrail (ranging from 37.8% to 67.4%) in previous studies3,5,6,27 than that in this study (29.4%). The discrepancy might be attributed to reasons such as differences in study participants’ characteristics (eg, races and age), variations in the follow-up period (eg, 1 year and 2 years), and different frailty measurements used (eg, frailty phenotype vs index, modified components for frailty phenotype). Our results provide the first preliminary information based on a national sample of older adults from Mainland China.
Furthermore, compared with older adults who “remained nonfrail and prefrail,” those had experienced frailty transitions of “worsening” and “remaining frail” had increased risks of painful death. The quality of death in late life has drawn increasing attention during the past few decades, of which the type of death is relevant to the older persons and their families. Our findings underscore the harmful effects and distinct prognostic value of certain frailty transitions. In other words, among frequent frailty transitions, “worsening” and “remaining frail” increased the likelihood of experiencing low quality of death, which raises concerns about the quality of life in frail populations. Identifying factors that contribute to these transitions is beyond the scope of the current study, but would require much attention in the future. In addition, participants who had transitioned to a nonfrail status (ie, “improvement,” even being a smaller group) did not show higher levels of adverse outcomes, which reinforces the importance of intervention on frailty.
We observed that “remaining frail” had the highest risk of all the four types of death (Table 3). Note that the older adults who remained frail in this study might represent a selective survived sample during the 3-year follow-up (we cannot account for this potential confounding effect) and might be expected to have better prognosis. However, we still found that these older adults presented higher likelihood of painful death, which further underscores the cumulative deleterious effect of frailty. To date, a large body of studies has been conducted in frail populations on improving their quality of life.28 In this study, to some degree, our results provide strong evidence for the implementation of such clinical research. From the perspective of clinical and policy implications, our findings suggest that more health care resources should be allocated to older adults with presence of frailty for a long period of time accordingly.
This study also emphasizes the importance of longitudinal assessments of frailty in older adults, which would be a future research direction. To date, frailty has been recognized as a hot topic,29 and frailty assessments have been conducted in community and clinical settings.30–34 However, to our knowledge, no formal clinical guideline has been developed over the past years. The findings from this study suggest that future guidelines of frailty assessments should consider collecting persons’ previous frailty states, which was of great importance to subsequent health outcomes. A prior study on frailty transition also supports this suggestion.3
The strength of this study is that it employs a comprehensive measure of frailty in a large-scale cohort of older adults. Although slightly different deficits were used in previous studies, the validity of the frailty measure was satisfactory.10,15,16 Compared with prior studies on frailty transitions,3,5,6,27 the current study had the largest sample size. Nevertheless, several limitations of this study need to be mentioned. First, the type of death only includes two domains; no more qualitative assessments of quality of death were available. Second, the high percentage of sample attrition from 2002 to 2008 was not random and may have introduced bias in our estimates, although we have compared the participants included in the analyses with those who were lost to follow-up and used IPW approach to account for the loss to follow-up from 2005 to 2008. Third, some transitions in shorter time might not be captured in this study using a 3-year time period. Fourth, the use of FI approach may overestimate frailty transitions due to the inherent nature of such a measure of deficit accumulation (eg, a change for FI from 0.20 to 0.22 had been defined as a transition from prefrail to frail, whereas this change might not be substantially relevant to the participant). Finally, similar to other studies on older adults, there was a proportion of missing values because of increased age and/or declined cognitive function, and proxies were used to reduce nonresponse, which might introduce biases when there was inconsistency between proxy ratings and those of the actual ratings of the participants.
Conclusion
In summary, this large sample of the older adults in China supports that frailty is a dynamic process, characterized by frequent types of transitions. Older adults who remained frail for a period of time had the highest likelihood of painful death, which raises concerns about the quality of life in frail populations.
Acknowledgments
The data used in this study were from the 2002, 2005, and 2008 waves of the CLHLS, which are managed by the Center for Healthy Aging and Development Studies, Peking University. This work was supported by the Claude D. Pepper Older Americans Independence Center (grant number P30AG021342). Dr Liu is the recipient of a James Hudson Brown–Alexander B. Coxe Fellowship from Yale University School of Medicine, and he also received support from U01AG022376. The CLHLS was supported by funds from the US National Institutes on Aging (grant number R01AG023627), China Natural Science Foundation (grant numbers 71233001 and 71110107025), China Social Science Foundation, and the United Nations Fund for Population Activities. This work was supported by funds from the National Natural Science Foundation (grant numbers 81571372 and 81670465). We thank Dr George Agogo for his assistance with the writing.
Disclosure
The authors report no conflicts of interest in this work.
References
Clegg A, Young J, Iliffe S, Rikkert MO, Rockwood K. Frailty in elderly people. Lancet. 2013;381(9868):752–762. | ||
Fried LP, Tangen CM, Walston J, et al. Frailty in older adults: evidence for a phenotype. J Gerontol A Biol Sci Med Sci. 2001;56(3):M146–M156. | ||
Gill TM, Gahbauer EA, Allore HG, Han L. Transitions between frailty states among community-living older persons. Arch Intern Med. 2006;166(4):418–423. | ||
Fallah N, Mitnitski A, Searle SD, Gahbauer EA, Gill TM, Rockwood K. Transitions in frailty status in older adults in relation to mobility: a multistate modeling approach employing a deficit count. J Am Geriatr Soc. 2011;59(3):524–529. | ||
Espinoza SE, Jung I, Hazuda H. Frailty transitions in the San Antonio Longitudinal Study of Aging. J Am Geriatr Soc. 2012;60(4):652–660. | ||
Lee JS, Auyeung TW, Leung J, Kwok T, Woo J. Transitions in frailty states among community-living older adults and their associated factors. J Am Med Dir Assoc. 2014;15(4):281–286. | ||
Patrick DL, Engelberg RA, Curtis JR. Evaluating the quality of dying and death. J Pain Symptom Manage. 2001;22(3):717–726. | ||
Stewart AL, Teno J, Patrick DL, Lynn J. The concept of quality of life of dying persons in the context of health care. J Pain Symptom Manage. 1999;17(2):93–108. | ||
Seale C, van der Geest S. Good and bad death: introduction. Soc Sci Med. 2004;58(5):883–885. | ||
Dupre ME, Gu D, Warner DF, Zeng Y. Frailty and type of death among older adults in China: prospective cohort study. BMJ. 2009;338:b1175. | ||
Gu D. General data assessment of the Chinese Longitudinal Healthy Longevity Survey in 2002. In: Zeng Y, Poston D, Smith J, Vlosky DA, Gu D, editors. Healthy Longevity in China: Demographic, Socioeconomic, and Psychological Dimensions. Dordrecht, The Netherlands: Springer; 2008:39–59. | ||
Gu D, Dupre ME. Assessment of reliability of mortality and morbidity in the 1998–2002 CLHLS waves. In: Zeng Y, Poston D, Smith J, Vlosky DA, Gu D, editors. Healthy Longevity in China: Demographic, Socioeconomic, and Psychological Dimensions. Dordrecht, The Netherlands: Springer; 2008:99–115. | ||
Zeng Y, Gu D. Reliability of age reporting among the Chinese oldest-old in the CLHLS data sets. In: Zeng Y, Poston D, Smith J, Vlosky DA, Gu D, editors. Healthy Longevity in China: Demographic, Socioeconomic, and Psychological Dimensions. Dordrecht, The Netherlands: Springer; 2008:61–78. | ||
Searle SD, Mitnitski A, Gahbauer EA, Gill TM, Rockwood K. A standard procedure for creating a frailty index. BMC Geriatr. 2008;8:24. | ||
Gu D, Dupre ME, Sautter J, Zhu H, Liu Y, Yi Z. Frailty and mortality among Chinese at advanced ages. J Gerontol B Psychol Sci Soc Sci. 2009;64(2):279–289. | ||
Bennett S, Song X, Mitnitski A, Rockwood K. A limit to frailty in very old, community-dwelling people: a secondary analysis of the Chinese longitudinal health and longevity study. Age Ageing. 2013;42(3):372–377. | ||
Yang F, Gu D. Predictability of frailty index and its components on mortality in older adults in China. BMC Geriatr. 2016;16:145. | ||
Kulminski A, Yashin A, Arbeev K, et al. Cumulative index of health disorders as an indicator of aging-associated processes in the elderly: results from analyses of the National Long Term Care Survey. Mech Ageing Dev. 2007;128(3):250–258. | ||
Mitnitski A, Song X, Skoog I, et al. Relative fitness and frailty of elderly men and women in developed countries and their relationship with mortality. J Am Geriatr Soc. 2005;53(12):2184–2189. | ||
Goggins WB, Woo J, Sham A, Ho SC. Frailty index as a measure of biological age in a Chinese population. J Gerontol A Biol Sci Med Sci. 2005;60(8):1046–1051. | ||
Blodgett J, Theou O, Kirkland S, Andreou P, Rockwood K. Frailty in NHANES: comparing the frailty index and phenotype. Arch Gerontol Geriatr. 2015;60(3):464–470. | ||
Hoover M, Rotermann M, Sanmartin C, Bernier J. Validation of an index to estimate the prevalence of frailty among community-dwelling seniors. Health Rep. 2013;24(9):10–17. | ||
Gu D, Dupre ME, Liu G. Characteristics of the institutionalized and community-residing oldest-old in China. Soc Sci Med. 2007;64(4):871–883. | ||
Hickman SE, Tilden VP, Tolle SW. Family reports of dying patients’ distress: the adaptation of a research tool to assess global symptom distress in the last week of life. J Pain Symptom Manage. 2001;22(1):565–574. | ||
Song X, Mitnitski A, Rockwood K. Prevalence and 10-year outcomes of frailty in older adults in relation to deficit accumulation. J Am Geriatr Soc. 2010;58(4):681–687. | ||
Seaman SR, White IR. Review of inverse probability weighting for dealing with missing data. Stat Methods Med Res. 2013;22(3):278–295. | ||
Alencar MA, Dias JMD, Figueiredo LC, Dias RC. Transitions in frailty status in community-dwelling older adults. Top Geriatr Rehabil. 2015;31(2):105–112. | ||
de Labra C, Guimaraes-Pinheiro C, Maseda A, Lorenzo T, Millan-Calenti JC. Effects of physical exercise interventions in frail older adults: a systematic review of randomized controlled trials. BMC Geriatr. 2015;15:154. | ||
Cesari M, Prince M, Thiyagarajan JA, et al. Frailty: an emerging public health priority. J Am Med Dir Assoc. 2016;17(3):188–192. | ||
Afilalo J, Alexander KP, Mack MJ, et al. Frailty assessment in the cardiovascular care of older adults. J Am Coll Cardiol. 2014;63(8):747–762. | ||
Smets IH, Kempen GI, Janssen-Heijnen ML, Deckx L, Buntinx FJ, van den Akker M. Four screening instruments for frailty in older patients with and without cancer: a diagnostic study. BMC Geriatr. 2014;14:26. | ||
Woo J, Yu R, Wong M, Yeung F, Wong M, Lum C. Frailty screening in the community using the FRAIL scale. J Am Med Dir Assoc. 2015;16(5):412–419. | ||
Tan LF, Lim ZY, Choe R, Seetharaman S, Merchant R. Screening for frailty and sarcopenia among older persons in medical outpatient clinics and its associations with healthcare burden. J Am Med Dir Assoc. 2017;18(7):583–587. | ||
Rowe R, Iqbal J, Murali-Krishnan R, et al. Role of frailty assessment in patients undergoing cardiac interventions. Open Heart. 2014;1(1):e000033. |
Supplementary materials
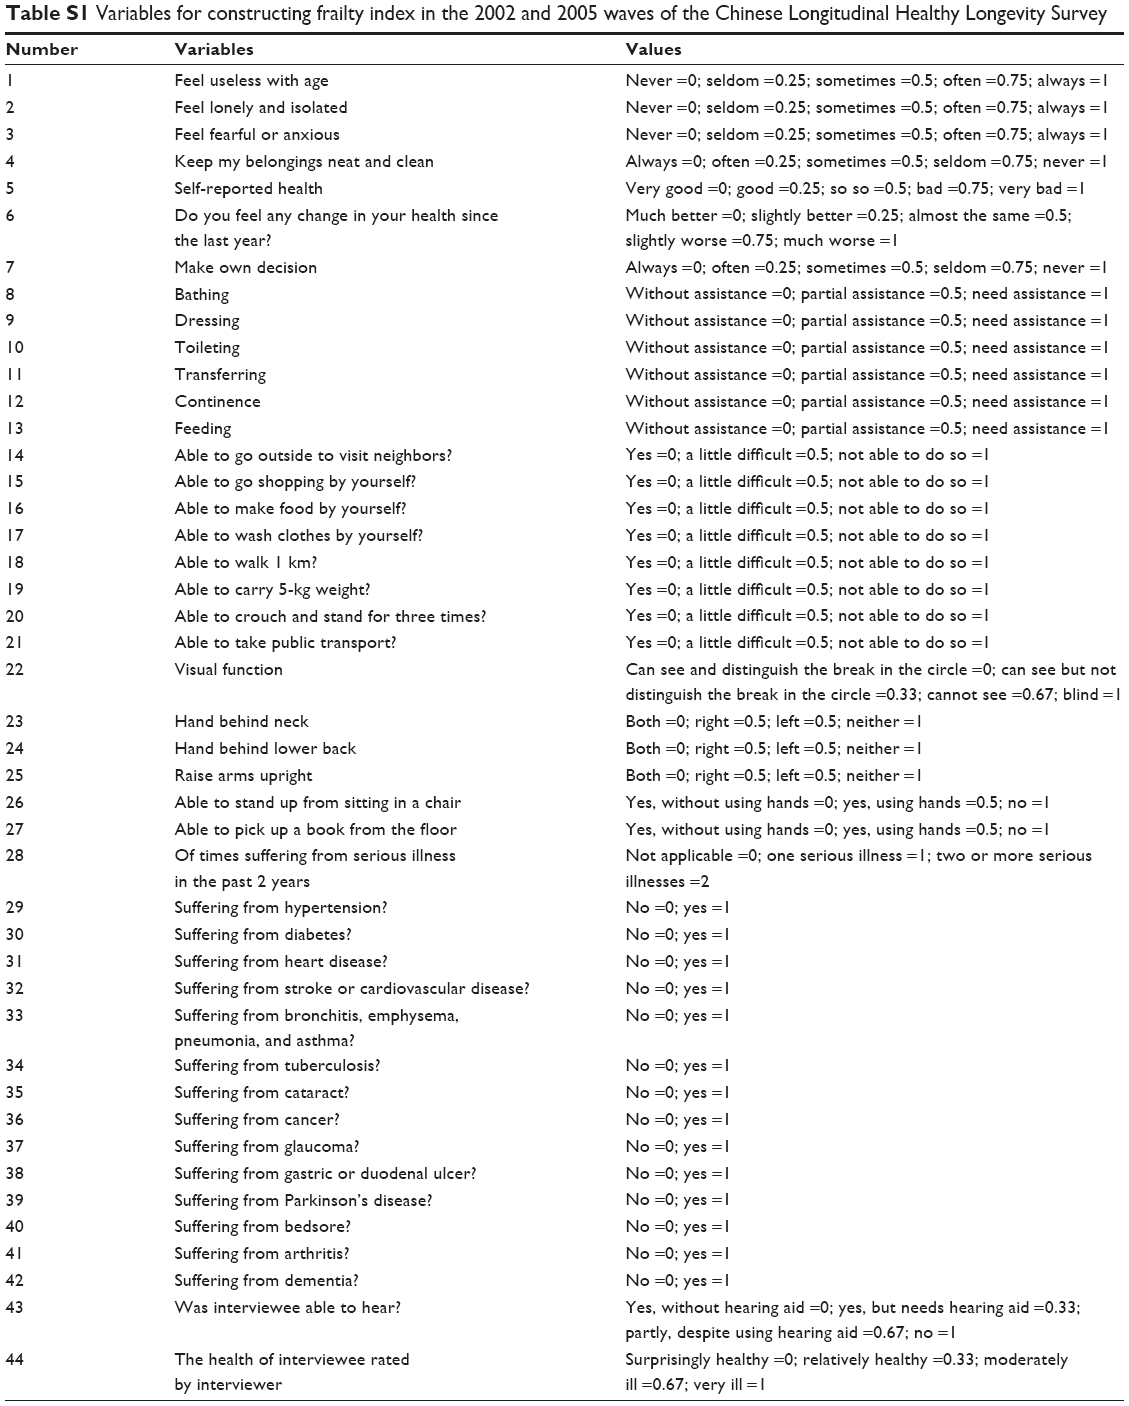 | Table S1 Variables for constructing frailty index in the 2002 and 2005 waves of the Chinese Longitudinal Healthy Longevity Survey |
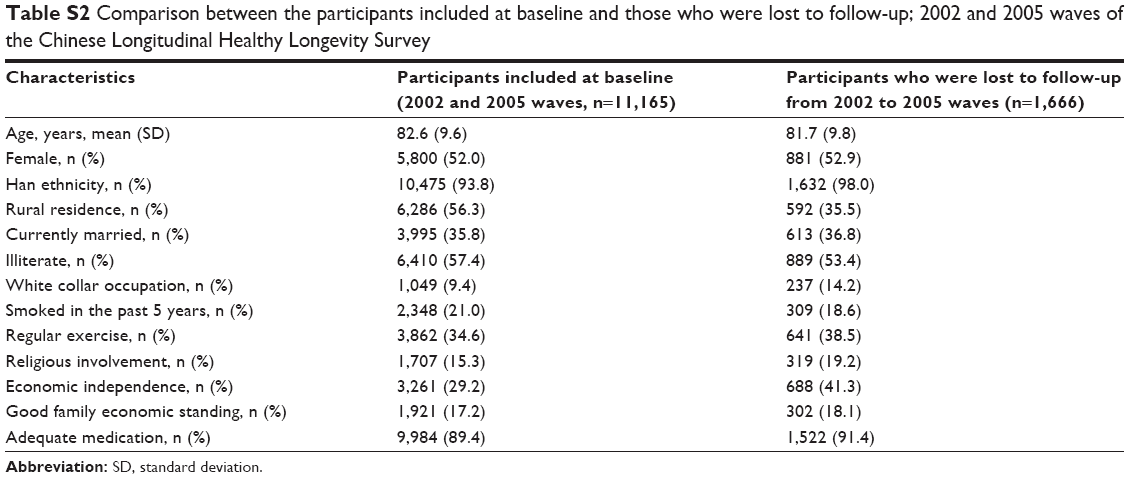 | Table S2 Comparison between the participants included at baseline and those who were lost to follow-up; 2002 and 2005 waves of the Chinese Longitudinal Healthy Longevity Survey |
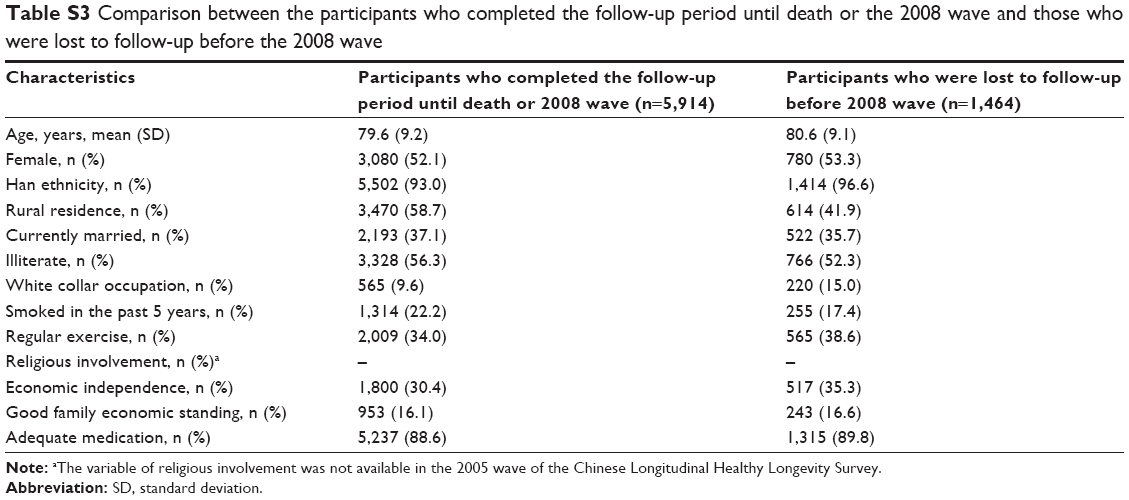 | Table S3 Comparison between the participants who completed the follow-up period until death or the 2008 wave and those who were lost to follow-up before the 2008 wave |
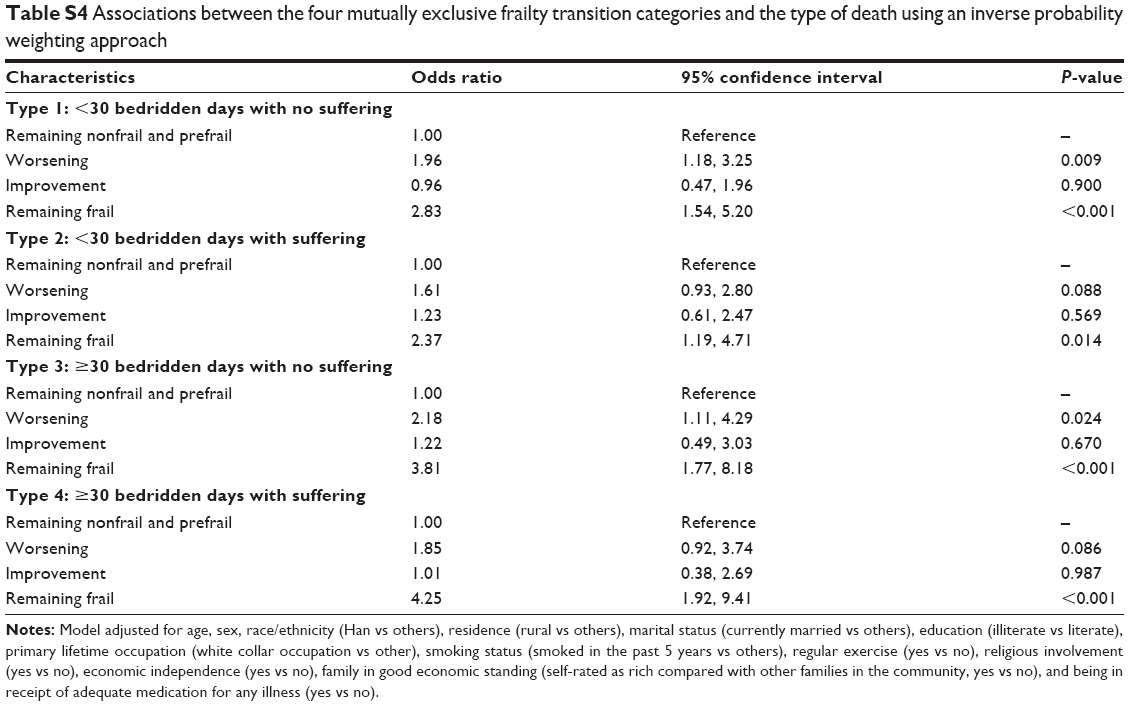 | Table S4 Associations between the four mutually exclusive frailty transition categories and the type of death using an inverse probability weighting approach |
 © 2018 The Author(s). This work is published and licensed by Dove Medical Press Limited. The full terms of this license are available at https://www.dovepress.com/terms.php and incorporate the Creative Commons Attribution - Non Commercial (unported, v3.0) License.
By accessing the work you hereby accept the Terms. Non-commercial uses of the work are permitted without any further permission from Dove Medical Press Limited, provided the work is properly attributed. For permission for commercial use of this work, please see paragraphs 4.2 and 5 of our Terms.
© 2018 The Author(s). This work is published and licensed by Dove Medical Press Limited. The full terms of this license are available at https://www.dovepress.com/terms.php and incorporate the Creative Commons Attribution - Non Commercial (unported, v3.0) License.
By accessing the work you hereby accept the Terms. Non-commercial uses of the work are permitted without any further permission from Dove Medical Press Limited, provided the work is properly attributed. For permission for commercial use of this work, please see paragraphs 4.2 and 5 of our Terms.