")
Back to Journals » Clinical Interventions in Aging » Volume 15
Frailty Phenotype Prevalence in Community-Dwelling Older Adults According to Physical Activity Assessment Method
Authors Ziller C , Braun T , Thiel C
Received 12 November 2019
Accepted for publication 11 January 2020
Published 9 March 2020 Volume 2020:15 Pages 343—355
DOI https://doi.org/10.2147/CIA.S238204
Checked for plagiarism Yes
Review by Single anonymous peer review
Peer reviewer comments 2
Editor who approved publication: Dr Richard Walker
Carina Ziller,1 Tobias Braun,1 Christian Thiel1,2
1Department of Applied Health Sciences, Division of Physiotherapy, Hochschule für Gesundheit (University of Applied Sciences), Bochum, Germany; 2Faculty of Sports Science, Training and Exercise Science, Ruhr University Bochum, Bochum, Germany
Correspondence: Carina Ziller
Department of Applied Health Sciences, Division of Physiotherapy, Hochschule für Gesundheit (University of Applied Sciences), Gesundheitscampus 6-8, Bochum 44801, Germany
Tel +49 234 77727 628
Fax +49 234 77727 828
Email [email protected]
Introduction: Studies have described varying prevalences of frailty as determined by Fried’s frailty phenotype. Comparability may be limited due to frailty phenotype modifications, especially the low physical activity criterion.
Purpose: This study aimed to determine the variability of frailty phenotype prevalence according to the physical activity assessment method.
Patients and Methods: In a cross-sectional analysis, frailty phenotype prevalence was assessed in community-dwelling older adults. The low physical activity criterion of the frailty phenotype was determined by using five different questionnaires and an accelerometer, and three different cut-point models.
Results: In 47 participants, frailty phenotype prevalence varied between 14.9% and 31.9%, depending on the model used to assess physical activity.
Conclusion: The method of physical activity assessment and the choice of cut-points for low physical activity considerably impact frailty phenotype prevalence. More efforts to standardize and adhere to the low physical activity criterion seem warranted. The calculation of correction factors between commonly used sets of low physical activity criteria might allow better comparisons of published prevalence rates.
Keywords: physical frailty, physical activity assessments, older adults
Introduction
Frailty has become an important geriatric concept. It describes an older adult’s increased risk for negative health outcomes such as falls, physical disability, hospitalization and mortality.1
Frailty prevalence in community-dwelling older adults varies between 4% and 59%.2 This high variability may reflect true differences in various populations, but it may also be due to the method of diagnosis of frailty.3 A broad range of frailty instruments for screening and diagnosis exists, including self-reported questionnaires and/or performance tests with implications for prevalence values, classification and predictive abilities.4,5 Researchers and clinicians are challenged to decide which instrument to use.5
Two frailty instruments are especially common: The Frailty Index (FI), which counts accumulated health deficits and covers a broad set of frailty domains as a continuum,6 and the frailty phenotype (FP), which classifies people into three categories (fit, pre-frail, and frail) based on five criteria (unintended weight loss, self-reported exhaustion, low physical activity (LPA), slow walking speed, and weak grip strength).7
In a review including studies that have investigated frailty prevalence based on Fried’s model, prevalence varied between 4.9% and 27.3%, a variation of 22.4 percentage points.8 According to FP data reported by Collard et al,2 prevalence values of the included studies varied by 13.0 percentage points (4.0% to 17.0%). This variation in frailty prevalence might be explained by true variation, country-specific differences, as well as modifications of the FP described in the literature.2,3
The FP has often been established based on different measurement methods, complicating comparative analysis.9 According to a systematic review, unintended weight loss and LPA were the criteria that had been altered the most frequently.3 Originally, in order to define a LPA level, Fried and colleagues7 included items of the Minnesota Leisure Time Physical Activity Questionnaire (MLTPAQ)10 and cut-point values were derived from the lowest 20th percentile of the Cardiovascular Health Study (CHS) population.7 The appropriateness of the MLTPAQ for the general geriatric population has been questioned, as it focuses on moderate to vigorous physical activities (MVPA) not related to older adults and shows floor effects.11,12 Later, various methods, including different questionnaires, single questions or objective measures such as an activity monitor (accelerometer) have been used to assess the LPA criterion.3
In published studies using the FP, most cut-point values were either based on the ones proposed by Fried et al7 (population-independent) or derived in relation to the variability within the study sample, eg by using the lowest quintile of the respective study population.3 Even though it seems reasonable to assume that the diversity of existing physical activity (PA) measurements and cut-point values may influence frailty prevalence, the magnitude of its potential influence has never been quantified.
Thus, the aim of this study was to analyze the variance in prevalence of physical frailty in community-dwelling older adults according to the Fried model by using different methods and models for measuring PA for the LPA criterion. We assumed that modifications of the LPA criterion would shift the prevalence of physical frailty by more than half of the 17.7 percentage points, the mean of the two mean values reported in the mentioned reviews.2,8
Materials and Methods
Study Design
The current analysis is an extension of two different studies conducted between October 2015 and February 2018, in which additional data on PA had been collected. One study (study A) had established the prevalence of frailty in a sample of older people attending outpatient physiotherapy services,13 and the second study (study B), a pilot randomized controlled trial, had assessed the effect of a physiotherapy-led home-based intervention in older adults with frailty.14 The present study was approved as an amendment to the two original ethical approvals by the Ethical Review Board of the German Confederation for Physiotherapy. This study was conducted in accordance with the Declaration of Helsinki in its most recent version (64th WMA General Assembly, Fortaleza, Brazil, October 2013). All participants provided written informed consent for study participation. Reporting follows the Strengthening the Reporting of Observational Studies in Epidemiology statement.15
Recruitment Strategy
Participants were recruited in the context of the two mentioned studies (Figure 1).13,14 Recruitment procedures of those two studies have been reported in detail elsewhere.13,14 Shortly, in study A (the prevalence study), participants were recruited in outpatient physiotherapy clinics in Bochum, Germany. Assessments in study A at these outpatient physiotherapy clinics included different measurement instruments of frailty, after which participants were instantly invited to take part in the present study. In study B (the RCT), older adults were recruited in social facilities such as senior citizens’ offices, by newspaper advertisements, as well as using care services and the university network. Respondents were screened for predefined inclusion and exclusion criteria of study B. If they did not fulfill those criteria, and/or if they lacked the time or willingness to participate in study B, they were later invited by telephone to participate in the present study.
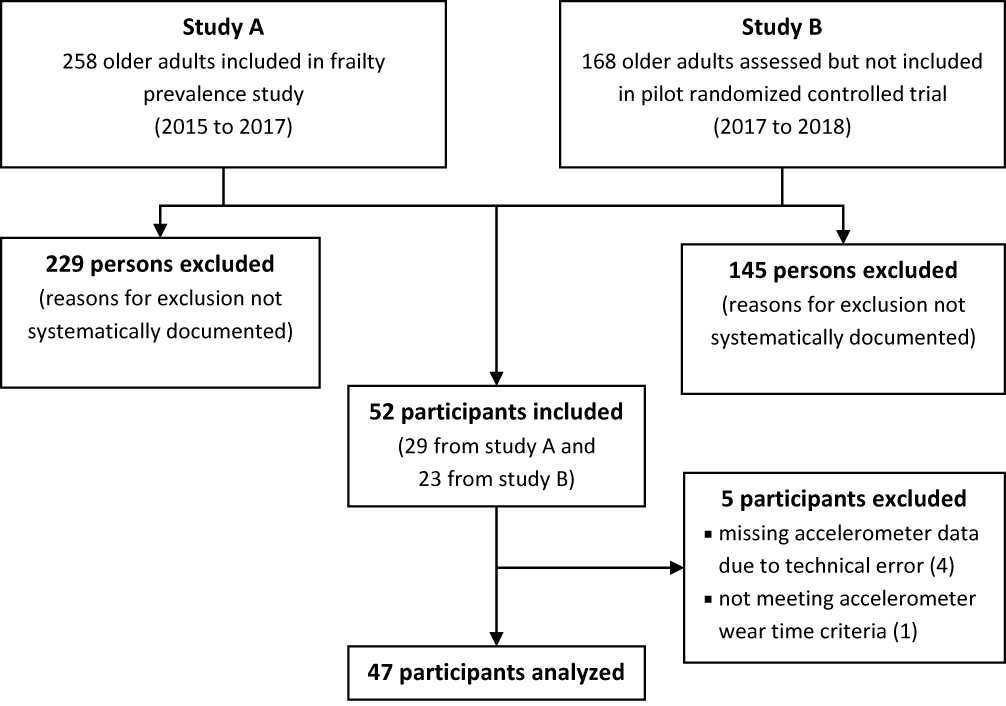 |
Figure 1 Flow-chart of recruitment process. |
Setting
Data collection was conducted in the city of Bochum in the Western part of Germany. Measurements of the participants recruited from the prevalence study (study A) were either performed in the outpatient physiotherapy clinics, or at home. Measurements of the respondents not participating in the RCT (study B) were performed at their homes.
Participants
To be eligible, older adults had to be community-dwelling and at least 65 years old. Exclusion criteria were: 1) the inability to both understand the study information and give informed consent (eg due to severe cognitive or visual impairment); 2) acute conditions which might affect physical activity behavior (eg acute illness, infection, injury); 3) the inability to walk at least 10 m (with a walking aid, if required); 4) insufficient German language skills; and 5) lack of time to participate in the study. Chronic morbidities were not an exclusion criterion, since they are a typical feature of frailty, and the measurement of physical activity is not associated with any risks for health.
Procedures
At the first appointment, an accelerometer (ActiGraph wGT3x-BT) was given and explained to each participant as described below. At a second appointment, approximately one week later, the accelerometer was collected, frailty assessments were conducted, and PA questionnaires were collected in random order in the form of an interview.
Variables
Physical frailty was measured by using several versions of the FP.7 Overall frailty was measured using a FI.6
Data Measurement
A translated German version16 of the FP with the following five criteria was used to assess participants for physical frailty: 1) unintentional weight loss (≥4.5 kg in the last year); 2) exhaustion (two self-reported questions about the past week from the Centre for Epidemiological Studies-Depression scale); 3) slow gait speed (walking time over a distance of 4.57 m [15 ft]); 4) weakness (grip strength of the dominant hand using a JAMAR dynamometer (Patterson Medical, Model 5030J1) following measurement procedures recommended by Roberts et al17); and 5) low physical activity (using different assessments and cut-points; see section “PA assessments” and Table 1). More than three positive criteria characterize a person as frail, one or two positive items as pre-frail and none as non-frail or fit.7 Fried’s original phenotype version was defined as the primary phenotype in this study. Additionally, eighteen modified versions were created by including different PA assessments as well as using different cut-point models (Table 1).
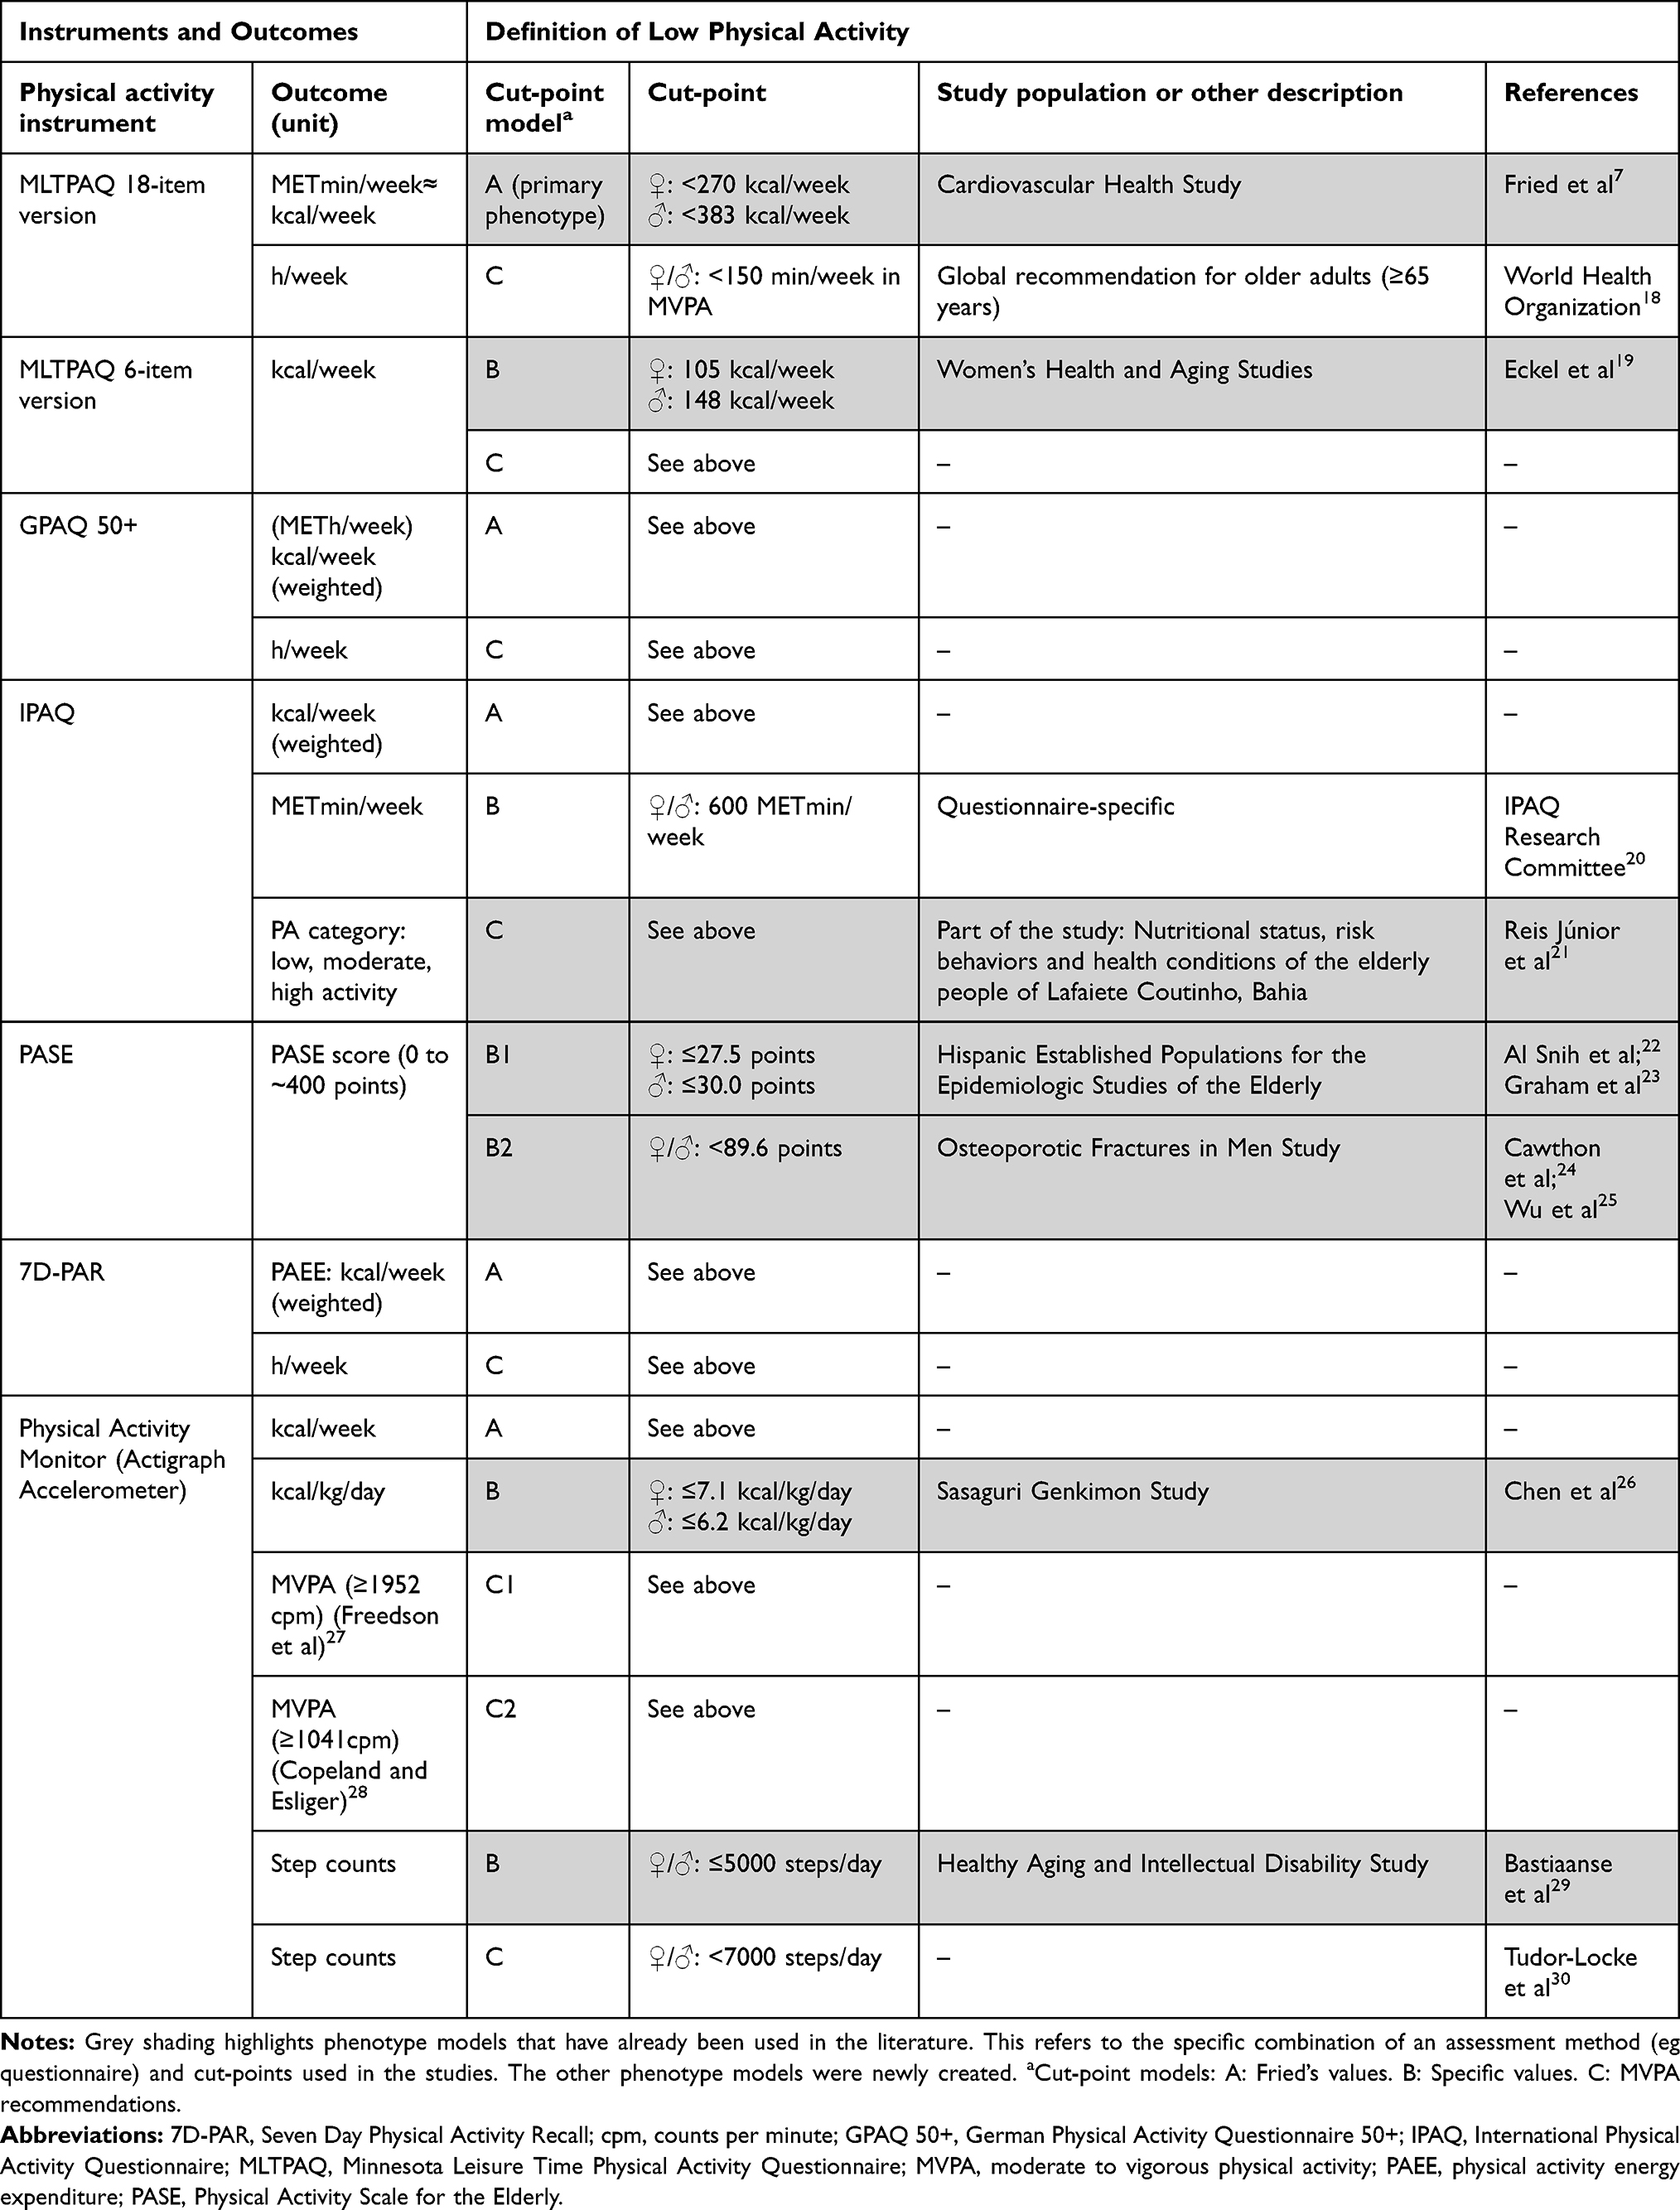 |
Table 1 Detailed Description of the Models Used to Determine Low Physical Activity |
The FI was derived from a deficit accumulation assessment based on the procedure proposed by Searle et al.31 The slightly modified FI used in this study consisted of 41 items, including 39 questions covering physical, psychological, social and cognitive domains, comorbidities, and two physical performance measurements (grip strength and gait speed, as described above).13 Cut-points for pre-frailty and frailty were 0.08 and 0.25, respectively.32
The instruments to assess PA (accelerometer, questionnaires) and the cut-point value models were selected based on the modifications of the LPA criterion listed in a systematic review by Theou et al,3 and further based on the results of a non-systematic literature search. To be included, questionnaires had to be accessible in German language.
In the primary phenotype, PA was assessed by the 18-item short version of the MLTPAQ.7,10 Alternatively, the German Physical Activity Questionnaire 50+ (GPAQ 50+),33 the long German version of the International Physical Activity Questionnaire (IPAQ),34 the Stanford Seven Day Physical Activity Recall (7D-PAR),35 recommended for frail people,3 and a German version36 of the Physical Activity Scale for the Elderly (PASE)37 were used (Table 1).
Physical activity energy expenditure (PAEE) was calculated from total energy expenditure (TEE) following Calabro et al (PAEE = TEE ∗ 0.9 – RMR).38 To estimate resting metabolic rate (RMR), the equations of Mifflin et al were used.39
For the direct measurement of PA, participants were instructed to wear an accelerometer (ActiGraph wGT3X-BT) on the right hip for seven consecutive days during waking hours. Published recommendations for accelerometer data collection (100Hz, 10-second epochs), data processing (ActiLife Software 6, ActiGraph, LLC) and reporting were followed.40 Non-wearing periods, defined as 90 min of continuous zero counts times, were removed before analysis.41 Four to seven days with each at least 6 hours of wear time were included. Energy expenditure was calculated by the Freedson Combination Algorithm for uniaxial counts per minute (cpm).27 Two different cut-points were used to determine the amount of MVPA, a general model by Freedson et al (MVPA ≥1952 cpm)27 and a specific model for older adults by Copeland and Esliger (MVPA ≥1041 cpm).28 Any activity above the thresholds was counted as MVPA irrespective of the bout length. Sedentary time was defined by a signal <100 cpm.42
Cut-Point Models for LPA
To categorize persons fulfilling the LPA criterion, three cut-points were considered: A) using the cut-points described by Fried, <270 kcal/week for women and <383 kcal/week for men;7 B) using specific values of the respective study/questionnaire; and C) not reaching published health recommendations for MVPA proposed by the World Health Organization (WHO).18 If not specified otherwise in the respective questionnaire, MVPA was assumed for all activity items equal or greater than 3 METs.43
Bias
Relevant sources of bias were the recruitment and selection process, and the choice of questionnaires. We tried to address this latter issue by selecting well-established methods which are appropriate for community-dwelling older adults living in Germany.
Sample Size
We tried to include as many participants as possible but aimed at a minimum sample size of 30 participants, as stated in our application approved by the ethical review board. This minimum sample size is based on the “adequate” sample size for criterion validity (“30–50 patients in the smallest group”) proposed by the COSMIN group.44 The number of participants was limited to the number of persons interested in participating in the two mother studies A and B.
Quantitative Variables
PA data was exported and further processed with Excel 2013 (Microsoft Corporation, Redmond, USA) to calculate energy expenditure (kcal/week), time at MVPA (min/week), daily steps (steps/day) and sedentary time (hours/day).
For each of the 19 phenotypes, relative and absolute prevalence of frailty, pre-frailty, and non-frailty are presented.
To grade the magnitude and impact of the resulting variation of prevalence values, the results of two reviews were taken into account.2,8 A deviation of 17.7 percentage points, which is the mean of the variation in prevalences reported in the two reviews, would be regarded as denoting a very high relevance, more than half of it (>8.85 percentage points) a considerable relevance, and 8.85 or less a small to moderate relevance.
Statistical Methods
FP and FI prevalence and 95% confidence interval were calculated.45 Prevalences based on modified FP versions were descriptively compared to each other, and to the FI based prevalence. Interval-based variables were tested for normality (Shapiro–Wilk test). For the primary phenotype, baseline characteristics as well as PA data of the frail, pre-frail and non-frail groups were compared using ANOVA for normally distributed and Kruskal–Wallis-Test for not normally distributed interval-based data and chi-square tests for proportions.
If data was missing for the primary outcome (FP) or the main outcome of PA measures, participants were excluded from further analysis.
Analyses were performed using SPSS for Windows (Version 20; SPSS Statistics, Armonk, NY, IBM Corp.) and MATLAB (R2017b, The MathWorks, Inc., Massachusetts, USA). The level of statistical significance was set to P<0.05.
Results
Participants
Of 426 persons potentially eligible, 52 participated in the study (Figure 1). Reasons for non-participation were not systematically evaluated. Five participants had to be excluded post hoc because of incomplete accelerometer data. These participants (4 women, 1 man) were of comparable age (70.4 years) and were all non-frail except one person who was pre-frail.
As presented in Table 2, the 47 older adults finally included in the analysis (31 women (66%), 74±6 years old) were able to walk independently without (77%) or with a walking aid (23%). Participants with physical frailty were significantly more sedentary, walked less steps, expended less energy, and accumulated less MVPA (see Table 3).
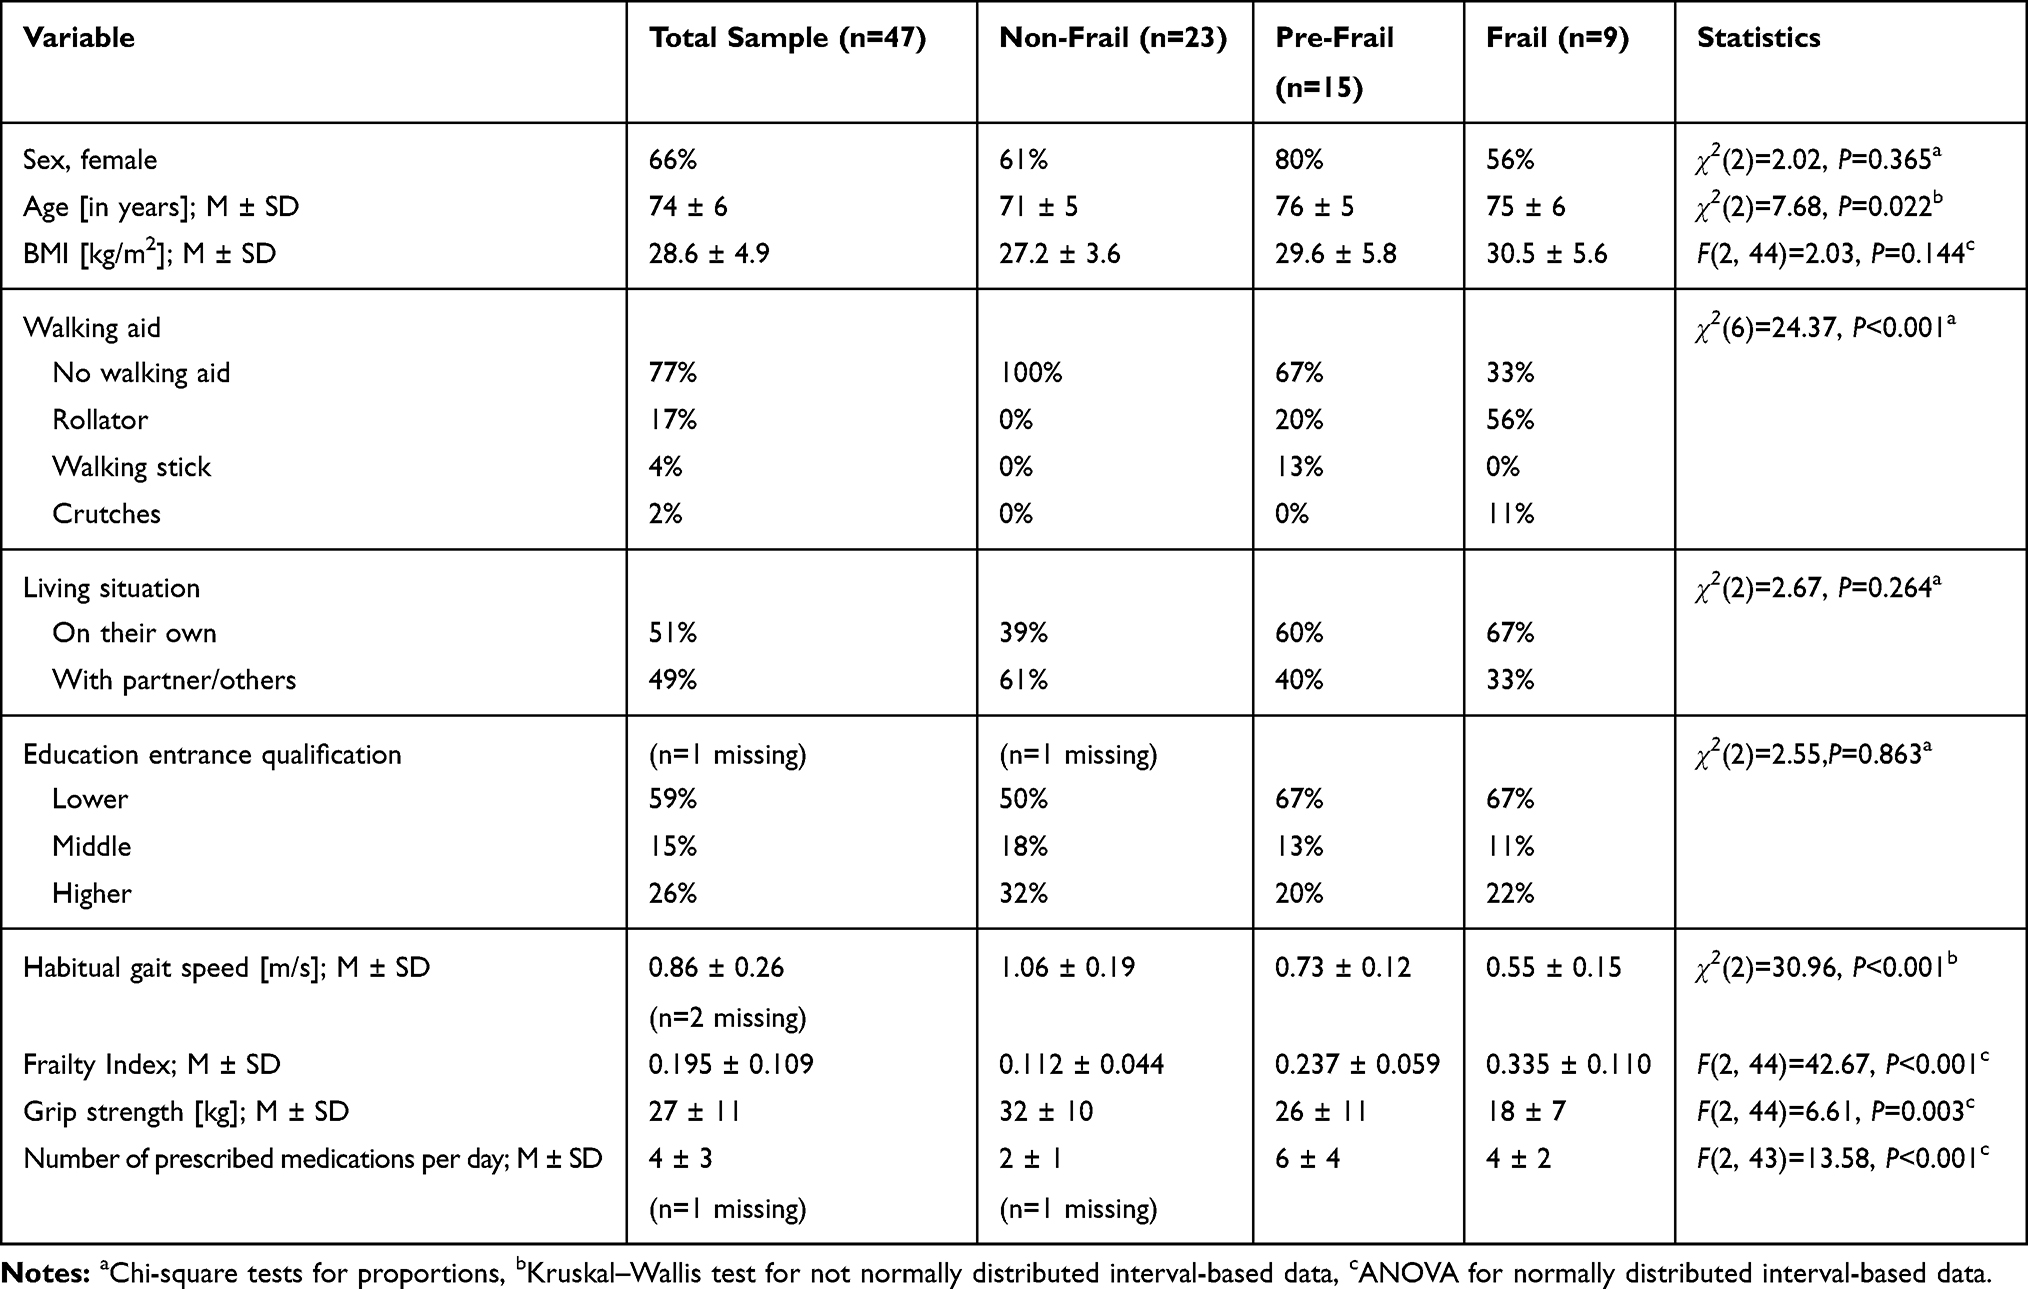 |
Table 2 Characteristics for the Total Study Sample and for Subgroups of the Primary Phenotype |
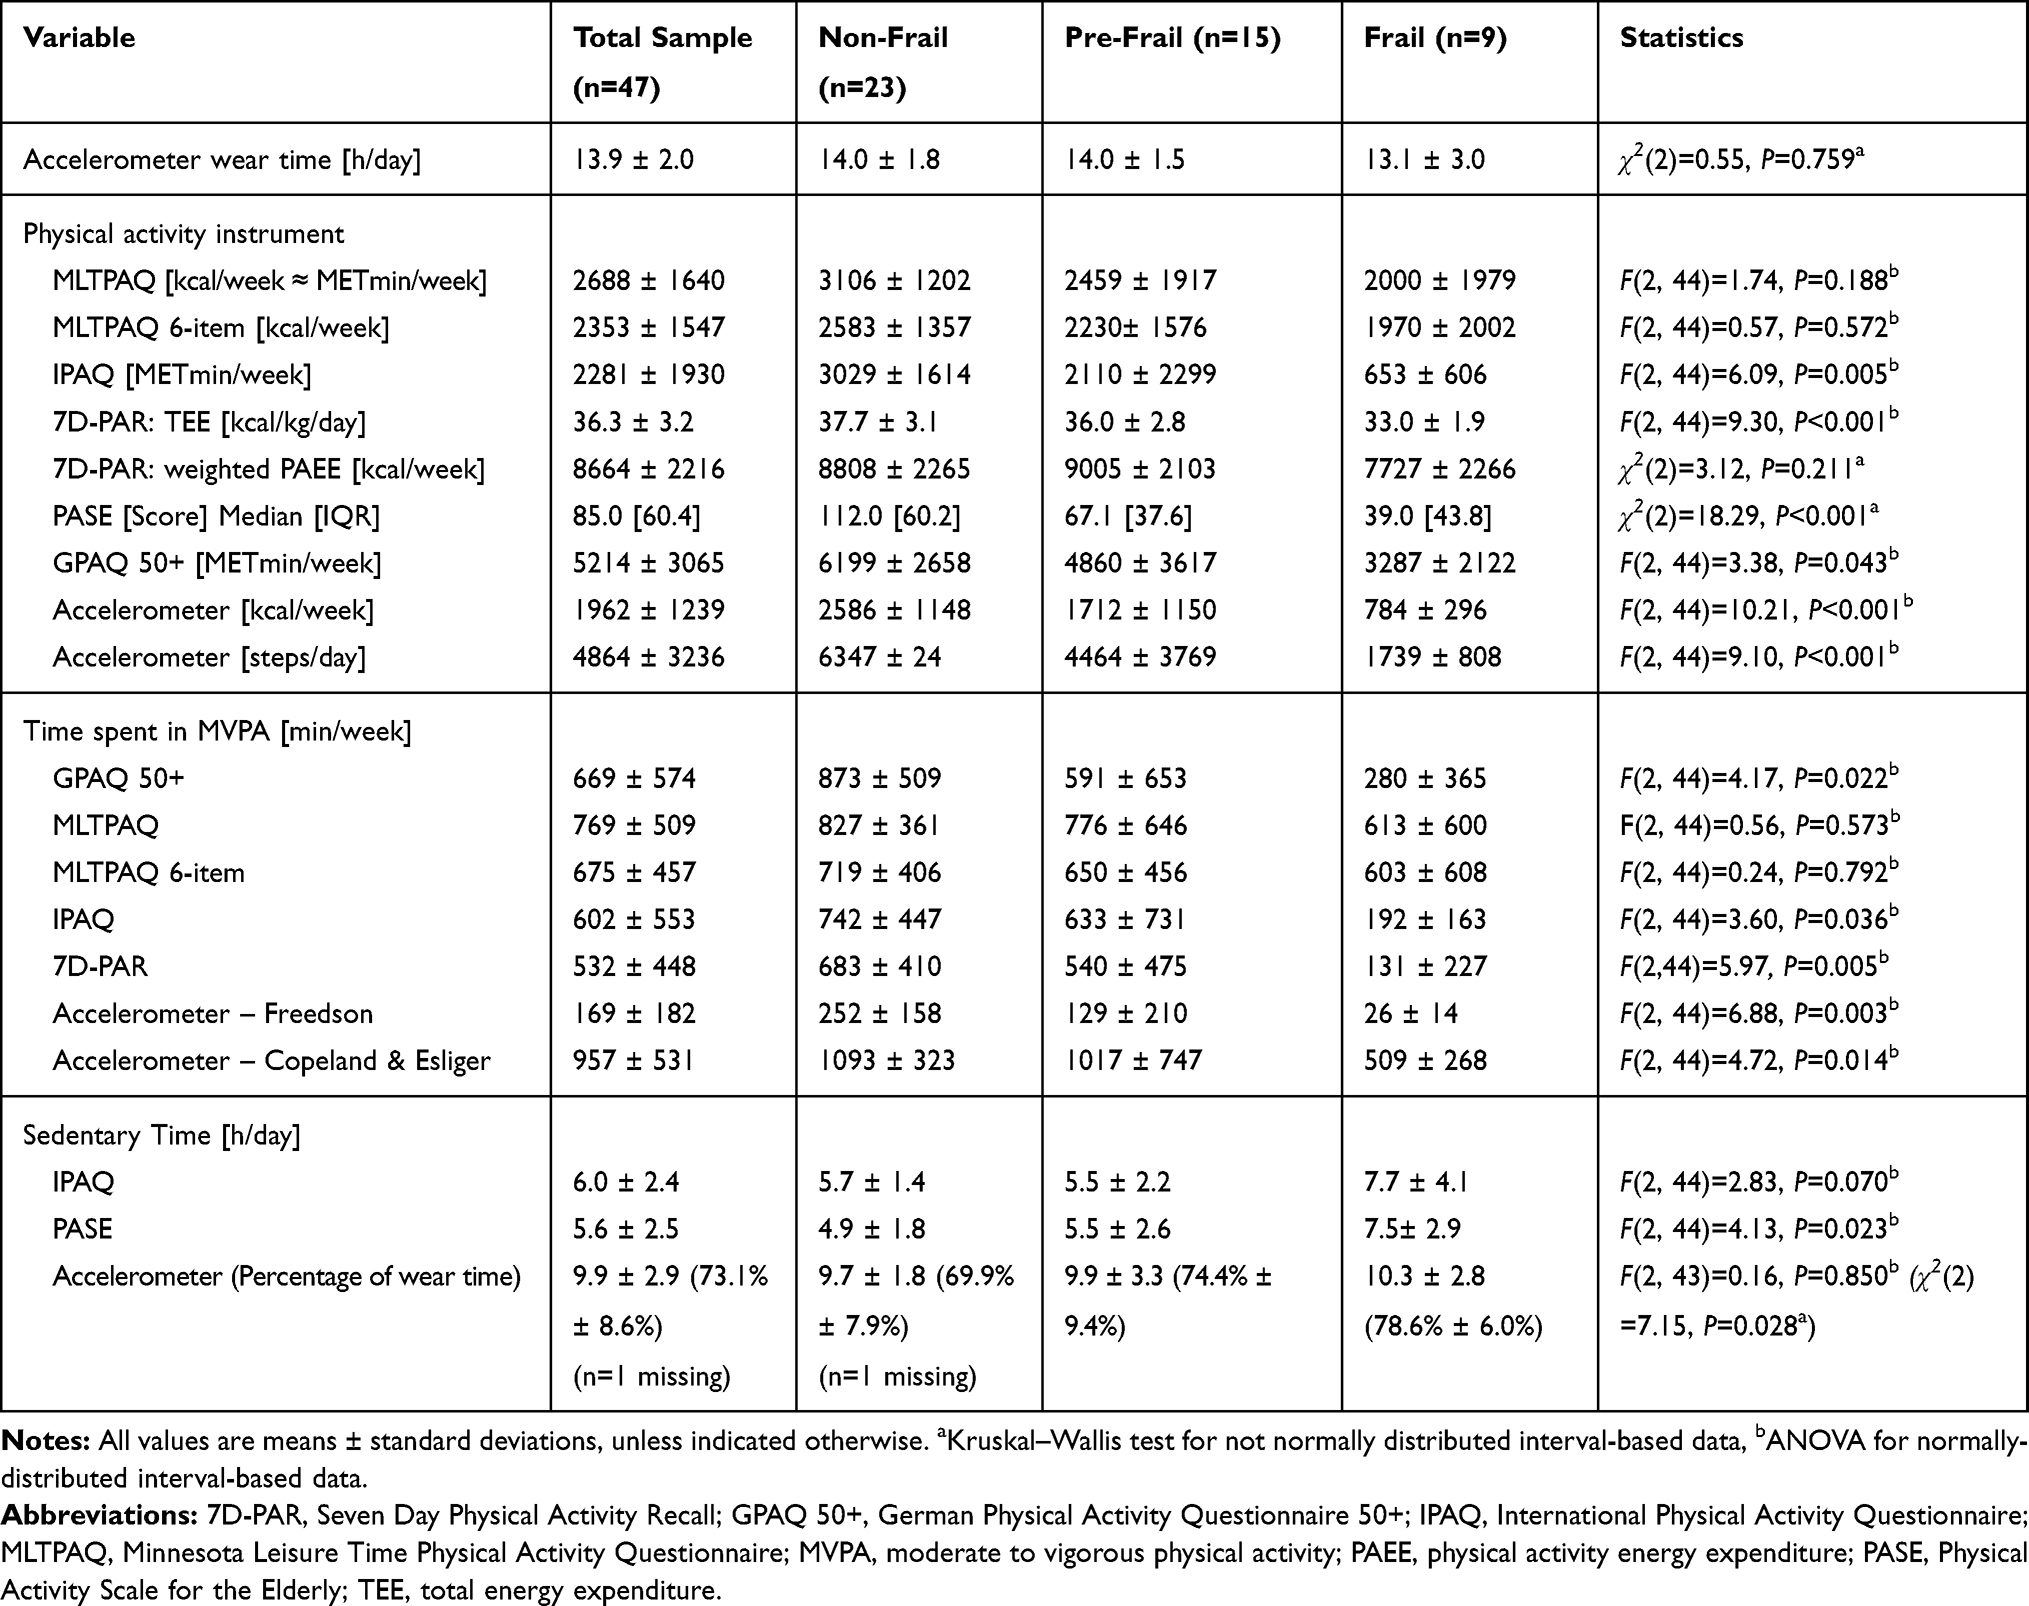 |
Table 3 Physical Activity Data for the Total Study Sample and for Subgroups of the Primary Phenotype |
Frailty Phenotype Prevalence According to the Assessment and Definition of the LPA Criterion
Depending on the assessment and definition of LPA, frailty prevalence varied between 14.9% (n=7, 95% CI: 7.4% to 27.7%) and 31.9% (n=15, 95% CI: 20.4% to 46.2%) (Figure 2). As seen in Table 4, between 27.7% (n=13, 95% CI: 16.9% to 41.8%) and 66.0% (n=31, 95% CI: 51.7% to 77.8%) of participants were classified as pre-frail. Overall, using different LPA criteria resulted in a variation of 17.0 percentage points. Using only published phenotype models, the variation was still 12.8 percentage points, which corresponds to more than half of the pre-defined value of 17.7 percentage points.
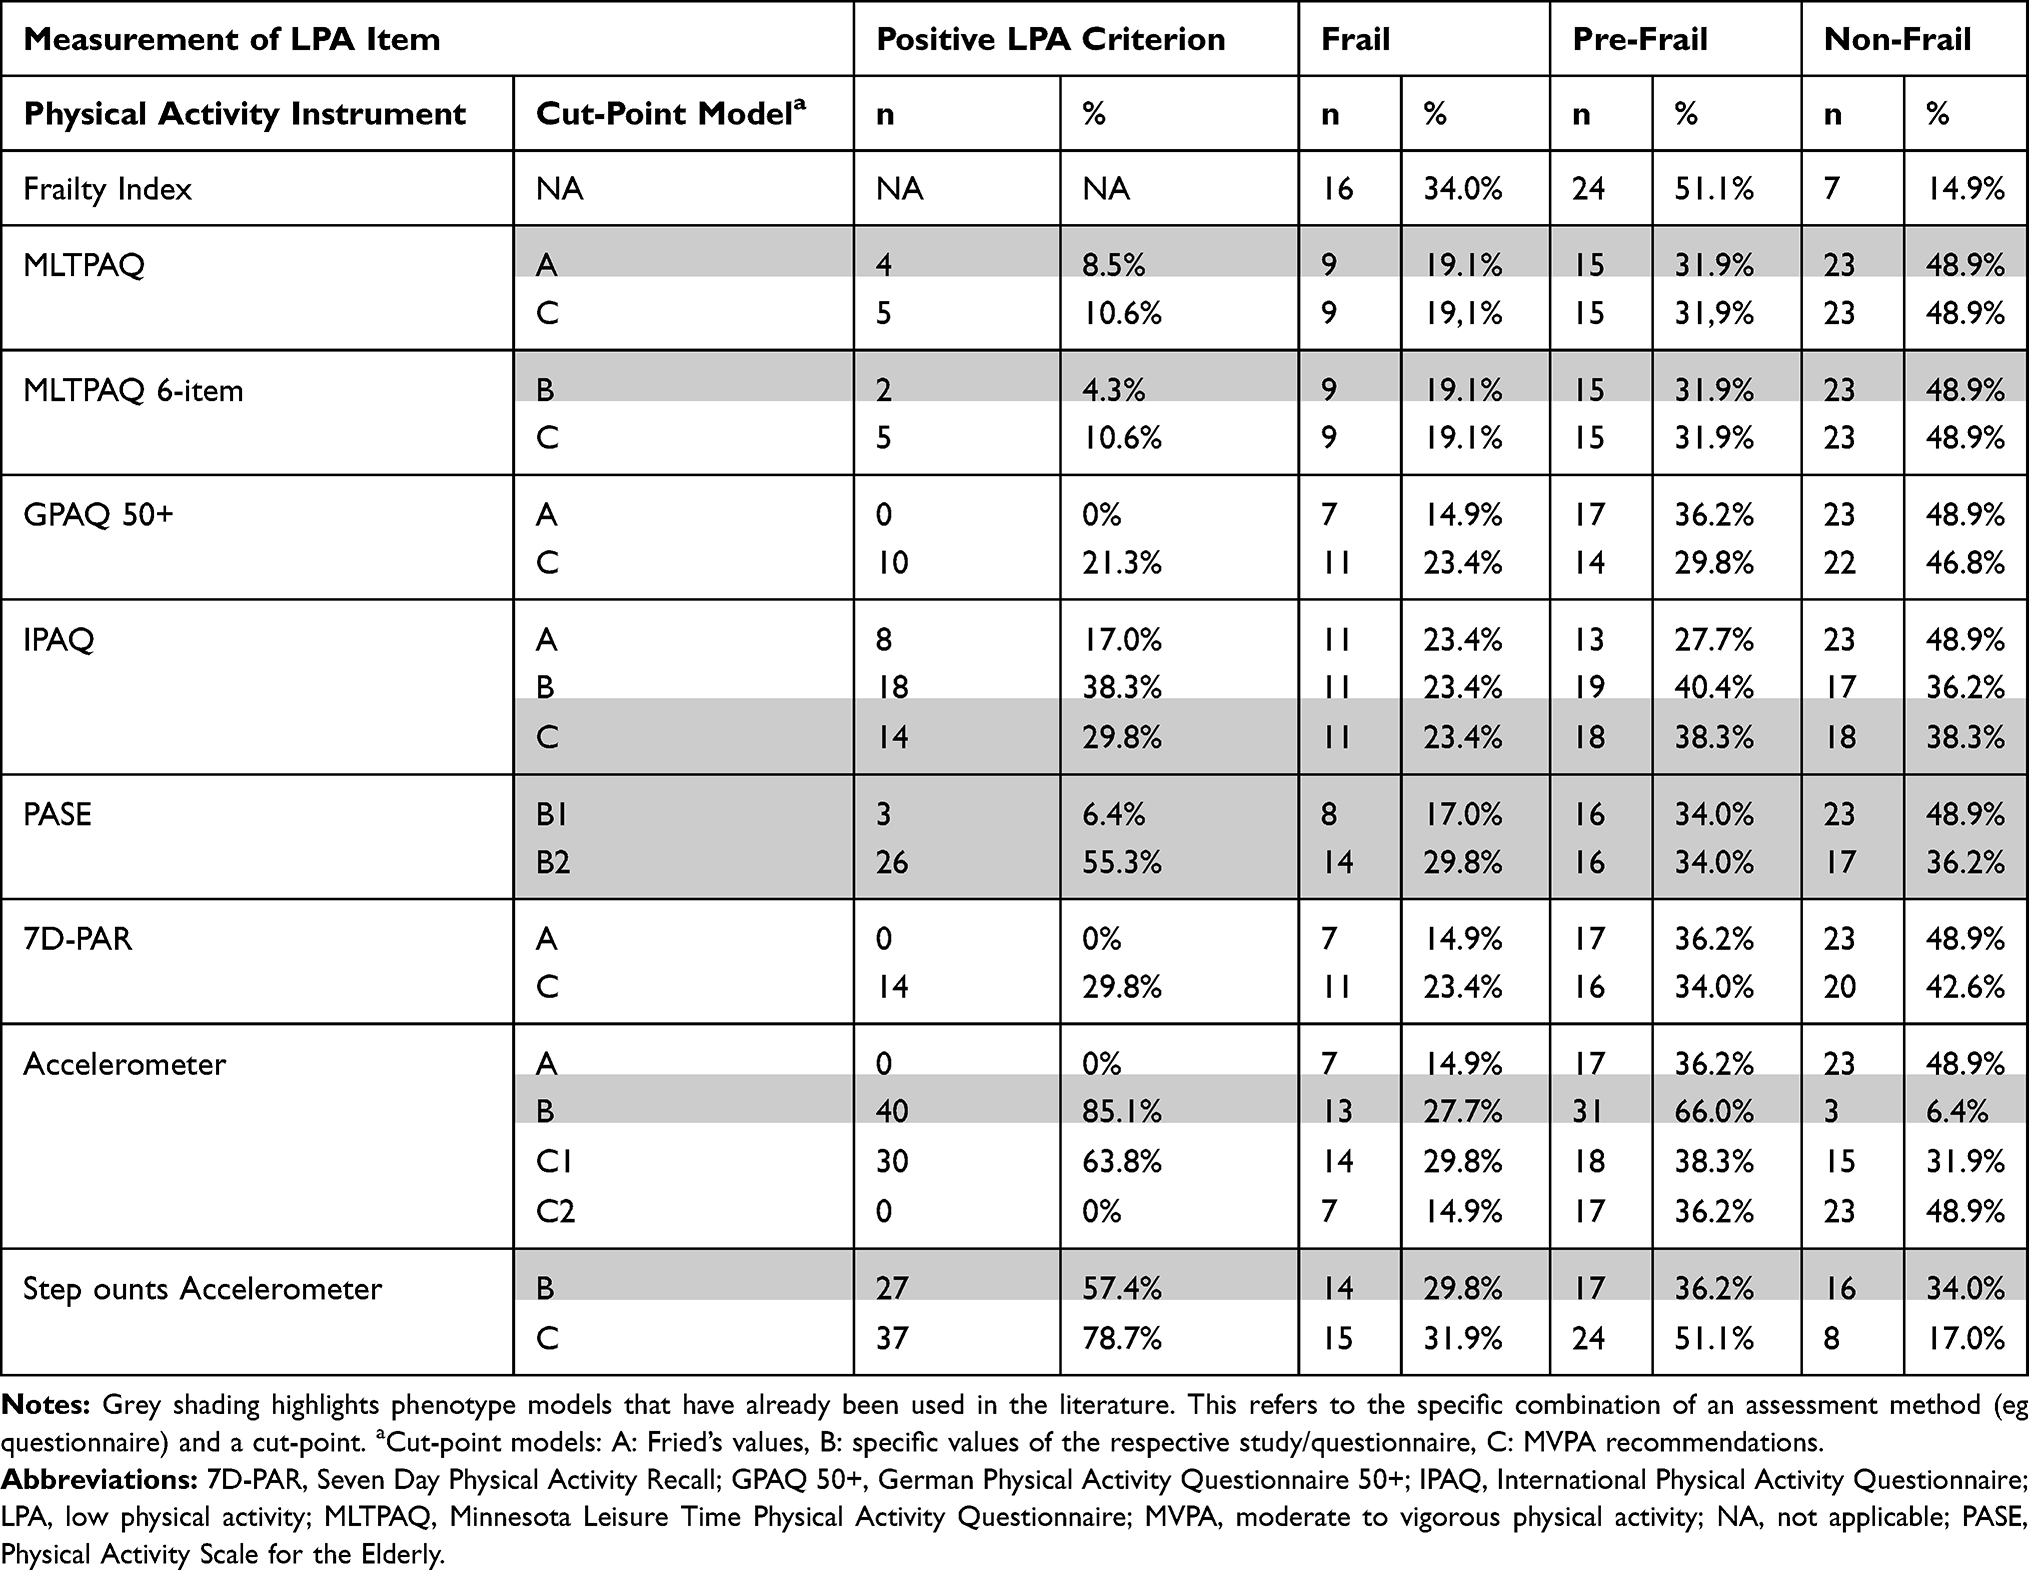 |
Table 4 Frailty Phenotype Prevalence According to the Assessment and Definition of Low Physical Activity |
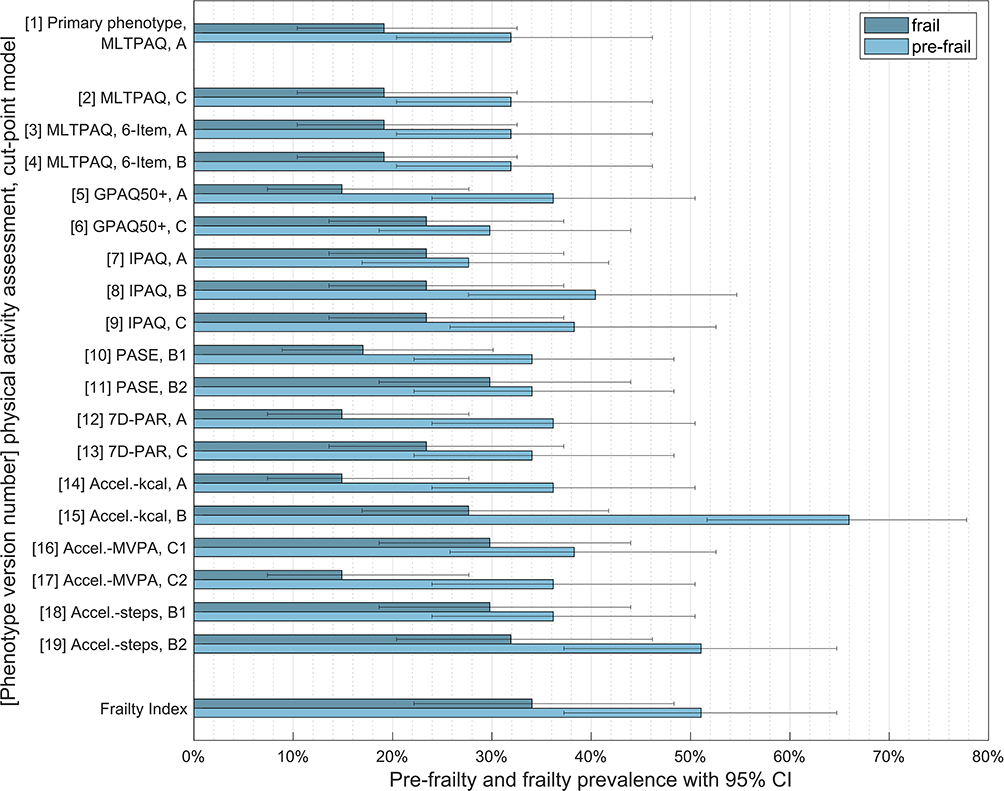 |
Figure 2 Frailty prevalence according to the assessment and definition of the low physical activity criterion. Notes: Cut-point models: (A): Fried’s values. (B): specific values. (C): MVPA recommendation. Abbreviations: Accel, Accelerometer; CI, confidence interval; GPAQ 50+, German Physical Activity Questionnaire 50+; IPAQ, International Physical Activity Questionnaire; MLTPAQ, Minnesota Leisure Time Physical Activity Questionnaire; MVPA, moderate to vigorous physical activity; PASE, Physical Activity Scale for the Elderly; 7D-PAR, Seven Day Physical Activity Recall. |
The highest frailty prevalence occurred when the LPA criterion was based on accelerometer measurements combined with the MVPA recommendations for steps. Using the GPAQ 50+ with Fried cut-points,7 the 7D-PAR with Fried cut-points or an accelerometer with the Copeland and Esliger28 algorithm to define MVPA resulted in the lowest prevalence, with every single participant being sufficiently physically active.
Besides LPA, the most frequent positive criterion of the FP was slow gait speed (n=16, 34%), followed by exhaustion (n=15, 32%) and weakness (n=13, 28%). Unintended weight loss was rarely observed (n=3, 6%). As stated in Table 5, approximately 50% of the participants showed no sign of physical frailty.
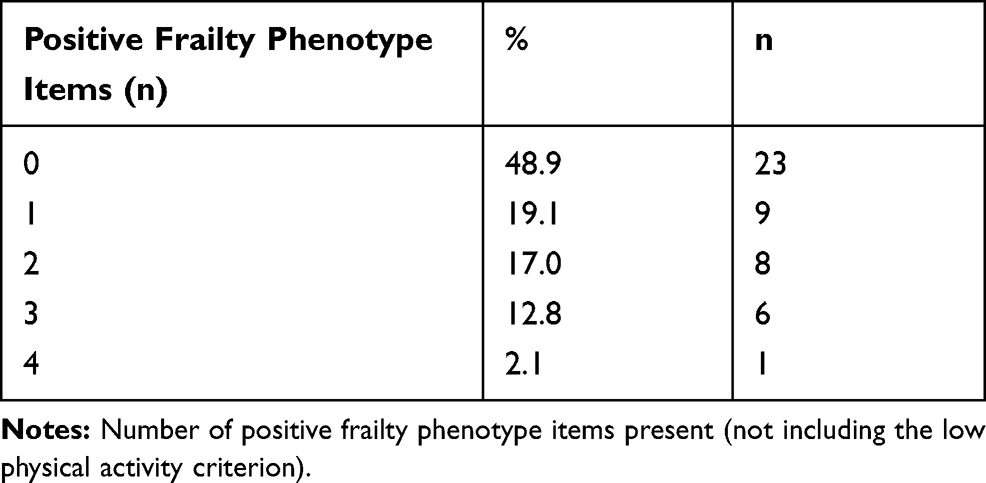 |
Table 5 Analysis of Positive Items of the Frailty Phenotype |
Discussion
The aim of this study was to analyze the influence of the assessment and definition of LPA on the prevalence of the FP in community-dwelling older adults.
Modifying the LPA criterion of the FP in the same sample resulted in a variation of FP prevalence ranging from 14.9% to 31.9%. For those phenotype versions with exactly the same LPA criterions used in previous publications, such as the PASE phenotype versions,22–24 the prevalence still varied by 12.8 percentage points. This variation corresponds to more than half of the 17.7 percentage points reported in recently published reviews.2,8
According to these results, the choice of PA assessment and cut-point for low activity does indeed have a considerable impact on the occurrence of physical frailty. Thus, differences in published prevalence values may only partly reflect true differences within or between populations. This should be carefully considered when comparing prevalence data, drawing conclusions from published studies, and planning future studies.
Our results support the findings of Theou et al,3 who have concluded that in general, modifications of the FP result in substantial differences in physical frailty prevalence, predictive mortality and internal consistency of the assessment. In a retrospective analysis, they created 262 different phenotypes and reported FP prevalence estimations ranging from 12.7% to 28.2%.3 The corresponding range of 15.5 percentage points is comparable to the 17.0 percentage points found in our study.
After data collection for our study, a meta-analysis was published, which found an even higher variance of prevalence (range from 8.6% to 50.9%) based on the Fried definition in Mexican older adults.46
Frailty Prevalence
Twenty-nine participants (58%) were recruited from a study sample where the FP prevalence was 17.8% (95% CI: 13.2% to 22.5%),13 which is only slightly lower than in the present study. Therefore, we assume that the sample was sufficiently representative of the population included in the primary study A.
In the population of the CHS, 6.9% of the older adults were classified as frail,7 which is less than in our study. Older adults with a prescription for physiotherapy usually have medical conditions and may show physical impairments and disability more frequently, explaining the higher frailty prevalence in our study. A relationship between activities of daily living, disability and frailty has been reported.22
Compared to the physical FP versions, the FI based prevalence estimation (34% frail, 51% pre-frail) was higher than generally reported in the literature.2 It is important to note that the FP and the FI are not alternatives but complementary and have different purposes in the clinical setting.47 The FI was not originally designed to be categorized, as it describes a fitness-frailty-continuum.32
Cut-Point Models
According to our results, the choice of cut-point values seems to have a major influence on the variability of frailty prevalence. The cut-point model A – the values proposed by Fried and colleagues7 – may produce a very low prevalence of positive LPA criteria. Applying model A on the GPAQ 50+ or the 7D-PAR, no participant showed a positive LPA criterion. These differences, possibly due to variations in the scope and number of activities included in these questionnaires, should be carefully considered.
Other studies have used population-dependent approaches for defining cut-point values for the LPA criterion, mostly referring to a specific population. Related to our second cut-point approach (model B: cut-point values recommended for a specific population), the difference between our sample population (85.5% positive LPA criterion) and participants who showed a positive LPA criterion in a study by Chen et al26 (19.5%) is particularly striking. Thus, we recommend defining a large population in which the same cut-point can be used, instead of several specific cut-points for a number of small populations. This may also be more feasible in clinical care and may ease comparisons between studies.
We also included public health recommendations for MVPA to define the LPA criterion (model C),18 even though these are under debate and may be too ambitious for older adults.48 Here, participants showed comparable levels of LPA (between 500 and 700 min/week) irrespective of the PA questionnaire used, but varying levels of LPA when accelerometers were used. This is in line with a review on older adults meeting PA recommendations, which showed a range from 2% to 83%.49
Assessing PA
Using questionnaires to assess PA in older adults remains challenging with respect to psychometric properties, context specificity, recall or observation time, suitability for cognitively impaired individuals, and the domains to be included.50 In all models, except for the MLTPAQ, we found that individuals classified as frail showed significantly less PA compared to those classified as non-frail. This might indicate that the MLTPAQ might not be very well applicable for older adults.
We also assessed PA by accelerometry. There is some evidence that accelerometer data have the strongest association with frailty.12 Although accelerometers showed far better results in validation studies compared to PA questionnaires in terms of correlation to the doubly labeled water method (eg Colbert et al51), outcomes rely a lot on the investigator’s choice of cut-points.52 In our sample, 150 min MVPA per week (as recommended by the WHO) were hardly surpassed when using the Freedson27 model, whereas every single participant fulfilled the WHO recommendation if the model proposed by Copeland and Esliger28 was used. A possible explanation for this might be the different definitions of MVPA during walking (Freedson:27 4.0 km/h, Copeland and Esliger:28 3.2 km/h).
To investigate daily steps of older adults in clinical practice, a single pedometer or smartphone might be a practical choice. However, the problem of defining appropriate cut-points for a step remains. Older adults may present gait patterns and biomechanics different from younger adults.
Sedentary time was found to be correlated with physical frailty and might be an independent risk factor.53 Other studies stress the importance of sedentary time in terms of frailty levels.54 Participants in the present study were sedentary for 9.9 ± 2.9 hours per day, which corresponds to 73% of wear time. The more time participants spent in sedentary levels relative to their wear time, the frailer they were. The values are in accordance with data from a huge cohort of the Osteoarthritis Initiative, where older adults spent 9.9 hours per day (or 66% of waking time) being sedentary.53
Limitations
To our knowledge, this is the first study to analyze the impact of modifying the LPA criterion in the FP. However, there are several limitations.
The total number of participants with valid data (n=47) was relatively small and no formal sample size calculation was performed. However, this is a methodological rather than a prevalence study, and the considerable magnitude of the resulting confidence intervals takes the small sample size into account.44
The recruitment process itself might have induced bias as we struggled to find enough participants for the study. The population of the present study does not represent a random and representative sample of older community-dwelling adults living in an urban region in Germany.
Using an established assessment of cognitive status instead of subjective ratings could have resulted in a slightly different composition of our sample. For some participants, it may have been difficult to concentrate throughout all the study assessments. We attempted to minimize the question-order bias by selecting a random order in asking PA questionnaires.
The selection of PA questionnaires and the corresponding cut-points emerged from a non-systematic literature research on studies using the FP up to 2015 and underlying criteria such as the availability of a German language version. A systematic review would have produced a more representative sample of measurement instruments. Therefore, our findings can be generalized to a limited extent only.
Perspectives
The calculation of correction factors between commonly used LPA criteria sets might allow a better comparison of published prevalence rates. However, this would require setting up a study in which various methods of PA assessment and different cut-points are applied in a very large and diverse sample.
Despite the diagnostic limitations, it is very important to detect frailty in older adults, as it is associated with various negative health outcomes.1 In future studies we should endeavor to measure physical frailty with standardized, reliable and valid methods.
Consumer wearables may increasingly become a good option to assess the PA level in an accurate way for use in the FP. Combining measurements of accelerometry, heart rate and location (GPS), as has been done in Theou et al,12 promises to improve the validity of PA measurements as one criterion for physical frailty.
Conclusion
Our results indicate that the method of PA assessment and the choice of cut-point values for LPA impacts the prevalence of physical frailty quite considerably. Thus, the interpretation and comparison of published physical frailty prevalence data needs to be done with more caution, and more effort to standardize and adhere to the LPA criterion seems warranted. Developing correction formulas and standardized assessment methods (including cut-point values) for clearly defined populations (eg age categories) and contexts could help to ensure and improve internal validity of the assessment and enable better interstudy comparison. This would be an important prerequisite for a more frequent use of the FP in both research and clinical settings.
Abbreviations
CHS, Cardiovascular Health Study; cpm, counts per minute; FI, Frailty Index; FP, frailty phenotype; GPAQ 50+, German Physical Activity Questionnaire 50+; IPAQ, International Physical Activity Questionnaire; LPA, low physical activity; MLTPAQ, Minnesota Leisure Time Physical Activity 510 Questionnaire; MVPA, moderate to vigorous physical activity; PA, physical activity; PAEE, physical activity energy expenditure; PASE, Physical Activity Scale for the Elderly; RMR, resting metabolic rate; TEE, total energy expenditure; WHO, World Health Organization; 7D-PAR, Seven Day Physical Activity Recall.
Ethics Approval and Informed Consent
Approval was obtained from the Ethical Review Board of the German Confederation for Physiotherapy (registration number: 2015-07). This study was conducted in accordance with the Declaration of Helsinki in its recent version (64th WMA General Assembly, Fortaleza, Brazil, October 2013). All participants provided written informed consent for study participation.
Data Sharing Statement
Data can be obtained from the corresponding author upon reasonable request.
Acknowledgments
We would like to thank the research team involved in the data collection process: Carolin Bahns, Theresa Retzmann, Lisa Happe, Julia Rasche and Svenja Hansen.
Author Contributions
All authors contributed to data analysis, drafting or revising the article, gave final approval of the version to be published, and agree to be accountable for all aspects of the work.
Funding
This research was funded by an intramural grant from the Hochschule für Gesundheit Bochum (University of Applied Sciences). We did not receive any specific grant from funding agencies in the public, commercial, or not-for-profit sectors. The funding body had no role in study design, data collection and analysis, decision to publish, or preparation of the manuscript.
Disclosure
The authors declare that there are no conflicts of interest in this work.
References
1. Vermeiren S,Vella-Azzopardi R,Beckwee D,et al. Frailty and the prediction of negative health outcomes: a meta-analysis. J Am Med Dir Assoc. 2016;17(12):
2. Collard RM, Boter H, Schoevers RA, Oude Voshaar RC. Prevalence of frailty in community-dwelling older persons: a systematic review. J Am Geriatr Soc. 2012;60(8):1487–1492. doi:10.1111/j.1532-5415.2012.04054.x
3. Theou O, Cann L, Blodgett J, Wallace LM, Brothers TD, Rockwood K. Modifications to the frailty phenotype criteria: systematic review of the current literature and investigation of 262 frailty phenotypes in the Survey of Health, Ageing, and Retirement in Europe. Ageing Res Rev. 2015;21:78–94. doi:10.1016/j.arr.2015.04.001
4. Apostolo J, Cooke R, Bobrowicz-Campos E, et al. Predicting risk and outcomes for frail older adults: an umbrella review of frailty screening tools. JBI Database System Rev Implement Rep. 2017;15(4):1154–1208. doi:10.11124/JBISRIR-2016-003018
5. de Vries NM, Staal JB, van Ravensberg CD, Hobbelen JS, Olde Rikkert MG, Nijhuis-van der Sanden MW. Outcome instruments to measure frailty: a systematic review. Ageing Res Rev. 2011;10(1):104–114. doi:10.1016/j.arr.2010.09.001
6. Mitnitski AB, Mogilner AJ, Rockwood K. Accumulation of deficits as a proxy measure of aging. Sci World J. 2001;1:323–336. doi:10.1100/tsw.2001.58
7. Fried LP, Tangen CM, Walston J, et al. Frailty in older adults: evidence for a phenotype. J Gerontol a Biol Sci Med Sci. 2001;56(3):M146–M156. doi:10.1093/gerona/56.3.M146
8. Choi J, Ahn A, Kim S, Won CW. Global prevalence of physical frailty by fried’s criteria in community-dwelling elderly with national population-based surveys. J Am Med Dir Assoc. 2015;16(7):548–550. doi:10.1016/j.jamda.2015.02.004
9. Chang SF, Lin PL. Frail phenotype and mortality prediction: a systematic review and meta-analysis of prospective cohort studies. Int J Psychiatr Nurs Res. 2015;52(8):1362–1374.
10. Taylor HL, Jacobs DR
11. Jorstad-Stein EC, Hauer K, Becker C, et al. Suitability of physical activity questionnaires for older adults in fall-prevention trials: a systematic review. J Aging Phys Act. 2005;13(4):461–481. doi:10.1123/japa.13.4.461
12. Theou O, Jakobi JM, Vandervoort AA, Jones GR. A comparison of physical activity (PA) assessment tools across levels of frailty. Arch Gerontol Geriatr. 2012;54(3):e307–e314. doi:10.1016/j.archger.2011.12.005
13. Braun T, Thiel C, Ziller C, et al. Prevalence of frailty in older adults in outpatient physiotherapy in an urban region in the western part of Germany: a cross-sectional study. BMJ Open. 2019;9(6):e027768. doi:10.1136/bmjopen-2018-027768
14. Thiel C, Braun T, Grüneberg C. Körperliches Training als Kernkomponente multimodaler Behandlung älterer Menschen mit Frailty – Studienprotokoll einer randomisierten kontrollierten Pilotstudie. Z Gerontol Geriat. 2018;52:45–60.
15. von Elm E, Altman DG, Egger M, Pocock SJ, Gotzsche PC, Vandenbroucke JP. The Strengthening the Reporting of Observational Studies in Epidemiology (STROBE) statement: guidelines for reporting observational studies. J Clin Epidemiol. 2008;61(4):344–349. doi:10.1016/j.jclinepi.2007.11.008
16. Braun T, Thiel C, Schulz R, Grüneberg C. Diagnostik und Behandlung physischer Frailty. Dtsch Med Wochenschr. 2017;142(02):117–122. doi:10.1055/s-0042-101631
17. Roberts HC, Denison HJ, Martin HJ, et al. A review of the measurement of grip strength in clinical and epidemiological studies: towards a standardised approach. Age Ageing. 2011;40(4):423–429. doi:10.1093/ageing/afr051
18. Global Recommendations on Physical Activity for Health. Geneva: World Health Organization; 2010. Available from: https://www.ncbi.nlm.nih.gov/books/NBK305057/.
19. Eckel SP, Bandeen-Roche K, Chaves PH, Fried LP, Louis TA. Surrogate screening models for the low physical activity criterion of frailty. Aging Clin Exp Res. 2011;23(3):209–216. doi:10.1007/BF03324962
20. IPAQ Research Committee. Guidelines for data processing and analysis of the international physical activity questionnaire (IPAQ) - short and long forms. 2005. Available from: https://sites.google.com/site/theipaq/scoring-protocol.
21. Reis Júnior WM, Carneiro JAO, Coqueiro R, Santos KT, Fernandes MH. Pre-frailty and frailty of elderly residents in a municipality with a low Human Development Index. Rev Lat Am Enfermagem. 2014;22(4):654–661. doi:10.1590/0104-1169.3538.2464
22. Al Snih S, Graham JE, Ray LA, Samper-Ternent R, Markides KS, Ottenbacher KJ. Frailty and incidence of activities of daily living disability among older mexican americans. J Rehabil Med. 2009;41(11):892–897. doi:10.2340/16501977-0424
23. Graham JE, Snih S, Berges IM, Ray LA, Markides KS, Ottenbacher KJ. Frailty and 10-year mortality in community-living Mexican American older adults. Gerontology. 2009;55(6):644–651. doi:10.1159/000235653
24. Cawthon PM, Ensrud KE, Laughlin GA, et al. Sex hormones and frailty in older men: the osteoporotic fractures in men (MrOS) study. J Clin Endocrinol Metab. 2009;94(10):3806–3815. doi:10.1210/jc.2009-0417
25. Wu I-C, Lin X-Z, Liu P-F, Tsai W-L, Shiesh S-C. Low serum testosterone and frailty in older men and women. Maturitas. 2010;67(4):348–352. doi:10.1016/j.maturitas.2010.07.010
26. Chen S, Honda T, Chen T, et al. Screening for frailty phenotype with objectively-measured physical activity in a west Japanese suburban community: evidence from the Sasaguri Genkimon Study. BMC Geriatr. 2015;15:36. doi:10.1186/s12877-015-0037-9
27. Freedson PS, Melanson E, Sirard J. Calibration of the computer science and applications, Inc. accelerometer. Med Sci Sports Exerc. 1998;30(5):777–781. doi:10.1097/00005768-199805000-00021
28. Copeland JL, Esliger DW. Accelerometer assessment of physical activity in active, healthy older adults. J Aging Phys Act. 2009;17(1):17–30. doi:10.1123/japa.17.1.17
29. Bastiaanse LP, Hilgenkamp TI, Echteld MA, Evenhuis HM. Prevalence and associated factors of sarcopenia in older adults with intellectual disabilities. Res Dev Disabil. 2012;33(6):2004–2012. doi:10.1016/j.ridd.2012.06.002
30. Tudor-Locke C, Craig CL, Aoyagi Y, et al. How many steps/day are enough? For older adults and special populations. Int J Behav Nutr Phys Act. 2011;8:80. doi:10.1186/1479-5868-8-80
31. Searle SD, Mitnitski A, Gahbauer EA, Gill TM, Rockwood K. A standard procedure for creating a frailty index. BMC Geriatr. 2008;8:24. doi:10.1186/1471-2318-8-24
32. Rockwood K, Andrew M, Mitnitski A. A comparison of two approaches to measuring frailty in elderly people. J Gerontol a Biol Sci Med Sci. 2007;62(7):738–743. doi:10.1093/gerona/62.7.738
33. Huy C, Schneider S. Instrument für die Erfassung der physischen Aktivität bei Personen im mittleren und höheren Erwachsenenalter. Z Gerontol Geriat. 2008;41(3):208–216. doi:10.1007/s00391-007-0474-y
34. Craig CL, Marshall AL, Sjostrom M, et al. International physical activity questionnaire: 12-country reliability and validity. Med Sci Sports Exerc. 2003;35(8):1381–1395. doi:10.1249/01.MSS.0000078924.61453.FB
35. Sallis JF, Buono MJ, Roby JJ, Micale FG, Nelson JA. Seven-day recall and other physical activity self-reports in children and adolescents. Med Sci Sports Exerc. 1993;25(1):99–108. doi:10.1249/00005768-199301000-00014
36. Märki A. Entwicklung und Evaluation eines Beratungsinstrumentes zur Förderung der körperlichen Aktivität bei älteren Menschen unter Brücksichtigung des Transtheoretischen Modells der Verhaltensänderung [dissertation]. Zürich: Philosophisch-Historische Fakultät, Universität Basel; 2004.
37. Washburn RA, Smith KW, Jette AM, Janney CA. The Physical Activity Scale for the Elderly (PASE): development and evaluation. J Clin Epidemiol. 1993;46(2):153–162. doi:10.1016/0895-4356(93)90053-4
38. Calabro MA, Kim Y, Franke WD, Stewart JM, Welk GJ. Objective and subjective measurement of energy expenditure in older adults: a doubly labeled water study. Eur J Clin Nutr. 2015;69(7):850–855. doi:10.1038/ejcn.2014.241
39. Mifflin MD, St Jeor ST, Hill LA, Scott BJ, Daugherty SA, Koh YO. A new predictive equation for resting energy expenditure in healthy individuals. Am J Clin Nutr. 1990;51(2):241–247. doi:10.1093/ajcn/51.2.241
40. Thiel C, Gabrys L, Vogt L. Registrierung körperlicher Aktivität mit tragbaren Akzelerometern. Dtsch Z Sportmed. 2016;67(2):44–48. doi:10.5960/dzsm.2016.220
41. Choi L, Liu Z, Matthews CE, Buchowski MS. Validation of accelerometer wear and nonwear time classification algorithm. Med Sci Sports Exerc. 2011;43(2):357–364. doi:10.1249/MSS.0b013e3181ed61a3
42. Hagstromer M, Oja P, Sjostrom M. Physical activity and inactivity in an adult population assessed by accelerometry. Med Sci Sports Exerc. 2007;39(9):1502–1508. doi:10.1249/mss.0b013e3180a76de5
43. Nelson ME, Rejeski WJ, Blair SN, et al. Physical activity and public health in older adults: recommendation from the American College of Sports Medicine and the American Heart Association. Med Sci Sports Exerc. 2007;39(8):1435–1445. doi:10.1249/mss.0b013e3180616aa2
44. Terwee CB, Mokkink LB, Knol DL, Ostelo RW, Bouter LM, de Vet HC. Rating the methodological quality in systematic reviews of studies on measurement properties: a scoring system for the COSMIN checklist. Qual Life Res. 2012;21(4):651–657. doi:10.1007/s11136-011-9960-1
45. Bland JM, Altman DG. Statistical methods for assessing agreement between two methods of clinical measurement. Lancet. 1986;1(8476):307–310. doi:10.1016/S0140-6736(86)90837-8
46. Jocabed Rocha-Balcázar L, Cortés Sarmiento D, Castellanos Perilla N, Núñez-Aguirre S, Salinas-Martínez R, Perez-Zepeda M. Systematic review and meta-analysis of frailty prevalence in Mexican older adults. J Lat Am Geriatric Med. 2018;4:44–49.
47. Cesari M, Gambassi G, van Kan GA, Vellas B. The frailty phenotype and the frailty index: different instruments for different purposes. Age Ageing. 2014;43(1):10–12. doi:10.1093/ageing/aft160
48. Warburton DE, Bredin SS. Reflections on physical activity and health: what should we recommend? Can J Cardiol. 2016;32(4):495–504. doi:10.1016/j.cjca.2016.01.024
49. Sun F, Norman IJ, While AE. Physical activity in older people: a systematic review. BMC Public Health. 2013;13(1):449. doi:10.1186/1471-2458-13-449
50. van Poppel MM, Chinapaw MM, Mokkink L, van Mechelen W, Terwee C. Physical activity questionnaires for adults. Sports Med. 2010;40(7):565–600. doi:10.2165/11531930-000000000-00000
51. Colbert LH, Matthews CE, Havighurst TC, Kim K, Schoeller DA. Comparative validity of physical activity measures in older adults. Med Sci Sports Exerc. 2011;43(5):867–876. doi:10.1249/MSS.0b013e3181fc7162
52. Pedisic Z, Bauman A. Accelerometer-based measures in physical activity surveillance: current practices and issues. Br J Sports Med. 2015;49(4):219–223. doi:10.1136/bjsports-2013-093407
53. Song J, Lindquist LA, Chang RW, et al. Sedentary behavior as a risk factor for physical frailty independent of moderate activity: results from the osteoarthritis initiative. Am J Public Health. 2015;105(7):1439–1445. doi:10.2105/AJPH.2014.302540
54. Blodgett J, Theou O, Kirkland S, Andreou P, Rockwood K. Frailty in NHANES: comparing the frailty index and phenotype. Arch Gerontol Geriatr. 2015;60(3):464–470. doi:10.1016/j.archger.2015.01.016
 © 2020 The Author(s). This work is published and licensed by Dove Medical Press Limited. The full terms of this license are available at https://www.dovepress.com/terms.php and incorporate the Creative Commons Attribution - Non Commercial (unported, v3.0) License.
By accessing the work you hereby accept the Terms. Non-commercial uses of the work are permitted without any further permission from Dove Medical Press Limited, provided the work is properly attributed. For permission for commercial use of this work, please see paragraphs 4.2 and 5 of our Terms.
© 2020 The Author(s). This work is published and licensed by Dove Medical Press Limited. The full terms of this license are available at https://www.dovepress.com/terms.php and incorporate the Creative Commons Attribution - Non Commercial (unported, v3.0) License.
By accessing the work you hereby accept the Terms. Non-commercial uses of the work are permitted without any further permission from Dove Medical Press Limited, provided the work is properly attributed. For permission for commercial use of this work, please see paragraphs 4.2 and 5 of our Terms.