")
Back to Journals » International Journal of General Medicine » Volume 15
FOXO4 May Be a Biomarker of Postmenopausal Osteoporosis
Authors Yang W, He Q, Hu Z, Xie X
Received 9 November 2021
Accepted for publication 6 January 2022
Published 20 January 2022 Volume 2022:15 Pages 749—762
DOI https://doi.org/10.2147/IJGM.S347416
Checked for plagiarism Yes
Review by Single anonymous peer review
Peer reviewer comments 3
Editor who approved publication: Dr Scott Fraser
Weiwei Yang,1,* Qing He,2,* Zhaohui Hu,3 Xiangtao Xie2,4
1Department of Gynecology, The Fourth Affiliated Hospital of Guangxi Medical University, Liuzhou, Guangxi, 545005, People’s Republic of China; 2Department of Orthopedics, The Fourth Affiliated Hospital of Guangxi Medical University, Liuzhou, Guangxi, 545005, People’s Republic of China; 3Department of Orthopedics, Liuzhou People’s Hospital, Liuzhou, Guangxi, 545005, People’s Republic of China; 4Department of Orthopedics, Liuzhou Worker’s Hospital, Liuzhou, Guangxi, 545005, People’s Republic of China
*These authors contributed equally to this work
Correspondence: Zhaohui Hu, Liuzhou People’s Hospital, No. 8 Wenchang Road, Liuzhou, Guangxi, 545006, People’s Republic of China, Tel/Fax +867722662676, Email [email protected]; Xiangtao Xie, The Fourth Affiliated Hospital of Guangxi Medical University, No. 156 Heping Road, Liuzhou, Guangxi, 545027, People’s Republic of China, Tel +867723832719, Email [email protected]
Purpose: Postmenopausal osteoporosis (PMOP) is a common and debilitating chronic disease, but it has just no cure options. The objective of this study was to identify genes associated with osteoporosis and reveal potential therapeutic targets.
Methods: Expression profiles from GSE13850 and GSE56815 datasets were combined for differential expression analysis. Extraction of intersecting genes from the combined datasets and the differentially expressed genes in GSE56814 were performed to construct a multi-scale embedded gene co-expression network analysis (MEGENA) to obtain module genes. Module genes with an area under the receiver operating characteristic curve (AUC) > 0.60 were chosen to construct the least absolute shrinkage and selection operator (LASSO) model to obtain feature genes. A regulated network was constructed using differentially expressed micro-RNAs (miRNAs) in GSE74209 and feature genes. Finally, key genetic pathways and pathways of the Kyoto Encyclopedia of Genes and Genomes were identified and explored.
Results: The commonly identified differentially expressed genes involve oxidative phosphorylation and caffeine metabolism. We identified 66 modules with 2354 module genes based on MEGENA. CARD8, FOXO4, IL1R2, MPHOSPH6, MPRIP, MYOM1, PRR5L and YIPF4 were identified as feature genes by the LASSO model. Furthermore, predicted miRNA target genes included 8 genes associated with PMOP. The largest AUC was observed for FOXO4, which was found at the nexus of feature genes and miRNA-regulated genes and which correlated with the upregulation of dendritic cells. Moreover, FOXO4 was found to be involved in ABC transporters, as well as cocaine and nicotine addiction.
Conclusion: FOXO4 may serve as potential biomarker and therapeutic target for PMOP.
Keywords: postmenopausal osteoporosis, microRNAs, bioinformatics analysis, FOXO4, biomarker
Introduction
Osteoporosis is a chronic skeletal disorder characterized by decreased bone strength, it should be which increases risk of fractures.1 The main cause of osteoporosis is an imbalance between bone-forming osteoblasts and bone-resorbing osteoclasts,2 which can lead to disability and morbidity, especially in the hip and spine.3 The most frequent type of osteoporosis is postmenopausal osteoporosis (PMOP), which particularly affects the elderly.4 The main risk factors for this disease are age, smoking, nutrition and medication,5 and as many as one in every two Americans over the age of 50 was affected by osteoporosis in 2020.6 The number of global fractures is expected to double in the next 20 years,7 generating a significant financial burden and public health challenge. PMOP is of particular concern because it leads to an increased risk of fractures, with subsequent negative impacts on health in older women.8
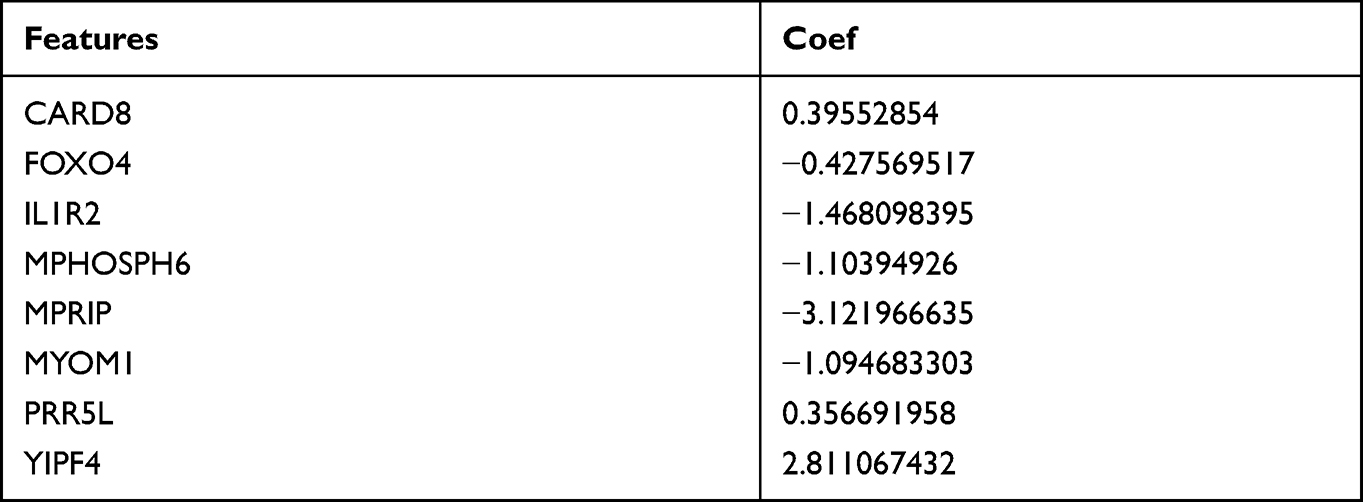 |
Table 1 The 8 Feature Genes Selected by Least Absolute Shrinkage and Selection Operator (LASSO) |
The only source of osteoclast precursors consists of circulating monocytes, which can differentiate into a variety of cells, including macrophages and dendritic cell subtypes.9 Peripheral blood monocytes (PBMs) are able to secrete cytokines that affect osteoclast differentiation, activation, and apoptosis.10−13 The CD14/CD16 subtype of mature PBMs can migrate to sites of bone resorption, and PBMs can secrete osteoclast factors and play an important role in osteogenesis.14–16 Moreover, PBMs could differentiate into osteoclasts.17 Therefore, PBMs have recently received much attention in studies of bone pathophysiology.18
MicroRNAs (miRNAs) are epigenetic regulators that extensively regulate gene expression, affecting multiple biological processes including bone metabolism.19 For example, miR133a in circulating monocytes has been identified as a potential marker of PMOP.20 Additional miRNAs have been associated with osteoporosis21,22 and PMOP.23
In the present study, we employed a bioinformatics approach to identify key genes associated with PMOP, in particular potential regulators of PMOP pathology, using the Gene Expression Omnibus (GEO) database. Multi-scale embedded gene co-expression network analysis (MEGENA) and least absolute shrinkage and selection operator (LASSO) regression were performed to establish diagnostic gene signatures for PMOP and identify potential therapeutic targets.
Materials and Methods
Data Preprocessing
GSE56814, GSE13850, GSE56815 and GSE74209 were downloaded from the Gene Expression Omnibus (GEO, https://www.ncbi.nlm.nih.gov/geo/).24 The article only collects 134 samples between high and low BMD with postmenopausal women. GSE56814, based on the GPL5175 platform, contains gene expression profiles of blood monocytes from 26 subjects with high bone mineral density (BMD) and 16 subjects with low BMD, all of postmenopausal women. GSE13850, based on the GPL96 platform, contains gene expression profiles of whole blood samples from 40 women with postmenopausal women smokers, of whom 20 had high BMD and 20 low BMD. GSE56815, based on the GPL96 platform, contains gene expression profiles of blood monocytes from 40 postmenopausal caucasian females, 20 with high BMD and 20 with low BMD. GSE74209, based on the GPL20999 platform, contains miRNA expression profiles of fresh femoral neck trabecular bone samples from 6 PMOP and 6 absence of osteoporosis with postmenopausal female subjects (according to BMD and T-score measurements [mean± SD]: 0.882 ±0.158 and- 0.342 ±1.622, respectively). The data quality in GSE56815 and GSE13850 were evaluated using principal component analysis (PCA). To reduce batch effects from non-biological technical biases involved in the expression profiles of GSE56815 and GSE13850 as a combined dataset, the “ComBat” algorithm25 and the SVA package were applied.26 The workflow of the present study is shown in Figure 1.
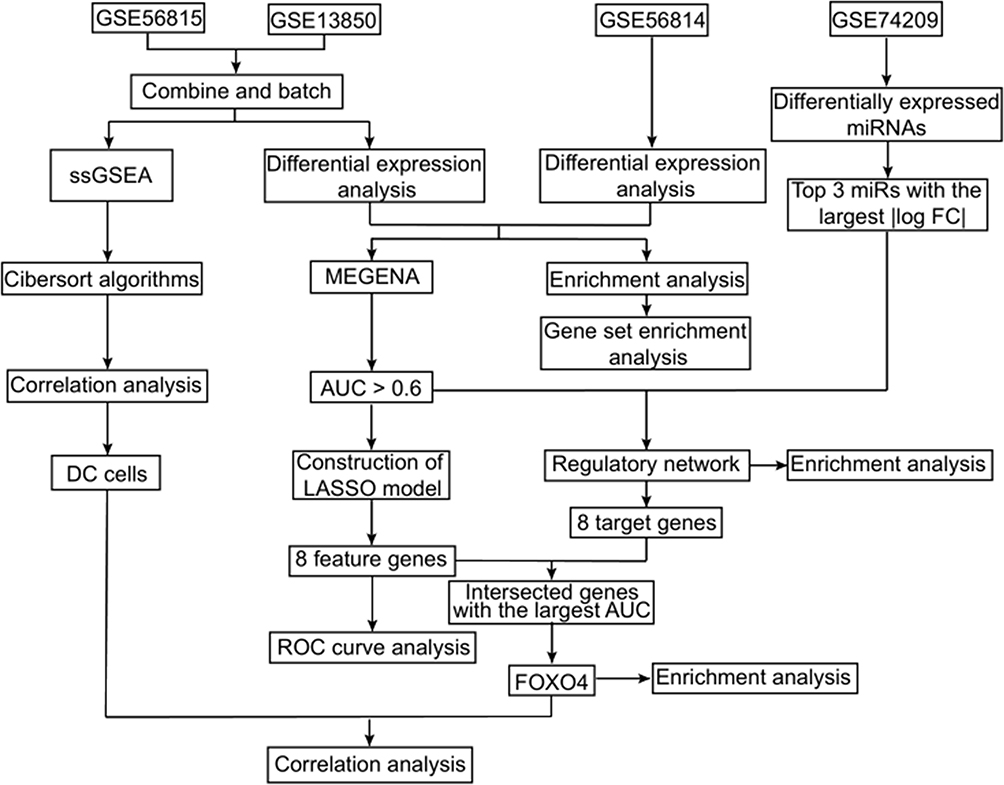 |
Figure 1 Study workflow. The workflow includes four steps. Step 1: differential expression analysis was performed to obtain the differentially expressed genes (DEGs) in combined dataset (GSE56815 and GSE13850) and GSE56814, enrichment analysis was performed using DEGs; Step 2: constructing a MEGENA to obtain module genes, next, module genes with AUC > 0.60 were constructed the LASSO model to obtain feature genes; Step 3: 8 target genes were obtained that a regulated network was constructed using differentially expressed micro-RNAs (DEmiRs) in GSE74209 and feature genes; Step 4: expression profiles of combined dataset were performed ssGSEA, explored the immune cell infiltration and correlation of FOXO4 and biological pathways in PMOP. Abbreviations: AUC, area under receiver operating characteristic curve; DC, dendritic cell; MEGENA, multiscale embedded gene co-expression network analysis; LASSO, least absolute shrinkage and selection operator; logFC, log (fold change); PMOP, postmenopausal osteoporosis; ROC, receiver operating characteristic; ssGSEA, single-sample geneset enrichment analysis. |
Differential Expression Analysis
Differentially expressed mRNAs (DEmRs) between low-BMD and high-BMD patients were identified in the combined dataset (GSE56815 and GSE13850) and in the dataset GSE56814 using the “limma” package in R.27 Differentially expressed miRNAs (DEmiRs) between PMOP patients and controls in GSE74209 were identified using the “limma” package. DEmRs and DEmiRs associated with p < 0.05 were considered significant and analyzed further.
Enrichment Analysis
We used the “clusterProfiler” package in R28 to perform Gene Ontology (GO) and Kyoto Encyclopedia of Genes and Genomes (KEGG) enrichment analysis. P < 0.05 was defined as significant enrichment. Gene set variation analysis (GSVA) was visualized using the GSVA R package.29 The “clusterProfiler” package was used to perform gene set enrichment analysis (GSEA),30 and the “fgsea” package in R was used to display the results.
Construction of Co-Expression Networks
We used the “multiscale embedded gene co-expression network analysis (MEGENA)” package in R31 to identify a co-expression network. The first step of MEGENA analysis is fast planar filtered network (PFN) construction, and the significant gene pairs of a planar filtered network (PFN) were calculated. The constructed PFNs were input to multiscale clustering analysis (MCA) to achieve the subsequent analyses.
Construction of the LASSO Regression Model and Analysis of Receiver Operating Characteristic (ROC) Curves
Using logistic regression, we selected the optimal features from the module genes in the top three largest modules with an area under the ROC curve (AUC) > 0.6 to construct a LASSO model using the “glmnet” package.32 The most concise LASSO model was obtained, defined as the one using the fewest characteristic genes to predict the group of samples.
To further assess the diagnostic ability of the LASSO model for osteoporosis, the combined dataset was randomly divided into a training set (80%) and a test set (20%), and the model was also validated using samples in GSE56814 dataset. The ability of the LASSO model to diagnose osteoporosis was evaluated in terms of the ROC curve. Feature genes obtained from the LASSO method were extracted, and AUCs were calculated using the pROC package.33
Prediction of Target Genes
To explore potential target genes, we selected the top three DEmiRs showing the highest and lowest changes in differential expression. The TargetScan (Http://www.targetscan.org/vert_72) database34 was used to predict the potential targets of the miRNAs, and the regulatory network was constructed according to the regulation of top 3 miRNAs with the largest |log (fold change)|.
Implementation of Single-Sample Gene Set Enrichment Analysis (ssGSEA)
We used the ssGSEA method and “GSVA” package30 in R to quantify the infiltration levels of immune cell types. Differences in levels of immune cell infiltration were calculated between low-BMD and high-BMD samples using the “limma” package in R. Potential correlations between immune cells or FOXO4 and immune cells were evaluated using Pearson correlation analysis. Results associated with P < 0.05 were considered statistically significant. In addition, Levels of tumor infiltration by immune cells were also evaluated using CIBERSORT (https://cibersort.stanford.edu/).
Results
Biological Processes and Pathways of DEGs in PMOP
To explore differentially expressed genes (DEGs) in PMOP patients, we used the expression profiles of a combined dataset (GSE13850 and GSE56815), hereafter referred to as “the combined dataset”. This led to the identification of 288 up-regulated and 355 down-regulated genes in low-BMD comparing with high-BMD samples (Figure 2A). PCA showed that the expression of the DEGs could be used to clearly distinguish PMOP and healthy samples in the combined dataset (Figure 2B).
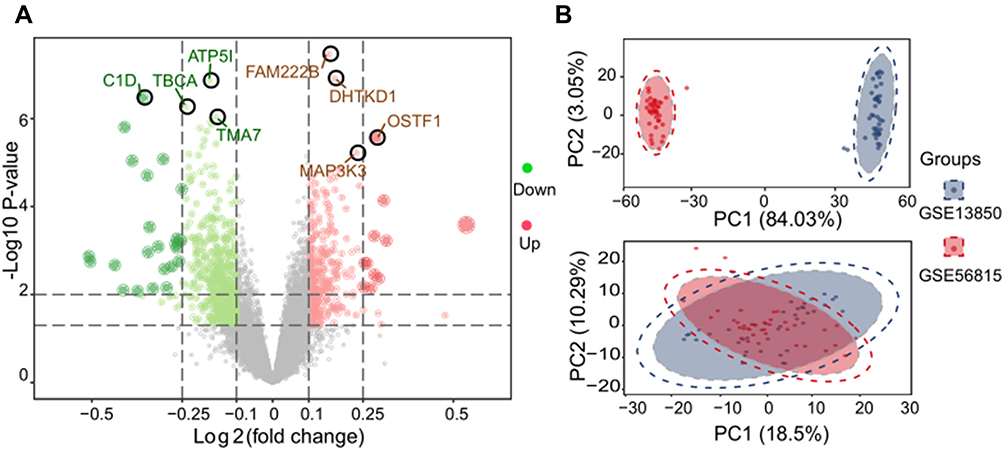 |
Figure 2 Differential gene expression and principal component analysis. (A) Volcano plot of differentially expressed genes by comparing low/high bone density in GSE13850 and GSE56815. The red color indicates up-regulated genes, green indicates down-regulated genes, and gray indicates genes with similar expression between both groups. (B) Principal component analysis of GSE13850 and GSE56815. Abbreviation: PC, principal component. |
The intersecting genes from among the DEGs in the combined dataset and from the DEGs in GSE56814 dataset were mainly involved in the KEGG pathways related to oxidative phosphorylation, fatty acid degradation and caffeine metabolism (Figure 3A). Furthermore, the common DEGs were significantly involved in biological processes related to Wnt signaling, T cell differentiation and cell-cell signaling by Wnt (Figure 3B). GSEA showed DEG enrichment in the activation of cytokine-cytokine receptor interactions, neuroactive ligand-receptor interactions, antigen processing and presentation, while DEG enrichment was linked to inhibition of Parkinson’s and Huntington’s diseases (Figure 3C).
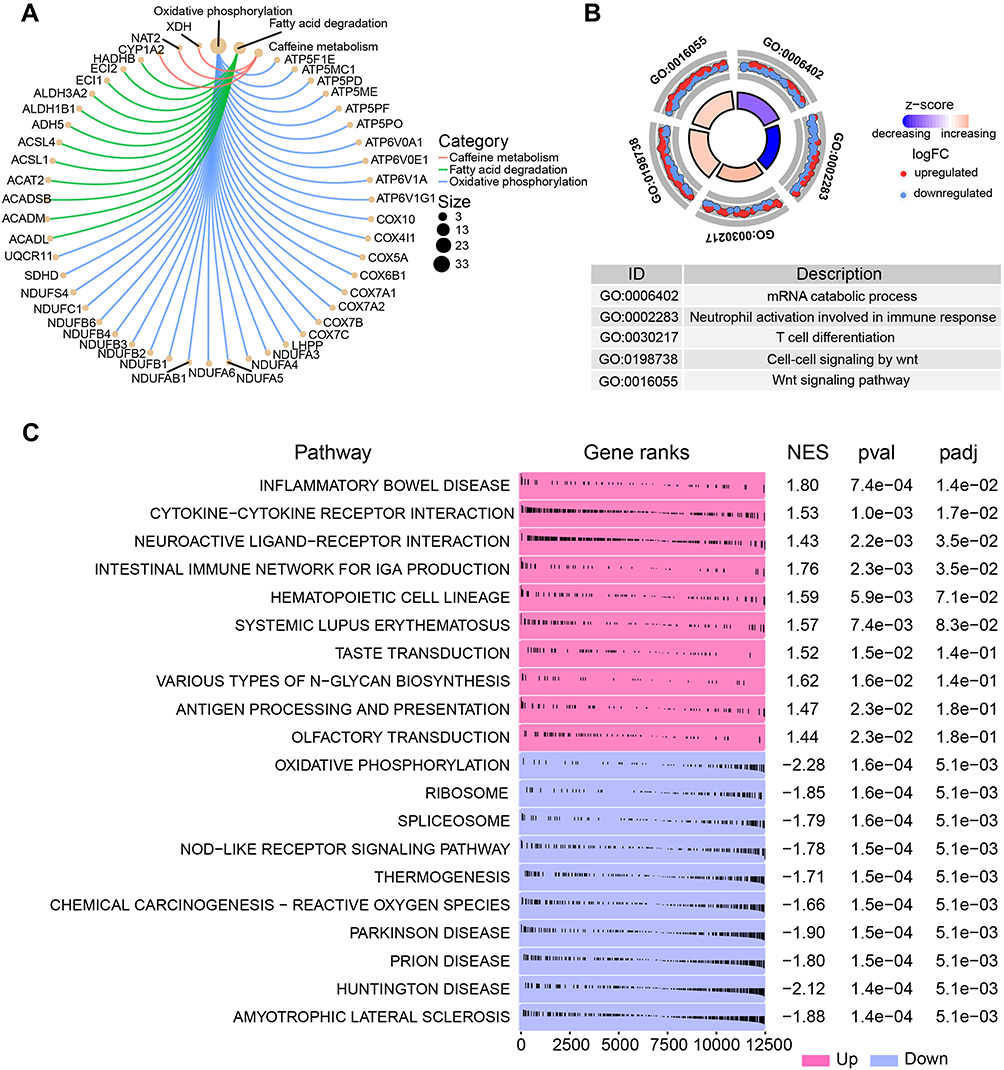 |
Figure 3 Biological processes and KEGG pathway analysis. The DEGs of combined dataset (GSE13850 and GSE56815) and GSE56814 were participated in biological processes as well as pathways. (A) PMOP-associated genes mainly clustered into three signaling pathways. (B) The PMOP-related genes were predicted to be involved in five biological processes. (C) Top 10 pathways significantly activated (red) or inhibited (blue), as shown by GSEA. Abbreviations: DEGs, differentially expressed genes; PMOP, postmenopausal osteoporosis; KEGG, Kyoto Encyclopedia of Genes and Genomes; GSEA, gene set enrichment analysis. |
Construction of a MEGENA Network and LASSO Regression of DEGs in PMOP Patients
To identify novel regulatory targets in PMOP, we constructed a MEGENA network using the intersecting genes identified above (Figure 4A). As shown in Figure 4B, we identified 66 modules and 2354 module genes. The largest module C1_4 consisted of 135 genes, followed by C1_7 with 121 genes and module C1_11 with 102 genes.
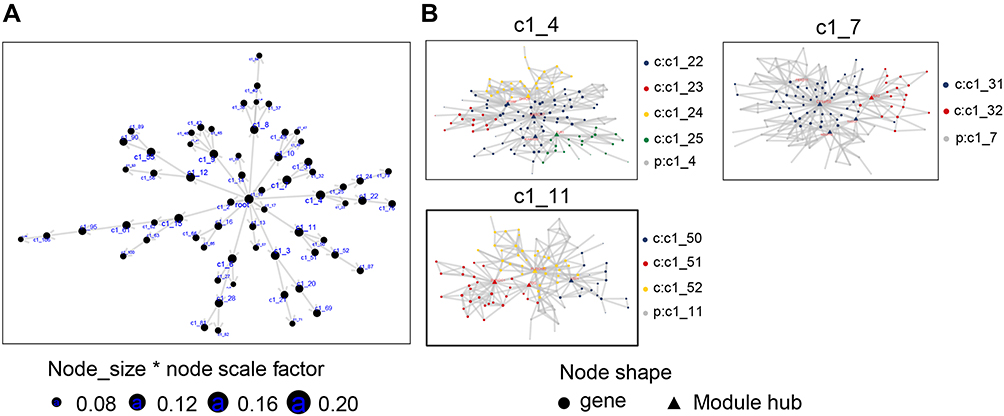 |
Figure 4 MEGENA of PMOP-related genes. (A) The common genes of the combined dataset and GSE56814 in the co-expression network. Each node represents a module, with the larger nodes indicating a higher number of genes. The combined dataset includes GSE13850 and GSE56815. (B) The MEGENA network showing the three largest gene modules. Each color represents one module, and triangles represent key genes in the module. Abbreviations: MEGENA, multiscale embedded gene co-expression network analysis; PMOP, postmenopausal osteoporosis. |
Module genes were evaluated for their potential diagnostic roles in the combined dataset and GSE56814 based on AUC analysis (Figure 5A). The top nine identified genes (AUC > 0.60) in both datasets are shown in Figure 5B. We subsequently used the LASSO model to screen the eight feature genes with non-zero coefficients, including CARD8, FOXO4, IL1R2, MPHOSPH6, MPRIP, MYOM1, PRR5L and YIPF4 (Figure 5C, Table 1). The model gave an AUC of 0.847 in the training set (Figure 5D) and 0.812 in the test set (Figure 5E). Furthermore, GSE56814 was used to evaluate the diagnostic performance of the model, giving an AUC of 0.675 (Figure 5F).
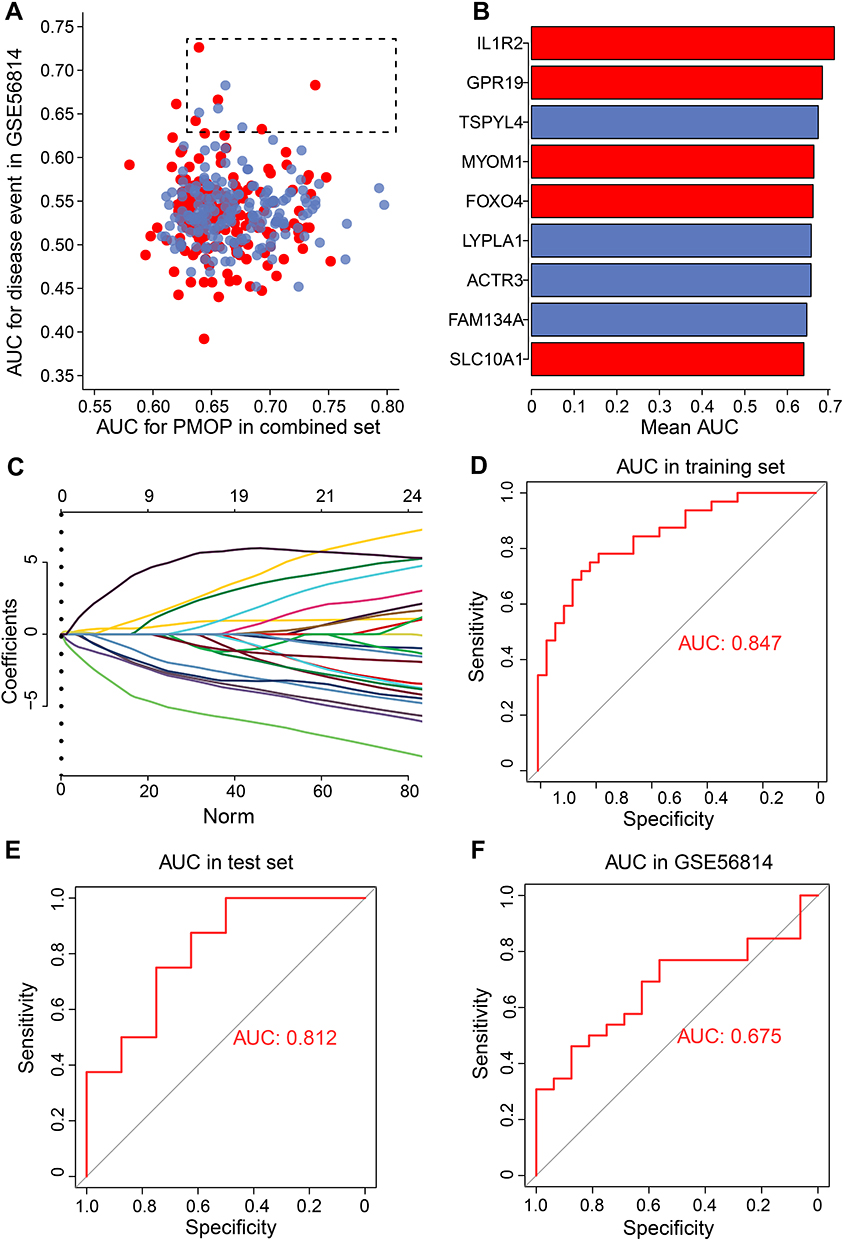 |
Figure 5 LASSO model. (A) Evaluation of the diagnostic value of candidate genes involved in PMOP based on AUC. (B) The top nine genes are shown with AUC > 0.60. Red indicates up-regulated genes and blue indicates down-regulated genes. (C) Determination of the number of feature genes in the LASSO analysis. Receiver operating characteristic curves of the training set (D), test set (E) and GSE56814 (F). Abbreviations: AUC, area under receiver operating characteristic curve; LASSO, least absolute shrinkage and selection operator; PMOP, postmenopausal osteoporosis. |
Correlation of DEmiRs with Biological Pathways in PMOP Patients
We next set out to explore differentially expressed miRNAs (DEmiRs) in PMOP patients and so performed a differential expression analysis. We identified 535 DEmiRs in GSE74209, with 297 that were up-regulated and 237 that were down-regulated (Figure 6A). Furthermore, the top three DEmiRs with the largest |log (fold change)| were screened, and feature genes were used to construct a regulatory network. GO functional enrichment analysis showed that regulated genes were mainly involved in the VEGFA-VEGFR2 signaling pathway and blood vessel morphogenesis (Figure 6B). Finally, we built a regulatory network involving five miRNAs targeting ACTR3, CARD8, CCDC134, FOXO4, FST, LSM5, MPRIP and SWAP70 (Figure 6C). Importantly, FOXO4, CARD8 and MPRIP were common feature genes in the LASSO model and were also identified as DEmiRNA target genes. In particular, FOXO4 had the largest AUC and therefore defined as a key gene in PMOP. We subsequently identified the predicted binding site between FOXO4 and hsa-miR-4284 using the TargetScan database (Figure 6D).
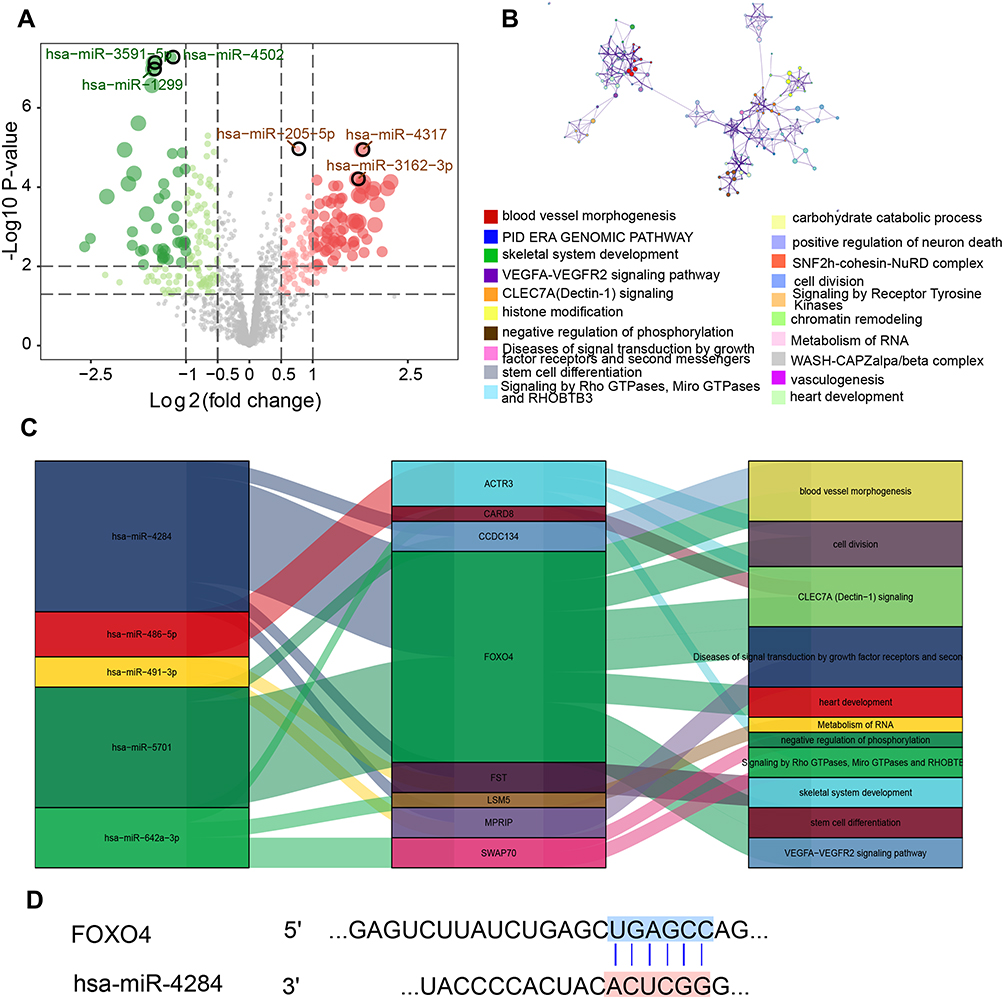 |
Figure 6 Regulatory network of miRNAs. (A) Volcano map of differentially expressed miRNAs comparing PMOP and healthy controls in GSE74209. Red indicates up-regulated genes, green indicates down-regulated genes, and gray indicates genes with similar expression between the two groups. (B) GO enrichment analysis of the top three largest gene modules. Each colored dot indicates a different biological process. (C) Sankey plots showing the biological processes involved in the regulatory relationships between miRNAs and mRNAs. (D) Predicted binding site of FOXO4 and hsa-miR-4284, obtained using TargetScan. Abbreviation: GO, gene ontology. |
Immune Cell Infiltration in PMOP
Immune cell types were investigated in PMOP samples using the combined dataset and in GSE56814. As shown in Figure 7A, we found that dendritic cells (DCs), interdigitating dendritic cell sarcoma (iDCs) and activated DCs (aDCs) were significantly up-regulated in PMOP compared with healthy controls. Correlation analysis across 24 immune cell types in PMOP showed significant correlations in the levels of DCs, natural killer (NK) cells, T cells and cytotoxic cells (Figure 7B). As a further exploration of the relationship between immune cells and key genes in PMOP, we found a positive correlation between FOXO4 and DCs, indicating that FOXO4 and DCs may together promote the development of PMOP (Figure 7C). Moreover, we found that monocytes constituted the highest proportion of infiltrated immune cells (Figure 7D), suggesting that monocytes may play a key role in PMOP development.
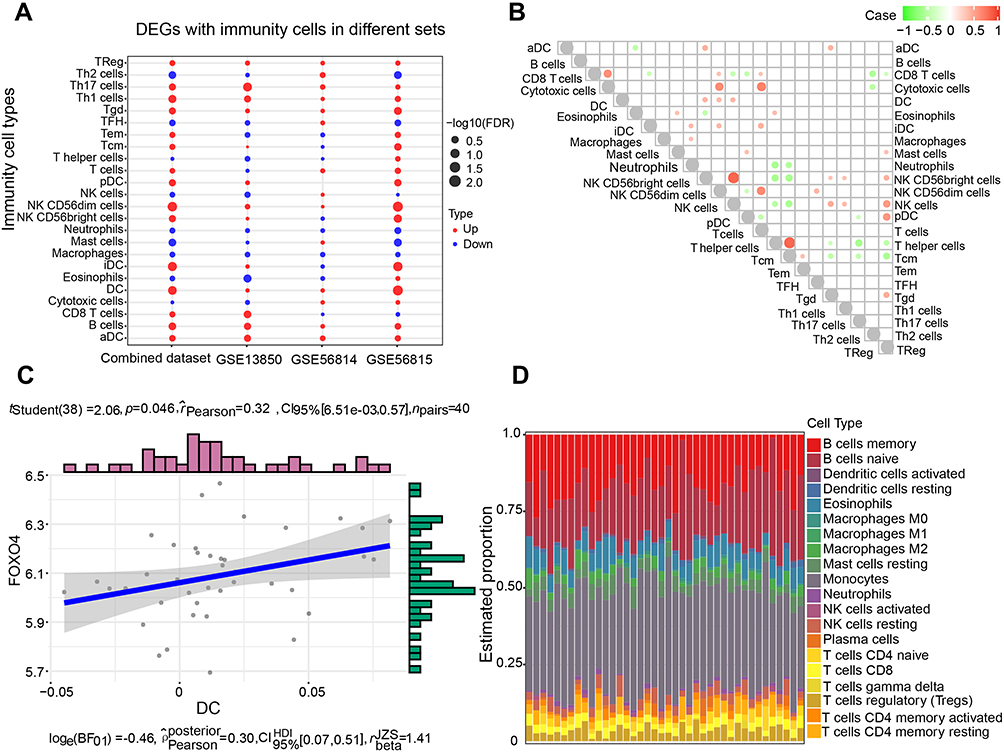 |
Figure 7 Correlation between FOXO4 expression and immune cell abundance in PMOP. (A) Expression of differentially expressed genes and levels of immune cells in the indicated datasets. (B) Correlation between immune cell types in PMOP samples. Red represents a positive correlation, and green indicates a negative correlation. (C) FOXO4 positively correlated with DCs. (D) Estimated proportions of 20 immune cell types. Abbreviations: PMOP, postmenopausal osteoporosis; DCs, dendritic cells. |
Correlation of FOXO4 and Biological Pathways in PMOP
Evaluation of the involvement of FOXO4 in PMOP indicated an AUC of 0.67 in GSE56814, and an AUC of 0.65 in the combined dataset (Figure 8A). As shown in Figure 8B, FOXO4 was up-regulated in PMOP, and we explored the top 10 biological processes and KEGG pathways that correlated with FOXO4 in PMOP. The positively correlated biological processes of FOXO4 were found to be involved in renal filtration and regulation of protein kinase activity, while the negatively correlated pathways of FOXO4 were involved in protein localization to the cytoskeleton, basement membrane disassembly and latent virus replication (Figure 8C). Furthermore, KEGG pathways of ABC transporters, cocaine addiction and nicotine addiction were positively associated with FOXO4, while the VEGF signaling pathway, beta-alanine metabolism and oxidative phosphorylation were negatively associated with FOXO4 in PMOP (Figure 8D).
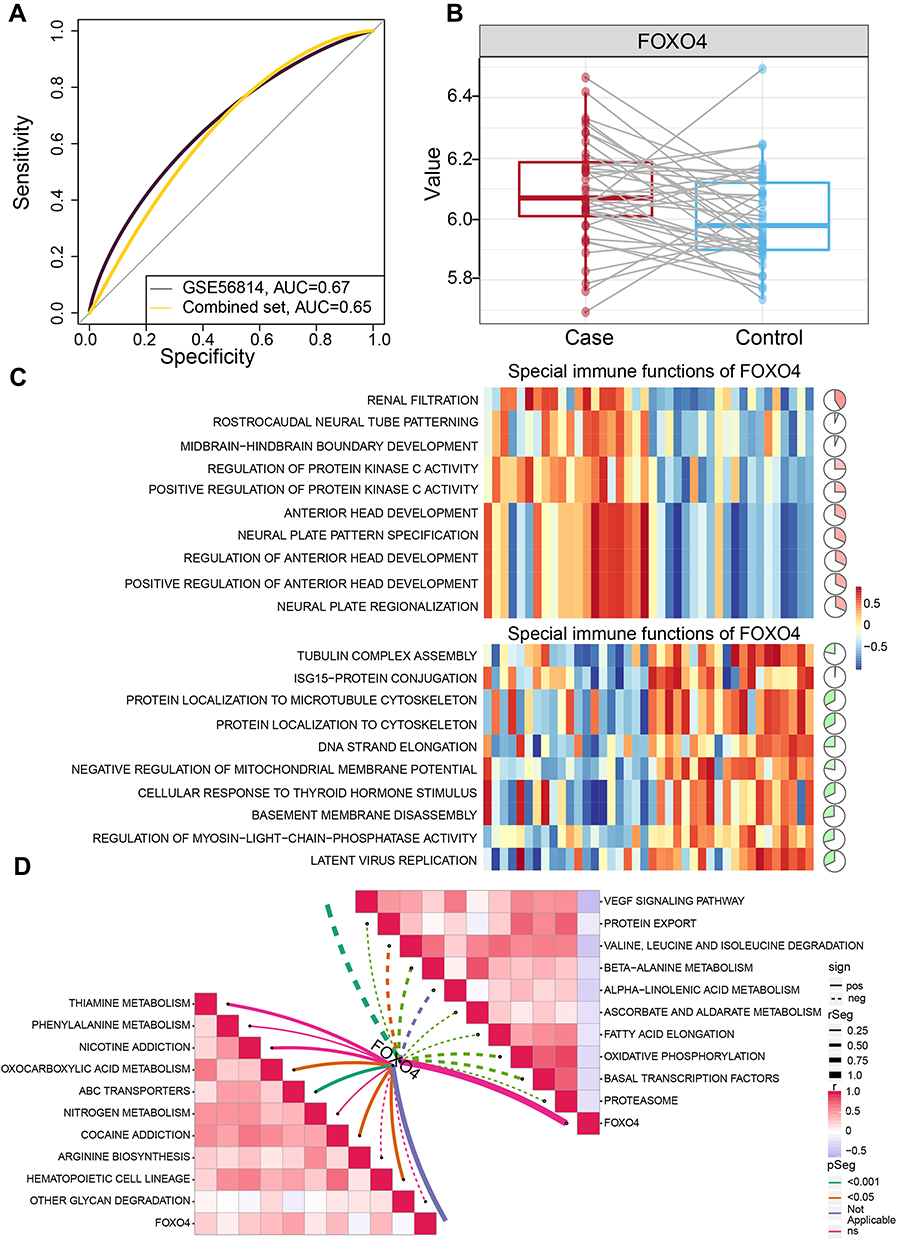 |
Figure 8 Enrichment analysis of FOXO4 in PMOP. (A) Receiver operating characteristic curves for the indicated datasets. The combined dataset includes GSE13850 and GSE56815. (B) Expression of FOXO4 in the common genes of the combined dataset and GSE56814. (C) Correlation of FOXO4 and biological processes in immune cells. The red section indicates activation, and the green section indicates inhibition. (D) Correlation of FOXO4 and pathways in immune cells. Red indicates a positive correlation, and green indicates a negative correlation. |
Discussion
PMOP is one of the most common chronic diseases, particularly in elderly women, and it has a serious detrimental impact on the body. In this study, we performed a regulated network and LASSO model analysis to screen for potential key genes in PMOP patients, and found that FOXO4 was associated with immune cell infiltration. In addition, we identified pathways related to the regulation of miRNAs in PMOP patients.
The DEGs between PMOP and healthy controls were significantly enriched in biological processes related to the Wnt signaling pathway, T cell differentiation and cell-cell signaling by Wnt. The Wnt signaling pathway is known to be involved in the regulation of bone homeostasis and may increase the risk of osteoporosis in postmenopausal women.35 Precursor T cells can differentiate into Th1, Th17 and other helper T cells.36 Th17 cells are involved in osteoclast differentiation and thus help maintain bone homeostasis,37 Our study revealed that pathways of cytokine-cytokine receptor interactions, neuroactive ligand-receptor interactions and antigen processing and presentation may be involved in PMOP. This finding implies that natural compounds may be useful for targeting cytokine-cytokine receptor interactions in order to inhibit RANKL-induced osteoclasts and reduce the expression of genes involved in bone resorption,38 For their part, neuroactive ligand-receptor interactions39 as well as antigen processing and presentation by osteoclasts40 may affect risk of osteoporosis.
MEGENA was performed to show the correlation between genes and genes in modules, and 358 module genes were used for AUC analysis. We constructed the LASSO model using the genes with an AUC > 0.6. Eight feature genes were ultimately obtained: CARD8, FOXO4, IL1R2, MPHOSPH6, MPRIP, MYOM1, PRR5L and YIPF4. CARD8 as an inflammatory sensor and is highly expressed in blood and lymphoid tissues,41 suggesting that CARD8 may promote inflammation in osteoporosis. FOXO1, FOXO3 and FOXO4 were expressed in bone cells and maintained redox balance in osteocytes, they regulate bone metabolism and participate in the pathological processes of osteoporosis.42 IL1R2 is specifically expressed in peripheral blood mononuclear cells of osteoclasts.43 In contrast, the other feature genes that we identified here have not yet been linked to osteoporosis, so their potential role in PMOP needs to be further explored.
Construction of miRNA-regulated gene expression networks implicated genes involved in VEGFA-VEGFR2 signaling and blood vessel morphogenesis in PMOP. VEGFA can stimulate bone repair by promoting angiogenesis and stimulating pre-osteoblast proliferation to differentiate into mature osteoblasts or, intriguingly, promote osteogenesis or transformation.44 VEGFA also modulates angiogenesis through the activation of the VEGFR1 and VEGFR2 receptors.45 Blood vessel morphogenesis produces mature vasculature and also affects the formation and function of several important tissues.46 Such vascularization combines with bone development and growth during osteogenesis.47 Osteoblasts can affect bone synthesis and metabolism and promote the development of PMOP.48 Altogether, most PMOP-associated pathways involve osteocytes as well as blood vessels, which may play a role PMOP inception.
Out of the 8 predicted target genes of DEmiRs, FOXO4 yielded the largest AUC within the LASSO model and among the target genes of miRNAs, so we hypothesize that it may be a key gene in PMOP. Immune cells are involved in osteoporosis,49 and our study found that among the 24 immune cell types, DCs and T cells are highly expressed in PMOP, with DCs positively associated with FOXO4 expression. DCs are antigen-presenting cells that can activate and regulate T cells.50,51 Moreover, the homeostasis of T cells can cause inflammation, resulting in substantial bone resorption and loss of bone mineral density.52 While FOXO4 has also been studied in bone metabolism, it has mostly been reported in the context of cancers, including leukemia, neuroblastoma, as well as cervical, colorectal, pancreatic and lung cancers.53,54 We propose that FOXO4 may act as a key molecule in the immune environment of bone, and its further experimental exploration may open up new avenues in onco-immunology.
The biological pathways of ABC transporters, cocaine addiction and nicotine addiction were significantly associated with FOXO4 in PMOP. This is not surprising, as ATP-binding cassette g1 (ABCg1) regulates osteogenesis,55 while nicotine addiction increases the risk of osteoporosis.56,57 Additionally, nitrogen metabolism can partially counteract osteoporosis.58 However, the role of cocaine addiction in osteoporosis is unclear.
We screened FOXO4 as a key biomarker of PMOP by bioinformatics and explored its role in biological processes and pathways. We found that FOXO4 is involved in immune cell infiltration, suggesting that FOXO4 may be a key molecule in the bone immune environment. However, the relevant mechanisms need to be further explored. Furthermore, our study has some limitations, especially in studies involving larger samples and animal experiments, which could externally verify and extend our purely bioinformatic analysis here.
Conclusion
Using bioinformatics analysis, we identified FOXO4 as a potential novel biomarker in PMOP, which may act as a key molecule in the immune environment of bone, and its further exploration may open up new avenues in immunology.
Data Sharing Statement
The raw data, analyses and codes in this study can be obtained from the corresponding author upon reasonable request.
Ethics Approval and Informed Consent
Not applicable because GEO belongs to public databases, the patients involved in the database have obtained ethical approval. Users can download relevant data for free for research and publish relevant articles. Our study is based on open source data, and the Fourth Affiliated Hospital of Guangxi Medical University specifically do not require research using publicly available data to be submitted for review to their ethics committee, so there are no ethical issues and other conflicts of interest.
Acknowledgments
This study was supported by the Scientific Research Project of Guangxi Health Commission (Z20190168) and Guangxi Adminstration of Traditional Chinese Medicine (GZZC2019200).
Disclosure
The authors have no potential conflicts of interest to declare.
References
1. National Institutes of Health. Consensus Development Panel on Osteoporosis Prevention, Diagnosis, and Therapy. NIH Consensus Development Panel on Osteoporosis. JAMA. 2001;285(6):785–795. doi:10.1001/jama.285.6.785
2. Lerner UH. Bone remodeling in post-menopausal osteoporosis. J Dent Res. 2006;85(7):584–595. doi:10.1177/154405910608500703
3. Marottoli RA, Berkman LF, Cooney LM
4. Sotornik I. [Osteoporosis - epidemiology and pathogenesis]. Vnitr Lek. 2016;62(Suppl 6):84–87. Arabic.
5. Sozen T, Ozisik L, Basaran NC. An overview and management of osteoporosis. Eur J Rheumatol. 2017;4(1):46–56. doi:10.5152/eurjrheum.2016.048
6. Lewiecki EM, Leader D, Weiss R, Williams SA. Challenges in osteoporosis awareness and management: results from a survey of US postmenopausal women. J Drug Assess. 2019;8(1):25–31. doi:10.1080/21556660.2019.1579728
7. Oden A, McCloskey EV, Kanis JA, Harvey NC, Johansson H. Burden of high fracture probability worldwide: secular increases 2010–2040. Osteoporos Int. 2015;26(9):2243–2248. doi:10.1007/s00198-015-3154-6
8. Baccaro LF, Conde DM, Costa-Paiva L, Pinto-Neto AM. The epidemiology and management of postmenopausal osteoporosis: a viewpoint from Brazil. Clin Interv Aging. 2015;10:583–591. doi:10.2147/CIA.S54614
9. Geissmann F, Manz MG, Jung S, Sieweke MH, Merad M, Ley K. Development of monocytes, macrophages, and dendritic cells. Science. 2010;327(5966):656–661. doi:10.1126/science.1178331
10. Horton MA, Spragg JH, Bodary SC, Helfrich MH. Recognition of cryptic sites in human and mouse laminins by rat osteoclasts is mediated by beta 3 and beta 1 integrins. Bone. 1994;15(6):639–646. doi:10.1016/8756-3282(94)90312-3
11. Parfitt AM. Osteonal and hemi-osteonal remodeling: the spatial and temporal framework for signal traffic in adult human bone. J Cell Biochem. 1994;55(3):273–286. doi:10.1002/jcb.240550303
12. Parfitt AM. Osteoclast precursors as leukocytes: importance of the area code. Bone. 1998;23(6):491–494. doi:10.1016/S8756-3282(98)00140-9
13. Zambonin Zallone A, Teti A, Primavera MV. Monocytes from circulating blood fuse in vitro with purified osteoclasts in primary culture. J Cell Sci. 1984;66:335–342. doi:10.1242/jcs.66.1.335
14. Braun T, Zwerina J. Positive regulators of osteoclastogenesis and bone resorption in rheumatoid arthritis. Arthritis Res Ther. 2011;13(4):235. doi:10.1186/ar3380
15. Amarasekara DS, Yun H, Kim S, Lee N, Kim H, Rho J. Regulation of osteoclast differentiation by cytokine networks. Immune Netw. 2018;18(1):e8. doi:10.4110/in.2018.18.e8
16. Zupan J, Jeras M, Marc J. Osteoimmunology and the influence of pro-inflammatory cytokines on osteoclasts. Biochem Med. 2013;23(1):43–63. doi:10.11613/BM.2013.007
17. Beck F, Hartmann ES, Koehler MI, et al. Immobilization of denosumab on titanium affects osteoclastogenesis of human peripheral blood monocytes. Int J Mol Sci. 2019;20(5):1002. doi:10.3390/ijms20051002
18. Zhou Y, Deng HW, Shen H. Circulating monocytes: an appropriate model for bone-related study. Osteoporos Int. 2015;26(11):2561–2572. doi:10.1007/s00198-015-3250-7
19. Yang Y, Yujiao W, Fang W, et al. The roles of miRNA, lncRNA and circRNA in the development of osteoporosis. Biol Res. 2020;53(1):40. doi:10.1186/s40659-020-00309-z
20. Wang Y, Li L, Moore BT, et al. MiR-133a in human circulating monocytes: a potential biomarker associated with postmenopausal osteoporosis. PLoS One. 2012;7(4):e34641. doi:10.1371/journal.pone.0034641
21. Ding H, Meng J, Zhang W, et al. Medical examination powers miR-194-5p as a biomarker for postmenopausal osteoporosis. Sci Rep. 2017;7(1):16726. doi:10.1038/s41598-017-17075-w
22. Yu T, You X, Zhou H, et al. MiR-16-5p regulates postmenopausal osteoporosis by directly targeting VEGFA. Aging. 2020;12(10):9500–9514. doi:10.18632/aging.103223
23. Zhang H, Ding W, Ji F, Wu D. MicroRNA-410 participates in the pathological process of postmenopausal osteoporosis by downregulating bone morphogenetic protein-2. Exp Ther Med. 2019;18(5):3659–3666. doi:10.3892/etm.2019.7996
24. Barrett T, Wilhite SE, Ledoux P, et al. NCBI GEO: archive for functional genomics data sets–update. Nucleic Acids Res. 2013;41:D991–D995. doi:10.1093/nar/gks1193
25. Johnson WE, Li C, Rabinovic A. Adjusting batch effects in microarray expression data using empirical Bayes methods. Biostatistics. 2007;8(1):118–127. doi:10.1093/biostatistics/kxj037
26. Leek JT, Johnson WE, Parker HS, Jaffe AE, Storey JD. The sva package for removing batch effects and other unwanted variation in high-throughput experiments. Bioinformatics. 2012;28(6):882–883. doi:10.1093/bioinformatics/bts034
27. Ritchie ME, Phipson B, Wu D, et al. limma powers differential expression analyses for RNA-sequencing and microarray studies. Nucleic Acids Res. 2015;43(7):e47. doi:10.1093/nar/gkv007
28. Yu G, Wang LG, Han Y, He QY. clusterProfiler: an R package for comparing biological themes among gene clusters. OMICS. 2012;16(5):284–287. doi:10.1089/omi.2011.0118
29. Hanzelmann S, Castelo R, Guinney J. GSVA: gene set variation analysis for microarray and RNA-seq data. BMC Bioinform. 2013;14:1–5. doi:10.1186/1471-2105-14-7
30. Subramanian A, Tamayo P, Mootha VK, et al. Gene set enrichment analysis: a knowledge-based approach for interpreting genome-wide expression profiles. Proc Natl Acad Sci USA. 2005;102(43):15545–15550. doi:10.1073/pnas.0506580102
31. Song WM, Zhang B, Wang E. Multiscale embedded gene co-expression network analysis. PLoS Comput Biol. 2015;11(11):e1004574. doi:10.1371/journal.pcbi.1004574
32. Engebretsen S, Bohlin J. Statistical predictions with glmnet. Clin Epigenetics. 2019;11(1):123. doi:10.1186/s13148-019-0730-1
33. Robin X, Turck N, Hainard A, et al. pROC: an open-source package for R and S+ to analyze and compare ROC curves. BMC Bioinform. 2011;12:77. doi:10.1186/1471-2105-12-77
34. Lewis BP, Burge CB, Bartel DP. Conserved seed pairing, often flanked by adenosines, indicates that thousands of human genes are microRNA targets. Cell. 2005;120(1):15–20. doi:10.1016/j.cell.2004.12.035
35. Yang Z, Liu J, Fu J, Li S, Chai Z, Sun Y. Associations between WNT signaling pathway-related gene polymorphisms and risks of osteoporosis development in Chinese postmenopausal women: a case-control study. Climacteric. 2021;10:1–7.
36. Srivastava RK, Dar HY, Mishra PK. Immunoporosis: immunology of osteoporosis-role of T cells. Front Immunol. 2018;9:657. doi:10.3389/fimmu.2018.00657
37. de Vries TJ, El Bakkali I, Kamradt T, Schett G, Jansen IDC, D’Amelio P. What are the peripheral blood determinants for increased osteoclast formation in the various inflammatory diseases associated with bone loss? Front Immunol. 2019;10:505. doi:10.3389/fimmu.2019.00505
38. Cheng CF, Chien-Fu Lin J, Tsai FJ, et al. Protective effects and network analysis of natural compounds obtained from Radix dipsaci, Eucommiae cortex, and Rhizoma drynariae against RANKL-induced osteoclastogenesis in vitro. J Ethnopharmacol. 2019;244:112074. doi:10.1016/j.jep.2019.112074
39. Liu L, Zhu Q, Wang J, Xi Q, Zhu H, Gu M. Gene expression changes in human mesenchymal stem cells from patients with osteoporosis. Mol Med Rep. 2015;12(1):981–987. doi:10.3892/mmr.2015.3514
40. Madel MB, Ibanez L, Wakkach A, et al. Immune function and diversity of osteoclasts in normal and pathological conditions. Front Immunol. 2019;10:1408. doi:10.3389/fimmu.2019.01408
41. Fagerberg L, Hallstrom BM, Oksvold P, et al. Analysis of the human tissue-specific expression by genome-wide integration of transcriptomics and antibody-based proteomics. Mol Cell Proteomics. 2014;13(2):397–406. doi:10.1074/mcp.M113.035600
42. Ma X, Su P, Yin C, et al. The roles of FoxO transcription factors in regulation of bone cells function. Int J Mol Sci. 2020;21(3):692. doi:10.3390/ijms21030692
43. Atkins GJ, Haynes DR, Geary SM, Loric M, Crotti TN, Findlay DM. Coordinated cytokine expression by stromal and hematopoietic cells during human osteoclast formation. Bone. 2000;26(6):653–661. doi:10.1016/S8756-3282(00)00280-5
44. Street J, Bao M, deGuzman L, et al. Vascular endothelial growth factor stimulates bone repair by promoting angiogenesis and bone turnover. Proc Natl Acad Sci USA. 2002;99(15):9656–9661. doi:10.1073/pnas.152324099
45. Shibuya M. Vascular endothelial growth factor and its receptor system: physiological functions in angiogenesis and pathological roles in various diseases. J Biochem. 2013;153(1):13–19. doi:10.1093/jb/mvs136
46. Herbert SP, Stainier DY. Molecular control of endothelial cell behaviour during blood vessel morphogenesis. Nat Rev Mol Cell Biol. 2011;12(9):551–564. doi:10.1038/nrm3176
47. Patel ZS, Young S, Tabata Y, Jansen JA, Wong ME, Mikos AG. Dual delivery of an angiogenic and an osteogenic growth factor for bone regeneration in a critical size defect model. Bone. 2008;43(5):931–940. doi:10.1016/j.bone.2008.06.019
48. Marie PJ, Kassem M. Osteoblasts in osteoporosis: past, emerging, and future anabolic targets. Eur J Endocrinol. 2011;165(1):1–10. doi:10.1530/EJE-11-0132
49. Toni R, Di Conza G, Barbaro F, et al. Microtopography of immune cells in osteoporosis and bone lesions by endocrine disruptors. Front Immunol. 2020;11:1737. doi:10.3389/fimmu.2020.01737
50. Banchereau J, Steinman RM. Dendritic cells and the control of immunity. Nature. 1998;392(6673):245–252. doi:10.1038/32588
51. Morelli AE, Thomson AW. Dendritic cells: regulators of alloimmunity and opportunities for tolerance induction. Immunol Rev. 2003;196:125–146. doi:10.1046/j.1600-065X.2003.00079.x
52. Weitzmann MN. Bone and the Immune System. Toxicol Pathol. 2017;45(7):911–924. doi:10.1177/0192623317735316
53. Lu C, Yang Z, Jiang S, et al. Forkhead box O4 transcription factor in human neoplasms: cannot afford to lose the novel suppressor. J Cell Physiol. 2019;234(6):8647–8658. doi:10.1002/jcp.27853
54. Beretta GL, Corno C, Zaffaroni N, Perego P. Role of FoxO proteins in cellular response to antitumor agents. Cancers. 2019;11(1):90. doi:10.3390/cancers11010090
55. Zhou L, Sun S, Zhang T, et al. ATP-binding cassette g1 regulates osteogenesis via Wnt/beta-catenin and AMPK signaling pathways. Mol Biol Rep. 2020;47(10):7439–7449. doi:10.1007/s11033-020-05800-0
56. Ayo-Yusuf OA, Olutola BG. Epidemiological association between osteoporosis and combined smoking and use of snuff among South African women. Niger J Clin Pract. 2014;17(2):174–177. doi:10.4103/1119-3077.127542
57. Jagielska I, Kazdepka-Zieminska A, Ludwikowski G, Szymanski W. [Smoking amongst women arriving at an outpatient clinic in hospital. Nicotine addiction versus disorders in the menstrual cycle]. Przegl Lek. 2008;65(10):420–423. Polish.
58. Han J, Wan M, Ma Z, Hu C, Yi H. Prediction of targets of curculigoside A in osteoporosis and rheumatoid arthritis using network pharmacology and experimental verification. Drug Des Devel Ther. 2020;14:5235–5250. doi:10.2147/DDDT.S282112
 © 2022 The Author(s). This work is published and licensed by Dove Medical Press Limited. The full terms of this license are available at https://www.dovepress.com/terms.php and incorporate the Creative Commons Attribution - Non Commercial (unported, v3.0) License.
By accessing the work you hereby accept the Terms. Non-commercial uses of the work are permitted without any further permission from Dove Medical Press Limited, provided the work is properly attributed. For permission for commercial use of this work, please see paragraphs 4.2 and 5 of our Terms.
© 2022 The Author(s). This work is published and licensed by Dove Medical Press Limited. The full terms of this license are available at https://www.dovepress.com/terms.php and incorporate the Creative Commons Attribution - Non Commercial (unported, v3.0) License.
By accessing the work you hereby accept the Terms. Non-commercial uses of the work are permitted without any further permission from Dove Medical Press Limited, provided the work is properly attributed. For permission for commercial use of this work, please see paragraphs 4.2 and 5 of our Terms.