")
Back to Journals » Diabetes, Metabolic Syndrome and Obesity » Volume 14
FOXA1 Suppresses SATB1 Transcription and Inactivates the Wnt/β-Catenin Pathway to Alleviate Diabetic Nephropathy in a Mouse Model
Received 7 April 2021
Accepted for publication 14 August 2021
Published 10 September 2021 Volume 2021:14 Pages 3975—3987
DOI https://doi.org/10.2147/DMSO.S314709
Checked for plagiarism Yes
Review by Single anonymous peer review
Peer reviewer comments 4
Editor who approved publication: Professor Ming-Hui Zou
Hong Zhu,* Jiarui Peng,* Wei Li
Department of Endocrinology, The Third People’s Hospital of Yunnan Province, Kunming, 650011, Yunnan, People’s Republic of China
*These authors contributed equally to this work
Correspondence: Wei Li
Department of Endocrinology, The Third People’s Hospital of Yunnan Province, No. 292, Beijing Road, Guandu District, Kunming, 650011, Yunnan, People’s Republic of China
Tel/Fax +86-871-63194278
Email [email protected]
Objective: Diabetic nephropathy (DN) represents the most common diabetic complication that may lead to end-stage renal disease. This work focused on the effect of FOXA1 on the DN development and the molecular mechanism.
Methods: A mouse model of DN was induced by high-fat diets and streptozotocin. The concentrations of blood glucose and urinary protein in mice, and the pathological changes in mouse kidney tissues were determined. A podocyte cell line MPC-5 was treated with high glucose (HG) to mimic a DN-like condition in vitro. FOXA1 and SATB1 were overexpressed in HG-treated MPC-5 cells and in DN mice to explore their effects on cell proliferation and apoptosis, and on pathological changes in mouse kidney tissues. The binding relationship between FOXA1 and STAB1 was predicted and validated. Activation of the Wnt/β-catenin pathway was detected.
Results: FOXA1 was poorly expressed in the kidney tissues of DN mice. Overexpression of FOXA1 reduced the concentrations of fasting blood glucose and 24-h urinary protein in mice. It also suppressed the accumulation of glomerular mesangial matrix and hyperplasia of glomerular basement membrane, and reduced collagen deposition and interstitial fibrosis in mouse kidney. Also, FOXA1 reduced HG-induced apoptosis of MPC-5 cells. FOXA1 bound to the promoter region of SATB1 for transcription suppression. Overexpression of SATB1 activated the Wnt/β-catenin pathway and blocked the protective roles of FOXA1 in DN mice and in HG-treated MPC-5 cells.
Conclusion: This study demonstrated that FOXA1 transcriptionally suppresses SATB1 expression and inactivates the Wnt/β-catenin signaling pathway, thereby inhibiting podocyte apoptosis and DN progression.
Keywords: diabetic nephropathy, FOXA1, SATB1, Wnt/β-catenin, MPC-5
Introduction
Approximately 20–40% of all diabetic patients may develop diabetic nephropathy (DN) during their disease course, leaving DN the most common diabetic complication and a threat to end-stage renal disease.1,2 Like many renal diseases, DN is characterized by proteinuria, which is frequently induced by death and loss of podocytes, followed by reduced glomerular filtration, mesangial matrix expansion glomerulosclerosis and the consequent kidney failure.3,4 Initiation and progression of DN is not always predictable and the DN development is a long-term process occurring gradually over many years.5 Several mechanisms such as activation of the profibrotic transforming growth factor beta (TGF-β) signaling,6 suppression in fibroblast growth factor receptor 1 signaling,7 loss of endothelial glucocorticoid receptor,8 and dysregulated central metabolism9 have been reported to be associated with DN development. Glucose-lowering medications such as dipeptidyl peptidase-4 inhibitors10 and sodium-glucose co-transporter type 2 inhibitors,11 renin-angiotensin system inhibitors12 and glycolysis inhibitors13 have been applied in the treatment of DN. However, there remains an urgent need to explore effective biomarkers for DN predication, and to develop novel treatment options for DN, which requires intensive understanding in the molecular mechanism involved in DN progression.
The pathogenesis of DN has been explored extensively. The phenotypic changes in metabolites, proteins, cytokines, and transcription factors are responsible for the accumulation of extracellular matrix and glomerulosclerosis, therefore are key events during DN progression.14 Forkhead Box A1 (FOXA1), a nuclear transcription factor, is widely distributed in urothelium of the bladder, ureter and renal pelvis.15 Interestingly, a type 2 diabetes-related genome-wide association study suggested FOXA1 as one of the type 2 diabetes-associated loci,16 and upregulation of FOXA1 has been demonstrated to suppress damage and apoptosis of podocytes during the process of DN.17 However, as a transcription factor, its transcriptional regulation during DN development remains unknown. Importantly, the bioinformatics analyses in the study suggested that FOXA1 owned a putative binding relationship with the promoter region of special AT-rich sequence-binding protein-1 (SATB1). SATB1 is a nuclear-matrix-binding protein accountable for the regulation of tissue-specific chromatin structure and gene expression, and it has been observed to be upregulated in a rat model with DN.18 Aberrant expression of SATB1 has also been reported to be relevant to several human cancers.19,20 Here, we aimed to validate the possible interaction between FOXA1 and SATB1, and to explore their functions in DN progression using a mouse model with DN and high glucose (HG)-treated podocytes.
Materials and Methods
Establishment of a Mouse Model with DN
A total of 50 male C57BL/6 mice (8 weeks old, 22 ± 2 g) were acquired from Vital River Laboratory Animal Technology Co., Ltd. (Beijing, China). All mice were housed at 22°C in a 12-h dark/light cycle with ad libitum access to rodent chow and water. This research was ratified by the Ethical Committee of the Third People’s Hospital of Yunnan Province. All experimental procedures were conducted in compliance with the Guide for the Care and Use of Laboratory Animals (NIH Publication No. 85–23, revised 1996) and the China Animal Welfare Legislation.
A mouse model with DN was induced by high-fat diets (HFD) and streptozotocin (STZ) injection as previously described.21 All the animal feed was purchased from Research Diets (New Brunswick, New Jersey, USA). The mice were allocated into 5 groups: control group, DN group (model group), lentiviral vector (LV)-negative control (NC) group (model mice injected with LV-NC), LV-FOXA1 (model mice injected with LV-FOXA1), LV-SATB1 (model mice injected with LV- SATB1), LV-FOXA1 + LV-SATB1 (model mice injected with LV-FOXA1 + LV-SATB1), 10 in each group. Mice in the DN group were given HFD (60% kcal from fat) for constant 2 weeks, and mice in the control group were given normal diets (ND, 10% kcal from fat). After that, mice in the DN group were intraperitoneally injected with STZ (40 mg/kg, dissolved in sodium citrate, pH = 4.5) once a day for continuous 5 days, whereas mice in the control group were injected with an equal dose of vehicle (sodium citrate, pH = 4.5). During the injection process, the mice were continuously given HFD or ND routinely. Two weeks after the last injection, the mice were housed in separate cages to have the 24-h urine samples collected. The concentration of 24-h urinary protein in all mice was determined using an enzyme-linked immunosorbent assay (ELISA) kit (Bethyl Laboratories, Inc., Montgomery, TX, USA). The blood glucose level in all mice was determined using a blood glucose meter (Accu-Chek, Roche Diagnostics GmbH, Mannheim, Germany). After that, the mice were subjected to glucose tolerance and insulin resistance tests. Then, the animals were sacrificed through administration of 150 mg/kg pentobarbital sodium via intraperitoneal injection. The kidney tissues were collected after animal death. The kidney tissues of 5 mice in each group were fixed in 10% formalin buffer for 48 h, dehydrated and embedded in paraffin for subsequent use. The kidney tissues of the rest 5 mice were stored at −80°C for Western blot analysis and reverse transcription quantitative polymerase chain reaction (RT-qPCR) assays.
Injections of LV were performed 4 times at a 3-day interval through caudal vein after the last STZ administration. The LV-FOXA1, LV-SATB1 and the LV-NC were all designed and synthesized by GenePharma Co., Ltd. (Shanghai, China). The dose for LV injection was 5×10⁸ IU.
Glucose Tolerance Test
Five mice randomly selected from each group were starved overnight (16 h). Then, the mice were intraperitoneally injected with glucose solution (100 mg/mL) at 20 μL/g body weight. At the 0, 30, 60, 90, 120 and 150 min after glucose injection, the level of blood glucose in mice was examined.
Insulin Sensitivity Test
The remaining five mice in each group were starved for 6 h (8:00 a.m. to 2:00 p.m.). Insulin was administrated into mice at 3 μg/kg body weight through intraperitoneal injection. At the 0, 15, 30, 45, 60, 75 and 90 min after injection, the level of blood glucose in mice was examined and normalized to the baseline value (0 min) to evaluate insulin sensitivity.
Hematoxylin and Eosin (HE) Staining
The kidney tissues were fixed in 10% formalin buffer for 48 h, dehydrated, embedded, and prepared as 4-μm sections. The sections were dewaxed and rehydrated, and successively stained with hematoxylin and eosin (Sigma-Aldrich Chemical Company, St Louis, MO, USA) for 10 min. The pathological changes in kidney tissues was photographed under a light microscope (Leica Biosystems Shanghai, China).
Periodic Acid-Schiff (PAS) Staining
The kidney tissue sections were dewaxed and treated with 1% periodic acid for 10 min of oxidation and then washed with distilled water. The sections were stained with Schiff’s reagent (Sigma-Aldrich) for 20 min, then counter-stained in hematoxylin for 10 min. All procedures were performed at 20°C, and the images were captured under the optical microscope.
Masson’s Trichrome Staining
The sections were first stained with hematoxylin for 10 min and then with Biebrich scarlet-acid fuchsin solution for 15 min. After that, the sections were differentiated in phosphomolybdic-phosphotungstic acid for 15 min, stained in aniline blue solution for 10 min, and differentiated in acetic acid solution for 5 min. After dehydration in 95% ethyl alcohol and absolute ethyl alcohol, the tissue sections were mounted with resinous mounting medium. The collagen was stained in blue under the microscope.
Sirius Red Staining
Interstitial fibrosis in mouse kidney tissues was examined according to the instructions of a Sirius red staining kit (SenBeiJia Biological Technology Co., Ltd., Nanjing, Jiangsu, China). In short, the paraffin-embedded kidney tissues were cut into 6-μm sections and routinely dewaxed and rehydrated. The sections were stained with Sirius red for 1 h, rinsed with 0.5% acetic acid solution, sealed with resin after the removal of redundant water, and then observed under the light microscope.
Immunohistochemical (IHC) Staining
The 4-μm sections were rehydrated, blocked with 3% H2O2 and placed in a microwave for antigen retrieval. Then, the sections were blocked in 5% bovine serum albumin for 1 h and hybridized with the primary antibodies at 4°C overnight, followed by the incubation with secondary antibody at 37°C for 45 min. Phosphate-buffered saline (PBS) was used instead of primary antibody as negative control. 3,3ʹ-diaminobenzidine (DAB) was used for color development, and the nuclei were counter-stained with hematoxylin. The staining was observed under the microscope. The positive cells were stained in dark brown. The optical density (OD) in each section was evaluated using the Image J. The primary sections used were Podocin (1:500, ab181143, Abcam Inc., Cambridge, MA, USA), FOXA1 (1:1000, ab170933, Abcam), SATB1 (1:100, ab109122, Abcam), β-catenin (1:5000, ab32572, Abcam), Collagen I (1:500, ab270993, Abcam), Fibronectin (1:100, ab2413, Abcam) and transcription factor 4 (TCF4; 1:50, MA5-35295, Thermo Fisher Scientific). The secondary antibody used was IgG H&L (HRP) (1:2000, ab205718, Abcam).
RT-qPCR
TRIzol reagent (Invitrogen, Thermo Scientific Pierce, Rockford, IL, USA) was used to extract total RNA from cells and tissues. The first-strand cDNA was obtained using a Reverse Transcriptase SuperScript III (Invitrogen). Then, real-time qPCR was performed using Power SYBR Green Master Mix (Applied Biosystems, Thermo Fisher Scientific) on an ABI PRISM 7500 real-time PCR System (Applied Biosystems) according to the kit’s instructions. The primers are listed in Table 1, where GAPDH was used as internal control. Relative RNA expression was determined using the 2−ΔΔCt method.
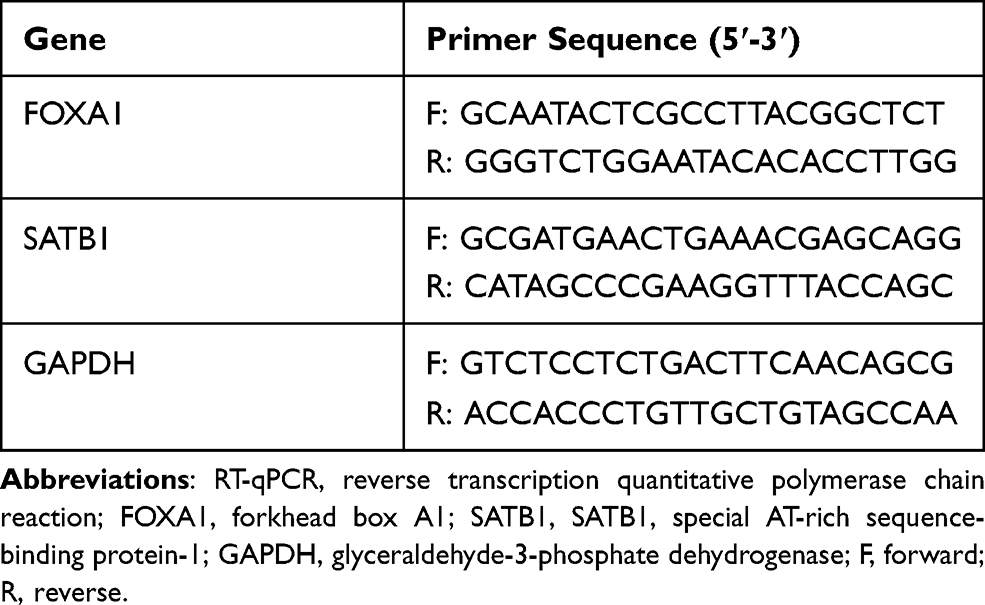 |
Table 1 Primer Sequences for RT-qPCR |
Cell Models Using HG-Treated Podocytes
A podocyte cell-line MPC-5 was acquired from the iCellBioscience Inc. (Shanghai, China). The cells were cultured and treated as previously reported.22 Briefly, the undifferentiated podocytes were cultivated in cultured dishes (BD, Biosciences, Franklin Lakes, NJ, USA) coated with collagen I. The cells were cultivated in Roswell Park Memorial Institute (RPMI)-1640 supplemented with 10% fetal bovine serum (FBS, Gibco Company, Grand Island, NY, USA), 1% penicillin/streptomycin (Gibco) and 50 IU/mL recombinant murine interferon-γ (IFN-γ) (Peprotech, Rocky Hill, CT, USA) at 33°C (permissive temperature) with 5% CO2. To induce cell differentiation, the medium was replaced by RPMI-1640 containing 5% FBS without IFN-γ, and the cells were cultured at 37 °C (nonpermissive temperature) for 10–14 days. The differentiated podocytes were treated with HG to mimic a DN-like condition in vitro. Cells were cultured in RPMI containing 5 mM glucose (Invitrogen) and 10% FBS. Cells in the normal glucose (NG) group were treated with 5 mM d-glucose, but those in the HG were treated with 30 mM d-glucose for 48 h.
3-(4, 5-Dimethylthiazol-2-Yl)-2, 5-Diphenyltetrazolium Bromide (MTT) Assay
An MTT assay kit (Sigma-Aldrich) was utilized to determine cell viability. In brief, cells (2 × 10⁴) were cultured in 96-well plates for 48 h. Each well was filled with 20 µL MTT solution (5 mg/mL in phosphate-buffered saline, Sigma-Aldrich) at 37°C for 4 h. Then, the medium was removed, and the formed formazan crystals were dissolved in dimethyl sulphoxide (DMSO, 100 µL/well). The OD at 490 nm was determined using a Bio-Rad 550 microplate reader (Bio-Rad, Hercules, CA, USA).
5-Ethynyl-2ʹ-Deoxyuridine (EdU) Labeling Assay
MPC-5 cells were cultivated in 96-well plates at 1×10⁴ cells per well. In accordance with the instructions of an EdU labelling kit (Ribobio, Guangzhou, China), cells were cultured in the medium containing 50 μM EdU solution for 12 h at 37°C with 5% CO2. Then, the MPC-5 cells were fixed for 30 min and cultured with glycine for 5 min. After that, the cells were labeled with anti-EdU working solution for 30 min and washed, and then incubated with 5 μg/mL Hoechst 33342 solution for 30 min. The labeling was observed under a confocal laser scanning microscope (Leica). The rate of EdU-positive cells in 5 random fields was calculated.
Terminal Deoxynucleotidyl Transferase (TdT)-Mediated dUTP Nick End Labeling (TUNEL)
Cell apoptosis was examined using a one-step TUNEL kit (Beyotime Biotechnology Co., Ltd, Shanghai, China) in compliance with the kit’s protocol. In brief, 2×10⁵ cells were permeabilized by 0.1% Triton X-100 on ice for 2 min and subjected to TUNEL at 37°C for 1 h. The fluorescein isothiocyanate (FITC)-labeled TUNEL-positive cells were captured under a fluorescence microscope at an excitation wavelength of 488 nm and an emission wavelength of 530 nm. The apoptotic cells were labeled in green under the microscope.
Western Blot Analysis
The podocytes were lysed in RIPA cell lysis buffer (250 μL). After centrifugation at 12,000 r/min for 20 min, the protein concentration was detected using a bicinchoninic acid kit (Thermo Fisher Scientific). Then, an equal volume (50 μg per well) of protein was separated by 12% SDS-PAGE and transferred to polyvinylidene fluoride membranes (Bio-Rad). The membranes were blocked with 5% skimmed milk at 20°C for 1 h, and then co-cultured with the primary antibodies against Podocin (1:1000, ab181143, Abcam), FOXA1 (1:1000, ab170933, Abcam), SATB1 (1:1000, ab109122, Abcam), β-catenin (1:5000, ab32572, Abcam), active (non-phospho), β-catenin (Ser33/37/Thr41) (1:1000, #8814, CST, Cell Signaling Technology (CST), Beverly, MA, USA), TCF4 (1:2000, MA5-35295, Thermo Fisher Scientific) and GAPDH (1:1000, #5174, CST) at 4°C overnight, and then with the secondary antibody goat anti-rabbit IgG H&L (HRP) (1:2000, ab205718, Abcam) at 20°C for 1 h. After that, the protein bands were visualized using an enhanced chemiluminescence kit (Thermo Fisher Scientific). Relative protein level was calculated using the Image J software according to the grey value ratio of target bands to the internal references.
Luciferase Reporter Gene Assay
The 293T cells acquired from ATCC (Manassas, VA, USA) were cultured in 24-well plates. The putative binding site between FOXA1 conservative sequence and the promoter of SATB1 was predicted of JASPAR (http://jaspar.genereg.net/). This binding site was amplified and cloned to pGL3 vectors (Promega Corp., Madison, WI, USA) to construct Promoter 1, 2 luciferase reporter vectors. The vectors were co-transfected with pcDNA or pcDNA-FOXA1 into 293T cells. After 48 h, the relative luciferase activity was determined by a firefly luciferase reporter system (Promega).
Chromatin Immunoprecipitation (ChIP)
An EZ-Magna ChIP kit (EMD Millipore, Billerica, MA, USA) was used for ChIP assay according to the kit’s instructions. In brief, the MPC-5 cells were treated with 1% formaldehyde for 10 min of crosslinking, and then quenched by glycine. The DNA fragments were obtained by ultrasonic treatment. The magnetic beads conjugated with anti-FOXA1 (1:50, ab170933, Abcam) or IgG (1:100, ab172730, Abcam) were used to produce immunoprecipitates from the cell lysates. The abundance of SATB1 promoter sequence in the precipitates was determined by qPCR.
Statistical Analysis
Data were analyzed using Prism 8.0 (GraphPad, La Jolla, CA, USA). Data were exhibited as mean ± standard deviation (SD) from three independent experiments. For parametric analysis, differences between every two groups were compared by the t-test, and those between multiple groups were analyzed by one- or two-way analysis of variance (ANOVA) followed by Tukey’s multiple comparison test. For non-parametric analysis, differences between every two groups were compared by Mann–Whitney-U test, and those between multiple groups were analyzed by Kruskal–Wallis test. The p value was obtained from two-tailed tests, and p < 0.05 represented statistical significance.
Results
FOXA1 is Poorly Expressed in the Mice with DN
As shown in Figure 1A, a mouse model with DN was induced by HFD and STZ injection. Two weeks after the last STZ injection, the concentrations of fasting blood glucose and 24-h urinary protein were significantly enhanced in the model mice compared to the control ones (Figure 1B and C). In addition, the mice with DN had significant declines in glucose tolerance and insulin sensitivity (Figure 1D and E), as manifested by a significant increase in blood glucose level in starving mice after injection of glucose or insulin, and the increased blood glucose did not recover to a standard level within a given period. Then, HE, PAS, Masson’s trichrome and Sirius red staining were performed to further explore the pathological changes in mouse kidney tissues (Figure 1F). Compared to the control mice, a significant accumulation of glomerular mesangial matrix and hyperplasia of glomerular basement membrane were observed in the kidney tissues of DN mice, along with increased collagen deposition and interstitial fibrosis. The levels of Podocin (a podocyte-specific protein), FOXA1 and interstitial fibrosis-related proteins Collagen I and Fibronectin in tissues were determined by IHC staining (Figure 1G). It was shown that the Podocin expression was significantly declined in the kidney tissues of DN mice, indicating a decline in the number of podocytes. The protein level of FOXA1 was reduced, but the levels of Collagen I and Fibronectin in tissues were significantly elevated, indicating facilitated interstitial fibrosis progression in mice. Likewise, a decline in mRNA expression of FOXA1 was also observed in the tissues of DN mice according to the RT-qPCR results (Figure 1H).
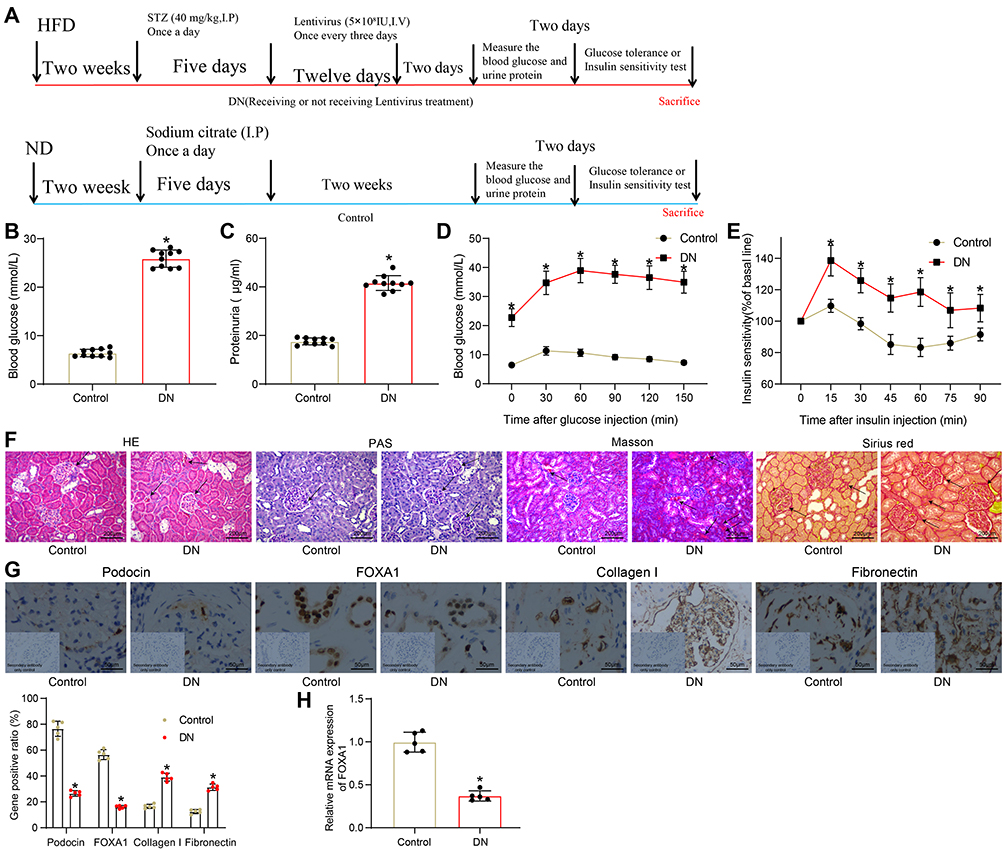 |
Figure 1 FOXA1 is poorly expressed in the mice with DN. (A) a diagram for the treatments on mice in the control group and the DN group; (B) the fasting blood glucose concentration in each group of mice (n = 10 in each group); (C) 24-h urinary protein concentration in each group of mice (n = 10 in each group); (D) glucose tolerance in each group of mice (n = 5 in each group); (E) insulin sensitivity in each group of mice (n = 5 in each group); (F) pathological changes in mouse kidney tissues determined by HE, PAS and Masson’s trichrome staining (n = 5 in each group); (E) protein levels of Podocin and FOXA1 in mouse kidney tissues examined by IHC staining (n = 5 in each group); (H) FOXA1 expression in mouse kidney tissues examined by RT-qPCR (n = 5 in each group). Data were shown as the mean ± standard deviation. Repetition = 3. Differences were analyzed by the Mann–Whitney-U test (B–E, G and H). *p < 0.05 vs control. Abbreviations: DN, diabetic nephropathy; FOXA1, forkhead box A1; HE staining, hematoxylin and eosin staining; HFD, high-fat diet; IHC, immunohistochemical staining; ND, normal diet; PAS staining, periodic acid Schiff staining; RT-qPCR, reverse transcription quantitative polymerase chain reaction. |
FOXA1 is Poorly Expressed in HG-Treated MPC-5 Cells
Differentiated MPC-5 cells were treated with HG to mimic a DN-like condition in vitro. Compared to the NG-treated cells, the MTT results showed that HG treatment reduced the viability of cells significantly (Figure 2A). Similarly, the EdU-labeling assay suggested that the DNA-replication ability of cells was significantly suppressed after HG treatment (Figure 2B). The apoptosis of cells, according to the TUNEL results, was increased in this setting (Figure 2C). Further, the protein levels of Podocin and FOXA1 in MPC-5 cells, according to the Western blot analysis, were reduced after HG treatment (Figure 2D). Still, the RT-qPCR also confirmed a decline in the mRNA expression of FOXA1 in the HG-treated MPC-5 cells (Figure 2E).
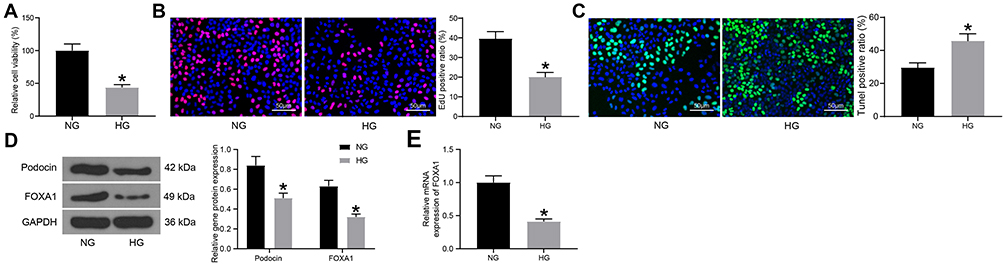 |
Figure 2 FOXA1 is poorly expressed in HG-treated MPC-5 cells. (A) viability of MPC-5 cells determined by MTT assay; (B) DNA-replication ability of MPC-5 cells measured by EdU labeling assay; (C) apoptosis in MPC-5 cells determined by TUNEL assay; (D) protein levels of Podocin and FOXA1 in MPC-5 cells detected by Western blot analysis; (E) mRNA expression of MPC-5 in MPC-5 cells detected by RT-qPCR. Data were shown as mean ± standard deviation. For all cellular experiments, three repetitions were performed. Differences were analyzed by unpaired t-test (A–C and E) or two-way ANOVA (D). *p < 0.05 vs NG. Abbreviations: ANOVA, analysis of variance; EdU, 5-ethynyl-2ʹ-deoxyuridine; FOXA1, forkhead box A1; GAPDH, glyceraldehyde-3-phosphate dehydrogenase; HG, high glucose; NG, normal glucose; RT-qPCR, reverse transcription quantitative polymerase chain reaction; TUNEL, Terminal deoxynucleotidyl transferase (TdT)-mediated dUTP nick end labeling. |
Overexpression of FOXA1 Ameliorates HG-Induced Damage in MPC-5 Cells
To confirm the potential functions of FOXA1 in DN, overexpression of FOXA1 was introduced in the differentiated MPC-5 cells through administration of pcDNA-FOXA1, and the successful upregulation was confirmed by RT-qPCR (Figure 3A). Then, the cells were treated with HG, and the viability of cells was enhanced following FOXA1 overexpression (Figure 3B). The DNA-replication ability of cells, still, was increased upon FOXA1 overexpression (Figure 3C). Also, upregulation of FOXA1 was found to reduce the HG-induced apoptosis in MPC-5 cells (Figure 3D). In this setting, the protein levels of Podocin and FOXA1 were increased in the cells (Figure 3E).
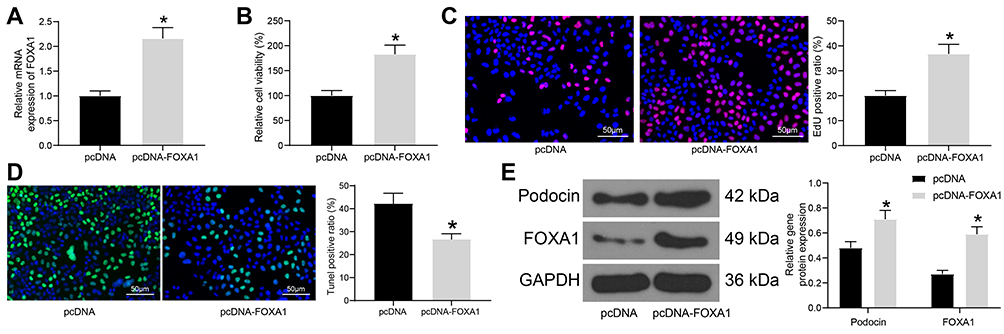 |
Figure 3 Overexpression of FOXA1 ameliorates HG-induced damage in MPC-5 cells. (A) transfection efficacy of pcDNA-FOXA1 in MPC-5 cells examined by RT-qPCR; (B) viability of MPC-5 cells determined by MTT assay; (C) DNA-replication ability of MPC-5 cells measured by EdU labeling assay; (D) apoptosis in MPC-5 cells determined by TUNEL assay; (E) protein levels of Podocin and FOXA1 in MPC-5 cells detected by Western blot analysis Data were shown as mean ± standard deviation. For all cellular experiments, three repetitions were performed. Differences were analyzed by unpaired t-test (A–C and D) or two-way ANOVA (E). *p < 0.05 vs pcDNA. Abbreviations: ANOVA, analysis of variance; EdU, 5-ethynyl-2ʹ-deoxyuridine; FOXA1, forkhead box A1; GAPDH, glyceraldehyde-3-phosphate dehydrogenase; MTT, 3-(4, 5-dimethylthiazol-2-yl)-2, 5-diphenyltetrazolium bromide; RT-qPCR, reverse transcription quantitative polymerase chain reaction; TUNEL, Terminal deoxynucleotidyl transferase (TdT)-mediated dUTP nick end labeling. |
FOXA1 Transcriptionally Suppresses SATB1 Expression
To explore the possible molecular mechanisms involved, we first acquired the conservative binding sequence of FOXA1 (Figure 4A) on the JASPAR system. Interestingly, SATB1, a gene that was reported to be upregulated in kidney tissues during DN,13 was predicted to have possible binding sites on its promoter region with FOXA1 (Figure 4B). Thereafter, we first determined the protein level of SATB1 in mouse kidney tissues using IHC staining. The expression of SATB1 was increased in the tissues from DN mice compared to the control ones (Figure 4C). Further, the SATB1 expression in MPC-5 cells was determined. Both the mRNA and protein levels of SATB1, according to the RT-qPCR and Western blot assays, respectively (Figure 4D and E), were decreased in MPC-5 cells overexpressing FOXA1. To validate the binding relationship between FOXA1 and the promoter region of SATB1, the luciferase reporter vectors (Promoter 1, 2) containing the putative binding sites were constructed (Figure 4F) and co-transfected with pcDNA-FOXA1 into 293T cells. After 48 h, it was found that pcDNA-FOXA1 significantly suppressed the luciferase activity of Promoter 1, but it showed little impact on the luciferase activity of Promoter 2 in cells (Figure 4G). Further, in the ChIP assay, an enrichment of Promoter 1 was observed in the immunoprecipitates combined by anti-FOXA1, while neither anti-FOXA1 nor IgG absorbed Promoter 2 in the precipitates (Figure 4H). Collectively, these results indicated that FOXA1 can bind to the Promoter 1 sequence on the SATB1 promoter region to suppress SATB1 transcription.
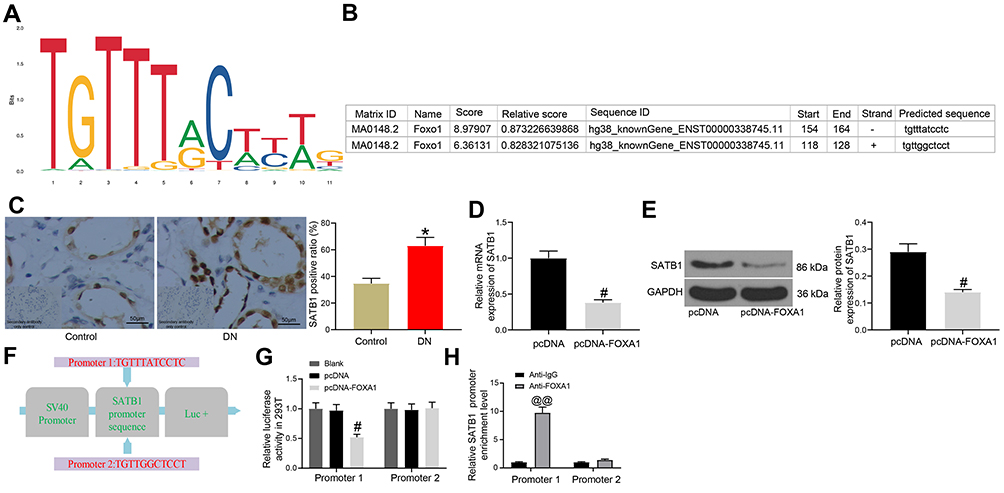 |
Figure 4 FOXA1 transcriptionally suppresses SATB1 expression. (A) conservative binding sequence of FOXA1 predicted on the JASPAR system; (B) putative binding sites between SATB1 promoter region and FOXA1 predicted on the JASPAR system; (C) protein level of SATB1 in mouse kidney tissues determined by IHC staining (n = 5 in each group); (D and E) mRNA and protein expression of SATB1 in MPC-5 cells overexpressing FOXA1 examined by RT-qPCR and Western blot analysis, respectively; (F) the constructed Promoter 1, 2 luciferase reporter vectors; (G) binding relationship between FOXA1 and the Promoter 1 and 2 validated through dual-luciferase reporter gene assays; (H) enrichment of SATB1 promoter sequences by anti-FOXA1 examined by the ChIP assay. Data were expressed as the mean ± standard deviation. For all cellular experiments, three repetitions were performed. Differences were analyzed by unpaired t-test (D and E), theMann–Whitney-U test (C) or two-way ANOVA (G and H). *p < 0.05 vs control; #p < 0.05 vs pcDNA; @@p < 0.01 vs IgG. Abbreviations: ANOVA, analysis of variance; ChIP, chromatin immunoprecipitation; DN, diabetic nephropathy; FOXA1, forkhead box A1; IgG, immunoglobulin G; IHC, immunohistochemical staining; GAPDH, glyceraldehyde-3-phosphate dehydrogenase; RT-qPCR, reverse transcription quantitative polymerase chain reaction; SATB1, special AT-rich sequence-binding protein-1. |
Overexpression of SATB1 Blocks the Protective Roles on FOXA1 in MPC-5 Cells and Activates the Wnt/β-Catenin Pathway
Following the findings above, we further explored the function of SATB1 in cells. The above FOXA1 overexpressing MPC-5 cells were additionally administrated with pcDNA-SATB1, followed by HG treatment. The mRNA expression of SATB1 in cells was successfully increased (Figure 5A). The Western blot assay results also confirmed an increased protein level of SATB1 in cells, but the protein level of Podocin was decreased (Figure 5B). In addition, the viability and DNA replication ability of MPC-5 cells enhanced by FOXA1 were blocked following further SATB1 overexpression (Figure 5C and D). Moreover, upregulation of SATB1 promoted the apoptosis rate in cells that was initially suppressed by FOXA1 (Figure 5E).
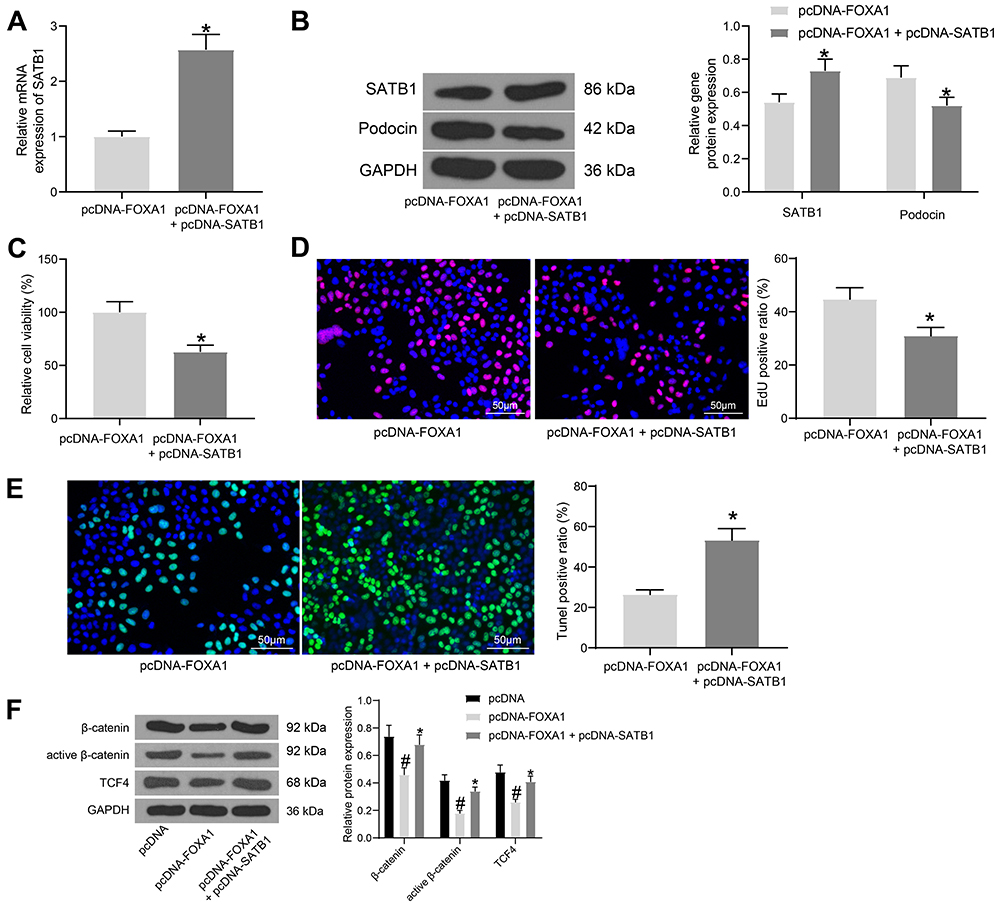 |
Figure 5 Overexpression of SATB1 blocks the protective roles on FOXA1 in MPC-5 cells and activates the Wnt/β-catenin pathway. (A) mRNA expression of SATB1 in cells after pcDNA-SATB1 administration determined by RT-qPCR; (B) protein levels of SATB1 and Podocin in cells examined by Western blot analysis; (C) viability of MPC-5 cells measured by MTT assay; (D) DNA-replication ability of MPC-5 cells detected by EdU labeling assay; (E) apoptosis in MPC-5 cells determined by TUNEL assay; (F) protein levels of total β-catenin, active (Non-phospho) β-catenin and TCF4 in MPC-5 cells examined by Western blot analysis. Data were exhibited as the mean ± standard deviation. For all cellular experiments, three repetitions were performed. Differences were analyzed by unpaired t-test (A, C, D and E) or two-way ANOVA (B and F). #p < 0.05 vs pcDNA; *p < 0.05 vs pcDNA-FOXA1. Abbreviations: ANOVA, analysis of variance; FOXA1, forkhead box A1; GAPDH, glyceraldehyde-3-phosphate dehydrogenase; MTT, 3-(4, 5-dimethylthiazol-2-yl)-2, 5-diphenyltetrazolium bromide; RT-qPCR, reverse transcription quantitative polymerase chain reaction; SATB1, special AT-rich sequence-binding protein-1; TCF4, transcription factor 4; TUNEL, Terminal deoxynucleotidyl transferase (TdT)-mediated dUTP nick end labeling. |
The previous studies indicated that SATB1 was an activator of the Wnt/β-catenin signaling pathway,23–25 and this signaling has been well demonstrated to aggravate podocyte damage.26,27 Here, the Western blot analysis was performed, which indicated that the levels of Wnt/β-catenin downstream proteins including total β-catenin, the active (Non-phospho) β-catenin and TCF4 in MPC-5 cells were initially suppressed by FOXA1 but then recovered after SATB1 overexpression (Figure 5F).
FOXA1 Suppresses SATB1 Transcription and Inactivates the Wnt/β-Catenin Pathway to Alleviate DN in Mice
To further validate whether inhibition of the SATB1-Wnt/β-catenin axis is implicated in FOXA1-mediated protective events in DN, in vivo experiments were performed. After STZ injection, the mice were further administrated with LV-NC, LV-FOXA1, LV-SATB1 or LV-FOXA1 + LV-SATB1 through caudal veins. In addition, Control mice were set as negative control, and DN mice were set as positive control. Two weeks later, the concentrations of fasting blood glucose and 24-h urinary protein in DN mice were determined. Compared to LV-NC injection, LV-SATB1 further aggravated the rise in blood glucose and 24-h urinary protein in DN mice. LV-FOXA1 significantly reduced the blood glucose and 24-h urinary protein levels, but this reduction was blocked after further administration of LV-SATB1 (Figure 6A and B). The protein levels of FOXA1, SATB1, Podocin, β-catenin, Collagen I, Fibronectin and TCF4 in mouse kidney tissues were detected by IHC staining. Control mice and untreated DN mice were included as negative and positive controls, respectively. Compared to LV-NC injection, LV-FOXA1 led to an increase in the expression of FOXA1 and Podocin whereas a decline in the expression of SATB1, β-catenin, Collagen I, Fibronectin and TCF4 in tissues of DN mice. LV-SATB1 injection, either administrated alone or following LV-FOXA1, significantly elevated the levels of SATB1, β-catenin, Collagen I, Fibronectin and TCF4 but reduced the level of Podocin in DN mice. (Figure 6C). In addition, the HE, PAS Masson’s trichrome and Sirius red staining results showed that the pathological changes including accumulation of glomerular mesangial matrix, hyperplasia of glomerular basement membrane, and increased collagen deposition and interstitial fibrosis in mouse tissues were ameliorated by LV-FOXA1. However, the protective functions of LV-FOXA1 on kidney injury were blocked by LV-SATB1 again (Figure 6D). Also, injection of LV-SATB1 alone aggravated the kidney injury in mice with DN.
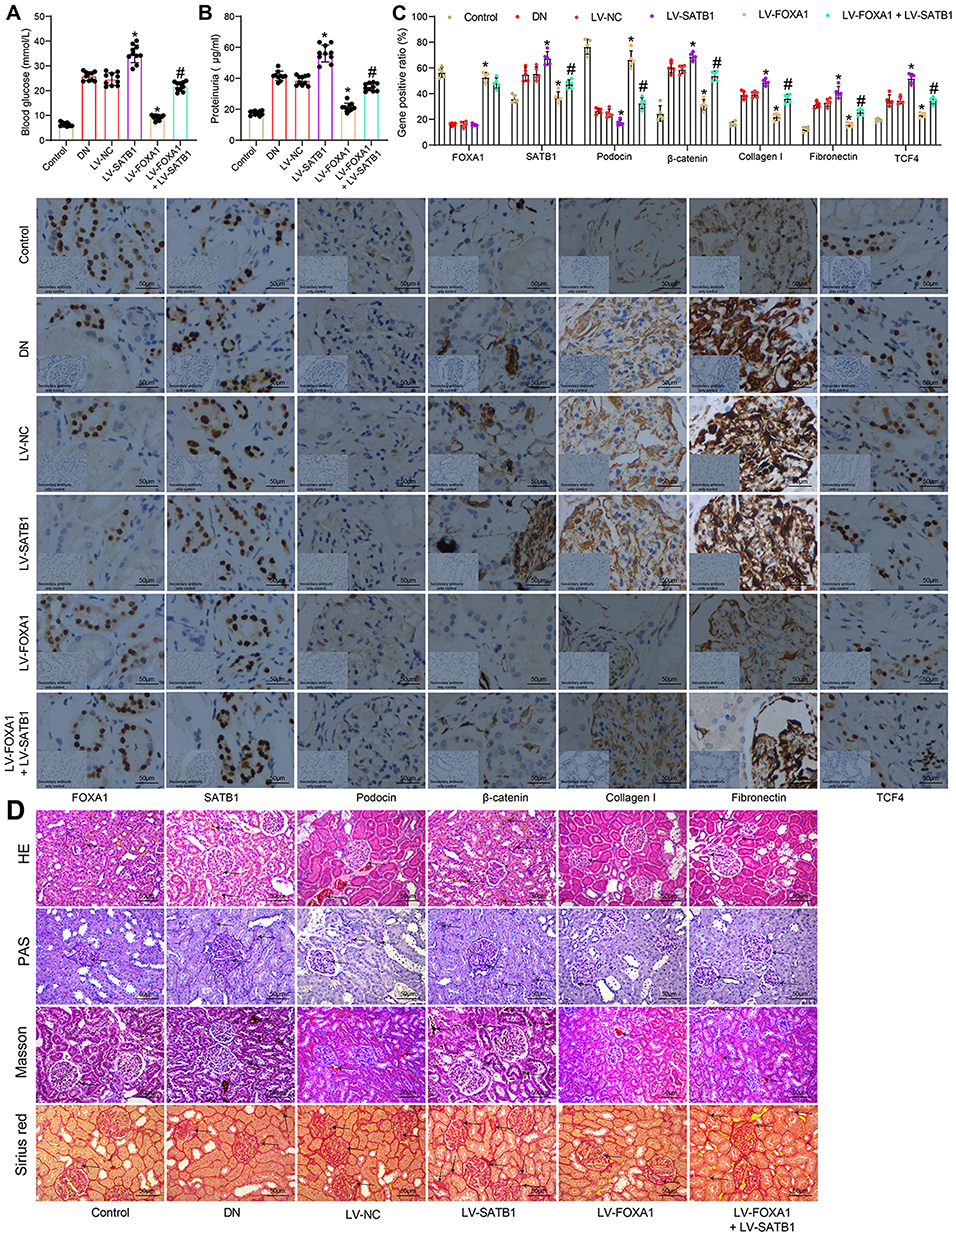 |
Figure 6 FOXA1 suppresses SATB1 transcription and inactivates the Wnt/β-catenin pathway to alleviate DN in mice. (A) the fasting blood glucose concentration in each group of mice (n = 10 in each group); (B) 24-h urinary protein concentration in each group of mice (n = 10 in each group); (C) protein levels of FOXA1, SATB1, Podocin, β-catenin, Collagen I, Fibronectin and TCF4 in mouse kidney tissues determined by IHC staining (n = 5 in each group); (D) pathological changes in mouse kidney tissues determined by HE, PAS, Masson’s trichrome and Sirius red staining (n = 5 in each group). Data were presented as the mean ± standard deviation. Differences were analyzed by Kruskal–Wallis test (A–C). *p < 0.05 vs LV-NC; #p < 0.05 vs LV-FOXA1. Abbreviations: DN, diabetic nephropathy; FOXA1; forkhead box A1; HE staining, hematoxylin and eosin staining; IHC, immunohistochemical staining; LV, lentiviral vector; NC, negative control; PAS staining, periodic acid Schiff staining; TCF4, transcription factor 4. |
Discussion
Given the increasing occurrence of diabetics and high sensitivity of kidneys to haemodynamic and metabolic alterations, it is expected that DN will progress toward pandemic proportions.28 DN remains a huge healthy concern with limited therapeutic strategies. This study demonstrated that FOXA1 suppresses SATB1 transcription and inactivates the Wnt/β-catenin pathway to reduce pathological symptoms in a mouse model with DN and reduce HG-induced podocyte apoptosis.
The successful establishment of the mouse model with DN was manifested by the presence of proteinuria, glomerular mesangial matrix accumulation, glomerular basement membrane hyperplasia, collagen deposition and interstitial fibrosis. Then, decreased levels of Podocin and FOXA1 were observed in mouse kidney tissues. Podocin is one of the major podocyte-associated protein molecules and is mainly expressed and works in glomerular filtration system.29 In vitro, the levels of Podocin and FOXA1 were reduced in HG-induced podocytes, which was partially in line with a recent report.30 As previously reported, FOXA1 was suggested as a type 2 diabetes-associated loci.16 Here, we observed that artificial upregulation of FOXA1 reduced the pathological symptoms in mouse kidney tissues. In addition, FOXA1 upregulation reduced apoptosis while increased the DNA-replication ability and Podocin expression in HG-treated podocytes. A recent study by Liu et al suggested that upregulation of FOXA1 after long noncoding RNA PVT1 silencing suppressed injury and apoptosis of podocytes.17 Here, this study preliminarily confirmed the protective effects of FOXA1 on podocytes in vitro, and on kidney injury in vivo.
The following prediction using the bioinformatic system Jaspar suggested that FOXA1 owned a binding relationship with the promoter region of SATB1. SATB1 has been frequently observed to be highly expressed in cancer cells and exerted an oncogenic role that promoted cancer cell aggressiveness and indicated poor prognosis in patients.24,31,32 However, SATB1 is suggested to be expressed at a low level in healthy cells.33 Importantly, SATB1 expression was suggested to be significantly increased in diabetic rats two weeks after diabetes mellitus induction.18 In a study by Vitlov et al, the authors also increased immunofluorescence intensity of SATB1 in the distal tubular cells in kidney tissues of the diabetic rats compared to the non-diabetic ones.34 In the present study, we first confirmed the binding relationship between FOXA1 and SATB1 through luciferase and ChIP assays. Also, high expression of FOXA1 in MPC-5 cells suppressed SATB1 expression, while further overexpression of SATB1 blocked the protective roles of FOXA1 in HG-treated podocytes, including increased cell apoptosis, and reduced cell proliferation and Podocin expression.
SATB1 has been well documented as a positive regulator of the Wnt/β-catenin signaling pathway.23–25 The Wnt signaling is an evolutionarily conserved cellular communication pathway that exerts crucial functions in proper animal development, tissue homeostasis, while misregulation of this signaling is frequently linked to human diseases.35 Also, aberrant activation of Wnt/β-catenin is correlated with the progression of renal fibrotic lesions after injury, and this signaling is frequently activated in multiple experimental models of chronic kidney disease and in human nephropathies.36–38 In addition, the Wnt/β-catenin pathway is closely linked to damage and apoptosis of podocytes.39,40 To validate if there is a similar SATB1/Wnt/β-catenin network in DN, we detected the β-catenin expression in HG-treated podocytes. It was found that the β-catenin expression in cells was initially suppressed upon FOXA1 upregulation but then recovered when SATB1 was further upregulated. The in vitro results were reproduced in vivo, where upregulation of FOXA1 reduced expression of Podocin and β-catenin in mouse kidney tissues. Again, further upregulation of SATB1 increased the β-catenin expression, and the pathological symptoms in mice were aggravated in this setting. Knockdown of the Wnt/β-catenin signaling by endothelial glucocorticoid receptor has been reported to inverse the fibrogenic phenotype in the kidney tissues of diabetic mice.8 Here, we observed that FOXA1 could led to Wnt inactivation. There may be interactions between FOXA1 and glucocorticoid receptors or other Wnt/β-catenin inhibitors that regulate the phenotype of DN. We would like to investigate this issue in future studies.
Conclusion
In summary, our current study demonstrated that an alleviatory effect of FOXA1 on DN through transcriptional suppression of SATB1 and the subsequent inactivation of the Wnt/β-catenin pathway, and this was applied in both in vivo and in vitro models. We hope this study may offer new hope for treating DN that FOXA1 upregulation may serve as a therapeutic option in the management of DN. FOXA1 may also interact with other Wnt/β-catenin inhibitors to inverse the fibrogenic phenotype in DN. We hope more studies will be carried out to validate our findings and to confirm the potential protective role of FOXA1 against DN.
Acknowledgments
This work was supported by Scientific Research Fund Project of Yunnan Education Department (2019J0793).
Disclosure
The authors declare no conflict of interest.
References
1. Sanajou D, Ghorbani Haghjo A, Argani H, Aslani S. AGE-RAGE axis blockade in diabetic nephropathy: current status and future directions. Eur J Pharmacol. 2018;833:158–164. doi:10.1016/j.ejphar.2018.06.001
2. Sinha N, Kumar V, Puri V, et al. Urinary exosomes: potential biomarkers for diabetic nephropathy. Nephrology. 2020;25(12):881–887. doi:10.1111/nep.13720
3. Giralt-Lopez A, Molina-van den Bosch M, Vergara A, et al. Revisiting experimental models of diabetic nephropathy. Int J Mol Sci. 2020;21(10):3587. doi:10.3390/ijms21103587
4. Tung CW, Hsu YC, Shih YH, Chang PJ, Lin CL. Glomerular mesangial cell and podocyte injuries in diabetic nephropathy. Nephrology. 2018;23(Suppl 4):32–37. doi:10.1111/nep.13451
5. Tesch GH. Diabetic nephropathy - is this an immune disorder? Clin Sci. 2017;131(16):2183–2199. doi:10.1042/CS20160636
6. Horikoshi S, Fukuda N, Tsunemi A, et al. Contribution of TGF-β1 and effects of gene silencer pyrrole-imidazole polyamides targeting TGF-β1 in diabetic nephropathy. Molecules. 2020;25(4):950. doi:10.3390/molecules25040950
7. Zou XR, Zhan LR, Chen L, et al. Influence of the Klotho/FGF23/Egr1 signaling pathway on calcium-phosphorus metabolism in diabetic nephropathy and the intervention of Shenyuan granules. J Biol Regul Homeost Agents. 2019;33(6):1695–1702.
8. Srivastava SP, Zhou H, Setia O, et al. Loss of endothelial glucocorticoid receptor accelerates diabetic nephropathy. Nat Commun. 2021;12(1):2368. doi:10.1038/s41467-021-22617-y
9. Wada J, Makino H. Inflammation and the pathogenesis of diabetic nephropathy. Clin Sci. 2013;124(3):139–152. doi:10.1042/CS20120198
10. Hasan AA, Hocher B. Role of soluble and membrane-bound dipeptidyl peptidase-4 in diabetic nephropathy. J Mol Endocrinol. 2017;59(1):R1–R10. doi:10.1530/JME-17-0005
11. Elkazzaz SK, Khodeer DM, El Fayoumi HM, Moustafa YM. Role of sodium glucose cotransporter type 2 inhibitors dapagliflozin on diabetic nephropathy in rats; Inflammation, angiogenesis and apoptosis. Life Sci. 2021;280:119018. doi:10.1016/j.lfs.2021.119018
12. Pradeep SR, Barman S, Srinivasan K. Attenuation of diabetic nephropathy by dietary fenugreek (Trigonella foenum-graecum) seeds and onion (Allium cepa) via suppression of glucose transporters and renin-angiotensin system. Nutrition. 2019;67–68:110543. doi:10.1016/j.nut.2019.06.024
13. Zeng H, Qi X, Xu X, Wu Y. TAB1 regulates glycolysis and activation of macrophages in diabetic nephropathy. Inflamm Res. 2020;69(12):1215–1234. doi:10.1007/s00011-020-01411-4
14. Conserva F, Pontrelli P, Accetturo M, Gesualdo L. The pathogenesis of diabetic nephropathy: focus on microRNAs and proteomics. J Nephrol. 2013;26(5):811–820. doi:10.5301/jn.5000262
15. Varley CL, Bacon EJ, Holder JC, Southgate J. FOXA1 and IRF-1 intermediary transcriptional regulators of PPARgamma-induced urothelial cytodifferentiation. Cell Death Differ. 2009;16(1):103–114. doi:10.1038/cdd.2008.116
16. Cheng M, Liu X, Yang M, Han L, Xu A, Huang Q. Computational analyses of type 2 diabetes-associated loci identified by genome-wide association studies. J Diabetes. 2017;9(4):362–377. doi:10.1111/1753-0407.12421
17. Liu DW, Zhang JH, Liu FX, et al. Silencing of long noncoding RNA PVT1 inhibits podocyte damage and apoptosis in diabetic nephropathy by upregulating FOXA1. Exp Mol Med. 2019;51(8):1–15. doi:10.1038/s12276-019-0259-6
18. Delic Jukic IK, Kostic S, Filipovic N, et al. Changes in expression of special AT-rich sequence binding protein 1 and phosphatase and tensin homologue in kidneys of diabetic rats during ageing. Nephrol Dial Transplant. 2018;33(10):1734–1741. doi:10.1093/ndt/gfy003
19. Ge H, Yan Y, Yan M, Guo L, Mao K. Special AT-rich sequence binding-protein 1 (SATB1) correlates with immune infiltration in breast, head and neck, and prostate cancer. Med Sci Monit. 2020;26:e923208. doi:10.12659/MSM.923208
20. Huang C, Qin X, Zhao N, Jin H, Zhang S, Yang H. MicroRNA-100 functions as a tumor suppressor in cervical cancer via downregulating the SATB1 expression and regulating AKT/mTOR signaling pathway and epithelial-to-mesenchymal transition. Oncol Lett. 2020;20(2):1336–1344. doi:10.3892/ol.2020.11686
21. Chen Z, Sun X, Chen Q, et al. Connexin32 ameliorates renal fibrosis in diabetic mice by promoting K48-linked NADPH oxidase 4 polyubiquitination and degradation. Br J Pharmacol. 2020;177(1):145–160. doi:10.1111/bph.14853
22. Shankland SJ, Pippin JW, Reiser J, Mundel P. Podocytes in culture: past, present, and future. Kidney Int. 2007;72(1):26–36. doi:10.1038/sj.ki.5002291
23. Ma X, Yan W, Dai Z, et al. Baicalein suppresses metastasis of breast cancer cells by inhibiting EMT via downregulation of SATB1 and Wnt/beta-catenin pathway. Drug Des Devel Ther. 2016;10:1419–1441. doi:10.2147/DDDT.S102541
24. Ning MY, Cheng ZL, Zhao J. MicroRNA-448 targets SATB1 to reverse the cisplatin resistance in lung cancer via mediating Wnt/beta-catenin signalling pathway. J Biochem. 2020;168(1):41–51. doi:10.1093/jb/mvaa024
25. Rao H, Bai Y, Li Q, et al. SATB1 downregulation induced by oxidative stress participates in trophoblast invasion by regulating beta-catenin. Biol Reprod. 2018;98(6):810–820. doi:10.1093/biolre/ioy033
26. Dai C, Stolz DB, Kiss LP, Monga SP, Holzman LB, Liu Y. Wnt/beta-catenin signaling promotes podocyte dysfunction and albuminuria. J Am Soc Nephrol. 2009;20(9):1997–2008. doi:10.1681/ASN.2009010019
27. Li Z, Xu J, Xu P, Liu S, Yang Z. Wnt/beta-catenin signalling pathway mediates high glucose induced cell injury through activation of TRPC6 in podocytes. Cell Prolif. 2013;46(1):76–85. doi:10.1111/cpr.12010
28. Magee C, Grieve DJ, Watson CJ, Brazil DP. Diabetic nephropathy: a tangled web to unweave. Cardiovasc Drugs Ther. 2017;31(5–6):579–592. doi:10.1007/s10557-017-6755-9
29. Hu Y, Ye S, Xing Y, Lv L, Hu W, Zhou W. Saxagliptin attenuates glomerular podocyte injury by increasing the expression of renal nephrin and podocin in type 2 diabetic rats. Acta Diabetol. 2020;57(3):279–286. doi:10.1007/s00592-019-01421-7
30. Lu XY, Liu BC, Cao YZ, et al. High glucose reduces expression of podocin in cultured human podocytes by stimulating TRPC6. Am J Physiol Renal Physiol. 2019;317(6):F1605–F1611. doi:10.1152/ajprenal.00215.2019
31. Choudhary D, Clement JM, Choudhary S, et al. SATB1 and bladder cancer: is there a functional link? Urol Oncol. 2018;36(3):93e13–93e21. doi:10.1016/j.urolonc.2017.10.004
32. Xu HY, Xue JX, Gao H, et al. Fluvastatin-mediated down-regulation of SATB1 affects aggressive phenotypes of human non-small-cell lung cancer cell line H292. Life Sci. 2019;222:212–220. doi:10.1016/j.lfs.2018.12.022
33. Zhang S, Gao X, Ma Y, et al. Expression and significance of SATB1 in the development of breast cancer. Genet Mol Res. 2015;14(2):3309–3317. doi:10.4238/2015.April.13.10
34. Vitlov Uljevic M, Starcevic K, Masek T, et al. Dietary DHA/EPA supplementation ameliorates diabetic nephropathy by protecting from distal tubular cell damage. Cell Tissue Res. 2019;378(2):301–317. doi:10.1007/s00441-019-03058-y
35. Anthony CC, Robbins DJ, Ahmed Y, Lee E. Nuclear regulation of Wnt/β-catenin signaling: it’s a complex situation. Genes. 2020;11(8):886. doi:10.3390/genes11080886
36. Chen DQ, Cao G, Chen H, et al. Gene and protein expressions and metabolomics exhibit activated redox signaling and wnt/β-catenin pathway are associated with metabolite dysfunction in patients with chronic kidney disease. Redox Biol. 2017;12:505–521. doi:10.1016/j.redox.2017.03.017
37. Zhou L, Liu Y. Wnt/β-catenin signaling and renin–angiotensin system in chronic kidney disease. Curr Opin Nephrol Hypertens. 2016;25(2):100–106. doi:10.1097/MNH.0000000000000205
38. Zuo Y, Liu Y. New insights into the role and mechanism of Wnt/β-catenin signalling in kidney fibrosis. Nephrology. 2018;23(Suppl 4):38–43. doi:10.1111/nep.13472
39. Chen L, Chen DQ, Wang M, et al. Role of RAS/Wnt/β-catenin axis activation in the pathogenesis of podocyte injury and tubulo-interstitial nephropathy. Chem Biol Interact. 2017;273:56–72. doi:10.1016/j.cbi.2017.05.025
40. Zhang H, Luo W, Sun Y, et al. Wnt/beta-catenin signaling mediated-UCH-L1 expression in podocytes of diabetic nephropathy. Int J Mol Sci. 2016;17(9):1404.
 © 2021 The Author(s). This work is published and licensed by Dove Medical Press Limited. The full terms of this license are available at https://www.dovepress.com/terms.php and incorporate the Creative Commons Attribution - Non Commercial (unported, v3.0) License.
By accessing the work you hereby accept the Terms. Non-commercial uses of the work are permitted without any further permission from Dove Medical Press Limited, provided the work is properly attributed. For permission for commercial use of this work, please see paragraphs 4.2 and 5 of our Terms.
© 2021 The Author(s). This work is published and licensed by Dove Medical Press Limited. The full terms of this license are available at https://www.dovepress.com/terms.php and incorporate the Creative Commons Attribution - Non Commercial (unported, v3.0) License.
By accessing the work you hereby accept the Terms. Non-commercial uses of the work are permitted without any further permission from Dove Medical Press Limited, provided the work is properly attributed. For permission for commercial use of this work, please see paragraphs 4.2 and 5 of our Terms.