")
Back to Journals » International Journal of Nanomedicine » Volume 10 » Issue 1
Formulation optimization of galantamine hydrobromide loaded gel drug reservoirs in transdermal patch for Alzheimer’s disease
Authors Woo F, Basri M, Fard Masoumi HR, Ahmad M, Ismail M
Received 3 January 2015
Accepted for publication 24 February 2015
Published 5 June 2015 Volume 2015:10(1) Pages 3879—3886
DOI https://doi.org/10.2147/IJN.S80253
Checked for plagiarism Yes
Review by Single anonymous peer review
Peer reviewer comments 3
Editor who approved publication: Dr Thomas Webster
Fong Yen Woo,1 Mahiran Basri,1,2 Hamid Reza Fard Masoumi,1 Mansor B Ahmad,1 Maznah Ismail2
1Department of Chemistry, Faculty of Science, 2Laboratory of Molecular Biomedicine, Institute of Bioscience, Universiti Putra Malaysia, Serdang, Selangor, Malaysia
Abstract: Galantamine hydrobromide (GH) is an effective drug for Alzheimer’s disease. It is currently delivered via the oral route, and this might cause nausea, vomiting, and gastrointestinal disturbance. In the present work, GH was formulated in a gel-type drug reservoir and then optimized by using response surface methodology (RSM) based on central composite design. This optimization study involved three independent variables (carbopol amount, triethanolamine amount, and GH amount) and two dependent variables (cumulative drug release amount at 8 hours and the permeation flux of drug). Two models using expert design software were fitted into a quadratic polynomial model. The optimized gel was formulated with 0.89% w/w carbopol, 1.16% w/w triethanolamine, and 4.19% w/w GH. Optimization analysis revealed that the proposed formulation has the predicted cumulative drug release amount at 8 hours of 17.80 mg·cm-2 and the predicted permeation flux of 2.27 mg·cm-2/h. These predicted values have good agreement to actual cumulative drug release amount at 8 hours (16.93±0.08 mg·cm-2) and actual permeation flux (2.32±0.02 mg·cm-2/h). This optimized reservoir formulation was then fabricated in the transdermal patch system. This patch system has moderate pH, high drug content, and controlled drug-release pattern. Thus, this patch system has the potential to be used as the drug carrier for the treatment of Alzheimer’s disease.
Keywords: response surface methodology, central composite design, analysis of variance, Franz diffusion cell
Introduction
Alzheimer’s disease (AD) is a deteriorative, irreversible, and incurable neurodegenerative disease.1 World Alzheimer’s report stated that about 44 million people worldwide suffered from AD and other dementias in the year 2013. The number of people with AD is expected to increase drastically to 135 million in the year 2050.2 The main reason for AD is the formation and deposition of beta amyloid peptide in the brain. The deposition then causes neuritic plaques and neurofibrillary tangles formation, cholinergic neurons degeneration, neurotransmitter deficiency, neuron death, and brain cell death.3–5 These severe effects account for the symptoms in AD, such as memory impairment and problems with daily activities.6
Galantamine hydrobromide (GH) is one of the Food and Drug Administration (FDA) approved drugs for AD.1,7 It is a neuroactive drug capable of passing through the blood–brain barrier and can slow down the effects of AD. GH is categorized in the class of acetylcholinesterase inhibitor (AChEI). The drug works by inhibiting the acetylcholinesterase enzyme (AChE), a degradative enzyme in the brain. The neurotransmitter acetylcholine (ACh) is not hydrolyzed into inactive molecules and thus carries out its cognitive functions in the brain.3,4 Kumar et al and Suh et al reported that the GH and its derivatives can provide effective treatments in behavioral, functional, and cognitive symptoms of AD.3,8
GH is delivered orally, in solution, and tablet forms. These drug delivery systems can cause some unwanted side effects to the patients, such as gastrointestinal disturbances, disturbed sleep, nausea, vomiting, restlessness, hypersalivation, and hyperhidrosis.5,9 These side effects can be avoided if a transdermal patch drug delivery system is applied. The transdermal patch drug delivery system can be defined as a multilayered system that delivers drugs to the targeted cells or organs by passing through the human body’s biggest organ, skin. The patch system is reported to be with fewer side effects as compared to conventional drug delivery systems. In addition, the patch system facilitates patient compliance, requires less frequent dosing, and allows a longer duration of treatment to be administered.10
A transdermal patch consists of three basic components, namely, polymers, drugs, and penetration enhancers formulated to a gel-type drug reservoir layer in the multilayered patch system. The multilayered patch is made up of an impermeable backing layer, a drug reservoir layer, and a release liner. The most important layer in the patch is the drug reservoir layer as it is the carrier of drug molecules. This drug reservoir should possess characteristics that support effective controlled drug release, and should be nonirritating, nontoxic, and compatible with the other layers in the patch.11,12
Formulation optimization was done by using the response surface methodology (RSM). RSM is a multivariate experiment study that involves mathematical and statistical techniques. A model is created from a series of experimental works that can provide the best response for the purpose of optimization. RSM gives researchers a good way to investigate the interactions between independent variables (factors) and dependent variables (responses). It also significantly reduces the number of experiments that have to be conducted by researchers and thus it is less time consuming.13–17
In this present work, the gel drug reservoir was formulated and the compositions of this reservoir were optimized by using RSM. Central composite design (CCD) was used to study the interactions between independent variables (carbopol amount, triethanolamine amount, and GH amount) and dependent variables (cumulative drug release at 8 hours and permeation flux). An analysis of variances (ANOVA) has also been carried out to determine the significance of each term in the resulting mathematical models. The optimized gel formulation obtained was then loaded into the transdermal patch system with characteristics such as suitable pH for skin, high drug content, and controlled drug release.
Materials and methods
Materials
GH was bought from Xi’an Yiyang Bio-Tech Co., Ltd (Xi’an City, People’s Republic of China). Carbopol® 940 was purchased from Fisher Scientific (Waltham, MA, USA). Triethanolamine, propylene glycol, sodium chloride, potassium chloride, monopotassium phosphate, disodium monohydrogen phosphate, and sodium hydroxide were purchased from Merck (Darmstadt, Germany). Trifluoroacetic acid and acetonitrile were purchased from Avantor Performance Materials (Center Valley, PA, USA). Cushioned dressing pad was bought from Planet Medical Products Co., Ltd (Suzhou, People’s Republic of China), and Opsite Flexigrid was purchased from Smith & Nephew Medical Ltd (UK). All solvents used are high-performance liquid chromatography (HPLC) or analytical grade without any need for further purification.
Formulation of gel-type drug reservoir
A gel-type drug reservoir composed of carbopol (polymer), GH (drug), triethanolamine (neutralizer), propylene glycol (chemical penetration enhancer), and deionized water was formulated. These components were mixed homogeneously until a translucent drug-loaded gel was formed.
Experimental design and statistical analysis
Formulation optimization of gel-type drug reservoirs was performed by using RSM based on CCD. CCD involved full factorial and star design points along six replicates in the center. A design matrix consisting of 20 experiments was generated using Design-Expert® 6.0.6 software (State-Ease Inc., Statistics Made Easy, Minneapolis, MN, USA). This design involved three independent variables, namely, carbopol amount (x1), triethanolamine amount (x2), and GH amount (x3). Coded levels for each independent variable are shown in Table 1. The dependent variables are cumulative drug release amount at 8 hours (Y1) and the permeation flux of drug (Y2).
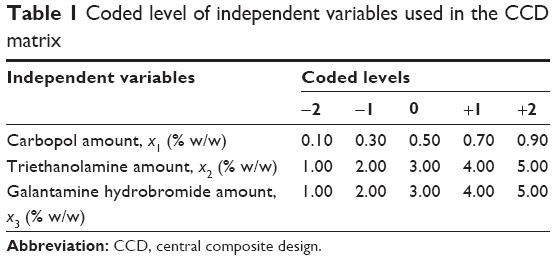 | Table 1 Coded level of independent variables used in the CCD matrix |
The interactions between independent variables and dependent variables were predicted by a second-order polynomial model equation:
|
|
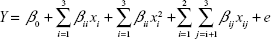
where Y is dependent variable; xi and xj are independent variables; β0, βi, βii, and βij are regression coefficients; and e is the error of the model.15,16 The significance of each term comprising the mathematical model was investigated by determining the correlation coefficient (R2) and the ANOVA at 95% level of confidence. The obtained models were then represented by using three-dimensional contour plots, which can be used to determine optimum compositions.
In vitro release of GH
The release of GH from the gel-type drug reservoir was analyzed by using Franz diffusion cells (PermeGear, V9A). The receptor compartment (volume of 20.1 cm3 and effective diffusion area of 4.9 cm2) consists of phosphate buffer (pH 7.4), which was maintained at 37°C±0.5°C and agitated by a magnetic stirrer. The donor compartment consists of 2 g of drug-loaded gel. The receptor and donor compartments were separated by a cellulose acetate membrane with 0.2 μm pore size, and 0.5 mL samples were collected at one-hour intervals for 8 hours. Next, 0.5 mL fresh phosphate buffer was injected into the receptor compartment to replace collected samples.
Fabrication of transdermal patch
The patch system comprises three layers, namely, the backing layer, drug reservoir layer, and release liner. The drug reservoir layer was made up of sterile cotton and formulated gel. Gel (2 g) prepared earlier was allowed to be absorbed into a cushioned dressing pad. The drug reservoir was then sandwiched between the backing layer and release liner of Opsite Flexigrid. The size and thickness of the patch were then measured. Visual observation was carried out to ensure that there were no drug crystals on the patch.
Comparison between optimized gel and patch formulations
The pH, drug content, drug release amount at 8 hours, and permeation flux of the optimized gel drug reservoir and patch formulations were measured. Analyses of pH and drug content were carried by diluting the gel and dispersing the patch using deionized water with a dilution factor of 100. The suspensions formed were then measured by using a pH meter (Delta 320; Mettler Toledo) and HPLC. The drug release amount at 8 hours and permeation flux of gel and patch formulations were studied by using Franz diffusion cells and HPLC analysis.
Analytical method
Samples withdrawn from Franz diffusion cells were analyzed by using Waters 1525 HPLC system along with Waters 2489 UV/Vis detector. The isocratic, reversed phase HPLC system consists of Agilent Eclipse XDB RF C18 column (5 μm, 4.6×150 mm). A mixture of trifluoroacetic acid/water/acetonitrile (0.01/85/15 v/v) was used as the mobile phase, with a flow rate of 1 mL/min. The wavelength was set at 290 nm for GH detection. GH release was calculated according to the standard calibration curve with a line equation (y=884.86x−16,100) and correlation coefficient (R2=0.9956) in the range of 100–1,000 mg/L.
Results and discussion
Formulation of gel-type drug reservoir
In this work, a gel-type drug reservoir consisting of carbopol polymer, triethanolamine, GH, propylene glycol, and deionized water was formulated. The formulated gel is translucent, smooth, and physically stable for at least 6 months under room temperature.
RSM models fitting and ANOVA
Table 2 shows 20 experiments in the different formulations and the results obtained according to the CCD matrix. These experimental data were then fitted into four models, namely, the linear, two-factorial interaction (2FI), quadratic, and cubic models. The model fittings for both dependent variables (cumulative drug release amount at 8 hours and permeation flux) showed both responses fitted well to the quadratic polynomial model. The quadratic model had coefficients of determination greater than 0.90 for cumulative drug release amount at 8 hours (R2=0.9671) and permeation flux (R2=0.9649) compared to other models.
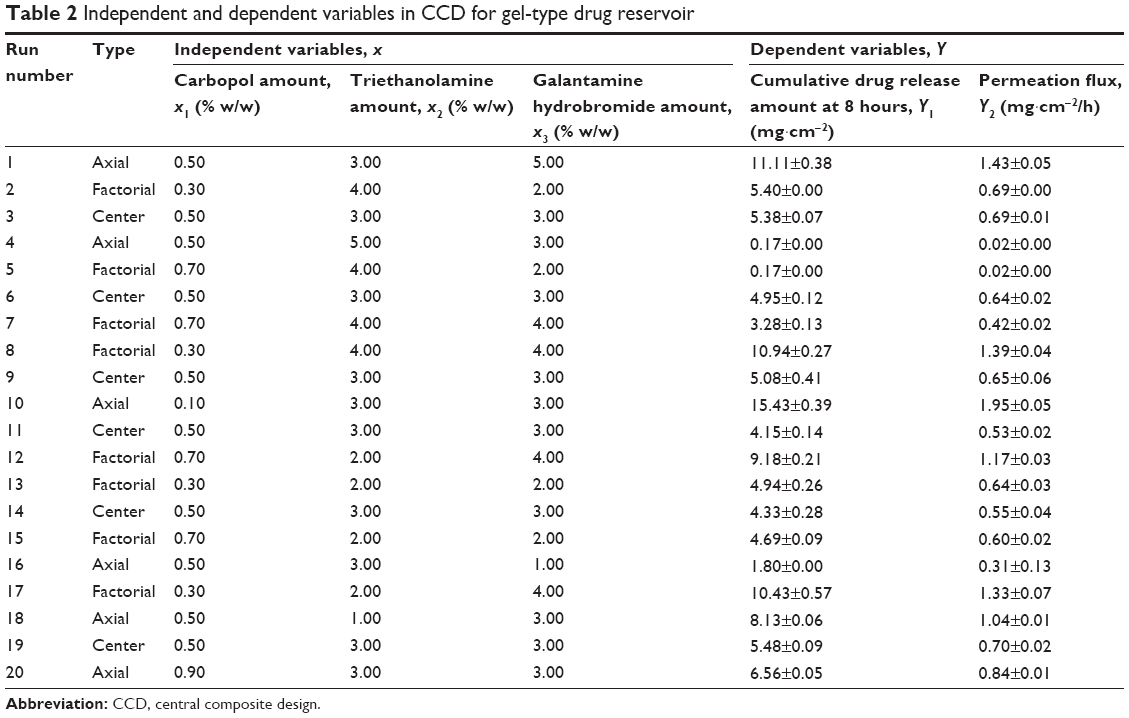 | Table 2 Independent and dependent variables in CCD for gel-type drug reservoir |
Table 3 shows the ANOVA for both the dependent variables. The quadratic polynomial model for cumulative drug release amount at 8 hours had an F-value of 63.70 and a P-value less than 0.0001, while the quadratic model for permeation flux had an F-value of 59.49 and a P-value less than 0.0001. Large computed F-values, very small P-values, and suitable correlation R2 values proved that these two quadratic models are significant.15–17 The ANOVA reveals that only linear terms of carbopol, triethanolamine, GH amounts; quadratic terms of carbopol, GH amounts, and interaction term between carbopol amount and triethanolamine amount are significant terms for both models (P<0.005). Other insignificant terms are eliminated in the equations. Equations 2 and 3 show the final quadratic equations that represent the models for cumulative drug release amount at 8 hours (Q8) and permeation flux (Jss) respectively:
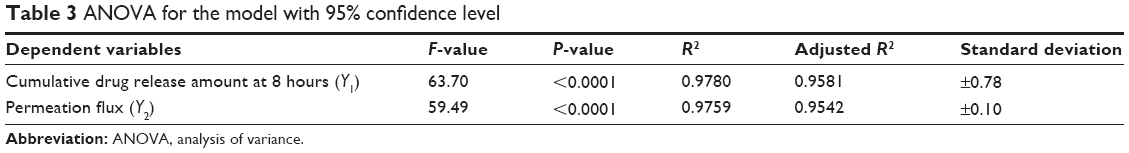 | Table 3 ANOVA for the model with 95% confidence level |
Q8 = +4.54 − 2.01A − 1.59B + 2.33C + 1.53A2+ 0.40C2 − 1.42AB | (2) |
Jss = +0.58 − 0.25A − 0.20B + 0.29C +0.19A2+0.66C2 − 0.18AB | (3) |
where A is the carbopol amount (% w/w), B is the triethanolamine amount (% w/w), and C is the GH amount (% w/w).
In vitro release of GH
Figures 1 and 2 show the one-factor plot of independent variables on the response variables. Figure 1A shows the effect of the carbopol amount on the cumulative drug release amount at 8 hours, while Figure 2A shows the effect of the carbopol amount on permeation flux. The drug release amount and permeation flux are the highest when the carbopol amount is 0.30% w/w; subsequently, the drug release is gradually reduced between 0.30% and 0.50% w/w of the carbopol amount. This may be due to a higher polymer content that produced a more viscous gel, and thus caused more difficulty for the drug molecules to be mobilized.18 However, the cumulative drug release amount and permeation flux became constant after 0.50% w/w of carbopol. This effect might be due to the influence from other ingredients in the formulation that reduce the effect of polymer content on drug release and drug flux.
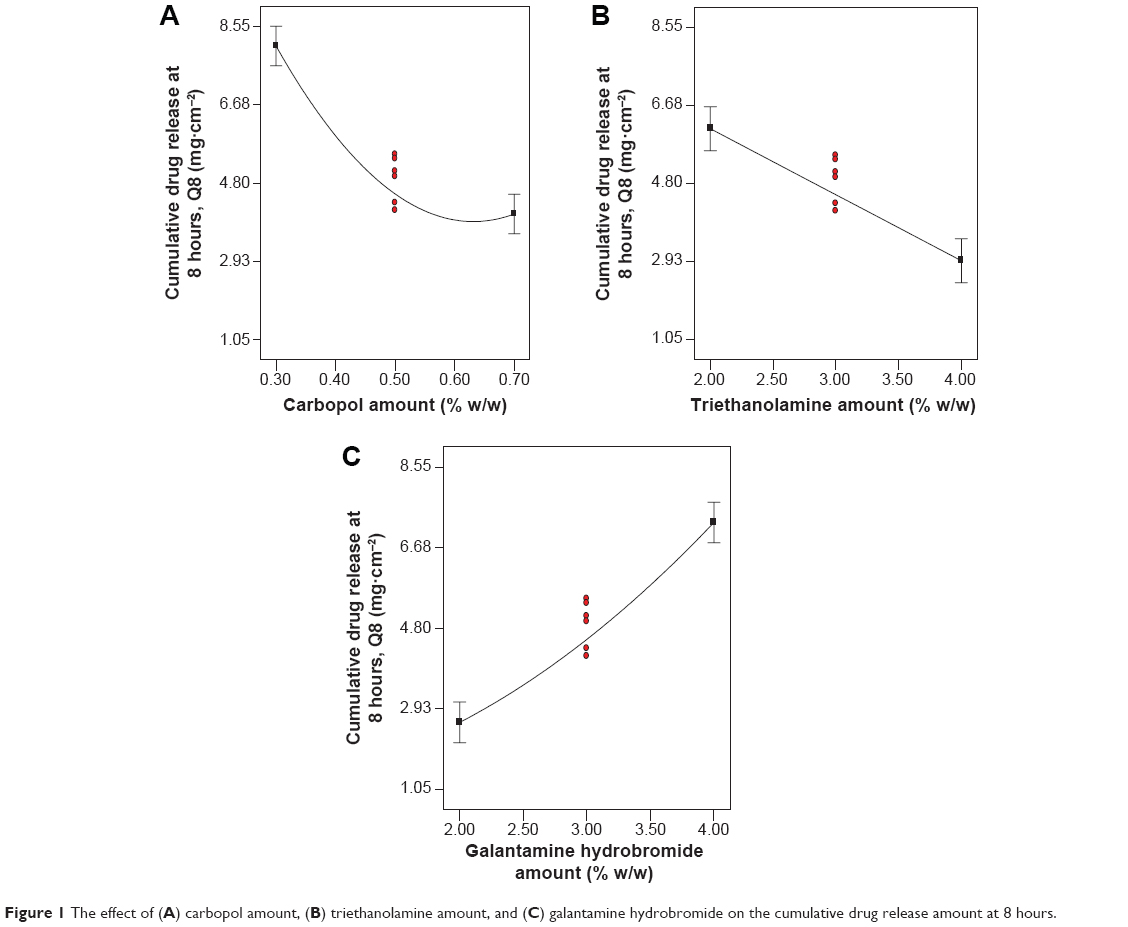 | Figure 1 The effect of (A) carbopol amount, (B) triethanolamine amount, and (C) galantamine hydrobromide on the cumulative drug release amount at 8 hours. |
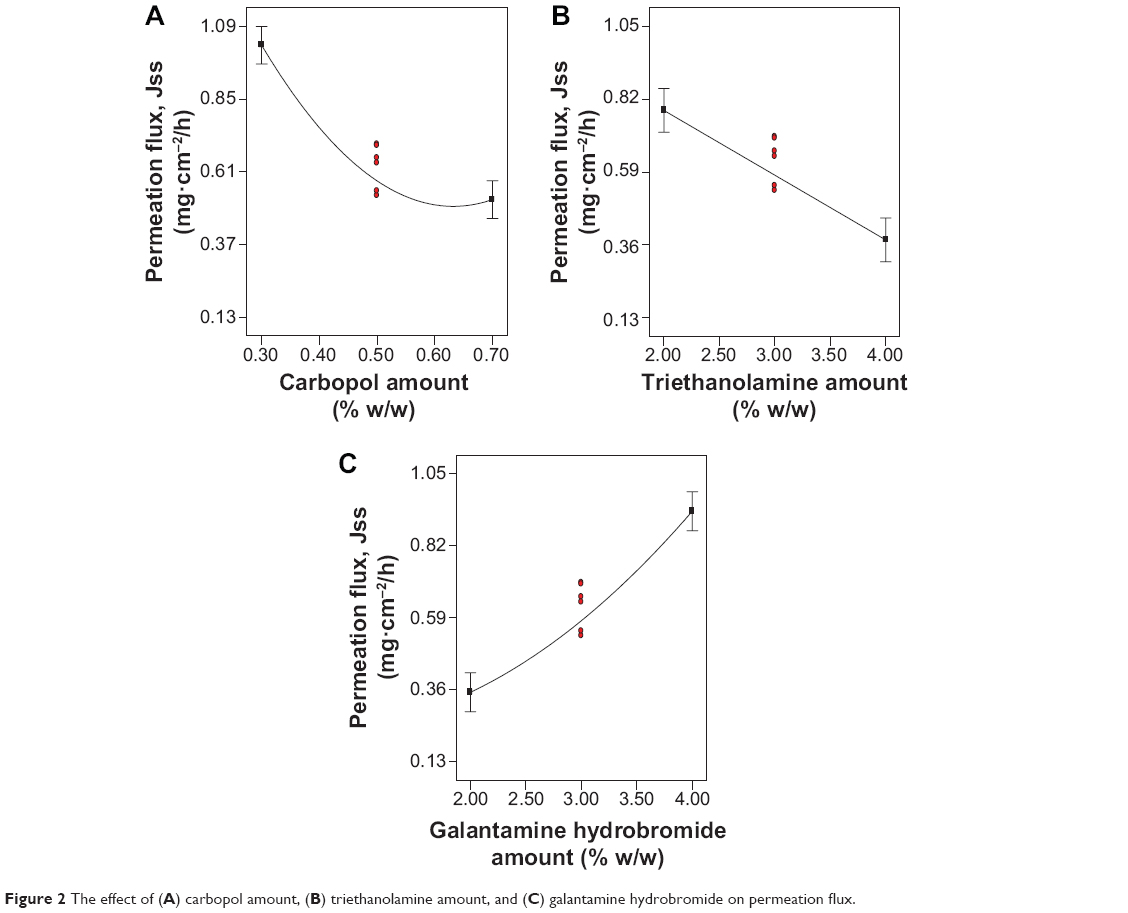 | Figure 2 The effect of (A) carbopol amount, (B) triethanolamine amount, and (C) galantamine hydrobromide on permeation flux. |
Figures 1B and 2B show the effect of the triethanolamine amount on the cumulative drug release amount at 8 hours and the permeation flux. The release amount and the flux of GH from the gel-type drug reservoir is inversely proportional to the triethanolamine amount in the formulation. Triethanolamine (2.00% w/w) contributes to a higher drug release amount and flux, while 4.00% w/w of triethanolamine contributes to the lowest drug release and flux. This could be due to triethanolamine at higher concentrations producing a gel with a higher complexity. The highly complex gel makes it more difficult for drug molecules to permeate through the gel.18
Figures 1C and 2C show the effect of the GH amount on the cumulative drug release amount at 8 hours and the permeation flux. The amount of GH loaded in the gel is directly proportional to the cumulative drug release amount at 8 hours and the permeation flux across the membrane. The drug release amount and the flux are higher when 2.00% w/w of the drug is loaded in the gel compared to 4.00% w/w of drug loading. This result obeyed Fick’s diffusion law, which states that drug diffusion is high when drug concentration is high. The results from one-factor plots shown in Figures 1 and 2 thus prove that the amounts of carbopol, triethanolamine, and GH in the gel system can affect the cumulative drug release at 8 hours and the permeation flux.
Figure 3 shows the three-dimensional contour plot that relates the interaction effects of carbopol and triethanolamine amounts on the cumulative drug release amount at 8 hours and the permeation flux. The plots provide important information on the optimized drug release amount and the drug flux. The highest cumulative drug release amount and permeation flux are observed at the point with the lowest carbopol amount (0.30% w/w) and the lowest triethanolamine amount (2.00% w/w). The lowest cumulative drug release amount and permeation flux are observed when both the carbopol amount (0.70% w/w) and the triethanolamine amount (4.00% w/w) are the highest. The ANOVA shows that the interaction between carbopol and triethanolamine amounts is the only significant interaction term for the model of cumulative drug release amount at 8 hours (P=0.0004) and the model of permeation flux (P=0.0004).
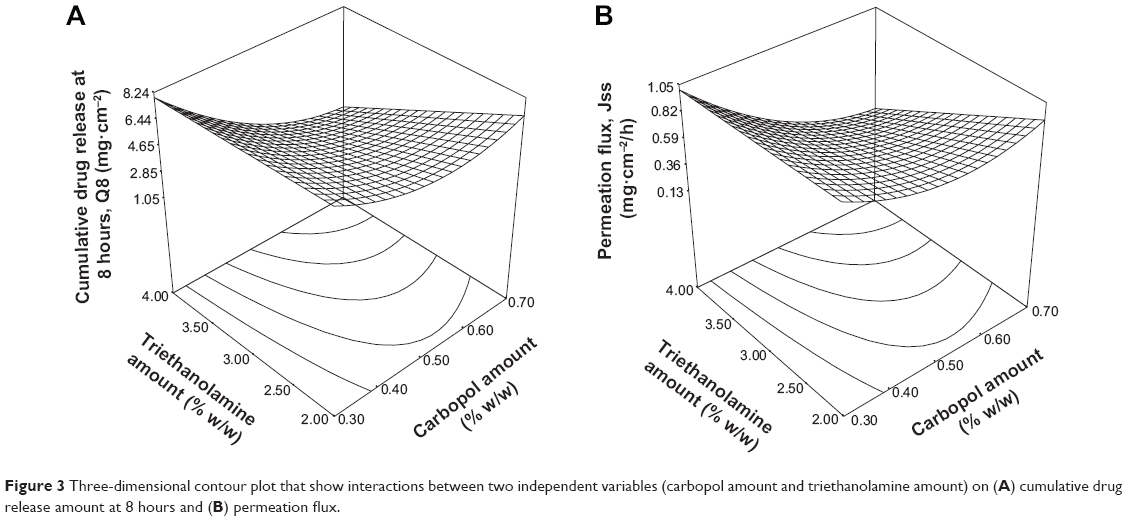 | Figure 3 Three-dimensional contour plot that show interactions between two independent variables (carbopol amount and triethanolamine amount) on (A) cumulative drug release amount at 8 hours and (B) permeation flux. |
Model validation and responses optimization
Three-dimensional contour plots of RSM models were used to obtain the optimum cumulative drug release amount at 8 hours and permeation flux for the gel-type drug reservoir. The highest cumulative drug release amount at 8 hours and permeation flux were observed when the gel formulation consists of 0.89% w/w carbopol, 1.16% w/w triethanolamine, and 4.19% w/w GH. This gel was predicted to have cumulative drug release amount at 8 hours of 17.80 mg·cm−2 and permeation flux of 2.27 mg·cm−2/h. Table 4 shows the predicted and actual cumulative drug release amounts at 8 hours and permeation fluxes for the gel-type drug reservoir. The actual cumulative drug release amount at 8 hours and the actual permeation flux were 16.93±0.08 mg·cm−2 and 2.32±0.02 mg·cm−2/h, respectively. These actual values were close to the predicted values and proved that the produced mathematical models were suitable for the optimization purposes.
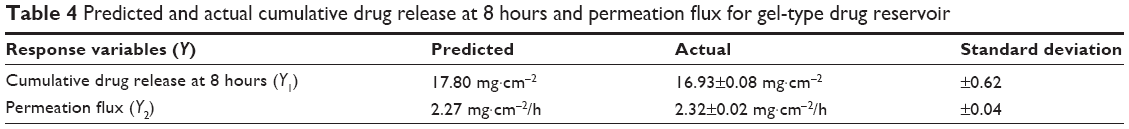 | Table 4 Predicted and actual cumulative drug release at 8 hours and permeation flux for gel-type drug reservoir |
Fabrication of transdermal patch
The patch system loaded with the optimized gel drug reservoir was fabricated. This patch system consists of three layers, namely, the backing layer, gel drug reservoir layer, and release liner. The prepared patch had a size of 6 cm ×7 cm, while the drug loaded layer had a size of 2 cm ×3 cm. The thickness of the prepared patch is 0.2 cm. This system was stable at room temperature, with no drug crystals observed on the patch after 6 months’ storage.
Comparison between optimized gel and patch formulations
Table 5 shows the pH, drug content, drug release amount at 8 hours, percentage of drug release at 8 hours, and permeation flux for the optimized gel-type drug reservoir and patch formulations. The results showed that both the gel and the patch system have pH values close to 7; this pH is neutral and hence the gel and the patch system are mild and will not irritate the skin. Drug content analysis showed that the gel and patch formulations contained GH in the range of 85%–100%. This suggested that the amount of drug lost during processing methods was insignificant. Table 5 also shows that the patch system provides a lower drug release amount at 8 hours, lower percentage of drug release at 8 hours, and lower permeation flux compared to the gel system. This result suggested that the patch system provided more controlled and sustained drug release compared to the gel system, thus allowing a longer duration of drug treatment.
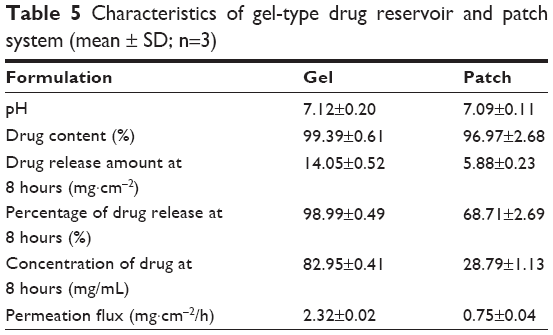 | Table 5 Characteristics of gel-type drug reservoir and patch system (mean ± SD; n=3) |
This patch system is targeted as a twice-daily sustained release patch since the percentage of drug release is only 68.71%±2.69% after 8 hours. It is able to achieve 100% drug release after 12 hours. Park et al (2012) suggested that the transdermal administration of galantamine can provide Cmax of 112.12±46.06 ng/mL at a dose 5 mg/kg in rabbits.19 In this work, the concentrations of the drug in the receptor chamber at 8 hours were 82.95±0.41 mg/mL for the gel and 28.79±1.13 mg/mL for the patch. These concentrations were higher than the value of Cmax suggested by Park et al (2012). However, these results were predicted by using in vitro studies and can only serve as the prescreening tool prior to the in vivo studies. Further in vivo studies are needed to verify the data obtained.
Conclusion
Formulation optimization for the gel-type drug reservoir was carried out by using RSM to determine the compositions that provide the optimum cumulative drug release amount at 8 hours and permeation flux. The data obtained from the CCD matrix shows that the models for both the cumulative drug release amount at 8 hours and the permeation flux were fitted to a quadratic polynomial equation with a large F-value and a small P-value. The one-factor plots for both models also proved that the amounts of carbopol, triethanolamine, and GH can affect the cumulative drug release amount at 8 hours and the permeation flux. The interaction between carbopol and triethanolamine amounts also can significantly influence the drug release and permeation flux. Optimization of responses showed that the gel containing 0.89% w/w carbopol, 1.16% w/w triethanolamine, and 4.19% w/w GH provided the highest drug release and drug flux. This optimized gel-type drug reservoir was successfully incorporated into the transdermal patch system. The formulated patch system has suitable pH to skin, high drug content, and controlled drug-release pattern. Hence, this patch system has a great potential to be used for the treatment of AD.
Acknowledgments
We would like to thank Professor Dr Mahiran Basri for ensuring a good working environment and providing guidance during this research. Our special thanks go to Dr Hamid Reza for his help throughout the experiments. We are also very grateful for the guidance and help from our cosupervisors and friends.
Disclosure
The authors report no conflicts of interest in this work.
References
Martinez A. Emerging Drugs and Targets for Alzheimer’s Disease. UK: RSC publishing; 2010. | ||
Prince M, Prina M, Guerchet M. World Alzheimer Report 2013, Journey of Caring: An Analysis of Long-Term Care for Dementia. London: Alzheimer’s Disease International; 2013. | ||
Kumar A, Prakash A, Pahwa D. Galantamine potentiates the protective effect of rofecoxib and caffeic acid against intrahippocampal Kainic acid-induced cognitive dysfunction in rat. Brain Res Bull. 2011; 85(3–4):158–168. | ||
Adewusi EA, Moodley N, Steenkamp V. Antioxidant and acetylcholinesterase inhibitory activity of selected southern African medicinal plants. S Afr J Botany. 2011;77(3):638–644. | ||
Oboh G, Ademiluyi AO, Akinyemi AJ. Inhibition of acetylcholinesterase activities and some pro-oxidant induced lipid peroxidation in rat brain by two varieties of ginger (Zingiber officinale). Exp Toxicol Pathol. 2012;64(4):315–319. | ||
Vasudevan M, Parle M. Pharmacological actions of Thespesia populnea relevant to Alzheimer’s disease. Phytomed. 2006;13(9–10):677–687. | ||
Rattan S, Kassem M. Prevention and Treatment of Age-Related Diseases. 7th ed. Berlin: Springer; 2006. | ||
Suh GH, Yeon Jung H, Uk C, et al; Korean Galantamine Study Group. A prospective, double-blind, community-controlled comparison of three doses of galantamine in the treatment of mild to moderate Alzheimer’s disease in a Korean population. Clin Ther. 2004;26(10):1608–1618. | ||
Riemann D, Gann H, Dressing H, Müller WE, Aldenhoff JB. Influence of the cholinesterase inhibitor galanthamine hydrobromide on normal sleep. Psychiatry Res. 1994;51(3):253–267. | ||
Lefèvre G, Sedek G, Huang HL, et al. Pharmacokinetics of a Rivastigmine transdermal patch formulation in Healthy volunteers: relative effects of body site application. J Clin Pharmacol. 2007;47(4):471–478. | ||
Alexander A, Dwivedi S, Ajazuddin, et al. Approaches for breaking the barriers of drug permeation through transdermal drug delivery. J Control Release. 2012;164(1):26–40. | ||
Keleb E, Sharma RK, Mosa EB, Aljahwi A-aZ. Transdermal drug delivery system-design and evaluation. Int J Adv Pharm Sci. 2011;1(3): 201–211. | ||
Brereton R. Chemometrics: Data Analysis for the Laboratory and Chemical Plant. New York: John Wiley & Sons; 2003. | ||
Leardi R. Experimental design in chemistry: a tutorial. Anal Chim Acta. 2009;652(1–2):161–172. | ||
Lee A, Chaibakhsh N, Rahman MBA, Basri M, Tejo BA. Optimized enzymatic synthesis of levulinate ester in solvent-free system. Ind Crops Prod. 2010;32(3):246–251. | ||
Musa SH, Basri M, Masoumi HR, et al. Formulation optimization of palm kernel oil esters nanoemulsion-loaded with chloramphenicol suitable for meningitis treatment. Colloids Surf B. 2013;112(0):113–119. | ||
Masoumi HR, Basri M, Kassim A, et al. Statistical optimization of process parameters for lipase-catalyzed synthesis of triethanolamine-based esterquats using response surface methodology in 2-liter bioreactor. Sci World J. 2013;2013:9. | ||
Batheja P, Sheihet L, Kohn J, Singer AJ, Michniak-Kohn B. Topical drug delivery by a polymeric nanosphere gel: formulation optimization and in vitro and in vivo skin distribution studies. J Control Release 2011; 149(2):159–167. | ||
Park CW, Son DD, Kim JY, et al. Investigation of formulation factors affecting in vitro and in vivo characteristics of a galantamine transdermal system. Int J Pharm. 2012;436(1–2):32–40. |
 © 2015 The Author(s). This work is published and licensed by Dove Medical Press Limited. The full terms of this license are available at https://www.dovepress.com/terms.php and incorporate the Creative Commons Attribution - Non Commercial (unported, v3.0) License.
By accessing the work you hereby accept the Terms. Non-commercial uses of the work are permitted without any further permission from Dove Medical Press Limited, provided the work is properly attributed. For permission for commercial use of this work, please see paragraphs 4.2 and 5 of our Terms.
© 2015 The Author(s). This work is published and licensed by Dove Medical Press Limited. The full terms of this license are available at https://www.dovepress.com/terms.php and incorporate the Creative Commons Attribution - Non Commercial (unported, v3.0) License.
By accessing the work you hereby accept the Terms. Non-commercial uses of the work are permitted without any further permission from Dove Medical Press Limited, provided the work is properly attributed. For permission for commercial use of this work, please see paragraphs 4.2 and 5 of our Terms.