")
Back to Journals » Clinical Ophthalmology » Volume 11
Follow-up of the retinal nerve fiber layer thickness of diabetic patients type 2, as a predisposing factor for glaucoma compared to normal subjects
Authors Takis A, Alonistiotis D , Ioannou N, Kontou E, Mitsopoulou M, Papaconstantinou D
Received 11 December 2016
Accepted for publication 14 March 2017
Published 13 June 2017 Volume 2017:11 Pages 1135—1141
DOI https://doi.org/10.2147/OPTH.S129935
Checked for plagiarism Yes
Review by Single anonymous peer review
Peer reviewer comments 3
Editor who approved publication: Dr Scott Fraser
Alexandros Takis,1 Dimitrios Alonistiotis,1 Nikolaos Ioannou,1 Evgenia Kontou,1 Maria Mitsopoulou,1 Dimitrios Papaconstantinou2
1Second Department of Ophthalmology, University of Athens, “Attikon” Hospital, Athens, 2First Department of Ophthalmology, University of Athens, General Hospital of Athens “G Genimatas”, Athens, Greece
Purpose: To evaluate and follow-up the retinal nerve fiber layer (RNFL) thickness in patients with diabetes mellitus type 2 compared to a group of healthy individuals with similar demographic characteristics.
Patients and methods: This is a prospective, noninvasive, observational case series study. For the purposes of the study, 27 eyes of diabetic patients without diabetic retinopathy, 24 eyes of patients with mild retinopathy, and 25 normal age-matched subjects (control group [CG]) were examined. All participants underwent complete ophthalmological examination and imaging with GDx variable corneal compensation scanning laser polarimetry. Follow-up was 2 years for all three groups.
Results: The mean inferior average was statistically significantly lower in both diabetic groups compared to CG at baseline examination and during follow-up. The nerve fiber indicator (NFI) was higher in both diabetic groups compared to CG, both at baseline examination and during follow-up. The NFI was 21.7±11.9 and 22.0±11.8 for the diabetic group without retinopathy, 20.8±9.6 and 21.9±9.8 for the group with mild retinopathy, and 15.3±5.4 and 15.9±5.5 for the normal subjects, at baseline and 24 months, respectively. There was no statistically significant reduction of the RNFL thickness in all three groups compared to baseline examination.
Conclusion: This is the first long-term study documenting the RNFL thickness in diabetic patients in comparison with normal controls. Although the lower RNFL was found thinner in diabetics, the 2-year follow-up showed no significant reduction of RNFL thickness in all groups, indicating that RNFL damage may occur early in diabetic patients.
Keywords: RNFL, GDx, diabetic retinopathy, glaucoma
Introduction
According to recent studies, the global prevalence of diabetes mellitus (DM) in adults is expected to be more than double in 2030,1 raising concerns over diabetic retinopathy, which is a leading cause of visual impairment worldwide.2 In 2010, one-third of the diabetic patients showed some type of diabetic retinopathy among which 30% of cases was vision threatening.3
The health of the optic nerve may be assessed through the evaluation of the retinal nerve fiber layer (RNFL), a well-established clinical and investigational tool.4 Studies using either scanning laser polarimetry (SLP)5–7 or optical coherence tomography (OCT)8,9 have associated DM with thinning of the RNFL. Attempts have been made to find correlations between thinning of RNFL with age, sex, duration of diabetes, disease stage, and glycemic control.7,8
Diabetes has also been considered a controversial predisposing factor for primary open-angle glaucoma (POAG). There have been studies showing that it may not be an independent risk factor for POAG, but there is also strong indication that it is. This study aims to investigate a possible influence of early retinopathy on the annual change of RNFL thickness and whether diabetes type II can be defined as an independent factor for glaucoma.
This study compares the alteration rate of RNFL thickness among three distinct groups: diabetic patients without retinopathy, diabetics with mild retinopathy, and normal controls.
Study participants were followed-up for 2 consecutive years. RNFL thickness was measured by SLP using GDx variable corneal compensation (VCC) software, in which nerve fiber indicator (NFI) is still considered a reliable indicator for glaucoma, superior even to SD-OCT measurements.10
To our knowledge, this is the first long-term study documenting the alteration rate of RNFL thickness in diabetic patients, in comparison with normal controls matched for age and sex.
Patients and methods
This was a prospective, noninvasive, observational case series of 51 diabetic patients. The patients were selected among diabetics who were attending the Diabetic Retinopathy Clinic (Second Department of Ophthalmology, Attikon University Hospital in Athens, Greece) within a period of 6 months.
Selection criteria included the presence of type II DM for >5 years, either without retinopathy or associated with mild retinopathy. The criteria for the mild diabetic retinopathy were according to the International Clinical Disease Severity Scale for Diabetic Retinopathy.11 Exclusion criteria were
- Best corrected visual acuity <20/40.
- Intraocular pressure (IOP) >21 mmHg.
- Any anatomical variation or pathology of the optic disc, such as optic rim notch, diffuse loss of optic rim tissue, disc hemorrhage, tilted disc, C/D ratio >0.3 or asymmetry, or history of optic neuropathy.
- The presence of macular edema or previous fundus photocoagulation.
- Diseases of the fundus, including retinal vein or artery occlusion, age-related macular degeneration, macular hole or epiretinal membrane, and severe diabetic retinopathy.
- High myopia and previous refractive surgeries.
- Media opacities that would preclude good quality imaging.
The control group consisted of 25 nondiabetic (normal) subjects of the same age range and sex as the diabetic patients. The same exclusion criteria were applied to the control group. All normal subjects had no history of diabetes and had undergone at least one blood exam showing normal serum glucose levels (<110 mg/dL) and an HbA1c measurement <6% in the last 6 months.
Ethical approval was obtained from Attikon University Hospital ethics committee. The aim and the important details of the study were explained to all participants in accordance to the Declaration of Helsinki. All participating patients signed a written consent after the initial meeting by the researchers.
Medical history of the patients was recorded. Ophthalmic examination included examination for best corrected visual acuity, Goldman intraocular pressure measurement, ultrasonic central corneal pachymetry, and gonioscopy with a Zeiss gonioscope (Carl Zeiss Meditec AG, Jenna, Germany). Patients then underwent mydriasis in order to determine the presence and stage of diabetic retinopathy and to detect any exclusion criteria for the study. Fundus color photography was taken in all participants in order to evaluate the cup to disc ratio and exclude glaucomatic patients. For the purpose of the study, only subjects without glaucoma were included in order to isolate diabetes as a predisposing factor.
Of the 51 diabetic subjects, 27 who had normal fundus bilaterally on the initial fundus examination formed the group “diabetics without retinopathy”. The other 24 patients had mild diabetic lesions bilaterally and formed the group “diabetics with mild diabetic retinopathy” according to the International Clinical Disease Severity Scale for Diabetic Retinopathy criteria. HbA1c results for all 51 participants were obtained within the last 3 months (before the selection period). Twenty-six of the 51 diabetics were under both oral and insulin therapy (13 without retinopathy and 13 with mild retinopathy). The remaining 25 diabetic patients received only oral treatment.
All participants had their RNFL measured by SLP using GDx VCC software, version 5.5.0 (Carl Zeiss Meditec, Dublin, CA, USA).12 Three images were taken from each participant, and that with the highest quality index was chosen for analysis. The following GDx VCC parameters were studied:
- Temporal–superior–nasal–inferior–temporal (TSNIT) average: it estimates the average of all pixels under the 360° calculation area.
- Superior average: it is the average of all pixels in the superior 120° area (25°–144° with 0° being the disc– fovea line).
- Inferior average: it is the average of all pixels in the inferior 120° area (215°–334°).
- TSNIT standard deviation (SD): it represents the SD of the values contained in the circle.
- Nerve fiber indicator (NFI): the NFI is based on the entire RNFL thickness map. It discriminates between healthy and glaucomatous eyes.13
The follow-up protocol included the same examinations with the initial study. Additional exclusion criteria were the transition of patients from one diabetic retinopathy stage to another. Two years after the registration visit, a final follow-up examination was performed for all individuals.
Statistical analysis
SLP GDx examination was carried out for both eyes of all participants. The right eye of each individual was chosen for the purposes of the study. Statistical analyses were performed with the Statistical Package for Social Sciences software (SPSS version 14; IBM Corporation, Armonk, NY, USA). Probability P-values of 0.05 were considered statistically significant. Initially, calculation of descriptive statistics (mean value, SD, and range) was performed for all the parameters of each group. In order to assess possible differences in the demographic parameters among the three groups, analysis of variance (ANOVA) was used. In order to evaluate pairwise differences between groups, the Tukey’s honestly significant difference test was used. The results of the GDx SLP numerical parameters for the two diabetic groups alone were compared applying the Mann–Whitney U-test.
The aforementioned tests were used to compare measurements among the three groups for the initial visit, as well as for the two annual follow-up exams (year 0 or baseline exam, year 1 or 1st year follow-up, and year 2 or 2nd year follow-up). Paired samples t-test for each group separately was carried out for data analysis of the GDx VCC measurements of the three visits.
Results
Initial exam (year 0)
The demographic parameters from 51 patients with DM and 25 normal control subjects are presented in Table 1. There were no significant differences with respect to central corneal thickness and cup-to-disc (C/D) ratio among the three groups of subjects according to ANOVA (P>0.05). Furthermore, age and IOP, which may affect the RNFL thickness, also presented no statistical difference among the groups.14
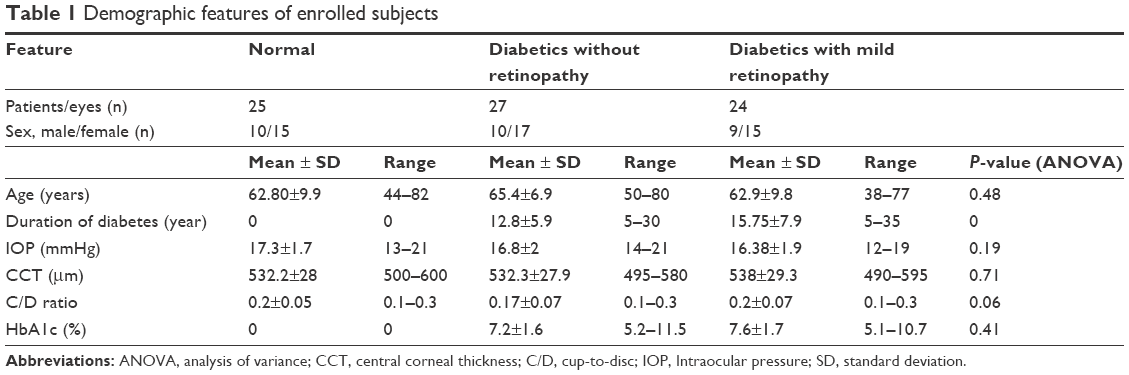 | Table 1 Demographic features of enrolled subjects |
Table 2 shows the comparison of the GDx variables for each group at the initial examination. The results of the baseline examination have been reported previously.7 The most important finding is the statistical difference between the three groups of the inferior average values (P=0.017, ANOVA). Subjects in the control group had thicker inferior RNFL.
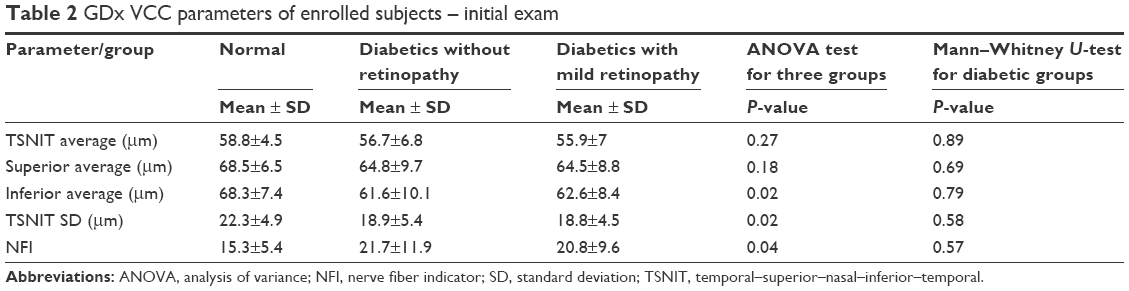 | Table 2 GDx VCC parameters of enrolled subjects – initial exam |
ANOVA test for the three groups also showed statistically significant higher NFI values for the two diabetic groups compared to normal subjects.
Statistical analysis showed no difference between the GDx VCC parameters of the two diabetic groups.
First and second follow-up exam (year 1 and year 2)
Table 3 compares the GDx VCC variables from the first follow-up exam of all groups. TSNIT SD (P=0.02), inferior average (P=0.02), and NFI (P=0.04) are significantly different between either of the two diabetic groups and the control. The Mann–Whitney U-test did not demonstrate a statistically significant difference among the GDx VCC variables derived from the two diabetic groups on the first year of follow-up examinations (P>0.5). In clinical interest, statistical analysis confirms that there is a significant difference between the two diabetic groups and the control group, for inferior average and NFI, whereas TSNIT SD has limited clinical importance. The results also confirmed that there is no statistical difference among the three groups for TSNIT average and superior average (Table 3).
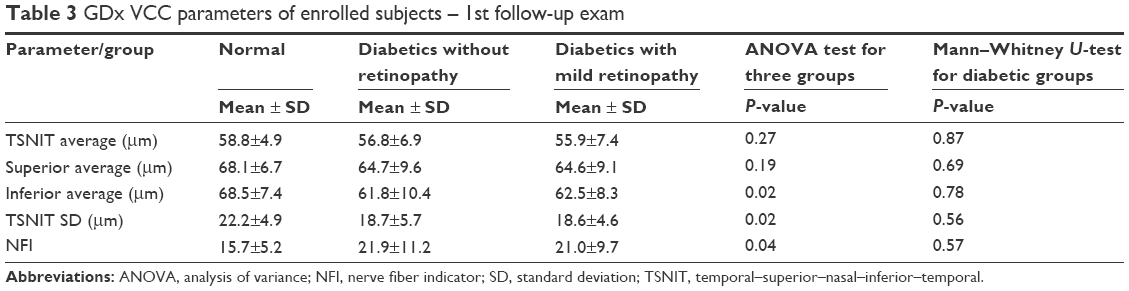 | Table 3 GDx VCC parameters of enrolled subjects – 1st follow-up exam |
Table 4 compares the GDx VCC variables from the second follow-up exam of all groups. TSNIT SD (P=0.02), inferior average (P=0.02), and NFI (P=0.03) are again significantly different between either of the two diabetic groups and the control. The Mann–Whitney U-test did not show a statistically significant difference among the GDx VCC variables derived from the two diabetic groups on the second year follow-up exam (P>0.5). In clinical interest, statistical analysis confirms that there is significant difference between the two diabetic groups and the control group, for inferior average and NFI, whereas TSNIT SD has limited clinical importance. Furthermore, the results confirmed, once again, that there is no statistical difference among the three groups for TSNIT average and superior average (Table 4).
 | Table 4 GDx VCC parameters of enrolled subjects – 2nd follow-up exam |
The paired sample t-test failed to establish a significant discrepancy of the GDx VCC variables between the initial and the second follow-up exam, for each group separately (Table 5). A stability of the RNFL thickness throughout the 2 years follow-up is observed.
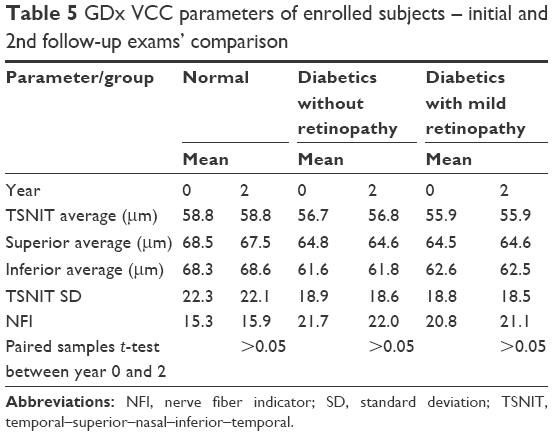 | Table 5 GDx VCC parameters of enrolled subjects – initial and 2nd follow-up exams’ comparison |
HbA1c levels of diabetic patients either with or without retinopathy and mean values of IOP of normal group and diabetic groups had not changed significantly in the course of the 2-year study period.
Discussion
Statistical analysis of the data from GDx VCC measurements performed during the initial visit, as well as the first and second follow-up exams in the three subgroups of the study (controls, diabetics without retinopathy, and diabetics with mild retinopathy), has shown significant thinning of RNFL for the diabetic patients, in comparison with normal controls matched for age and sex, prior to the appearance of vascular fundus lesions.
RNFL thinning could be possibly attributed to DM’s effects on the microcirculation, namely leukostasis,15 vascular obliteration,16 and degenerative changes of the capillary basal membrane.17,18
As the blood supply from the superficial capillaries to the fibers and the optic nerve head diminishes, RNFL may be disrupted due to increased sensitivity of the ganglion cells to the metabolic stress of diabetes.
This may explain the occurrence of early vision disturbances in diabetics, for example, reduced contrast sensitivity, distorted color perception, abnormal occipital lobe potentials, and worsening of visual fields, prior to the emergence of fundoscopically evident vascular aberrations.19–21 We also assume that this indicates that some retinal ganglion cell damage takes place early during the onset of diabetes and before clinical follow-up and stabilization of glucose serum levels. In our study, all diabetic patients were considered to have acceptable control of the glucose serum levels during follow-up, which may have inhibited further damage to the RNFL.
Retinal ganglion cell layer as well as cells of the inner granular layer obviously follow an apoptotic death program early in the course of DM. The metabolic factors responsible for the fate of these cells have not been clarified so far. Both undernourishment due to insulin insufficiency and cell injury as a result of hexosamin,22 glutamate,23 or tumor necrosis factor excess have been postulated.
RNFL thickness reduction in diabetics is particularly pronounced at the inferior retinal half, as opposed to the fundoscopically evident vascular lesions, such as microaneurysms and hemorrhagic foci, which are more noticeable at the superior half. Previous studies have already established that the blood flow in proportion to the mass of nerve tissue is poorer across the inferior retinal half.24 This could possibly explain the vulnerability of the inferior retinal regions to the metabolic stress imposed by DM and the consecutive thinning of the inferior RNFL thickness, which is documented in our study. It is well-known that visual field defects in glaucoma appear primarily in the upper half, which may suggest a similar etiology in diabetic patients.
The NFI, which is considered an indicator for predisposition for glaucoma, was increased in both diabetic groups in our study compared to normal, having excluded all other predisposing factors, including age. This, in our opinion, is a definite sign that DM is an independent risk factor for glaucoma. In other words, already existing RNFL defects make diabetic patients more vulnerable to glaucoma, which is a progressive disease manifesting abnormal loss of ganglion cells and their nerve fibers, with or without concomitant visual field disturbances.
The 2-year follow-up of the three study subgroups has produced a number of noteworthy conclusions. Several histopathological studies have documented the annual loss of retinal nerve axons, although their results are considerably scattered over a wide range from 500 to 7,000 axons per year.25,26 This discrepancy could be explained by the limited sample size.
The introduction of novel imaging devices, into clinical practice, has enabled many studies to determine objectively the age-related alteration rate of RNFL in normal individuals by means of SLP27–29 or OCT.30,31
Nevertheless, the magnitude of the RNFL shrinking rate as a result of aging and whether the thinning process is more intense at the upper or lower retinal half remain issues of controversy. In addition, there is a wide heterogeneity among various studies with regard to factors affecting RNFL thickness, such as the age range, race, and severity of myopia (axonic length of the globe). Da Pozzo et al29 have recently estimated the year long RNFL thickness reduction rate to be 0.08, 0.16, and 0.12 μm per year for TSNIT average, superior average, and inferior average, respectively.
None of these studies, however, included a long-term follow-up. That is to say, GDx VCC or OCT was utilized to perform a one-time assessment of RNFL thickness in a large cohort of normal subjects, across a wide age range (between <20 and >70 years). Subsequently, the study participants were grouped per age decade, and the statistical analysis of measurements (linear regression, Spearman’s correlation, and chi-square test) estimated the annual decrease of RNFL thickness.
Our study was the first to perform a prolonged monitoring of RNFL thickness, both in normal subjects and diabetic patients. A significant change in RNFL thickness either of the controls or the nonglaucomatic diabetics was not established, in the course of the 2-year follow-up. This means that since the HbA1c and the IOP measurements remain relatively stable, the duration of DM is not an aggravating factor for the thinning of the nerve fibers layer, at least in the initial stages of diabetic retinopathy. This, given the fact that DM causes thinning of the nerve fibers layer and that the diabetics participating in the research had the condition for >5 years, leads to the possible conclusion that the deteriorations of the nerve fibers layer are taking place at the initial stages of the disease.
The importance of the initial phase of DM is also stressed by the results of the diabetes control and complications trial.32,33 Patients who had been managed aggressively for their hyperglycemia, and upon entry into the study had a history of DM for no longer than 2.5 years, showed 40% smaller risk of retinopathy, in comparison with cases receiving the same antiglycemic treatment but with the history of DM for >2.5 years.
According to the above mentioned study, we may speculate that the onset of diabetes is a predisposing factor for glaucoma, causing RNFL thinning in early stages, but good compliance to the treatment and glycemic control can minimize further RNFL damage.
The data gathered during the 2-year observation period has also provided insight into the differential diagnosis of the RNFL thickness reduction. Meideros et al34 reported in 2009 the data from a 3-year follow-up study of the RNFL thickness, with the utilization of GDx VCC, in glaucoma patients and in patients suspected of having the disease. The reduction rate of RNFL thickness was found equal to 0.70 μm/year in patients with a progressive course, either of the visual field defects or the glaucomatous optic nerve lesions, as opposed to individuals without progression, in whom RNFL thickness decreased at a rate of 0.14 μm/year. Therefore, a significant increase in the reduction rate of the RNFL thickness will support the argument for the loss due to glaucoma rather than diabetes, because the HbA1c measurements remain relatively stable and the measurements of intraocular pressure are within the normal range.
Further studies are needed in order to investigate whether diabetics with glaucoma have an even higher RNFL loss rate compared to glaucoma patients without DM. In this study, all groups had similar demographic features and no predisposing factors for glaucoma. A more prolonged observation and follow-up is needed to enforce this conclusion and/or evaluate a possible reduction rate, as it may show some small reduction rate of RNFL thickness. The results in this study did not demonstrate a higher rate of RNFL thickness reduction in diabetic patients compared to normal subjects within the 2 years of observation. However, the reduction in RNFL thickness of the lower retina in diabetic patients without any other predisposing factors for glaucoma indicates that DM may be an independent risk factor for the disease.
Disclosure
The authors report no conflicts of interest in this work.
References
Rathmann W, Gianni G. Global prevalence of diabetes estimates for the year 2000 and projections for 2030. Diabetes Care. 2004;27(10):2568–2569. | ||
Cheung N, Mitchell P, Wong TY. Diabetic retinopathy. Lancet. 2010;376(9735):124–136. | ||
Yau JW, Rogers SL, Kawasaki R, et al. Global prevalence and major risk factors of diabetic retinopathy. A meta-analysis of individual participant data on the prevalence and major risk factors of diabetic retinopathy. Diabetes Care. 2012;35(3):556–564. | ||
Skarf B. Retinal nerve fibre layer loss in diabetes mellitus without retinopathy. Br J Ophthalmol. 2002;86(7):709. | ||
Lopes de Faria JM, Russ H, Costa VP. Retinal nerve fiber layer loss in patients with type 1 diabetes mellitus without retinopathy. Br J Ophthalmol. 2002;86(7):725–728. | ||
Ozdek S, Lonnevile YH, Onol M, Yetkin I, Hasanreisoglu BB. Assessment of nerve fiber layer in diabetic patients with scanning laser polarimetry. Eye (Lond). 2002;16(6):761–765. | ||
Takis A, Alonistiotis D, Panagiotidis D, Ioannou N, Papaconstantinou D, Theodossiadis P. Comparison of the nerve fiber layer of type 2 diabetic patients without glaucoma with normal subjects of the same age and gender. Clin Ophthalmol. 2014;8:455–463. | ||
Oshitari T, Hanawa K, Adachi-Usami E. Changes of macular and RNFL thicknesses measured by Stratus OCT in patients with early stage diabetes. Eye (Lond). 2009;23(4):884–889. | ||
Sugimoto M, Sasoh M, Ido M, Wakitani Y, Takahashi C, Uji Y. Detection of early diabetic change with optical coherence tomography in type 2 diabetes mellitus patients without retinopathy. Ophthalmologica. 2005;19(6):379–385. | ||
Bertuzzi F, Benatti E, Esempio G, Rulli E, Miglior S. Evaluation of retinal fiber layer thickness measurements for glaucoma detection: GDx ECC versus spectral domain OCT. J Glaucoma. 2014;24(4):232–239. | ||
Wilkinson CP, Ferris FL, Klein RE, et al. Proposed international clinical diabetic retinopathy and diabetic macular edema disease severity scales. Ophthalmology. 2003;110(9):1677–1682. | ||
Garway-Heath DF, Greaney MJ, Caprioli J. Correction for the erroneous compensation of anterior segment birefringence with the scanning laser polarimeter for glaucoma diagnosis. Invest Ophthalmol Vis Sci. 2002;43(5):1465–1474. | ||
Zhou Q, Reed J, Betts R, et al. Detection of glaucomatous retinal nerve fiber layer damage by scanning laser polarimetry with variable corneal compensation. SPIE Ophthal Technol XIII. 2003;4951:1–10. | ||
Balazsi AG, Rootman J, Drance SM, Schulzer M, Douglas GR. The effect of age on the nerve fiber population of the human optic nerve. Am J Ophthalmol. 1984;97(6):760–766. | ||
Barouch FC, Miyamoto K, Allport JR, et al. Integrin-mediated neut rophil adhesion and retinal leukostasis in diabetes. Invest Ophthalmol Vis Sci. 2000;41(5):1153–1158. | ||
Boeri D, Maiello M, Lorenzi M. Increased prevalence of microthromboses in retinal capillaries of diabetic individuals. Diabetes. 2001;50(6):1432–1439. | ||
Gardiner TA, Archer DB, Curtis TM, Stitt AW. Arteriolar involvement in the microvascular lesions of diabetic retinopathy: implications for pathogenesis. Microcirculation. 2007;14(1):25–38. | ||
Stitt A, Gardiner TA, Alderson NL, et al. The AGE inhibitor pyridoxamine inhibits development of retinopathy in experimental diabetes. Diabetes. 2002;51(9):2826–2832. | ||
Varkonyi TT, Peto T, Degi R, et al. Impairment of visual evoked potentials: an early central manifestation of diabetic neuropathy? Diabetes Care. 2002;25(9):1661–1662. | ||
Greenstein VC, Shapiro A, Zaidi Q, Hood DC. Psychophysical evidence for post-receptoral sensitivity loss in diabetes. Invest Ophthalmol Vis Sci. 1992;33(10):2781–2790. | ||
Sokol S, Moskowitz A, Skarf B, Evans R, Molitch M, Senior B. Contrast sensitivity in diabetics with and without background retinopathy. Arch Ophthalmol. 1985;103(1):51–54. | ||
Nakamura M, Barber AJ, Antonetti DA, et al. Excessive hexosamines block the neuroprotective effect of insulin and induce apoptosis in retinal neurons. J Biol Chem. 2001;276(47):43748–43755. | ||
Lieth E, LaNoue KF, Antonetti DA, Ratz M. Diabetes reduce glutamate oxidation and glutamine synthesis in the retina. The Penn State Retina Research Group. Exp Eye Res. 2000;70(6):723–730. | ||
Harris A, Ishii Y, Chung HS, et al. Blood flow per unit retinal nerve fibre tissue volume is lower in the human inferior retina. Br J Ophthalmol. 2003;87(2):184–188. | ||
Jonas JB, Schmidt AM, Muller-Bergh JA, Schlotzer-Schrehardt UM, Naumann GO. Human optic nerve fiber count and optic disc size. Invest Ophthalmol Vis Sci. 1992;33(6):2012–2018. | ||
Dolman CL, McCormick AQ, Drance SM. Aging of the optic nerve. Arch Ophthalmol. 1980;98(11):2053–2058. | ||
Poinoosawmy D, Fontana L, Wu JX, Fitzke FW, Hitchings RA. Variation of nerve fiber thickness measurements with age and ethnicity by scanning laser polarimetry. Br J Ophthalmol. 1994;81(5):350–354. | ||
Weinreb RN, Shakiba S, Zangwill L. Scanning laser polarimetry to measure the nerve fiber layer of normal and glaucomatous eyes. Am J Ophthalmol. 1995;119(5):627–636. | ||
Da Pozzo S, Iacono P, Marchesan R, Minutola D, Ravalico G. The effect of ageing on retinal nerve fibre layer thickness: an evaluation by scanning laser polarimetry with variable corneal compensation. Acta Ophthalmol Scand. 2006;84(3):375–379. | ||
Hirasawa H, Tomidokoro A, Araie M, et al. Peripapillary retinal nerve fiber layer thickness determined by spectral-domain optical coherence tomography in ophthalmologically normal eyes. Arch Ophthalmol. 2010;128(11):1420–1426. | ||
Kanamori A, Escano MF, Eno A, et al. Evaluation of the effect of aging on retinal nerve fiber layer thickness measured by optical coherence tomography. Ophthalmologica. 2003;217(4):273–278. | ||
Writing Team for the Diabetes Control and ComplicationsTrial/Epidemiology of Diabetes Interventions and Complications Research Group. Effect of intensive therapy on the microvascular complications of type 1 diabetes mellitus. JAMA. 2002;287(19):2563–2569. | ||
Diabetes Control and Complications Trial/Epidemiology of Diabetes Interventions and Complications Research Group. Retinopathy and nephropathy in patients with type 1 diabetes four years after a trial of intensive therapy. N Engl J Med. 2000;342(6):381–389. | ||
Meideros F, Alencar LM, Zangwill LM, et al. Detection of progressive retinal nerve fiber layer loss in glaucoma using scanning laser polarimetry with variable corneal compensation. Invest Ophthalmol Vis Sci. 2009;50(4):1675–1681. |
 © 2017 The Author(s). This work is published and licensed by Dove Medical Press Limited. The full terms of this license are available at https://www.dovepress.com/terms.php and incorporate the Creative Commons Attribution - Non Commercial (unported, v3.0) License.
By accessing the work you hereby accept the Terms. Non-commercial uses of the work are permitted without any further permission from Dove Medical Press Limited, provided the work is properly attributed. For permission for commercial use of this work, please see paragraphs 4.2 and 5 of our Terms.
© 2017 The Author(s). This work is published and licensed by Dove Medical Press Limited. The full terms of this license are available at https://www.dovepress.com/terms.php and incorporate the Creative Commons Attribution - Non Commercial (unported, v3.0) License.
By accessing the work you hereby accept the Terms. Non-commercial uses of the work are permitted without any further permission from Dove Medical Press Limited, provided the work is properly attributed. For permission for commercial use of this work, please see paragraphs 4.2 and 5 of our Terms.