")
Back to Journals » Diabetes, Metabolic Syndrome and Obesity » Volume 15
Follistatin Alleviates Hepatic Steatosis in NAFLD via the mTOR Dependent Pathway
Authors Tong J , Cong L, Jia Y, He BL, Guo Y , He J, Li D, Zou B, Li J
Received 6 July 2022
Accepted for publication 7 October 2022
Published 27 October 2022 Volume 2022:15 Pages 3285—3301
DOI https://doi.org/10.2147/DMSO.S380053
Checked for plagiarism Yes
Review by Single anonymous peer review
Peer reviewer comments 3
Editor who approved publication: Prof. Dr. Juei-Tang Cheng
Junlu Tong1,2 *, Li Cong1 *, Yingbin Jia,3 Bai-Liang He,4 Yifan Guo,1 Jianzhong He,5 Decheng Li,3 Baojia Zou,3 Jian Li3
1Department of Endocrinology, The Fifth Affiliated Hospital of Sun Yat-sen University, Zhuhai, People’s Republic of China; 2Department of Central Laboratory, The Fifth Affiliated Hospital of Sun Yat-sen University, Zhuhai, People’s Republic of China; 3Department of Hepatobiliary Surgery, The Fifth Affiliated Hospital of Sun Yat-sen University, Zhuhai, People’s Republic of China; 4Guangdong Provincial Key Laboratory of Biomedical Imaging, Guangdong Provincial Engineering Research Center of Molecular Imaging, The Fifth Affiliated Hospital of Sun Yat-sen University, Zhuhai, People’s Republic of China; 5Department of Pathology, The Fifth Affiliated Hospital of Sun Yat-sen University, Zhuhai, People’s Republic of China
*These authors contributed equally to this work
Correspondence: Jian Li; Baojia Zou, Department of Hepatobiliary Surgery, The Fifth Affiliated Hospital of Sun Yat-sen University, Zhuhai, People’s Republic of China, Tel +86-756-252-8781, Email [email protected]; [email protected]
Purpose: In this study, we aimed to investigate the effect of follistatin (FST) on hepatic steatosis in NAFLD and the underlying mechanism, which has rarely been reported before.
Methods: Liver samples from NAFLD patients and normal liver samples (from liver donors) were collected to investigate hepatic FST expression in humans. Additionally, human liver cells (LO2) were treated with free fatty acid (FFA) to induce lipid accumulation. Furthermore, lentivirus with FST overexpression or knockdown vectors were used to generate stable cell lines, which were subsequently treated with FFA or FFA and rapamycin. In the animal experiments, male C57BL/6J mice were fed with a high-fat diet (HFD) to induce NAFLD, after which the adeno-associated virus (AAV) gene vectors for FST overexpression were administered. In both cell culture and mice, we evaluated morphological changes and the protein expression of sterol regulatory element-binding protein1 (SREBP1), acetyl-CoA carboxylase1 (ACC1), carbohydrate-responsive element-binding protein (ChREBP), fatty acid synthase (FASN), and Akt/mTOR signaling. The body weight and serum parameters of the mice were also measured.
Results: Hepatic FST expression level was higher in NAFLD patients compared to normal samples. In LO2 cells, FST overexpression alleviated lipid accumulation and lipogenesis, whereas FST knockdown aggravated hepatic steatosis. FST could regulate Akt/mTOR signaling, and the mTOR inhibitor rapamycin abolished the effect of FST knockdown on hepatic de novo lipogenesis (DNL). Furthermore, FST expression was increased in HFD mice compared to the corresponding controls. FST overexpression in mice reduced body weight gain, hyperlipidemia, hepatic DNL, and suppressed Akt/mTOR signaling.
Conclusion: Hepatic FST expression increases in NAFLD and plays a protective role in hepatic steatosis. FST overexpression gene therapy alleviates hepatic steatosis via the mTOR pathway.Therefore, gene therapy for FST is a promising treatment in NAFLD.
Keywords: follistatin, non-alcoholic fatty liver disease, free fatty acid, lipid synthesis
Introduction
Non-alcoholic fatty liver disease (NAFLD) is one of the most common causes of chronic liver disease worldwide with an estimated global prevalence of 25%-45%.1,2 The positive diagnostic criteria for NAFLD include fatty liver disease associated with metabolic dysfunction.3 The hallmark of hepatic steatosis is excess triglyceride (TG) accumulation >5%.4 Hepatic steatosis is the pathological basis for NAFLD, which can gradually progress to nonalcoholic steatohepatitis (NASH), irreversible cirrhosis, and even cancer.5
Due to the complex mechanism, developing medical therapies for NAFLD remains challenging.6 Currently, the main treatment is weight loss and improved lifestyle, which is effective in the stage of hepatic steatosis.7,8 Although several medical therapies targeting liver inflammation and liver injury have been developed, the clinical trial results were not satisfactory.9 Several specific molecular targets, such as fibroblast growth factor 21 and farnesoid X receptor, and emerging pharmacotherapeutic treatments are currently undergoing clinical research to identify amenable therapeutic candidates for the clinical treatment of NAFLD.10 Since NAFLD is a growing burden on the healthcare system worldwide, it is essential to gain a more detailed understanding of the underlying regulatory mechanism and molecular targets in NAFLD.
The liver is a central organ involved in the process of lipid metabolism.11 Multiple factors lead to the pathogenesis of NAFLD, including genetics, metabolism, gut microbial, and other complex factors.12 The primary driver of NAFLD is overnutrition, as it promotes insulin resistance and creates a pro-inflammatory environment. Insulin resistance leads to lipogenic transcription factor activation and the expression of key lipogenic enzymes, increasing hepatic de novo lipogenesis (DNL) which refers to the synthesis of new fatty acids from other substances, and subsequently hepatic TG accumulation during the development of NAFLD.13 As hepatic DNL accounts for 25% of the total lipids in the liver, it plays a major role in NAFLD development. Hence, further study to explore the hepatic lipid metabolism regarding DNL could be beneficial to improve NAFLD. The following enzymes have been confirmed to play important roles in the process of hepatic DNL: sterol regulatory element-binding protein1 (SREBP1), acetyl-CoA carboxylase1 (ACC1), carbohydrate-responsive element-binding protein (ChREBP), and fatty acid synthase (FASN).14,15 The resultant imbalance in lipid metabolism leads to oxidative stress apoptotic cell death, inflammasome activation, and fibrogenesis in the liver.16 Previous studies have demonstrated that the progression of hepatic lipogenesis is regulated by protein kinase B (Akt)/mammalian target of rapamycin (mTOR) signaling pathway.17,18
Follistatin (FST) was originally discovered as an endogenous inhibitor of follicle-stimulating hormone.19 There are various isoforms of FST in humans and mice. The longest isoform of FST315 in mice or FST344 in humans is secreted into the circulation, whereas the isoform found in tissues and cells is FST288 in mice and FST317 in humans.20,21 Circulating FST in humans is primarily secreted by the liver, and its levels are regulated by glucagon and insulin.22,23 FST can promote the differentiation and browning of adipocytes, and mitigate systemic metabolic inflammation.24 FST gene therapy could be used to prevent high-fat diet (HFD)-induced obesity and systemic metabolic inflammation in the mice model.25 Furthermore, NAFLD is known to be strongly associated with obesity and metabolic disorders.26,27 These data suggest that FST is closely linked to lipid metabolism. Clinical studies have shown that NAFLD patients have elevated circulating levels of FST, and circulating FST levels tend to be associated with steatosis grade within the group of NAFLD patients.28,29 Despite this, there have been limited discoveries regarding the potential role and underlying mechanisms of FST in NAFLD.
Therefore, in this study, we explored the effects of FST on hepatic steatosis as well as the underlying mechanisms that regulate this process. We hope that the results will contribute to the development of new treatments for NAFLD.
Materials and Methods
Human Samples
Human liver tissues were obtained during liver biopsies of surgical patients at the Department of Hepatobiliary Surgery in the Fifth Affiliated Hospital of Sun Yat-sen University. These samples were collected from January 2021 to January 2022. The diagnosis of NAFLD was confirmed by pathological examination of the liver samples, in addition to the evidence of metabolic disorder in each NAFLD patient. We collected liver tissue samples from NAFLD patients (n=6), excluding patients with other diseases such as cancer and metabolism-related diseases. We used normal liver tissues (n=6), which were liver donors without past chronic medical history, as the controls. The mean age and sex distribution of the two groups were roughly matched. The liver tissue samples were embedded in paraffin and proteins were extracted for analysis.
Prior to sample collection, all subjects provided informed consent. The study was approved by the Ethics Committee of the Fifth Affiliated Hospital of Sun Yat-sen University in accordance with the Declaration of Helsinki (protocol identification code: [2020] L173-1).
Cell Culture and Treatments
The human liver cell line LO2 was obtained from Sun Yat-sen University Cancer Center and the experiments on human liver cells were approved by the Ethics Committee of the Fifth Affiliated Hospital of Sun Yat-sen University (protocol identification code: [2020] L173-1). The cells were cultured in Dulbecco’s modified eagle medium (DMEM) (Gibco, USA) containing 10% fetal bovine serum (Gibco, USA) and 1% penicillin/streptomycin (Gibco, USA) in a humidified incubator with 5% CO2 and ambient oxygen at 37°C.
Lentivirus vectors encoding FST overexpression were prepared as described previously.30 To establish stable FST-overexpressing LO2 cells, we transfected the cells with the pLJM1‐EGFP (#19319, Addgene, USA) lentivirus vector encoding human FST isoforms (FST317 and FST344). To establish stable FST-knockdown LO2 cells, we transfected the cells with lentivirus vector encoding short hairpin RNA targeting FST (FSTsh), which was designed and produced by Genechem Technology Company (Shanghai, China). The control group of overexpression was transfected with the vector of EGFP in LO2 cells, whereas scramble shRNA (NCsh) transfected cells were used as the control group for FST knockdown.
LO2 cells and stable cell lines of FST overexpression or knockdown were seeded into 6-well plates (25×103 cells/well) and adhered overnight. The cells were treated for 24h with DMEM containing 1 mM free fatty acid (FFA), which was a mixture of palmitic acid and oleic acid in a molar ratio of 1:2, or bovine serum albumin (BSA, fatty acids free) in the control (CON) group. Additionally, the FSTsh group (FST-knockdown LO2 cells) was pretreated with 20 nM rapamycin (mTOR inhibitor) for 1 h and then 1 mM FFA for 24 h.
Cell Viability
The cytotoxic effect of FFA on LO2 cells was evaluated using cell counting kit-8 (CCK-8) assays (HY-K0301, MCE, USA). The cells (5000 per well) were seeded into a 96-well plate, cultivated overnight, and then exposed to DMEM containing various concentrations of FFA (from 0.5 to 4 mM) for 24 h. The control cells were not treated with FFA. The plates were incubated for 2 h at 37°C with CCK-8 solution added to each well. The absorbance was measured using a microplate reader (Bio-Rad, USA).
Animal Experiments
C57BL/6J male mice aged 4 weeks were purchased from Sperford Biotechnology Company (approval no. SCXK [Jing] 2019–0010, China). The mice were housed in isolation cages with free access to water, at an ambient temperature of 22±2°C and 50–60% humidity, with a 12h/12h light/dark cycle. The animal experiments were conducted in accordance with the recommended Ethical Guidelines of the International Council for Laboratory Animal Science, and approved by the Ethics Committee of the Fifth Affiliated Hospital of Sun Yat-sen University (approval no. 00182).
Mice fed with a normal control diet (NCD, #LAD3001, China) were used as the control group (n=6), and the others fed with a high-fat diet (HFD, 60% fat, #D12492, China) for 12 weeks were used to establish the model mice. The HFD-induced obese mice with weight gain >20% relative to the mean were divided into four weight-matched groups, one of which was at the end of the experiment (n=6). The mice in the remaining three groups were injected with one of the following adeno-associated virus (AAV)-9 gene vectors at a dose of 2×10⁹vg via tail vein (n= 5 per group). The AAV-9 gene vectors were conducted by encoding GFP (control group) and two mice isoforms of FST overexpression (FST288 and FST315), which were designed and purchased from Genechem Technology Company (Shanghai, China). All the mice injected with an AAV vector were fed an HFD for another 12 weeks. Following 12 h of fasting, the mice were anesthetized. Thereafter, blood samples were collected from the eyeballs and stored at 4°C overnight prior to obtaining the serum. Liver tissue was dissected immediately. Some was frozen in liquid nitrogen or fixed in 4% paraformaldehyde for histological analysis, and the rest was stored at −80°C for future analyses.
Glucose Tolerance Test (GTT) and Insulin Tolerance Test (ITT)
The blood glucose levels in the caudal vein of the mice were examined using a One Touch blood glucose meter and test strips (ROCHE & ROCHE, Germany). The mice underwent GTT after an 8-h fast in the 14th and 26th weeks. Blood glucose levels were measured at baseline, 30, 60, 90, and 120 min after intraperitoneal injection of 2 g/kg D-glucose solution. At 1 week after each GTT, ITT was performed; the mice were fasted for 6 h and then injected with an insulin solution at 0.75 U/kg body weight (Novolin R, Denmark). Blood glucose levels were measured at baseline, 15, 30, 60, and 120 min.
Serum Parameter Assays
The fasting serum levels of alanine aminotransferase (ALT, #C009-2-1), aspartate aminotransferase (AST, #C010-2-1), TG (#A110-1-1), total cholesterol (T-CHO, #A111-1-1), and glucose (#A154-1-1) in mice were examined using commercial assay kits from Nanjing Jiancheng Bioengineering Institute (China). The mice serum levels of fasting FST (#MU30645), insulin (#MU30342), and C-peptide (#MU30629) were determined using commercially available enzyme-linked immunosorbent assay (ELISA) kits from Bioswamp Technology (China).
Morphological Examination
The liver tissue samples were embedded in paraffin, sectioned into 4-μm slices, and stained with hematoxylin and eosin (H&E). Oil red O staining was performed using frozen liver tissue sections, LO2 cells, and LO2 stable cell lines of FST overexpression or knockdown. The cells were treated as previously described. The stained area in 10 random fields was quantified using an optical microscope (Zeiss, Germany) and Image-Pro Plus 6.0 software (Media Cybernetics, USA).
Immunohistochemistry (IHC) and Immunofluorescence (IF) Staining
Paraffin-embedded liver sections were deparaffinized, hydrated, thermally repaired with 0.01 M sodium citrate buffer, and then incubated in 3% hydrogen peroxide for 10 min to eliminate endogenous peroxidase activity. Next, the sections were incubated with 5% BSA for 1 h at 37°C and primary antibody against FST (#60060-1-Ig, Proteintech, China) at 4°C overnight and then washed with phosphate-buffered saline three times.
For IHC staining, the sections were incubated with secondary antibody and StreptAvidin—Biotin Complex (SABC) for 30 min each (#SA1050, BOSTER, China), and then 3.3’-diaminobenzidine (DAB; #AR1022, BOSTER, China) was added for 3 min. Finally, hematoxylin staining was performed for cell counting. The IHC results were based on 10 random fields in each section using an optical microscope (Zeiss, Germany).
For IF staining, fluorescent secondary antibody (Alexa Fluor® 488-labeled goat anti-mouse IgG(H+L); #ab150113, Abcam) was added for 1 h at room temperature, and then the cell nuclei were counterstained with 4’,6-diamidino-2-phenylindole (DAPI) for 5 min. The IF images were obtained using a confocal microscope (Zeiss, Germany).
Western Blotting (WB)
The cells and liver tissues were lysed with a solution containing radioimmunoprecipitation assay buffer (RIPA, #P0013B, Beyotime, China) and a protease and phosphatase inhibitor cocktail (#P1046, Beyotime, China). The extracted protein was quantified using a bicinchoninic acid (BCA) protein assay kit (#P0010, Beyotime, China). For each experiment, the same quantity of proteins was separated on sodium dodecyl sulfate-polyacrylamide gel electrophoresis (SDS-PAGE) gel and then transferred to polyvinylidene difluoride (PVDF) membranes. The membrane was blocked with 5% nonfat milk, incubated with primary antibodies overnight at 4°C, incubated with secondary antibodies at room temperature for 1 h, and then developed using an enhanced chemiluminescence system (Tanon, China). The results were analyzed using ImageJ software (National Institutes of Health, USA).
The primary antibodies were β-actin (#AC026) and ChREBP (#A7360) from Abclonal Technology; SREBP1 (#ab28481) from Abcam Technology; mTOR (#T55306) and p-mTOR (#T55996) from Abmart Technology; ACC1 (#4190), FASN (#3180), Akt-Thr308 (#13038), Akt-Ser473 (#4060), and Akt (#9272) from Cell Signaling Technology; and FST (#AF669) from R&D Technology. The secondary antibodies were horseradish peroxidase (HRP)-labeled goat anti-rabbit IgG(H+L) (#A0208), HRP-labeled goat anti-mouse IgG(H+L) (#A0216), and HRP-labeled donkey anti-goat IgG(H+L) (#A0181) from Beyotime Technology.
Quantitative Real-Time PCR (qPCR)
Total RNA of cells and liver tissues was isolated using TRIzol reagent (Thermo Fisher, USA). cDNA was prepared from 1000 ng RNA samples using a TAKARA reverse transcription (RT) kit (#RR037A, Japan). Then, qPCR was performed using SYBR Green Master Mix (#A25780, Thermo Fisher, USA) and specific qPCR primers sets (Table 1) in a Real-Time PCR system (Applied Biosystems, USA). The results were calculated based on Ct values and normalized to glyceraldehyde 3-phosphate dehydrogenase (GAPDH).
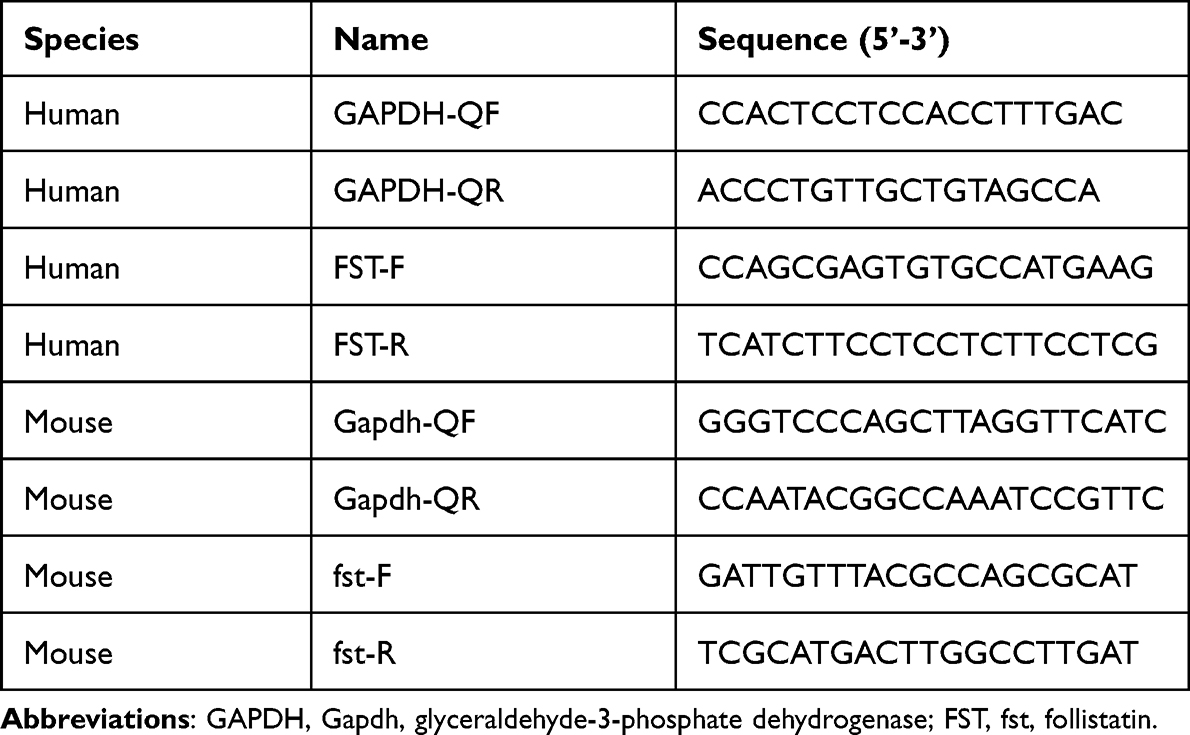 |
Table 1 The Primer Sequences Used in This Study |
Statistical Analysis
The analysis was completed with GraphPad Prism 8.0 (La Jolla, USA). Data are presented as mean ± standard deviation (SD). Statistical significance was analyzed by two-tailed unpaired t-tests for two groups, and one-way analysis of variance (ANOVA) followed by Tukey’s tests for more than two groups. P < 0.05 was considered statistically significant.
Results
FST Expression Was Increased in NAFLD Patients
The pathological diagnosis of NAFLD was independently confirmed by two pathologists based on H&E staining of the liver biopsy specimens, which showed vacuolation and hepatocellular ballooning in NAFLD patients compared to the normal subjects (Figure 1A). FST was widely expressed in the cytoplasm and nucleus of hepatocytes, and hepatic FST secretion was higher in NAFLD than normal liver samples (Figure 1B–D). We examined the hepatic FST protein expression and found that it was higher in patients with NAFLD than normal controls (Figure 1E and F).
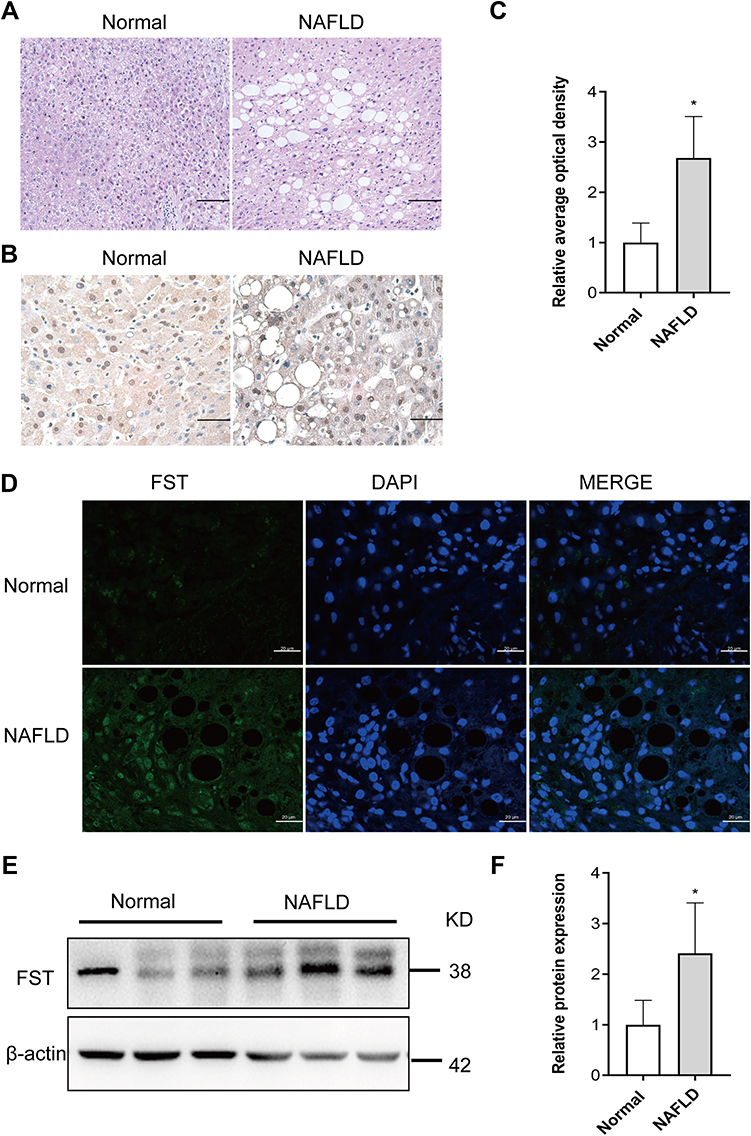 |
Figure 1 Hepatic FST level was elevated in NAFLD liver samples compared to normal liver samples. (A) H&E staining of liver sections in NAFLD and normal liver samples (200×, scale bar: 100 µm). (B and C) Immunohistochemical staining and analysis result of hepatic FST in NAFLD and normal liver samples (400×, scale bar: 50 µm). (D) Immunofluorescence staining of hepatic FST in NAFLD and normal liver samples. (630×, scale bar: 20 µm). (E and F) The protein level and analysis result of hepatic FST in NAFLD and normal liver samples. β-actin was used as a loading control. Abbreviations: FST, follistatin; NAFLD, non-alcoholic fatty liver disease; H&E, hematoxylin and eosin. Note: n= 6. *P< 0.05 vs normal group. |
FST Expression Was Increased in FFA-Treated LO2 Cells
The model of hepatic steatosis was induced by treating human hepatic LO2 cells with FFA. LO2 cells treated with 0.5 and 1.0 mM FFA showed no significant difference in cell viability (Figure 2A). LO2 cell exposure to 1.0 mM FFA for 24 h resulted in obvious intracellular accumulation of lipid droplets (Figure 2B and C). The protein expression of FASN, ACC1, SREBP1, ChREBP, and FST was significantly increased in FFA-treated LO2 cells compared to control LO2 cells (Figures 2D and E). These results confirmed the results in NAFLD patients that the expression levels of hepatic FST were significantly elevated during hepatic steatosis, both in vivo and in vitro.
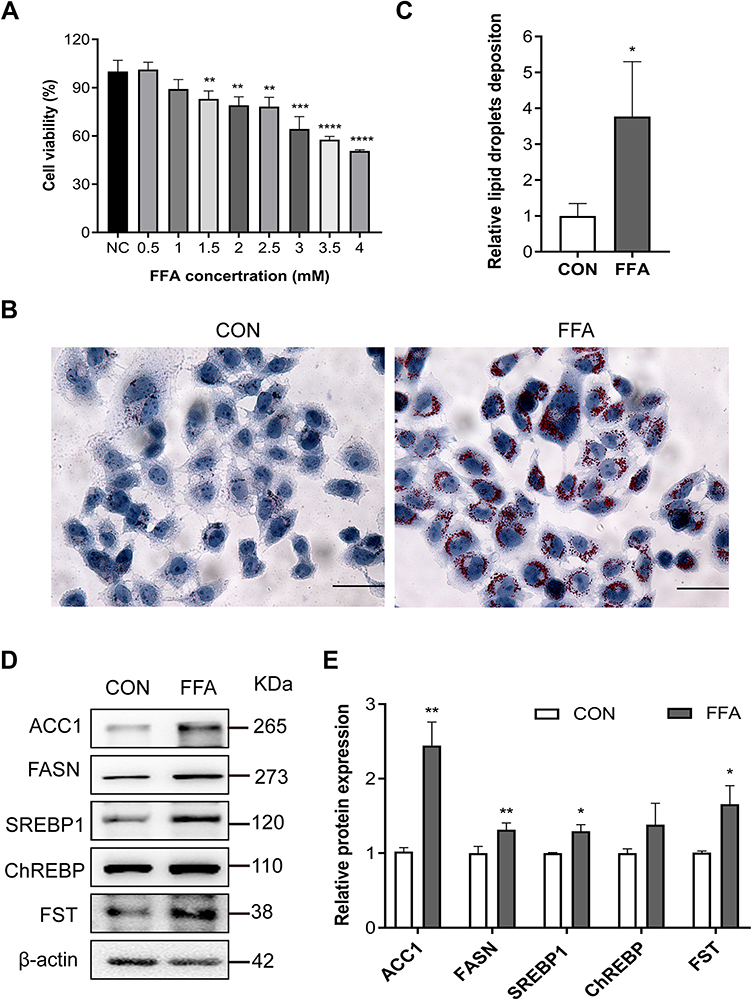 |
Figure 2 FST expression increased in the FFA-treated human liver (LO2) cells. (A) CCK-8 assay results showed the viability of LO2 cells treated with different concentrations of FFA. (B and C) Oil red O staining and analysis result of LO2 cells with the control (CON) and 1 mM FFA treatment (400×, scale bar: 50 µm). (D and E) The protein expression and analysis results of FST, ACC1, FASN, SREBP1, and ChREBP in LO2 cells with the control and 1 mM FFA treatment. β-actin was used as a loading control. Abbreviations: FST, follistatin; FFA, free fatty acid; BSA, bovine serum albumin (fatty acid free); SREBP1, sterol regulatory element-binding protein1; ChREBP, carbohydrate-responsive element-binding protein; ACC1, acetyl-CoA carboxylase1; FASN, fatty acid synthase. Notes: NC group was LO2 cells without FFA treatment. control (CON) group was LO2 cells treated with BSA. *P< 0.05, **P< 0.01, ***P< 0.001, ****P< 0.0001 vs NC group or CON group. |
FST Overexpression Reduced Lipid Accumulation in FFA-Treated LO2 Cells
To investigate the effects of FST on intracellular lipid accumulation in hepatocytes, we established stable FST-overexpressing LO2 cells. The efficiency of FST overexpression was confirmed by RT-qPCR and Western blotting (Figure 3A and B). Oil red O staining revealed that FST overexpression significantly decreased FFA-induced lipid droplet accumulation in LO2 cells (Figure 3C and D). After FFA treatment, the protein levels of ACC1, SREBP1, and FASN were significantly decreased in FST-overexpressing LO2 cells (for both the FST317 and FST344 isoforms) compared to the control (EGFP) cells, and the protein level of ChREBP was significantly decreased in the FST317 overexpressing LO2 cells (Figure 3E). Furthermore, FST overexpression significantly decreased the protein expression of Akt-Thr308, Akt-Ser473, Akt, p-mTOR, and mTOR, as well as the Akt-Thr308/Akt, Akt-Ser473/Akt, and p-mTOR/mTOR ratios (Figure 3F and G). These results suggested that FST overexpression alleviates lipid synthesis and suppressed the Akt/mTOR signaling pathway in vitro.
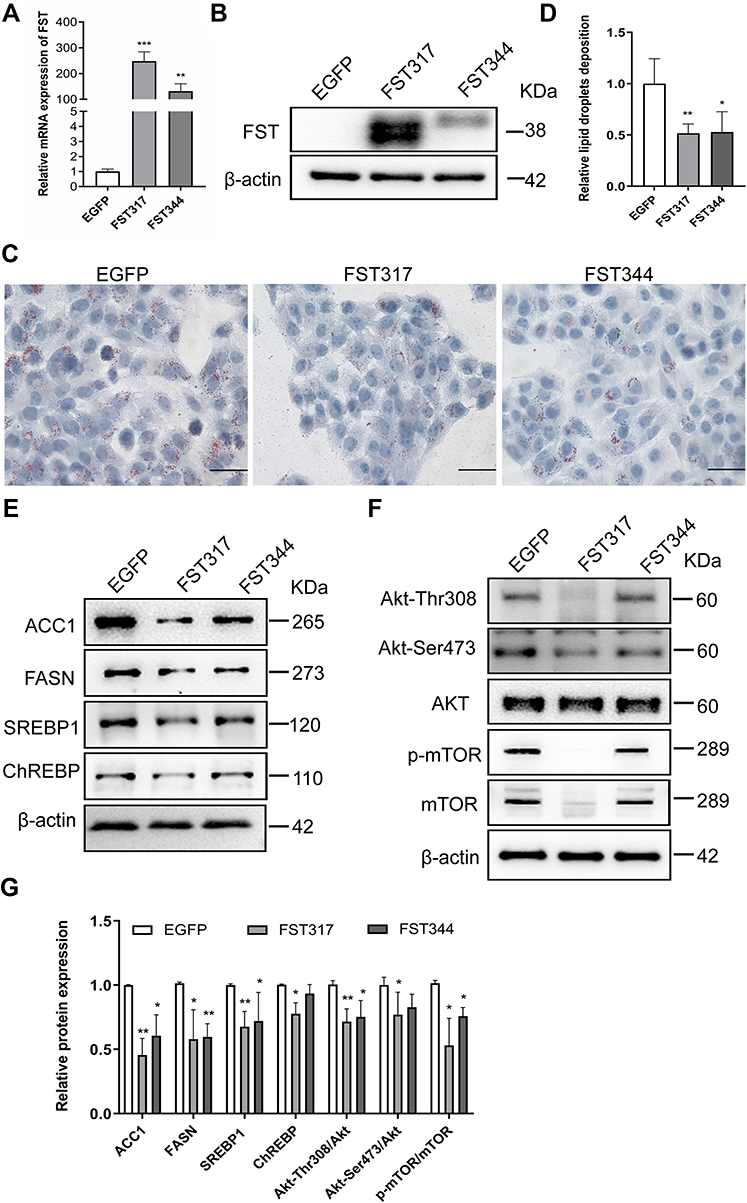 |
Figure 3 FST overexpression decreased lipid accumulation in FFA-treated LO2 cells. (A and B) The efficiency of FST overexpression in LO2 cells was demonstrated by RT-qPCR and Western blotting. (C and D) Oil red O staining and analysis result of control cells (EGFP) and FST-overexpressing LO2 cells treated with 1.0 mM FFA for 24 h (400×, scale bar=50 µm). (E–G) The protein levels and analysis results of ACC1, FASN, SREBP1, ChREBP, Akt, Akt-Thr308, Akt-Ser473, p-mTOR, and mTOR in the control cells and FST-overexpressing LO2 cells treated with 1 mM FFA for 24h. β-actin was used as a loading control. Abbreviations: FST, follistatin; FFA, free fatty acid; SREBP1, sterol regulatory element-binding protein1; ChREBP, carbohydrate-responsive element-binding protein; ACC1, acetyl-CoA carboxylase1; FASN, fatty acid synthase; Akt, protein kinase B; mTOR, mammalian target of rapamycin. Notes: *P< 0.05, **P< 0.01, ***P< 0.001 vs EGFP group. |
FST Knockdown Exacerbated Intracellular Lipid Accumulation in a Process Involving the mTOR Pathway
To ascertain the regulatory mechanism underlying the effect of FST on hepatic DNL in vitro, we established a stable FST-knockdown LO2 cell line and used the mTOR inhibitor rapamycin. The efficiency of FST knockdown is shown in Figure 4A and B. Oil red O staining showed that FFA-treated FSTsh cells had increased intracellular lipid accumulation compared to FFA-treated NCsh cells, while rapamycin pretreatment mitigated intracellular lipid accumulation in FFA-treated FSTsh cells (Figure 4C and D). Furthermore, the protein expression of ACC1, FASN, SREBP1, ChREBP, Akt, Akt-Thr308, Akt-Ser473, mTOR, and p-mTOR and the Akt-Ser 473/Akt, Akt-Thr308/Akt, and p-mTOR/mTOR ratios were increased in FFA-treated FSTsh cells compared to FFA-treated NCsh cells (Figure 4E–H). Additionally, the protein levels of ACC1, FASN, SREBP1, and ChREBP were decreased in FFA- and rapamycin-treated FSTsh cells compared to FFA-treated FSTsh cells (Figure 4G and H). Taken together, the results indicate that FST regulates hepatic DNL via Akt/mTOR signaling in an mTOR-dependent manner in LO2 cells.
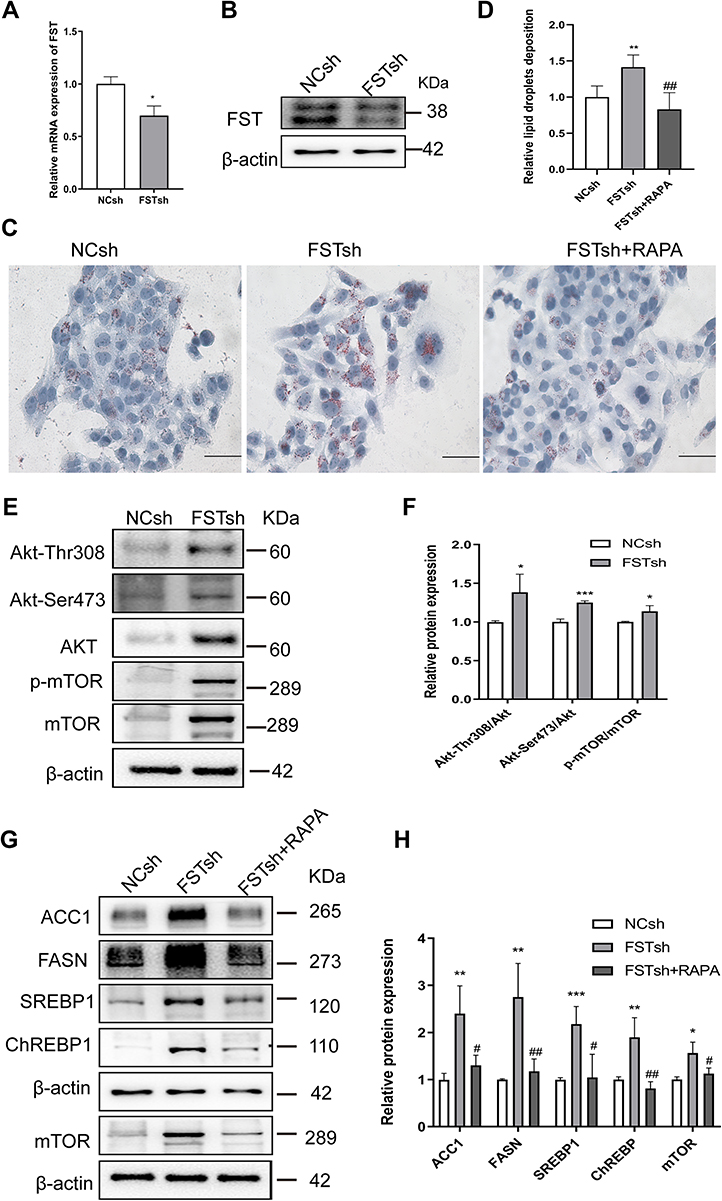 |
Figure 4 FST knockdown aggravated lipid accumulation in LO2 cells and this effect was inhibited by rapamycin. (A and B) The efficiency of FST knockdown in LO2 cells was demonstrated by RT-qPCR and Western blotting. (C and D) Oil Red O staining and analysis results of FFA-treated negative control shRNA (NCsh) cells, FFA-treated FST-knockdown (FSTsh) cells, and FFA- and rapamycin-treated FSTsh (FSTsh+RAPA) cells (400×, scale bar: 50 µm). (E and F) The protein levels and analysis results of Akt, Akt-Thr308, Akt-Ser473, p-mTOR, and mTOR in FFA-treated NCsh cells and FFA-treated FSTsh cells. (G and H) The protein levels and analysis results of ACC1, FASN, SREBP1, ChREBP, and mTOR in NCsh, FSTsh, FSTsh+RAPA cells. β-actin was used as a loading control. Abbreviations: FST, follistatin; FFA, free fatty acid; SREBP1, sterol regulatory element-binding protein1; ChREBP, carbohydrate-responsive element-binding protein; ACC1, acetyl-CoA carboxylase1; FASN, fatty acid synthase; Akt, protein kinase B; mTOR, mammalian target of rapamycin; RAPA, rapamycin. Notes: *P< 0.05, **P< 0.01, ***P< 0.001 vs NCsh group; #P< 0.05, ##P< 0.01 vs FSTsh group. |
Hepatic FST Was Increased in HFD-Induced Obese Mice
To examine the effects of FST in vivo, we established a NAFLD mice model by feeding mice an HFD. The flowchart of the animal experiment was shown in Figure 5A. The body weight of mice fed with HFD significantly increased after 12 weeks compared to the NCD group (Figure 5B). For both GTT and ITT, the area under the curve (AUC) values significantly increased, confirming that the HFD-induced obese mice exhibited insulin resistance (Figure 5C–F). H&E staining showed that the HFD mice exhibited hepatic steatosis, and oil red O staining confirmed that lipid droplets were deposited in the liver sections of HFD mice (Figure 5G). The protein expression levels of ACC1, FASN, SREBP1, and ChREBP were also increased in the liver tissues of the HFD mice compared to the NCD mice (Figure 6A and B). In summary, these results demonstrated that mice fed with HFD developed the features of NAFLD. Furthermore, hepatic FST protein level was upregulated in the HFD mice compared to the NCD mice (Figure 6A and B). The IHC result showed that FST was widely expressed in mouse hepatocytes, and FST secretion was increased in HFD mice compared to NCD mice (Figure 6C). These results were consistent with the results observed in the liver tissues of NAFLD patients.
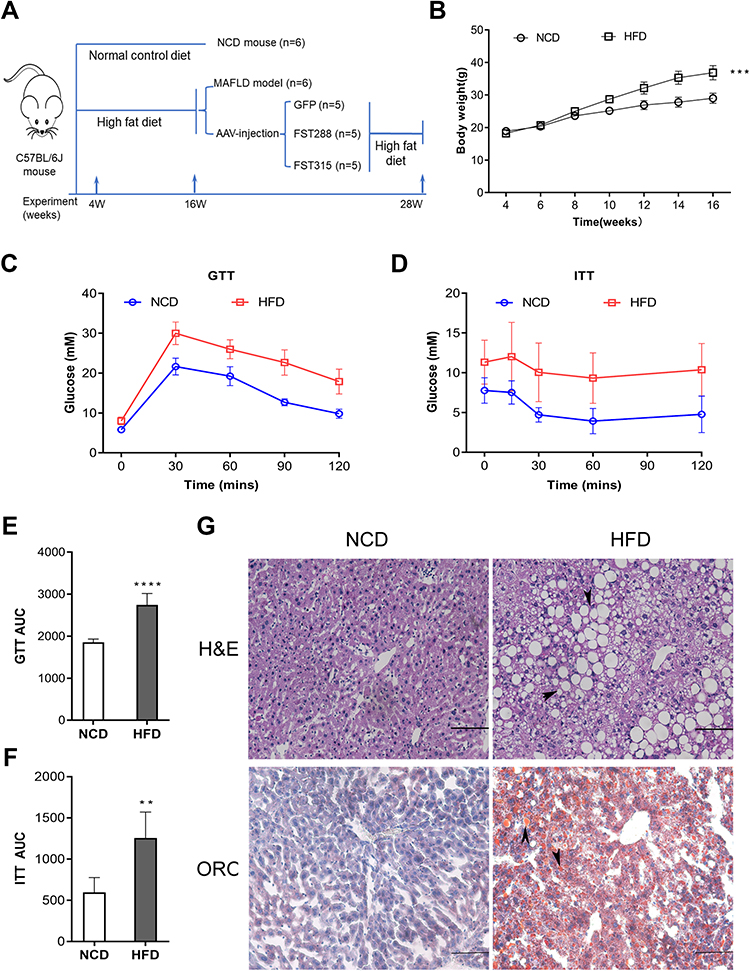 |
Figure 5 Establishment and characterization of NAFLD mice model fed with HFD. (A) The schematic diagram of mice experiments. (B) Body weight of NCD and HFD mice. (C and D) GTT and ITT results in NCD and HFD mice. (E and F) AUC for GTT and ITT. (G) H&E and Oil Red O staining in NCD and HFD mice (200×, scale bar: 100 µm). The marks represented the main pathohistological findings. Abbreviations: NAFLD, non-alcoholic fatty liver disease; HFD, high-fat diet; NCD, normal control diet; GTT, glucose tolerance test; ITT, insulin tolerance test; AUC, area under the curve; H&E, hematoxylin and eosin; ORO, oil red O. Notes: n= 6. **P< 0.01, ***P< 0.001, ****P< 0.0001 vs NCD group. |
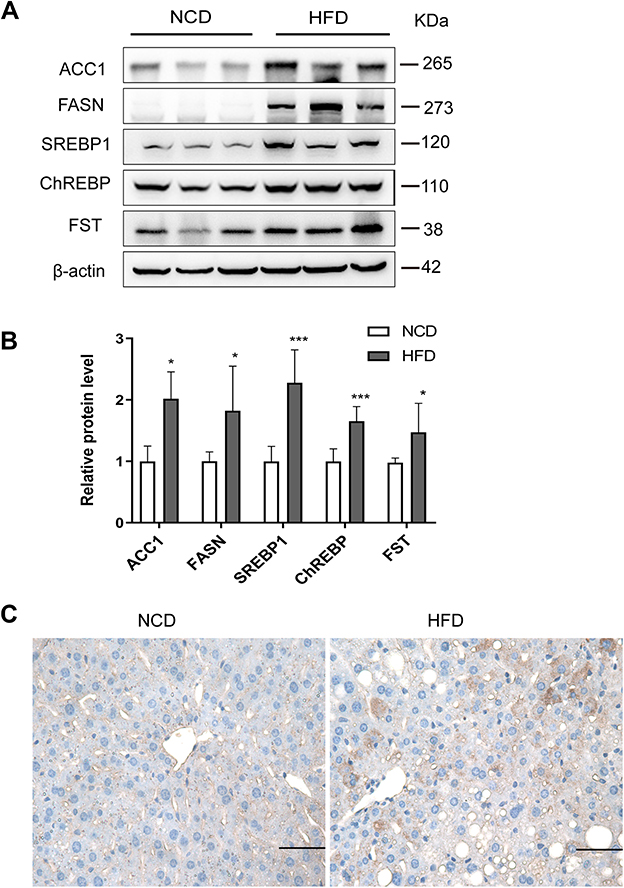 |
Figure 6 Hepatic FST expression increased in HFD mice. (A and B) The hepatic protein levels and analysis results of FST, ACC1, FASN, SREBP1, and ChREBP in NCD and HFD mice. β-actin was used as a loading control. (C) Immunohistochemical staining of hepatic FST in NCD and HFD mice (400×, scale bar= 50 µm). Abbreviations: NAFLD, non-alcoholic fatty liver disease; HFD, high-fat diet; NCD, normal control diet; FST, follistatin; SREBP1, sterol regulatory element-binding protein1; ChREBP, carbohydrate-responsive element-binding protein; ACC1, acetyl-CoA carboxylase1; FASN, fatty acid synthase. Notes: n= 6. *P< 0.05, ***P< 0.001 vs NCD group. |
Hepatic FST Overexpression Alleviated HFD-Induced Obesity
Hepatic FST mRNA expression levels were increased in the HFD-induced obese mice treated with AAV-9 encoding FST overexpression (AAV-FST288 or AAV-FST315) compared to the control (AAV-GFP) (Figure 7A). These mice were fed with HFD for another 12 weeks, the body weight gain was lower in the AAV-FST288 group compared to the control group (Figure 7B). H&E and oil red O staining revealed that the degree of hepatocyte ballooning and lipid accumulation was significantly alleviated in the AAV-FST288 and AAV-FST315 groups compared to the control group (Figure 7C and D). Both the FST overexpression groups of HFD mice showed a trend toward lower fasting serum levels of TG and T-CHO compared to the control group, but only fasting serum T-CHO levels in the AAV-FST288 group had a significant difference compared to the AAV-GFP group (Figure 7E and F). Fasting serum insulin was increased in the AAV-FST315 group compared with the control group (Figure 7G). There was no obvious difference in the fasting serum levels of FST, ALT, AST, glucose, or C-peptide among the three groups (Figure 7H–L). These results demonstrated that FST gene therapy (especially treatment with AAV-FST288) could reduce weight gain, decrease serum lipid levels, and alleviate hepatic steatosis in HFD mice.
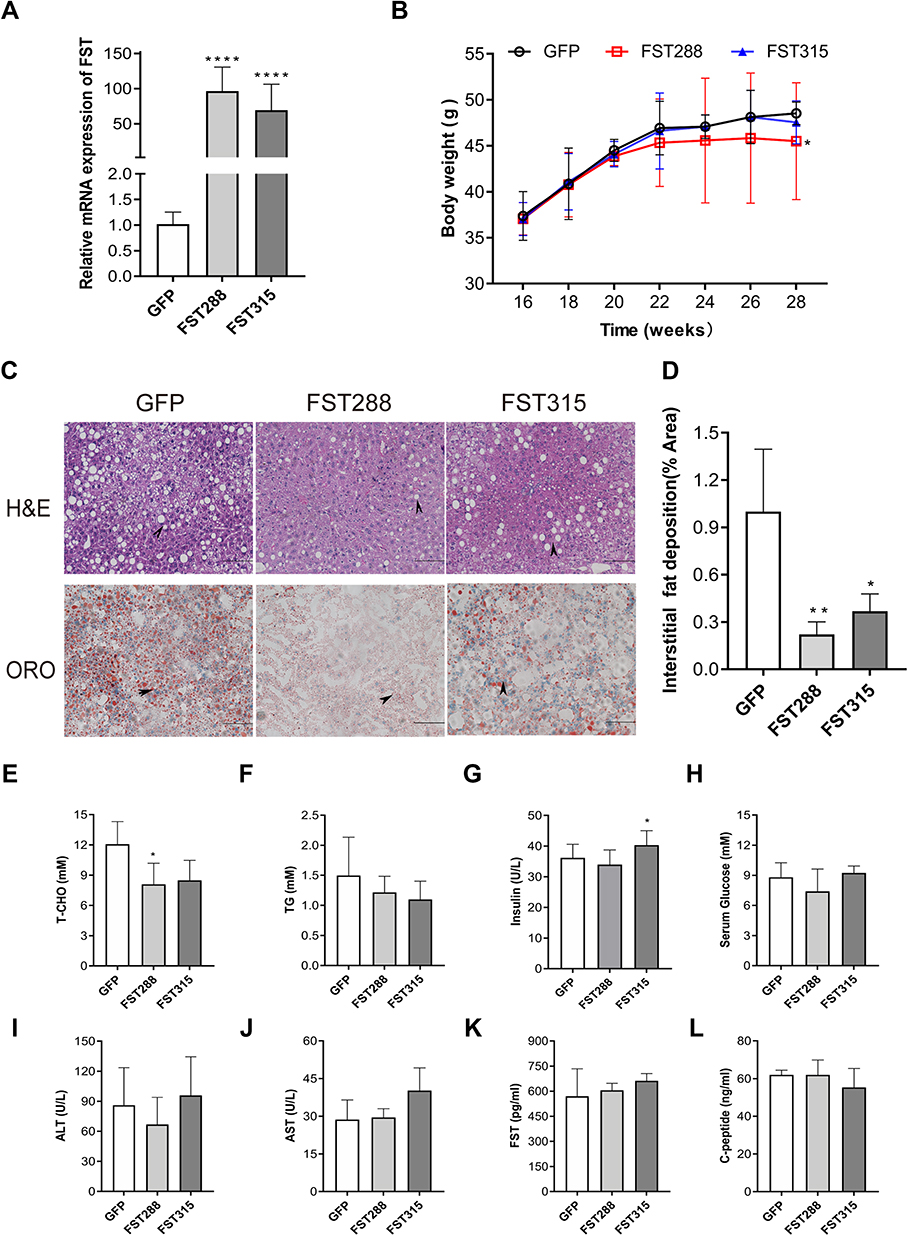 |
Figure 7 FST overexpression alleviated hepatic steatosis in HFD mice. (A) Hepatic FST mRNA expression in the control (treated with an AAV vector encoding GFP) and FST-overexpressing (treated with an AAV vector encoding FST288 and FST315) HFD mice. (B) Body weight of the control and FST-overexpressing HFD mice. (C and D) H&E and oil red O staining in the liver sections of the control and FST-overexpressing HFD mice. (200×, scale bar=100 µm). The marks represented the main pathohistological difference. (E–L) The serum levels of T-CHO, TG, glucose, ALT, AST, FST, insulin, and C-peptide in the control and FST-overexpressing HFD mice. Abbreviations: FST, follistatin; ORO, oil red O; AAV, adeno-associated virus; T-CHO, total cholesterol; TG, triglyceride; ALT alanine aminotransferase; AST, aspartate aminotransferase. Notes: n= 5. *P< 0.05, **P< 0.01, ****P< 0.0001 vs GFP group. |
FST Overexpression Reduced Hepatic DNL and Inhibited the AKT/mTOR Pathway in HFD-Induced Obese Mice
To verify the mechanism underlying the effect of FST on hepatic steatosis in vivo, we assessed lipogenesis-related protein expression in mice liver tissues. The results showed that the protein expression of ACC1, FASN, SREBP1, ChREBP, Akt, Akt-Thr308, Akt-Ser473, and p-mTOR, and the p-mTOR/mTOR ratio, were decreased by FST overexpression (for both FST isoforms) in HFD-induced obese mice compared to the control mice (Figure 8A and B). Thus, FST overexpression inhibited hepatic lipogenesis and the Akt/mTOR pathway in vivo.
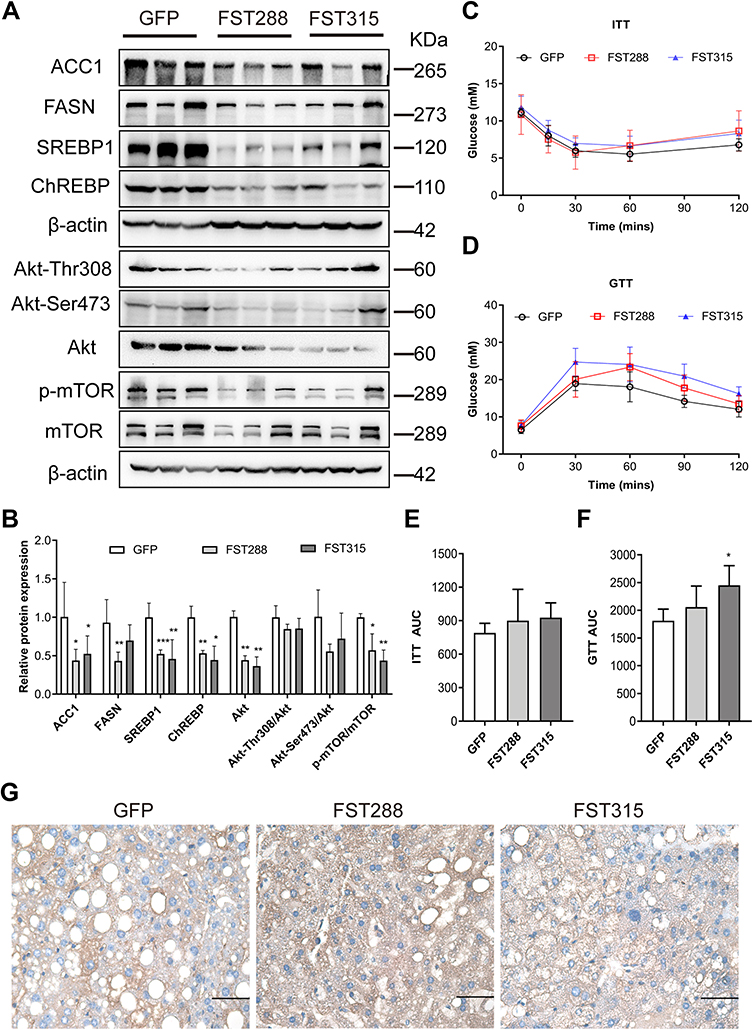 |
Figure 8 FST overexpression inhibited lipid synthesis and Akt/mTOR pathway in HFD mice. (A and B) The protein expression and analysis results of ACC1, FASN, SREBP1, ChREBP, Akt, Akt-Thr308, Akt-Ser473, p-mTOR, and mTOR in the control (treated with an AAV vector encoding GFP) and FST-overexpressing (treated with an AAV vector encoding FST288 and FST315) HFD mice. β-actin was used as a loading control. (C and D) GTT and ITT results in the control and FST-overexpressing HFD mice. (E and F) AUC for GTT and ITT. (G) Immunohistochemical staining of hepatic FST in the control and FST-overexpressing HFD mice (400×, scale bar: 50 µm). Abbreviations: FST, follistatin; SREBP1, sterol regulatory element-binding protein1; ChREBP, carbohydrate-responsive element-binding protein; ACC1, acetyl-CoA carboxylase1; FASN, fatty acid synthase; Akt, protein kinase B; mTOR, mammalian target of rapamycin; GTT, glucose tolerance test; ITT, insulin tolerance test; AUC, area under the curve; AAV, adeno-associated virus. Notes: n= 5. *P< 0.05, **P< 0.01, ***P< 0.001 vs GFP group. |
Furthermore, we assessed the insulin resistance status of FST-overexpressing mice using GTT and ITT. Unexpectedly, the AUC for GTT increased in the AAV-FST315 group compared to the control group (Figure 8C–F). The result of IHC showed that FST was widely expressed in the liver and the level of hepatic FST secretion increased in both FST-overexpressing groups (AAV-FST288 and AAV-FST315 groups) compared to the control group (Figure 8G). Thus, the data showed that hepatic FST overexpression alleviated hepatic lipogenesis via the Akt/mTOR pathway in HFD-induced obese mice, but there was no decrease in insulin resistance.
Discussion
NAFLD is the most common chronic liver disease around the world and its prevalence is expected to continue rising.3,31 Despite lifestyle modification that could improve NAFLD, several reasons such as osteoarticular problems lead to this method being difficult to sustain. Numerous pharmaceutical therapies are currently being tested for the treatment of NAFLD, however, the results were not satisfying in clinical trials.9 Due to the multiple pathophysiology of NAFLD, several targets need to be engaged to improve therapeutic effects.32 NAFLD development is closely related to lipid accumulation, so understanding the molecules that regulate hepatic lipid metabolism will help to develop new treatments for NAFLD.33
It is well known that FST inhibited the activities of myostatin and activin, two hormones that are upregulated in obese individuals.34 The levels of circulating FST, which originates from the liver, are significantly elevated in NASH and type 2 diabetes patients.28,35 In our study, hepatic FST levels were enhanced in NAFLD patients and HFD-induced obese mice. We then generated FST overexpression and knockdown LO2 cells with gene vectors and demonstrated that FST overexpression reduced hepatic lipid accumulation after FFA treatment, whereas FST knockdown alleviated hepatic steatosis. These results provide evidence that increased hepatic FST plays a protective role in the hepatic steatosis of NAFLD.
Hepatic steatosis plays a vital role in NAFLD development and progression, and is linked to insulin resistance and dyslipidemia.13 Lipogenesis is the primary factor determining ectopic lipid accumulation in hepatocytes. SREBP1, which regulates the hepatic lipogenic enzymes FASN and ACC1, along with ChREBP, is essential for lipogenic transcription.36,37 Therefore, these markers were considered biomarkers of hepatic DNL in our study. Tang et al reported that FST overexpression gene therapy decreased the body fat percentage and adipose tissue content of mice.25 Although FST transgenic mice have been successfully developed, the methods were not applicable for clinical treatment.21,38 However, gene therapy using AAV vectors has been shown to be safe and effective in clinical trials.39 Therefore, we investigated the potential impact of hepatic FST on NAFLD and its regulation of lipid metabolism via gene therapy using AAV vectors. FST overexpression in HFD-induced mice, especially regarding the FST288 isoform, suppressed body weight gain and, for the first time, was shown to reduce serum T-CHO levels. We also demonstrated that hepatic FST regulated the protein levels of SREBP1, FASN, ACC1, and ChREBP in vitro and in vivo. These results suggested that FST can regulate hepatic DNL, and overexpression of FST, especially the FST288 isoform, alleviated obesity and inhibited hepatic lipogenesis.
Several studies have demonstrated the key role of mTOR in cellular growth and metabolism.40,41 There are two forms of protein complexes in mTOR protein, namely, mTOR Complex 1 (mTORC1) and mTOR Complex 2 (mTORC2). The rapamycin-sensitive mTORC1 promoted lipogenesis via the activation of SREBPs in an Akt-dependent manner.42 Furthermore, in the liver, mTORC2 regulates Akt activity by directly phosphorylating Akt at Serine 473 in response to lipid metabolism and growth factor signaling in the liver.43,44 The main co-morbidity of patients with NAFLD is atherosclerosis, and the mTOR inhibitors may have a therapeutic role in atherosclerosis, as evidenced by their attenuation of inflammation and enhancement of atherosclerotic plaque stability.45 A recent study found that FST could downregulate the Akt pathway in cardiocytes.46 Thus, we assumed that mTOR was a key factor underlying how FST regulated lipid synthesis. We found that FST was a negative regulator of Akt and mTOR signaling in hepatic lipid synthesis. The Akt/mTOR pathway was inhibited by FST overexpression both in vitro and in vivo. Moreover, lipid accumulation and lipogenic molecule activation in FST-knockdown cells were inhibited by the mTOR inhibitor rapamycin. Taken together, these data suggested that FST regulated hepatic DNL via Akt/mTOR pathway in an mTOR-dependent manner.
Li et al demonstrated that FST secretion was correlated with fat mass.47 Although we successfully treated the obese mice by overexpressing FST, serum FST was not significantly increased at the end of the experiment, potentially due to the attenuated body weight of FST-overexpressing mice.
We demonstrated that FST overexpression inhibited lipid synthesis and hepatic steatosis in HFD-induced obese mice, but insulin resistance, another characteristic of NAFLD, was not significantly improved. However, in a previous study, a specific knockout of hepatic FST was shown to significantly improve blood glucose and insulin resistance in HFD-induced obese mice.48 In contrast, in a recent genome-wide association study, elevated circulating FST levels increased the risk of type 2 diabetes by triggering insulin resistance in the adipose tissue.49 We speculated that FST may have different effects on glucose and hepatic lipid metabolism via different pathways or tissue-specific expression. Further studies are needed to determine the precise mechanisms underlying these effects.
There are some limitations in this study. Firstly, due to the limited number of liver samples, the results of this study need to be confirmed in more clinical liver samples. Secondly, our study has demonstrated that FST overexpression reduced hepatic steatosis in vitro and in vivo, however, the effect of FST knockdown on hepatic lipid metabolism in vivo needs to be further explored.
Conclusion
In conclusion, our study is the first to report that FST inhibits hepatic steatosis via Akt/mTOR signaling in the mTOR dependent manner. An enhanced level of FST could be protective against hepatic steatosis of NAFLD. Therefore, specifically increasing FST is a promising new therapeutic approach for treating obesity and obesity-related NAFLD in the future.
Ethical Approval
The study was approved by the Ethics Committee of the Fifth Affiliated Hospital of Sun Yat-sen University (approval no. of human study: [2020] L173-1; approval no. of animal study: 00182). The LO2 cells were authenticated by STR profile.
Acknowledgments
This work was supported by the National Natural Science Foundation of China (81971773) and Guangdong Basic and Applied Basic Research Foundation (2019A1515011356, 2020A1515010203, and 2022A1515011244).
Disclosure
The authors declare that they have no competing interests.
References
1. Rinella ME. Nonalcoholic fatty liver disease: a systematic review. JAMA. 2015;313(22):2263–2273. doi:10.1001/jama.2015.5370
2. Eslam M, Newsome PN, Sarin SK, et al. A new definition for metabolic dysfunction-associated fatty liver disease: an international expert consensus statement. J Hepatol. 2020;73(1):202–209. doi:10.1016/j.jhep.2020.03.039
3. Sheka AC, Adeyi O, Thompson J, Hameed B, Crawford PA, Ikramuddin S. Nonalcoholic steatohepatitis: a review. JAMA. 2020;323(12):1175–1183. doi:10.1001/jama.2020.2298
4. Powell EE, Wong VW-S, Rinella M. Non-alcoholic fatty liver disease. Lancet. 2021;397(10290):2212–2224. doi:10.1016/S0140-6736(20)32511-3
5. Byrne CD, Targher G. NAFLD: a multisystem disease. J Hepatol. 2015;62(1 Suppl):S47–S64. doi:10.1016/j.jhep.2014.12.012
6. Friedman SL, Neuschwander-Tetri BA, Rinella M, Sanyal AJ. Mechanisms of NAFLD development and therapeutic strategies. Nat Med. 2018;24(7):908–922. doi:10.1038/s41591-018-0104-9
7. Vilar-Gomez E, Martinez-Perez Y, Calzadilla-Bertot L, et al. Weight loss through lifestyle modification significantly reduces features of nonalcoholic steatohepatitis. Gastroenterology. 2015;149(2):367–378.e5. doi:10.1053/j.gastro.2015.04.005
8. Younossi ZM, Loomba R, Rinella ME, et al. Current and future therapeutic regimens for nonalcoholic fatty liver disease and nonalcoholic steatohepatitis. Hepatology. 2018;68(1):361–371. doi:10.1002/hep.29724
9. Sumida Y, Yoneda M. Current and future pharmacological therapies for NAFLD/NASH. J Gastroenterol. 2018;53(3):362–376. doi:10.1007/s00535-017-1415-1
10. Negi CK, Babica P, Bajard L, Bienertova-Vasku J, Tarantino G. Insights into the molecular targets and emerging pharmacotherapeutic interventions for nonalcoholic fatty liver disease. Metabolism. 2022;126:154925. doi:10.1016/j.metabol.2021.154925
11. Watt MJ, Miotto PM, De Nardo W, Montgomery MK. The liver as an endocrine organ-linking NAFLD and insulin resistance. Endocr Rev. 2019;40(5):1367–1393. doi:10.1210/er.2019-00034
12. Ullah R, Rauf N, Nabi G, et al. Role of nutrition in the pathogenesis and prevention of non-alcoholic fatty liver disease: recent updates. Int J Biol Sci. 2019;15(2):265–276. doi:10.7150/ijbs.30121
13. Ipsen DH, Lykkesfeldt J, Tveden-Nyborg P. Molecular mechanisms of hepatic lipid accumulation in non-alcoholic fatty liver disease. Cell Mol Life Sci. 2018;75(18):3313–3327. doi:10.1007/s00018-018-2860-6
14. Softic S, Cohen DE, Kahn CR. Role of dietary fructose and hepatic de novo lipogenesis in fatty liver disease. Dig Dis Sci. 2016;61(5):1282–1293. doi:10.1007/s10620-016-4054-0
15. Wallace M, Metallo CM. Tracing insights into de novo lipogenesis in liver and adipose tissues. Semin Cell Dev Biol. 2020;108:65–71. doi:10.1016/j.semcdb.2020.02.012
16. Sanyal AJ. Past, present and future perspectives in nonalcoholic fatty liver disease. Nat Rev Gastroenterol Hepatol. 2019;16(6):377–386. doi:10.1038/s41575-019-0144-8
17. Laplante M, Sabatini DM. An emerging role of mTOR in lipid biosynthesis. Curr Biol. 2009;19(22):R1046–R1052. doi:10.1016/j.cub.2009.09.058
18. Caron A, Richard D, Laplante M. The roles of mTOR complexes in lipid metabolism. Annu Rev Nutr. 2015;35(1):321–348. doi:10.1146/annurev-nutr-071714-034355
19. Welt C, Sidis Y, Keutmann H, Schneyer A. Activins, inhibins, and follistatins: from endocrinology to signaling. A paradigm for the new millennium. Exp Biol Med. 2002;227(9):724–752. doi:10.1177/153537020222700905
20. Kimura F, Sidis Y, Bonomi L, Xia Y, Schneyer A. The follistatin-288 isoform alone is sufficient for survival but not for normal fertility in mice. Endocrinology. 2010;151(3):1310–1319. doi:10.1210/en.2009-1176
21. Matzuk MM, Lu N, Vogel H, Sellheyer K, Roop DR, Bradley A. Multiple defects and perinatal death in mice deficient in follistatin. Nature. 1995;374(6520):360–363. doi:10.1038/374360a0
22. Hansen JS, Plomgaard P. Circulating follistatin in relation to energy metabolism. Mol Cell Endocrinol. 2016;433:87–93. doi:10.1016/j.mce.2016.06.002
23. Hansen J, Brandt C, Nielsen AR, et al. Exercise induces a marked increase in plasma follistatin: evidence that follistatin is a contraction-induced hepatokine. Endocrinology. 2011;152(1):164–171. doi:10.1210/en.2010-0868
24. Braga M, Reddy ST, Vergnes L, et al. Follistatin promotes adipocyte differentiation, browning, and energy metabolism. J Lipid Res. 2014;55(3):375–384. doi:10.1194/jlr.M039719
25. Tang R, Harasymowicz NS, Wu C-L, et al. Gene therapy for follistatin mitigates systemic metabolic inflammation and post-traumatic arthritis in high-fat diet-induced obesity. Sci Adv. 2020;6(19):eaaz7492. doi:10.1126/sciadv.aaz7492
26. Khan RS, Bril F, Cusi K, Newsome PN. Modulation of insulin resistance in nonalcoholic fatty liver disease. Hepatology. 2019;70(2):711–724. doi:10.1002/hep.30429
27. Bugianesi E, Gastaldelli A, Vanni E, et al. Insulin resistance in non-diabetic patients with non-alcoholic fatty liver disease: sites and mechanisms. Diabetologia. 2005;48(4):634–642. doi:10.1007/s00125-005-1682-x
28. Polyzos SA, Kountouras J, Anastasilakis AD, Triantafyllou G, Mantzoros CS. Activin A and follistatin in patients with nonalcoholic fatty liver disease. Metabolism. 2016;65(10):1550–1558. doi:10.1016/j.metabol.2016.07.009
29. Yndestad A, Haukeland JW, Dahl TB, et al. A complex role of activin A in non-alcoholic fatty liver disease. Am J Gastroenterol. 2009;104(9):2196–2205. doi:10.1038/ajg.2009.318
30. He B-L, Yang N, Man CH, et al. Follistatin is a novel therapeutic target and biomarker in FLT3/ITD acute myeloid leukemia. EMBO Mol Med. 2020;12(4):e10895. doi:10.15252/emmm.201910895
31. Younossi ZM. Non-alcoholic fatty liver disease - A global public health perspective. J Hepatol. 2019;70(3):531–544. doi:10.1016/j.jhep.2018.10.033
32. Dufour JF, Caussy C, Loomba R. Combination therapy for non-alcoholic steatohepatitis: rationale, opportunities and challenges. Gut. 2020;69(10):1877–1884. doi:10.1136/gutjnl-2019-319104
33. Trépo E, Valenti L. Update on NAFLD genetics: from new variants to the clinic. J Hepatol. 2020;72(6):1196–1209. doi:10.1016/j.jhep.2020.02.020
34. Sylow L, Vind BF, Kruse R, et al. Circulating follistatin and activin a and their regulation by insulin in obesity and type 2 diabetes. J Clin Endocrinol Metab. 2020;105(5):1343–1354. doi:10.1210/clinem/dgaa090
35. Hansen J, Rinnov A, Krogh-Madsen R, et al. Plasma follistatin is elevated in patients with type 2 diabetes: relationship to hyperglycemia, hyperinsulinemia, and systemic low-grade inflammation. Diabetes Metab Res Rev. 2013;29(6):463–472. doi:10.1002/dmrr.2415
36. Linden AG, Li S, Choi HY, et al. Interplay between ChREBP and SREBP-1c coordinates postprandial glycolysis and lipogenesis in livers of mice. J Lipid Res. 2018;59(3):475–487. doi:10.1194/jlr.M081836
37. Sanders FWB, Griffin JL. De novo lipogenesis in the liver in health and disease: more than just a shunting yard for glucose. Biol Rev Camb Philos Soc. 2016;91(2):452–468. doi:10.1111/brv.12178
38. Wijayarathna R, Sarraj MA, Genovese R, et al. Activin and follistatin interactions in the male reproductive tract: activin expression and morphological abnormalities in mice lacking follistatin 288. Andrology. 2017;5(3):578–588. doi:10.1111/andr.12337
39. Naso MF, Tomkowicz B, Perry WL 3rd, Strohl WR. Adeno-associated virus (AAV) as a vector for gene therapy. BioDrugs. 2017;31(4):317–334. doi:10.1007/s40259-017-0234-5
40. Lamming DW, Sabatini DM. A Central role for mTOR in lipid homeostasis. Cell Metab. 2013;18(4):465–469. doi:10.1016/j.cmet.2013.08.002
41. Liu GY, Sabatini DM. mTOR at the nexus of nutrition, growth, ageing and disease. Nat Rev Mol Cell Biol. 2020;21(4):183–203. doi:10.1038/s41580-019-0199-y
42. Porstmann T, Santos CR, Griffiths B, et al. SREBP activity is regulated by mTORC1 and contributes to Akt-dependent cell growth. Cell Metab. 2008;8(3):224–236. doi:10.1016/j.cmet.2008.07.007
43. Kim J, Guan K-L. mTOR as a central hub of nutrient signalling and cell growth. Nat Cell Biol. 2019;21(1):63–71. doi:10.1038/s41556-018-0205-1
44. Szwed A, Kim E, Jacinto E. Regulation and metabolic functions of mTORC1 and mTORC2. Physiol Rev. 2021;101(3):1371–1426. doi:10.1152/physrev.00026.2020
45. Tarantino G, Capone D. Inhibition of the mTOR pathway: a possible protective role in coronary artery disease. Ann Med. 2013;45(4):348–356. doi:10.3109/07853890.2013.770333
46. Wang Y, Yu K, Zhao C, et al. Follistatin attenuates myocardial fibrosis in diabetic cardiomyopathy via the TGF-beta-Smad3 pathway. Front Pharmacol. 2021;12:683335. doi:10.3389/fphar.2021.683335
47. Li H, Zhang C, Liu J, et al. Intraperitoneal administration of follistatin promotes adipocyte browning in high-fat diet-induced obese mice. PLoS One. 2019;14(7):e0220310. doi:10.1371/journal.pone.0220310
48. Tao R, Wang C, Stohr O, et al. Inactivating hepatic follistatin alleviates hyperglycemia. Nat Med. 2018;24(7):1058–1069. doi:10.1038/s41591-018-0048-0
49. Wu C, Borne Y, Gao R, et al. Elevated circulating follistatin associates with an increased risk of type 2 diabetes. Nat Commun. 2021;12(1):6486. doi:10.1038/s41467-021-26536-w
 © 2022 The Author(s). This work is published and licensed by Dove Medical Press Limited. The full terms of this license are available at https://www.dovepress.com/terms.php and incorporate the Creative Commons Attribution - Non Commercial (unported, v3.0) License.
By accessing the work you hereby accept the Terms. Non-commercial uses of the work are permitted without any further permission from Dove Medical Press Limited, provided the work is properly attributed. For permission for commercial use of this work, please see paragraphs 4.2 and 5 of our Terms.
© 2022 The Author(s). This work is published and licensed by Dove Medical Press Limited. The full terms of this license are available at https://www.dovepress.com/terms.php and incorporate the Creative Commons Attribution - Non Commercial (unported, v3.0) License.
By accessing the work you hereby accept the Terms. Non-commercial uses of the work are permitted without any further permission from Dove Medical Press Limited, provided the work is properly attributed. For permission for commercial use of this work, please see paragraphs 4.2 and 5 of our Terms.