")
Back to Journals » International Journal of Nanomedicine » Volume 10 » Issue 1
Fluorescent magnetic iron oxide nanoparticles for cardiac precursor cell selection from stromal vascular fraction and optimization for magnetic resonance imaging
Authors Verma VK, Kamaraju SR, Kancherla R, Kona LK, Beevi SS, Debnath T, Usha SP, Vadapalli R, Arbab AS, Chelluri LK
Received 6 October 2014
Accepted for publication 13 November 2014
Published 20 January 2015 Volume 2015:10(1) Pages 711—726
DOI https://doi.org/10.2147/IJN.S75445
Checked for plagiarism Yes
Review by Single anonymous peer review
Peer reviewer comments 3
Editor who approved publication: Dr Thomas Webster
Vinod Kumar Verma,1 Suguna Ratnakar Kamaraju,1 Ravindranath Kancherla,1 Lakshmi K Kona,1 Syed Sultan Beevi,1 Tanya Debnath,1 Shalini P Usha,1 Rammohan Vadapalli,2 Ali Syed Arbab,3 Lakshmi Kiran Chelluri1
1Department of Transplant Biology, Immunology and Stem Cell Laboratory, Global Hospitals, 2Department of Imageology, Vijaya Radiology Centre, Hyderabad, India; 3Department of Biochemistry and Molecular Biology, Georgia Regents University, Augusta, GA, USA
Abstract: Fluorescent magnetic iron oxide nanoparticles have been used to label cells for imaging as well as for therapeutic purposes. The purpose of this study was to modify the approach to develop a nanoprobe for cell selection and imaging with a direct therapeutic translational focus. The approach involves physical coincubation and adsorption of superparamagnetic iron oxide nanoparticle-polyethylene glycol (SPION-PEG) complexes with a monoclonal antibody (mAb) or a set of antibodies. Flow cytometry, confocal laser scanning microscopy, transmission electron microscopy, iron staining, and magnetic resonance imaging were used to assess cell viability, function, and labeling efficiency. This process has been validated by selecting adipose tissue-derived cardiac progenitor cells from the stromal vascular fraction using signal regulatory protein alpha (SIRPA)/kinase domain receptor (KDR) mAbs. These markers were chosen because of their sustained expression during cardiomyocyte differentiation. Sorting of cells positive for SIRPA and KDR allowed the enrichment of cardiac progenitors with 90% troponin-I positivity in differentiation cultures. SPION labeled cardiac progenitor cells (1×10⁵ cells) was mixed with gel and used for 3T magnetic resonance imaging at a concentration, as low as 12.5 µg of iron. The toxicity assays, at cellular and molecular levels, did not show any detrimental effects of SPION. Our study has the potential to achieve moderate to high specific cell selection for the dual purpose of imaging and therapy.
Keywords: noninvasive molecular imaging, PEGylated nanoprobe, cardiomyocyte, cytotoxicity, apoptosis
Introduction
Superparamagnetic iron oxide nanoparticles (SPIONs) exhibit several nanomedicine applications ranging from diagnosis and therapy to targeted drug delivery.1 In recent times, there is an increased interest of utilizing SPIONs in cell biology and cell-based therapies.2 These novel applications have exploited SPIONs in biodistribution studies by way of magnetic resonance imaging (MRI), to understand the cell migration, homing, and function. SPIONs can be either fabricated or commercially procured.3 Either way, the SPION surface has to be modified with suitable biopolymer for safe and effective application for the intended purpose.4
Cardiac progenitor cell enrichment strategies often have not been fruitful due to nonavailability of well-characterized antibodies for a cardiac-specific phenotype. Furthermore, circumventing the major cell manipulation in cell cultures and improving the enrichment with biocompatible engineered SPION tagging in a single step has the potential for application in cell therapy. Hence, the primary strategic approach is to evaluate the migration, homing, and function of stem cells, which will eventually assist in maximizing the effectiveness of these novel therapies.1 MRI has gained significant prominence owing to its higher spatial resolution in determining the fate of transplanted stem cells and the availability of clearly defined anatomical and pathological information about the surrounding tissue.5 Consequently, the dual ability of SPIONs, that they can be internalized into cells and receptive to the external magnetic field, has made them useful tools for theranostic purposes.6 SPION tagging is a natural choice, as they can easily leave the systemic circulation via the endogenous iron degradation pathway. However, it is even more important to make a suitable and biocompatible surface coating that not only protects the phenotype of the cell but also allows nanoparticle internalization for prolonged period of imaging.7 Despite the fact that few reports are available, it is imperative to evaluate the various facets of SPION, such as concentration levels for safe and effective use for cellular function, and viability, and SPION-tagged cell concentration for high-quality MRI.8
In this study, a SPION-based cardiac precursor nanoprobe is developed and functionalized with two well-defined monoclonal antibodies (mAbs), signal regulatory protein alpha (SIRPA)/kinase domain receptor (KDR) along with CD105 (mesenchymal stem cell marker), which are unique for cardiac progenitor cells. SIRPA is a cardiac precursor receptor restricted to the human heart that gets activated along with its CD47 ligand during the differentiation process. It is reported to demonstrate a critical role in functional and physiological development in cardiomyocyte lineage.9 Various biopolymers, such as polyethylene glycol (PEG) 300, dextran, and poly-L-lysine (PLL), have been tested for their suitability and compatibility as a SPION surface coating with the aim of increasing biocompatibility. The utility of this nanoprobe has been evaluated in sorting and selecting the labeled stem cells from abdominal and epicardial adipose tissue using magnetic activated cell sorter (MACS). In addition to its iron-labeling efficiency, the safety of SPIONs has been evaluated by several cytotoxicity assays that detect a variety of apoptotic or necrotic events within the labeled cells; such assays include JC-1 staining, annexin V-FITC (fluorescein isothiocyanate), reactive oxygen species (ROS), terminal deoxynucleotidyltransferase-mediated UTP end labeling (TUNEL), and comet assays including karyotyping. Further, the MRI potential of SPIONs has been tested using the phantom cell gel experiment to ascertain the imaging capability of the probe. Hence, integration of unique methods of cell selection and imaging for a targeted therapy in cardiovascular diseases is an attempt to utilize emerging technology platforms in translational medicine.
Materials and methods
Cell culture medium Dulbecco’s Minimum Essential Medium (DMEM)/F12 and serum were obtained from Gibco, USA. Antibiotics (penicillin, streptomycin, gentamycin, and amphotericin), other materials (Giemsa, paraformaldehyde, 3,4,5-dimethylthiazol-2-yl)-2-5-diphenyltetrazolium bromide (MTT), FITC, gelatin, 5-azacytidine, basic fibroblastic growth factor (bFGF), collagenase, and biopolymers such as dextran, PEG with a molecular weight of 300 (catalog #202371), PLL, protamine sulfate, heparin sulfate, hyaluronic acid, and SPIONs (catalog #725331) were obtained from Sigma. To evaluate apoptosis, we used JC-1, annexin V-FITC, carboxy,-2′,7′-dichlorofluorescein diacetate (H2DCFDA), TUNEL, and COMET assay kits purchased from Affymetrix Ebiosciences. mAbs against CD105, CD90, CD105, CD73, CD45, CD34, and human leukocyte antigen-DR were obtained from BD Biosciences, India. Antibodies against actin, desmin, and troponin-I were purchased from Epitomics, Burlingame, CA, USA, and antibodies against SIRPA and KDR were purchased from R&D systems, Minneapolis, MN, USA. Inflammatory cytokines such as interferon gamma (IFN-γ) and tumor necrosis factor alpha (TNF-α) were purchased from Epitomics. Prussian blue solution (potassium ferrocyanide and HCl) was obtained from Merck, India. The MACS column was purchased from Milteyni Biotec, Germany and chamber slides from Nunc, USA. Other materials such as glutaraldehyde, osmium tetra oxide, Araldite6005 resin or Spurr resin, uranyl acetate, and Reynolds lead citrate used in transmission electron microscopy (TEM) imaging were procured from RUSKA Lab, ANGRU, Hyderabad, India.
In vitro standardization of cardiac precursor nanoprobe
The source of primary tissue for a better yield of cardiomyocytes was evaluated using bone marrow, epicardial fat tissue, and adipose after due clearances from Global Hospitals, Institutional Ethics Committee (IEC), including prior written informed consent and in confirmation with the Helsinki declaration (GMERF/BS/SAC/IEC/IC_SCR 2014/04). It was observed that human adipose-derived stem cells (hADSCs) exhibited 40% differentiation potential using 5-Azacytidine10 even without enrichment through MACS.10 Surface characterization was performed for the expression of markers specific for cardiomyocyte such as actin, desmin, and troponin-I by flow cytometry and immunocytochemistry11 (Supplementary materials, S1). The experiments were repeated three times for reproducibility.
The average size distribution of well characterized commercial SPIONs (Magnetite Fe3O4) used in the construction of nanoprobe was 4–6 nm under TEM analysis (Sigma, catalog #725331). Nano aggregates visualized under confocal laser scanning microscope (CLSM) approximately ranged between 150 and 170 nm. The physicochemical attributes includes, concentration of 5 mg/mL in H2O, density of 1.0 gm/mL at 25°C and with magnetization property of >25 emu/gat 4500Oe. Negatively charged SPIONs were coated with positively charged PEG (Sigma, catalog #202371; molecular weight 300) by electrostatic interaction. PEG was chosen after preliminary evaluation of various approaches including cytotoxicity of each biopolymer under study (Figure S1). The SPION/PEG complex was made by incubating the components together at different ratios (1:2–1:10) at room temperature for 1 hour in a RotoSpin to determine the optimal concentration and ratio. Subsequently viability of hADSCs labeled with different ratios of SPION/PEG complex was assessed by MTT12 (Figure S2).
The optimized (superparamagnetic iron oxide nanoparticle-polyethylene glycol; SPION-PEG) micelle binds covalently to variable portions of SIRPA/CD105 and KDR/CD105 mAb receptors at a concentration of 5 μg by direct adsorption. This reaction is performed at 4°C for 2 hours to make the GloTrack cardiac precursor nanoprobe, which is a ready-to-use probe (Figure S3). Characterization of unmodified SPION, SPION-PEG complex and SPION-PEG-mAb was done using TEM and CLSM according to the published protocol.6 This engineered nanoprobe was further incubated at 37°C for 2 hours with cells from stromal vascular fraction (SVF) using MACS column to obtain enriched fraction of cardiac precursors. Enriched cells and cells present in the flow-through were analyzed by flow cytometry to determine the percentage of positive mAb tagged cells in the positively selected fraction.
Determination of the SPION labeling efficiency
hADSCs (2×10³ cells) from SVF were grown on cover slips for 18 hours in a humidified atmosphere and incubated with the SPION-PEG-mAb complex for 24 hours. Cells were stained with Prussian blue solution for 30 minutes at room temperature after fixing with 3.7% Paraformaldehyde. Iron particles appeared as blue spots within the cells when viewed under a microscope (Supplementary materials, S5). The cells were maintained in culture for as many as 10 days and viability/presence of nanoprobe within the cells was evaluated on day 2, 6, and 10. Intracellular iron content of labeled cells was also measured according to the well-established protocol of Janic et al13 (Supplementary materials, S6).
Enriched labeled cells were induced using differentiation medium which consisted of low DMEM (L-DMEM), supplemented with fetal bovine serum (FBS) (2.0%), bFGF (10 ng/mL), and 5-azacytidine (3.0 μM), for 48 hours. Subsequently, the differentiation medium was removed, and the cells were maintained in L-DMEM for 21 days with replenishment of medium on every third day, to obtain cardiomyocyte-like cells. The differentiated cells were then evaluated for the presence of cardiac markers, such as troponin I, desmin, actin, SIRPA, and KDR by flow cytometry and CLSM using appropriate antibodies and checked the reproducibility for three times (Supplementary materials, S7).
Evaluation of the nanoprobe cytotoxicity
Apoptotic assays were performed to evaluate the toxicity of nanoprobe tagged cells using flow cytometry and/or fluorescent microscopy. Phosphatidylserine levels were assessed by staining with annexin-V-FITC, mitochondrial membrane potential by JC-1, and relative ROS production by H2DCFDA, DNA breakage by TUNEL and COMET assays. In addition, the levels of inflammatory cytokines, such as IFN-γ and TNF-α, were assessed by enzyme-linked immunosorbent assay (ELISA) to evaluate the inflammatory responses. Karyotyping was also performed to check for chromosomal abnormalities and mutational events on at least three samples (Supplementary materials, S8).
Optimization of the nanoprobe and cell concentration for MRI
MRI was performed on a 3T clinical MRI scanner (Philips) to measure the T2 relaxivities of hADSCs labeled with nanoprobe. The experiment was designed with two approaches to evaluate the optimum cell: SPION ratio for obtaining contrast-enhanced MRI. One was with a fixed SPION concentration (50 μg/well)/variable cell numbers (0.0625–1.0×10⁶ cells) and another with a fixed cell number (1×10⁵ cells)/variable SPION concentration (3.175–50 μg/well). Cells were labeled as described above, mixed into 4% gelatin, and cast into chamber slides with a depth of 1 cm to simulate tissue thickness. SPIONs, unlabeled cells, and gelatin alone served as the MRI controls. The chamber slides were then mounted over a phantom slide, and MRI scanning was performed using head coil. The parameters for coronal T2-weighted TSE imaging were as follows: TR, 6,250 ms; TE, 150 ms; field of view, 190×230 mm3; slice thickness, 2 mm; acquisition time, 5 minutes; echo train length, 16; and voxel size, 0.6×0.8×2 mm3. T2 functional maps were created using FuncTool/T2 analysis software. The mean signal intensity of cell phantoms was determined over 20 slices, and the signal-to-noise ratios were calculated and normalized to that of unlabeled controls.
Statistical analysis
The student’s t-test was carried out for test of significance between controls, labeled and unlabeled cells in the cytotoxic assays. The result was considered significant at P<0.05.
Results
In vitro approaches in developing a cardiac precursor nanoprobe
hADSCs represented an ideal source for the cardiomyocyte differentiation and for the easy availability. PEG 300 was chosen over other biopolymers for the surface modification of SPIONs (Figure S3). Negatively charged SPIONs were coated with PEG at a ratio of 1:8 through electrostatic interaction and the micelle thus formed demonstrated no toxic effects on labeled hADSCs. The mAb was allowed to covalently bind to SPION-PEG micelle by direct adsorption at 4°C temperature to preserve the activity of the antibody. Nanoprobe was constructed using mAbs such as SIRPA and KDR which is represented schematically in Figure 1A. The characteristics of uncoated SPIONs aggregate (167 nm), PEG coated SPIONs (250 nm) and SPION-PEG-mAb (300 nm) was determined using TEM imaging. This observation was confirmed by CLSM which shows that SPION are coated by FITC-tagged PEG (green panel) and phycoerythrin tagged mAb (red panel) (Figure 1B).
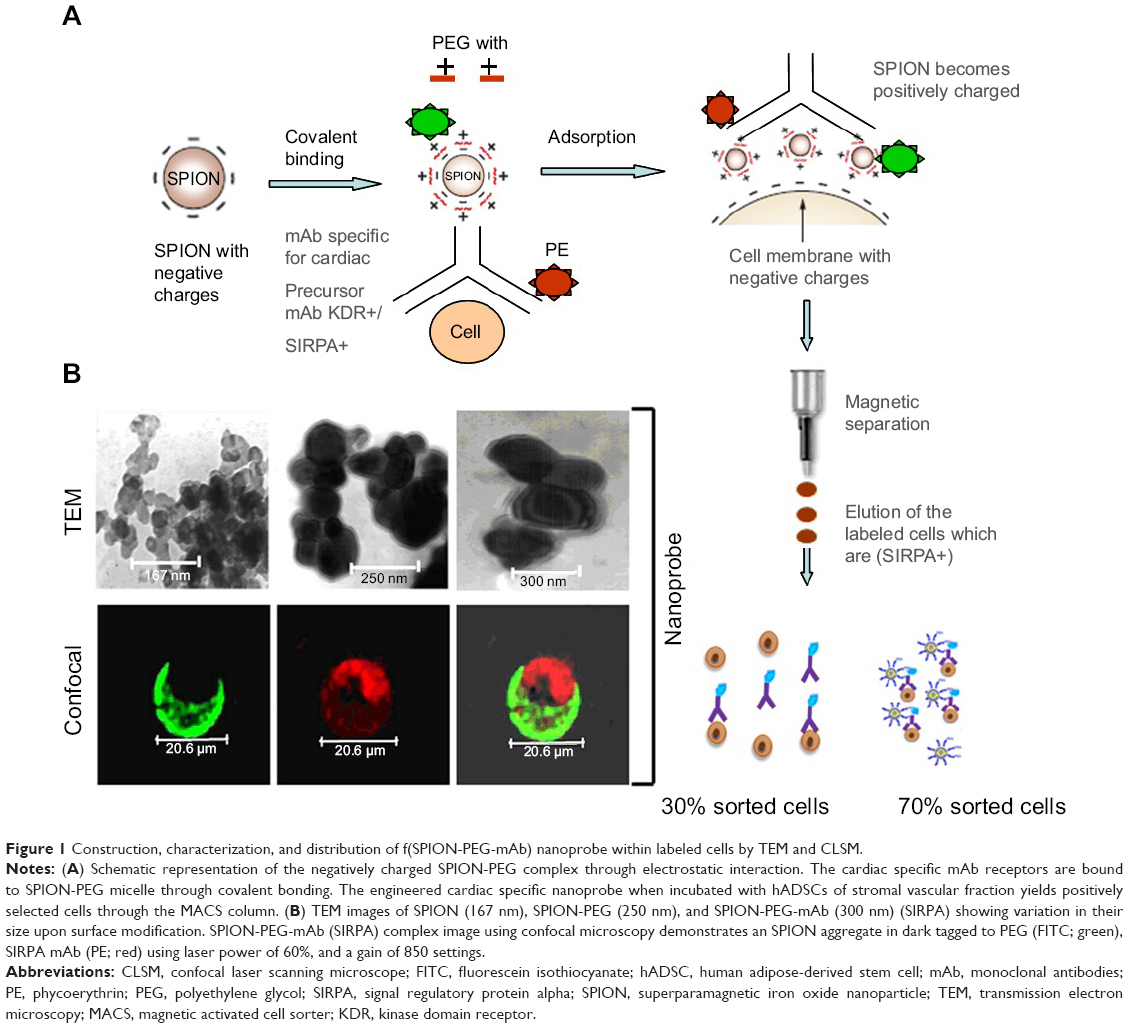 | Figure 1 Construction, characterization, and distribution of f(SPION-PEG-mAb) nanoprobe within labeled cells by TEM and CLSM. |
The primary tissue selection was done based on the cell yield and tagging efficiency. Adipose derived stem cells were found to exhibit greater potential for cardiac progenitor cells and nanoprobe labeling efficiency (data not shown) as compared to the epicardial tissue. Hence, SVF-derived hADSCs was chosen over other tissue source for nanoprobe validation. SVF isolated from abdominal adipose tissue (1×10⁶ cells/g of tissue) was incubated with GloTrack containing SPION/PEG/mAb (at a concentration of 100 μg/800 μg/5 μg) and sorted using MACS. The yield of positively selected cells was found to be 3×10⁵ cells of 1×10⁶ SVF cells. Flow cytometric analysis of the sorted cell fractions and flow-through revealed the presence of SIRPA/KDR positive cells in the sorted cell fractions (70%–80%) and negligible numbers of positive cells (>1%) in the MACS flow-through. Cell viability at every stage of sorting and analysis was found to be more than 90% as evaluated by trypan blue dye exclusion (Figure 2A). Further, the selected cell fraction demonstrated that a minimum of 12.5 μg of SPION was adequate enough to obtain a hypointense signal on MR imaging. This concentration was optimized for a cell concentration of 1×10⁵, which was noncytotoxic as compared to the use of 50–100 μg (Figure 2B).
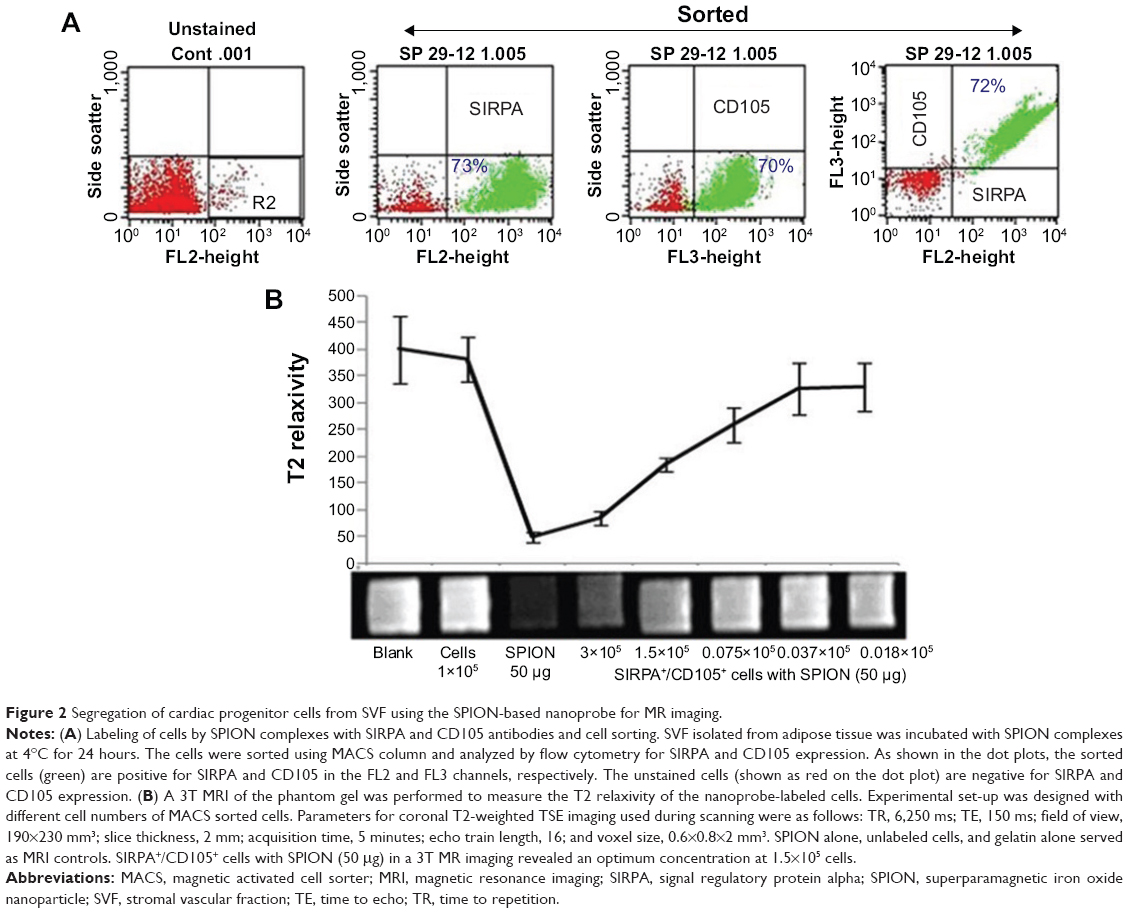 | Figure 2 Segregation of cardiac progenitor cells from SVF using the SPION-based nanoprobe for MR imaging. |
Determination of the apoptotic/necrotic effects of the nanoprobe labeled cells
Flow cytometric analysis of annexin-V-FITC assay demonstrated that neither the unlabeled nor the labeled cells displayed phosphatidylserine translocation to the outer side of the cytoplasmic membrane. In contrast, cells treated with 20 μm H2O2 demonstrated a significant shift towards the right in the FL1 channel (Figure 3A). Moreover, TUNEL and COMET assays showed that there was neither significant DNA strand break nor oxidative DNA damage due to the internalization of nanoprobe in unlabeled and labeled cells, unlike the H2O2-treated cells (Figure 3C and D). The H2DCFDA assay, which determines the presence of oxidative stress due to raised ROS levels within cells, showed a shift towards the right in the FL1 channel and green fluorescence in labeled, unlabeled, and H2O2-treated cells as measured by flow cytometry and fluorescent microscopy, respectively. It was observed that a stronger green fluorescence and a more significant right shift were evident only in the H2O2-treated cells, suggesting the absence of any adverse apoptotic events in the labeled cells (Figure 3B). We have further analyzed the effect of the SPION complex on genomic instability: karyogram of SPION complex-labeled cells showed normal female karyotype 46 XX (Figure 3E). Cytotoxicity of the SPION complex was also confirmed by MTT assay (Figure 3F), caspase-3 activity (Figure 3G) and production of inflammatory cytokines, such as IFN-γ and TNF-α, respectively. (Figure 3H and I) Taken together, the results of these assays indicate that SPIONs do not have a significant impact on the structural or functional organization of the labeled cells.
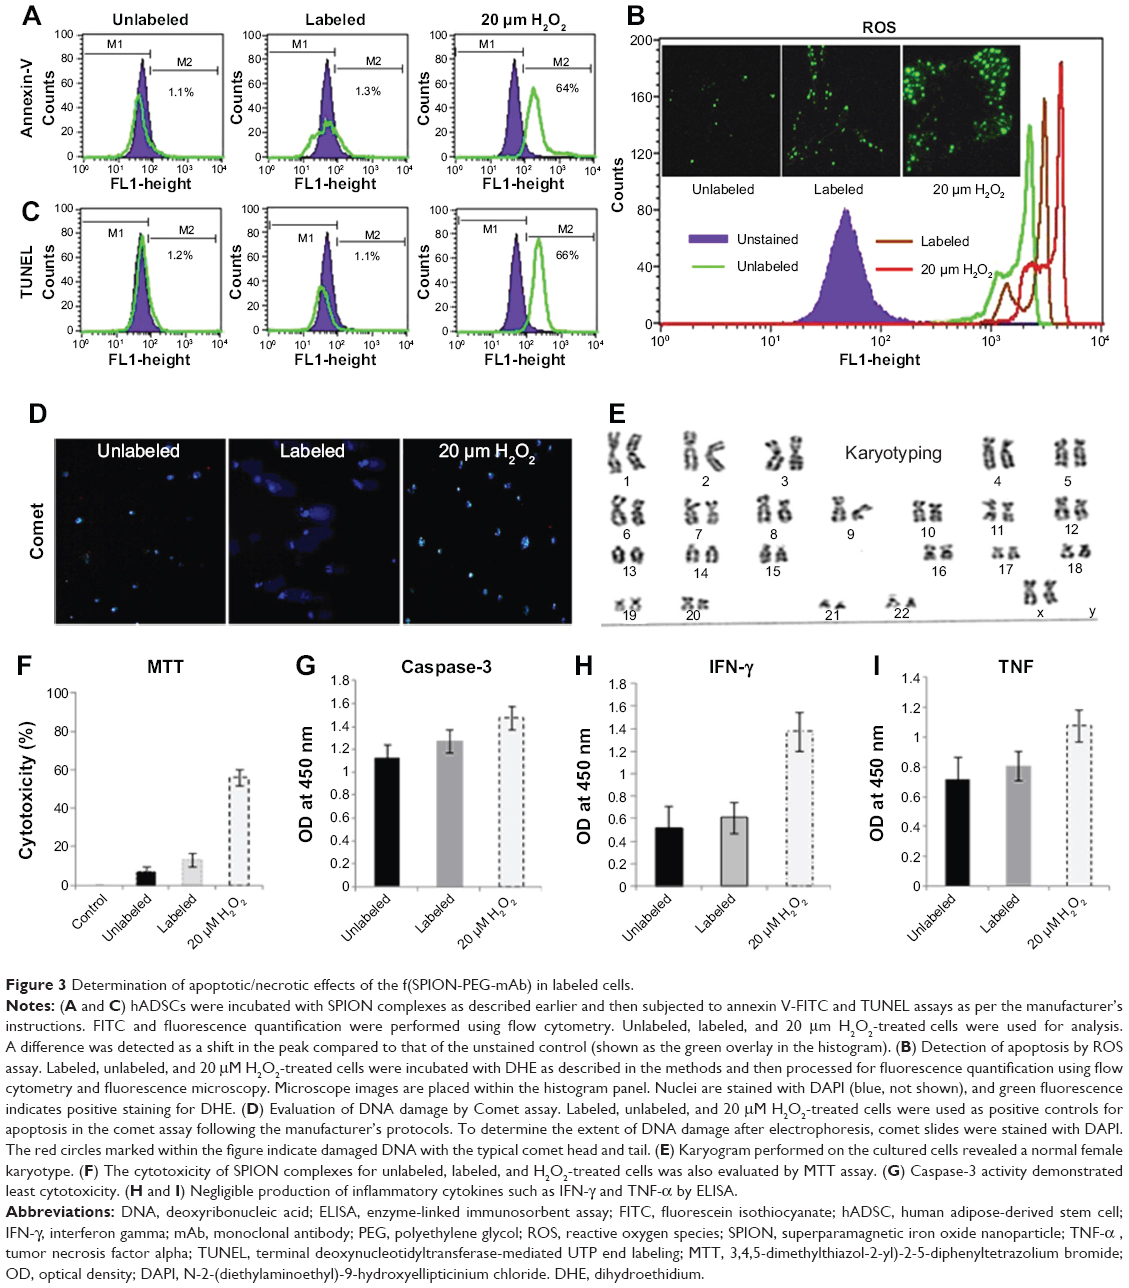 | Figure 3 Determination of apoptotic/necrotic effects of the f(SPION-PEG-mAb) in labeled cells. |
Labeling efficiency of the nanoprobe
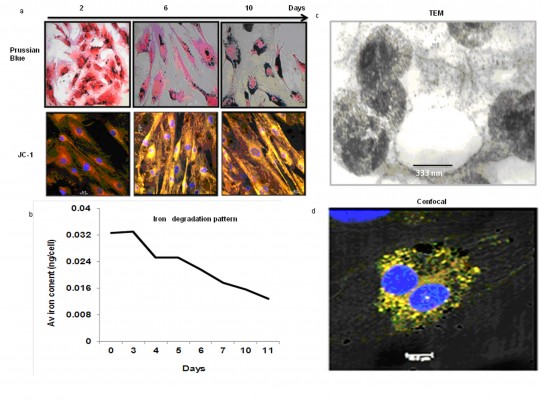
Labeled cells were maintained in culture for approximately 10 days, analyzed for viability and presence of SPIONs on day 2, 6, and 10. The majority of the cells remained viable even on the tenth day of culturing shown by the Prussian blue and JC-1 staining (Figure 4A). However, the SPIONs lost their granular nature and formed aggregates as time progressed. Iron level gradually decreased from 0.25 ng/cell on first day to 0.12 ng/cell on the fourth day, when intracellular iron content was measured in the long term of SPION-labeled cells. It further decreased as the days progressed (Figure 4B). However, a residual amount of iron persisted in the cells even on day 12.
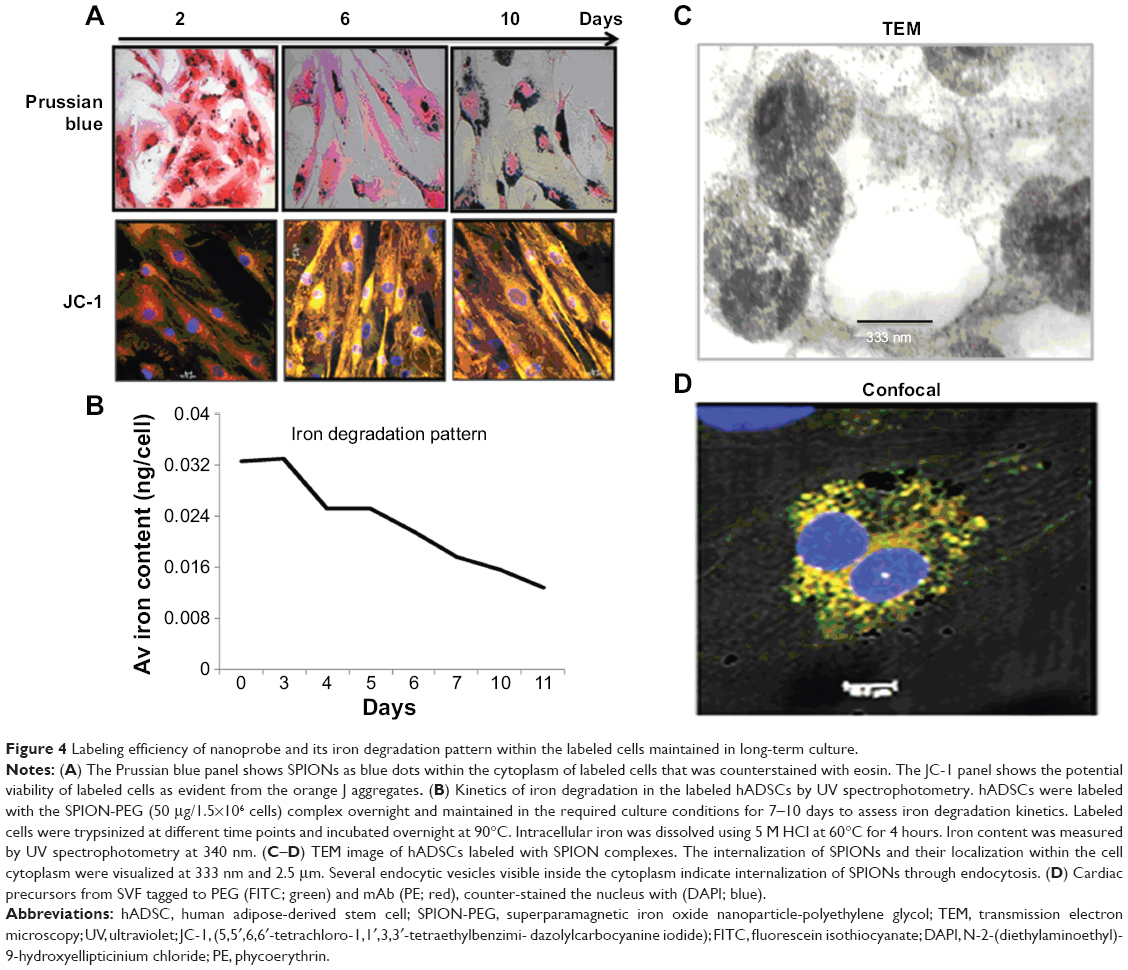 | Figure 4 Labeling efficiency of nanoprobe and its iron degradation pattern within the labeled cells maintained in long-term culture. |
The SPION complexes were found to be internalized into the cells and revealed a granular structure when visualized by TEM. Importantly, they were located only within the cytoplasm, and not in the nucleus or other organelles. Subsequently, we observed several endocytic vesicles in the cytoplasm that are indicative of SPION internalization via endocytosis by TEM imaging (Figure 4C). The CLSM-merged image of a SPION-tagged, cardiomyocyte-like cell counterstained by DAPI (N-2-(diethylaminoethyl)-9-hydroxyellipticinium chloride) revealed PEG (FITC) and mAb (phycoerythrin) internalized in the cytoplasm. The colocalization ratio was found to be around 90% by CLSM between PEG and mAb, thereby confirming the intact nature of the nanoprobe (Figure 4D).
Differentiation of labeled cells into cardiomyocyte lineage
Nanoprobe-sorted cells were treated with 5-azacytidine to induce a single-step directed differentiation into cardiomyocytes. We observed a significant change in the morphology of labeled cells 7 days post-induction with 5-azacytidine and the emergence of myogenic-like cells. Cardiomyogenic specific morphology was more prominent after approximately 21 days post-induction. The resultant cardiomyocyte-like cells were characterized using cardiac cell-specific surface markers (CD105, SIRPA, and KDR) by flow cytometry (Figure 5A). SIRPA, KDR, actin, desmin, and troponin I were evaluated by CLSM for the differentiation potential of labeled cells. Approximately 90% of the induced hADSCs were positive for SIRPA, actin, desmin, and troponin I, as shown in Figure 5B. The differentiation capability of nanoprobe labeled hADSCs into adipocytes and osteocytes were also determined under cell-specific conditions. The Oil O red staining of fat droplets in adipocytes, and silver nitrate staining for the calcium deposition in osteocytes confirmed the differentiation potential of nanoprobe labeled cells. (Figure S4).
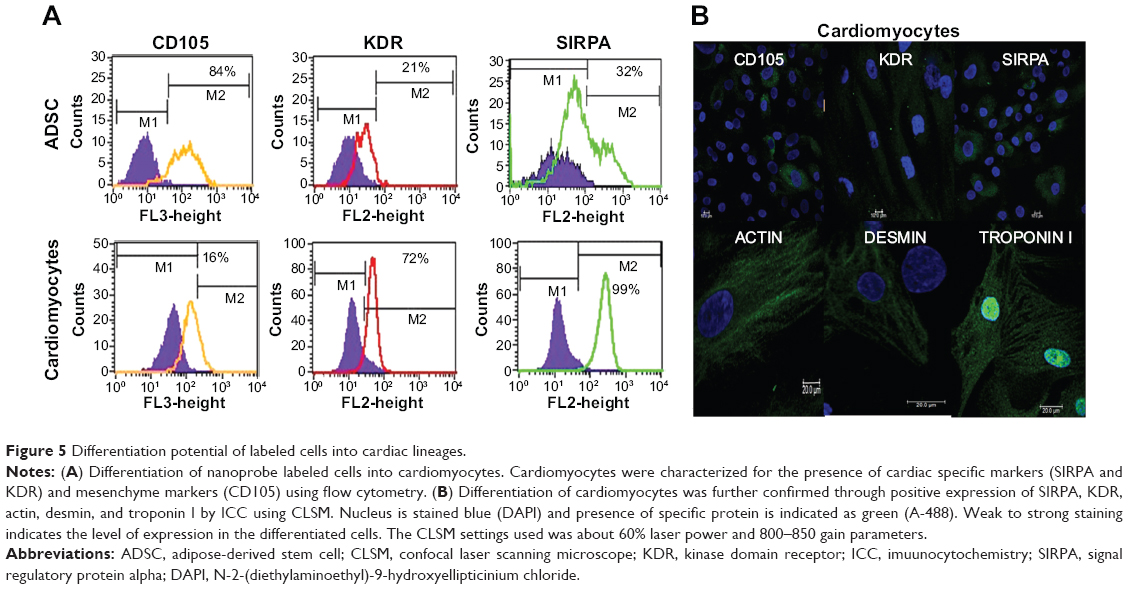 | Figure 5 Differentiation potential of labeled cells into cardiac lineages. |
Optimization of the nanoprobe and cell concentration for MRI
The MR images from in vitro gelatin phantoms of labeled and unlabeled ADSCs with varying SPION concentration/cell numbers, and their average T2 relaxivity values, are shown in Figure 6. SPION labeling resulted in significantly reduced T2 relaxivity as compared to unlabeled cells and to phantom samples containing only gelatin. With increasing concentrations of SPION complex, the signal intensity decreased and formed sharp relaxivity curves; 6.25 μg of SPIONs labeling 1×10⁵ cells produced stronger signal intensity compared to unlabeled cells, suggesting that minimal concentration of SPION would be sufficient to detect an appreciable hypointense signal on MRI. However, varying cell numbers with a constant SPION concentration did not produce any significant difference in the signal intensity. MR image of nanoprobe sorted cells showed similar results as above, suggesting that amount of nanoprobe present in the sorted cells; ie, 1.5–3×10⁵ would be sufficient for cell tracking using MRI (Figure 2).
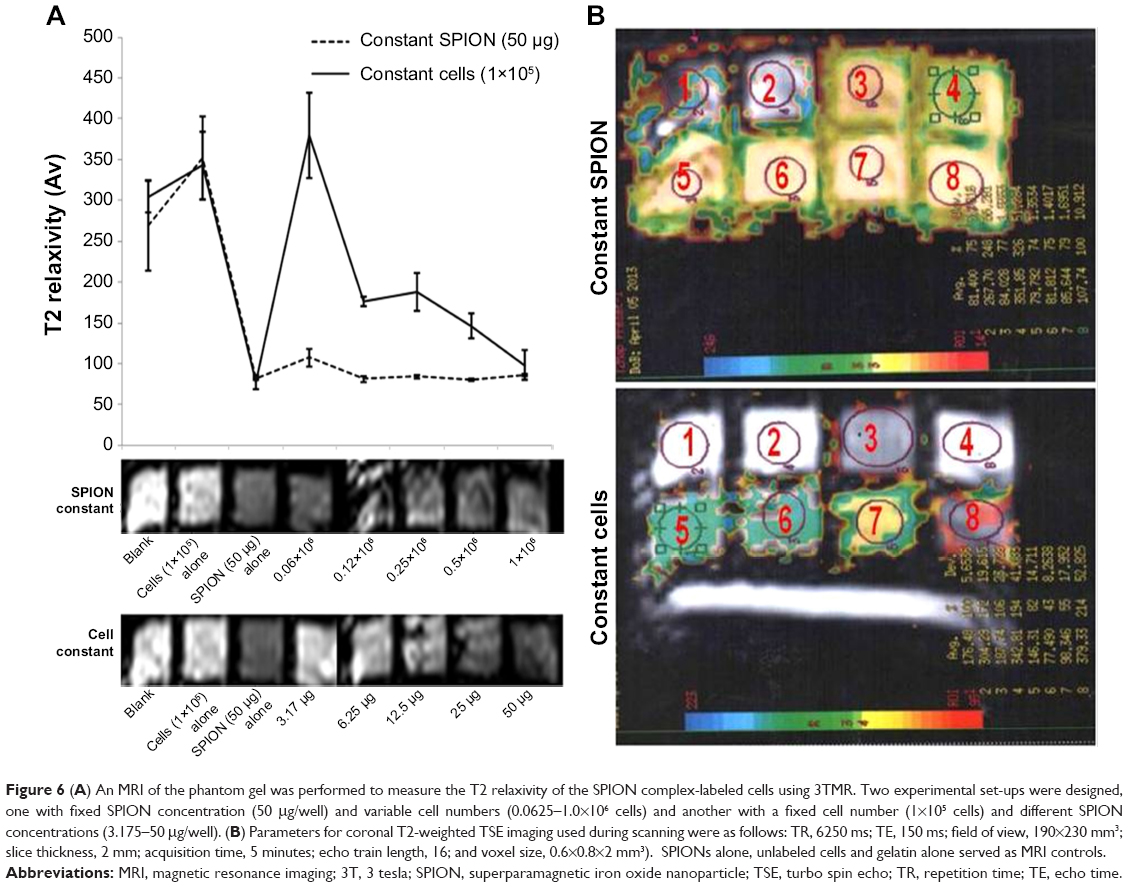 | Figure 6 (A) An MRI of the phantom gel was performed to measure the T2 relaxivity of the SPION complex-labeled cells using 3TMR. Two experimental set-ups were designed, one with fixed SPION concentration (50 μg/well) and variable cell numbers (0.0625–1.0×10⁶ cells) and another with a fixed cell number (1×10⁵ cells) and different SPION concentrations (3.175–50 μg/well). (B) Parameters for coronal T2-weighted TSE imaging used during scanning were as follows: TR, 6250 ms; TE, 150 ms; field of view, 190×230 mm3; slice thickness, 2 mm; acquisition time, 5 minutes; echo train length, 16; and voxel size, 0.6×0.8×2 mm3). SPIONs alone, unlabeled cells and gelatin alone served as MRI controls. |
Discussion
Multifunctional nanoparticles that deliver therapy and molecular imaging in tandem are gaining momentum in translational research.13 We have effectively assembled different elements (PEG and mAb) into a magnetic nanoparticle (SPION) without altering their inherent properties and engineered a SPION-based nanoprobe through an electrostatic interaction. This nanoprobe is capable of selectively separating progenitor cells from a heterogeneous population of cells and subsequently enables the cells to be tracked through noninvasive molecular imaging.
Various polymers have been evaluated for the SPION surface coating to make it more biocompatible. The core of SPION was iron oxide, with the outermost layer being comprised of PEG with molecular weight 300. PEG proved to be most effective and less toxic forming a micelle-like structure on the surface of SPION.14 Further, it is approved by the US Food and Drug Administration (FDA) for internal use in humans. PEG assembly surrounding the SPION increased its size as determined by two most reliable methods of CLSM and TEM, indicating the successful coating on the SPION. CLSM data clearly demonstrates the efficient tagging of PEG and mAb represented by two different fluorochromes, although there are other available methods such as atomic force microscopy and measuring the zeta potential. SPION with iron oxide as the core has been tolerated well in humans for MRI diagnostics.15–17 However, it is necessary to establish its safe use in human study with good cell viability. This was achieved with the SPION-PEG complex, similar to that of unlabeled cells, confirming its nontoxic nature. Consistent with our findings, Chang et al18 reported that cytotoxic effects of silica nanoparticles can be significantly reduced by surface modification of silica shells with chitosan or PEG.
The labeling efficiency of SPIONs was found to be remarkably high even at their lowest concentration. These were found to be localized within the cells as evident by blue dots upon Prussian blue staining. Intracellular localization of SPIONs is considered to be an important event that determines their toxicity towards cells.19 Bae et al have suggested that SPION aggregates within cells are a significant source of cytotoxicity under static magnetic field exposure.20 Improved labeling efficiency with subtle distribution of SPION complexes within cells as demonstrated in our study might be the result of PEG coating. Further, this nanoprobe provides the necessary magnetization for MR imaging with least SPION aggregates.
Iron overload due to the degradation of SPIONs has also been presumed to cause cytotoxicity. Several adverse effects such as membrane damage, generation of ROS, induction of apoptosis and DNA damage have been reported in SPION-labeled cells.21 We evaluated the rate of clearance of iron from labeled cells with concomitant assessment of their viability in long-term culture. Quantitative analysis of the iron content of the labeled cells, using a standard protocol by Janic et al13 showed a gradual and steady decrease in iron concentration over time, suggesting possible clearance of iron by endogenous pathways.
It has been reported that SPIONs can induce oxidative stress through impairment of mitochondrial transmembrane potential, generation of ROS, and induction of oxidative DNA damage, which subsequently leads to initiation of apoptotic or necrotic events within cells.21 The inflammatory cytokines such as TNF-α and IFN-γ were absent, which is characteristic of acute tissue injury caused by the nanoprobe. In this study, SPION labeling did not alter the structural or functional integrity of the labeled cells. Furthermore, the SPION labeling efficiency persisted even after the follow-up for 2 weeks, with slow iron degradation. Therefore, our findings confirm that SPION labeling does not cause any obvious adverse cytotoxic or genotoxic damage to labeled cells and, that SPIONs can be exploited as a core material for the development of nanoprobes for cell selection and imaging.
A tailor-made cardiac nanoprobe using SPION-PEG complex as the core structure has been used with SIRPA or KDR targeting antibodies to identify and select cardiac precursor cells from SVF of adipose tissue.9,22–24 These mAb bound to the surface of SPION-PEG complex are masked at their antigenic portion (Fc), thus leaving their variable heavy chain to bind to SIRPA or KDR membrane receptors on cardiac progenitor cells. They can also be extrapolated to other tissue sources for specific cell selection.
An important facet of SPION labeling of stem cells is its ability to track cells through noninvasive imaging techniques. MRI allows the imaging of morphologically intact and living magnetically labeled cells when used in appropriate concentrations. A SPION concentration as low as 12.5 μg/1.5×105 cells was detectable as a significant hypointense signal on MRI and differentiable T2 relaxivities with varied concentrations of SPIONs and cell numbers. The commercially available iron oxide solution (SPION) used in this study displayed higher T2 relaxivity than the FDA-approved MRI contrast agent, ferumoxide. SVF of abdominal adipose tissue under minimally manipulative manner and aseptic conditions has resulted in 70%–80% segregation efficiency of sorted cells coupled with positivity for SIRPA/KDR using engineered nanoprobe. Importantly, sorted cells with internalized SPIONs have a strong T2 relaxivity signal during MRI. Therefore, the sorted cardiac progenitor cells have the potential to be utilized directly for therapeutic purposes and for further improvement of cell tracking by MRI.
Conclusion
Conservation of the cell surface phenotype and differentiation potential of magnetically labeled cells is essential because it plays a crucial role in the development of SPION-based nanoprobes for theranostic purposes. This is the first study to demonstrate the cardiomyogenic potential of SPION-labeled cells. Besides, labeled cells displayed adipogenic and osteogenic differentiation potential, which was in agreement with those of Yi et al.25 Furthermore, the labeled cells displayed a normal cell surface phenotype, typical of mesenchymal stem cells, confirming that SPION labeling did not produce any detrimental effects on the presentation of cell surface markers. Animal studies would help enhance our understanding of the in vivo toxicity of the developed nanoprobe and is the chief limitation of this manuscript. In conclusion, the encouraging results of the study warrant an in-vivo toxicity evaluation for translational studies in the future.
Acknowledgments
We thank Dr M Lakshman for TEM imaging and analysis of SPION complexes, Dr Mahendra Parage and Mr Ramachandran for histopathological studies, and the Institute of Genetics for karyotyping analysis. Funding provided by Department of Biotechnology and BIRAC, Ministry of Science and Technology, Government of India [BT/BIPP0296/07/10].
Disclosure
The authors report no conflicts of interest in this work.
References
Arbab AS, Janic B, Haller J, Pawelczyk E, Liu W, Frank JA. In Vivo Cellular Imaging for Translational Medical Research. Curr Med Imaging Rev. 2009;5(1):19–38. | ||
Callera F, de Melo CM. Magnetic resonance tracking of magnetically labeled autologous bone marrow CD34+ cells transplanted into the spinal cord via lumbar puncture technique in patients with chronic spinal cord injury: CD34+ cells migration into the injured site. Stem Cells Dev. 2007;16(3):461–466. | ||
Villa C, Erratico S, Razini P, et al. Stem cell tracking by nanotechnologies. Int J Mol Sci. 2010;11(3):1070–1081. | ||
Wang YX, Hussain SM, Krestin GP. Superparamagnetic iron oxide contrast agents: physicochemical characteristics and applications in MR imaging. Eur Radiol. 2001;11(11):2319–2331. | ||
Bulte JW, Kraitchman DL. Iron oxide MR Contrast agents for molecular and cellular imaging. NMR Biomed. 2004;17(7):484–499. | ||
Kekarainen T, Mannelin S, Laine J, Jaatinen T. Optimization of immunomagnetic separation for cord blood-derived hematopoietic stem cells. BMC Cell Biol. 2006;7:30. | ||
Xie J, Jon S. Magnetic nanoparticle-based theranostics. Theranostics. 2012;2:122–124. | ||
Wilhelm C, Billotey C, Roger J, Pons JN, Bacri JC, Gazeau F. Intracellular uptake of anionic superparamagnetic nanoparticles as a function of their surface coating. Biomaterials. 2003;24(6):1001–1011. | ||
Dubois NC, Craft AM, Sharma P, et al. SIRPA is a specific cell-surface marker for isolating cardiomyocytes derived from human pluripotent stem cells. Nat Biotechnol. 2011;29(11):1011–1018. | ||
Cowan CM, Shi YY, Aalami OO, et al. Adipose-derived adult stromal cells heal critical-size mouse calvarial defects. Nat Biotechnol. 2004;22(5):560–567. | ||
Chelluri LK, Kancherla R, Turlapati N, et al. Improved differentiation protocol of rat bone marrow precursors to functional islet-like cells. Stem Cell Studies. 2011;1(1):e5. | ||
Mosmann T. Rapid colorimetric assay for cellular growth and survival: application to proliferation and cytotoxicity assays. J Immunol Methods. 1983;65(1–2):55–63. | ||
Janic B, Rad AM, Jordan EK, et al. Optimization and validation of FePro cell labeling method. PLoS One. 2009;4(6):e5873. | ||
Rumenapp C, Gleich B, Haase A. Magnetic nanoparticles in magnetic resonance imaging and diagnostics. Pharm Res. 2012;29(5):1165–1179. | ||
Folgiero V, Migliano E, Tedesco M, et al. Purification and characterization of adipose-derived stem cells from patients with lipoaspirate transplant. Cell Transplant. 2010;19(10):1225–1235. | ||
Häfeli UO, Riffle JS, Harris-Shekhawat L, et al. Cell uptake and in vitro toxicity of magnetic nanoparticles suitable for drug delivery. Mol Pharm. 2009;6(5):1417–1428. | ||
Liu DF, Wu W, Ling, JJ, Wen SW, Gu N, Zhang X. Effective PEGylation of iron oxide nanoparticles for high performance in vivo cancer imaging. Adv Func Mat. 2011;21(8):1498–1504. | ||
Chang, JS, Chang KL, Hwang DF, Kong ZL. In vitro cytotoxicity of silica nanoparticles at high concentrations strongly depends on the metabolic activity type of the cell line. Environ Sci Technol. 2007;41(6):2064–2068. | ||
Singh N, Jenkins GJ, Asadi R, Doak SH. Potential toxicity of superparamagnetic iron oxide nanoparticles (SPION). Nano Rev. 2010;1:5358. | ||
Bae JE, Huh MI, Ryu BK, et al. The effect of static magnetic fields on the aggregation and cytotoxicity of magnetic nanoparticles. Biomaterials. 2011;32(35):9401–9414. | ||
Mahmoudi M, Simchi A, Imani M, et al. A new approach for the in vitro identification of the cytotoxicity of superparamagnetic iron oxide nanoparticles. Colloids Surf B Biointerfaces. 2010;75(1):300–309. | ||
Song M, Moon WK, Kim Y, Lim D, Song IC, Yoon BW. Labeling efficacy of superparamagnetic iron oxide nanoparticles to human neural stem cells: comparison of ferumoxides, monocrystalline iron oxide, cross-linked iron oxide (CLIO)-NH2 and tat-CLIO. Korean J Radiol. 2007;8(5):365–371. | ||
Yang L, Soonpaa MH, Adler ED, et al. Human cardiovascular progenitor cells develop from a KDR+ embryonic-stem-cell-derived population. Nature. 2008;453(7194):524–528. | ||
Jung CW. Surface properties of superparamagnetic iron oxide MR contrast agents: ferumoxides, ferumoxtran, ferumoxsil. Magn Reson Imaging. 1995;13(5):675–691. | ||
Yi P, Chen G, Zhang H, et al. Magnetic resonance imaging of Fe3O4@SiO2-labeled human mesenchymal stem cells in mice at 11.7 T. Biomaterials. 2013;34(12):3010–3019. |
Supplementary materials
Methods
Selection of primary tissue source
Abdominal adipose tissue was collected during routine bariatric surgery on morbidly obese donors ranging in age from 18 to 62 years. Epicardial adipose tissue was collected during cardiac bypass surgery from the atrioventricular groove of donors ranging in age from 56 to 75 years. All samples were collected at the Global Hospital, Hyderabad, India and were received in accordance with the declaration of Helsinki with approval from the local hospital ethics committee and institutional ethics committee after a written informed consent. Tissue samples were collected in serum-free Dulbecco’s minimum essential medium (DMEM)/F12 medium supplemented with antibiotics and processed within 3–4 hours. The directed differentiation of adipose-derived stem cells (ADSCs) and epicardial adipose derived stem cells to cardiomyocytes was achieved using 5-azacytidine and basic fibroblastic growth factor (bFGF) 2 in long-term culture for 21 days or more. The differentiated cells were tested for the expression of cardiac markers such as actin, desmin, and troponin-I by immunocytochemistry and for signal regulatory protein alpha (SIRPA) and kinase domain receptor (KDR) by flow cytometry.
Selection of compatible biopolymers for the surface modification of SPIONs
Dextran, polyethylene glycol (PEG), poly-L-lysine (PLL), protamine sulfate, heparin sulfate, hyaluronic acid, and superparamagnetic iron oxide nanoparticles (SPIONs) were tested for their toxicity towards stem cells. The viability of the mesenchymal stem cells (MSCs) labeled with biopolymers and SPIONs was assessed by MTT (3,4,5-dimethylthiazol-2-yl)-2-5-diphenyltetrazolium bromide) assay, which is based on the reduction of MTT by mitochondrial dehydrogenase in intact cells to a purple formazan product.
Surface modification of SPIONs with fluorescence-tagged PEG/dextran and determination of their labeling efficiency by confocal laser scanning microscope
Surface modification of SPIONs was performed with dextran or PEG by direct adsorption. The SPION/dextran and SPION/PEG complexes were made by incubating the components together at different ratios (1:2–1:10) at room temperature for 1 hour in a RotoSpin to determine the optimal concentration required for successful surface modification of SPIONs. To acquire fluorescent properties, dextran and PEG were linked with rhodamine isothiocyanate and fluorescein isothiocyanate (FITC), respectively. Cells were seeded in 96-well plates and on cover slips and incubated in a humid 5% CO2 incubator at 37°C for 18 hours. The cells were then exposed to different ratios of the SPION/biopolymer complex for 24 hours in a humidified atmosphere as mentioned above. The viability of the MSCs labeled with SPION/biopolymer was assessed by MTT assay as described above. SPION-labeled cells on cover slips were fixed and mounted using DAPI-containing mounting medium to evaluate SPION localization using confocal laser scanning microscope (CLSM).
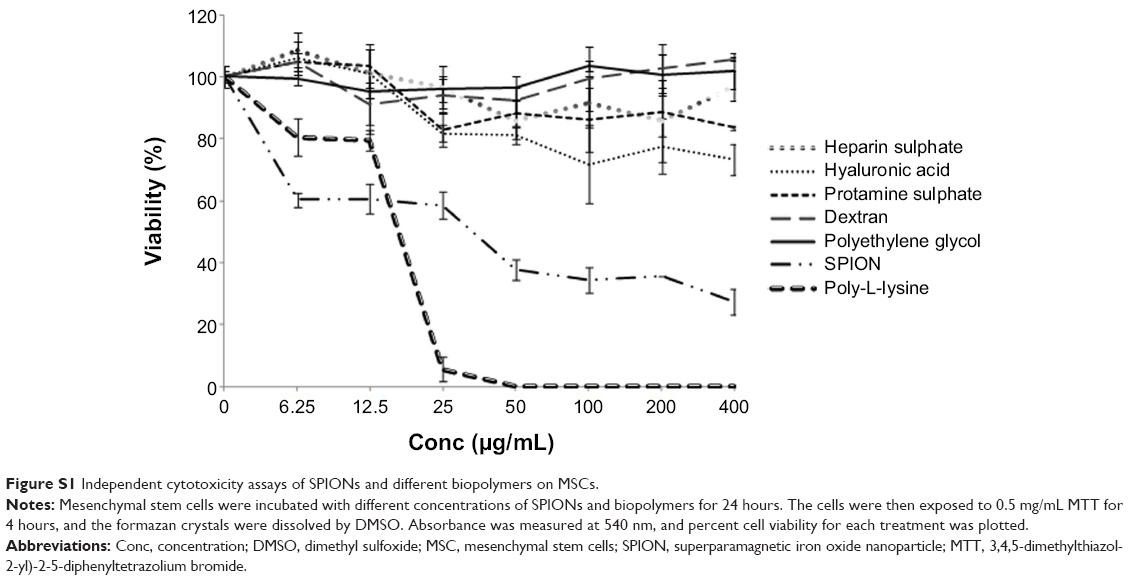 | Figure S1 Independent cytotoxicity assays of SPIONs and different biopolymers on MSCs. |
Construction of f(SPION-PEG-mAb) nanoprobe
The surface of SPIONs was modified by allowing the adsorption of PEG onto the surface by incubating under gentle rotation at room temperature for 1 hour. The SPION complex was then tagged with mAbs by direct adsorption at 4°C for 2 hours to make the nanoprobe. In this study, we used a cocktail of SIRPA/CD105 and KDR/CD105 to construct nanoprobes specific for cardiac progenitor cells, as these surface antigens mark progenitor stem cells in the SVF that have characteristics of cardiomyocytes. Therefore, this nanoprobe can be tailor-made according to the choice of the progenitor cells that need to be segregated from the SVF or any other tissue source.
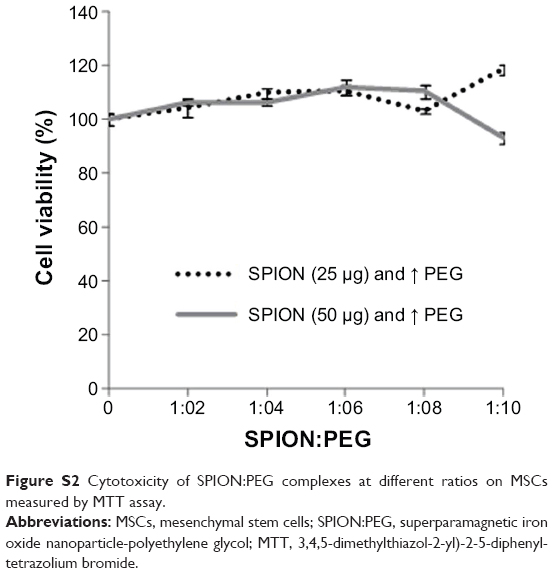 | Figure S2 Cytotoxicity of SPION:PEG complexes at different ratios on MSCs measured by MTT assay. |
Measurement of labeling efficiency of f(SPION-PEG-mAb) by Prussian blue staining and distribution by transmission electron microscopy
MSCs (2×10³ cells) were grown on cover slips for 18 hours in a humidified atmosphere as mentioned above and incubated with the SPION complex for 24 hours. After labeling, the cells were washed thoroughly with phosphate-buffered saline (PBS), fixed with 3.7% paraformaldehyde and stained with Prussian blue solution (potassium ferrocyanide (10%) mixed with HCl (10%) at a ratio of 7:3) for 30 minutes at room temperature. After staining, the cells were washed with PBS and visualized under a bright field microscope to detect iron particles, which appear as blue spots within the cells. The cells were maintained in culture for approximately 10 days and analyzed for the presence of SPIONs inside the cells and their viability on alternate days (days 2, 4, 6, 8, and 10). Prussian blue staining was used to evaluate SPION distribution within the cells, and JC-1 staining was used to determine the viability of the labeled cells.
Cells labeled with the SPION complex were trypsinized and fixed in 2.5%–3% glutaraldehyde in 0.1 M phosphate buffer (pH 7.2) for 24 hours at 4°C. Treated cells were washed four times with PBS and again fixed in 2% osmium tetra oxide for 24 hours. Subsequently, after washing four times in deionized water, serial dehydration was performed with alcohol, and finally the cells were embedded in araldite6005 resin or Spurr resin (Spurr 1969). For complete polymerization, the embedded cells were incubated at 60°C–80°C for 48–72 hours. The sections (50–70 nm) were cut on an ultramicrotome (Leica Ultra cut UCT-GA-D/E-1/00) and mounted on copper or nickel grids. The sections were stained with saturated aqueous uranyl acetate (UA) and counter-stained with Reynolds lead citrate (LC). Imaging was conducted using a transmission electron microscope (Hitachi, H-7500 Japan) at the desired magnifications. The sample processing and imaging was performed at the RUSKA Labs College of Veterinary Sciences, SVVU, Hyderabad, India.
Iron degradation pattern after labeling with f(SPION-PEG-mAb) complex
MSCs were labeled with the nanoprobe complex (50 μg of SPION/1.5×106 cells) as described above and maintained under the required culture conditions for 7–10 days to evaluate the kinetics of iron degradation. The intracellular iron content of labeled cells was determined according to the methods of Janic et al.1 Briefly, labeled cells were trypsinized at different time points and incubated overnight at 90°C. Intracellular iron was dissolved using 5 M HCl at 60°C for 4 hours, and the iron content was measured by UV spectrophotometry at 340 nm. The average absorbance value for each sample was divided by the number of cells to obtain the average iron content per cell. The iron content of each labeled cell was measured using the standard curve obtained by plotting known concentrations of SPIONs.
Differentiation of labeled cells into mature cardiomyocytes
To evaluate their differentiation efficiency, labeled cells were cultured in complete medium consisting of L-DMEM supplemented with 10% FBS and antibiotics for 72 hours in a humidified 5% CO2 incubator at 37°C to allow them to adhere to the culture plates. To induce direct cardiomyocyte differentiation, the medium was then switched to cardiomyocyte differentiation medium, which consisted of L-DMEM supplemented with FBS (2.0%), bFGF (10 ng/mL) and 5-azacytidine (3.0 μM), for 48 hours. Subsequently, the differentiation medium was removed, and the cells were maintained in L-DMEM with the medium changed every 3rd day for 21 days to obtain cardiomyocytes with striated morphology. The differentiated cells were then evaluated for the presence of cardiac markers, such as troponin I and actin, by ICC using appropriate antibodies.
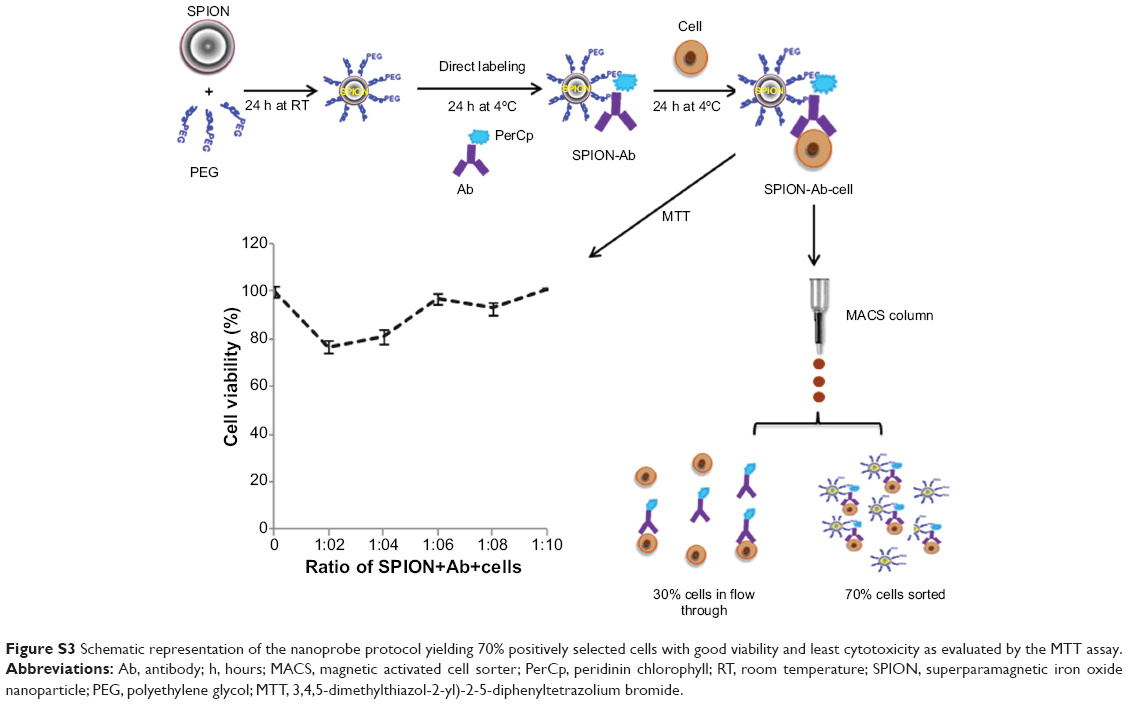 | Figure S3 Schematic representation of the nanoprobe protocol yielding 70% positively selected cells with good viability and least cytotoxicity as evaluated by the MTT assay. |
Determination of apoptotic/necrotic effects of the f(SPION-PEG-mAb) complex in labeled cells
Detection of early and late apoptosis
Early/late apoptosis or necrosis was analyzed by Annexin V-FITC and PI staining according to the manufacturer’s recommendations (eBioscience Inc, San Diego, CA, USA). Briefly, labeled, unlabeled, and 10 μM H2O2-treated cells were washed and resuspended in binding buffer. Cells were then incubated with Annexin V-FITC for 10 minutes at room temperature in the dark, followed by the addition of PI to binding buffer, and analyzed immediately by flow cytometry on the FL1 channel.
Measurement of mitochondrial membrane potential
The mitochondrial membrane potential of cells labeled with SPION complexes was evaluated by flow cytometry and fluorescence microscopy using a JC-1 assay kit according to the manufacturer’s protocol. For fluorescent microscopy, MSCs were incubated with SPION complexes for 24 hours, as described previously. After incubation, the medium was carefully removed and replaced with JC-1 solution diluted with culture medium for 30 minutes at 37°C. Cells were processed after a brief wash with serum-free medium and mounted onto microscopic slides using antifade mounting medium. For flow cytometric analysis, cells labeled with SPION complexes were trypsinized, resuspended in JC-1 solution and incubated for 30 minutes at 37°C. After the JC-1 solution was removed, the cells were washed in FACS buffer and analyzed on the FL2 channel to detect red JC-1 aggregates of healthy cells and on the FL1 channel to detect green monomers of apoptotic cells. Unlabeled cells and cells treated with 10 μM H2O2 served as the negative and positive controls, respectively.
Detection of intracellular ROS by H2DCFDDA
Intracellular ROS was measured by fluorescence microscopy and flow cytometry using the peroxide-sensitive fluorescent probe carboxy,-2′,7′-dichlorofluorescein diacetate (H2DCFDA). MSCs grown on cover slips were loaded with 20 μM H2DCFDA for 60 minutes at 37°C. After a brief wash with serum-free medium, cells were incubated with SPION complexes under the conditions described above. After labeling, the cover slips were washed twice with PBS and mounted on slides using mounting medium (Vectashield) containing DAPI. Imaging was conducted using a fluorescence microscope (Leica, Germany) and photographed by a digital camera. Alternatively, cells were trypsinized after labeling, and ROS production was determined by flow cytometry on the FL1 channel. Unlabeled cells and cells treated with 10 μM H2O2 were used as the negative and positive controls, respectively.
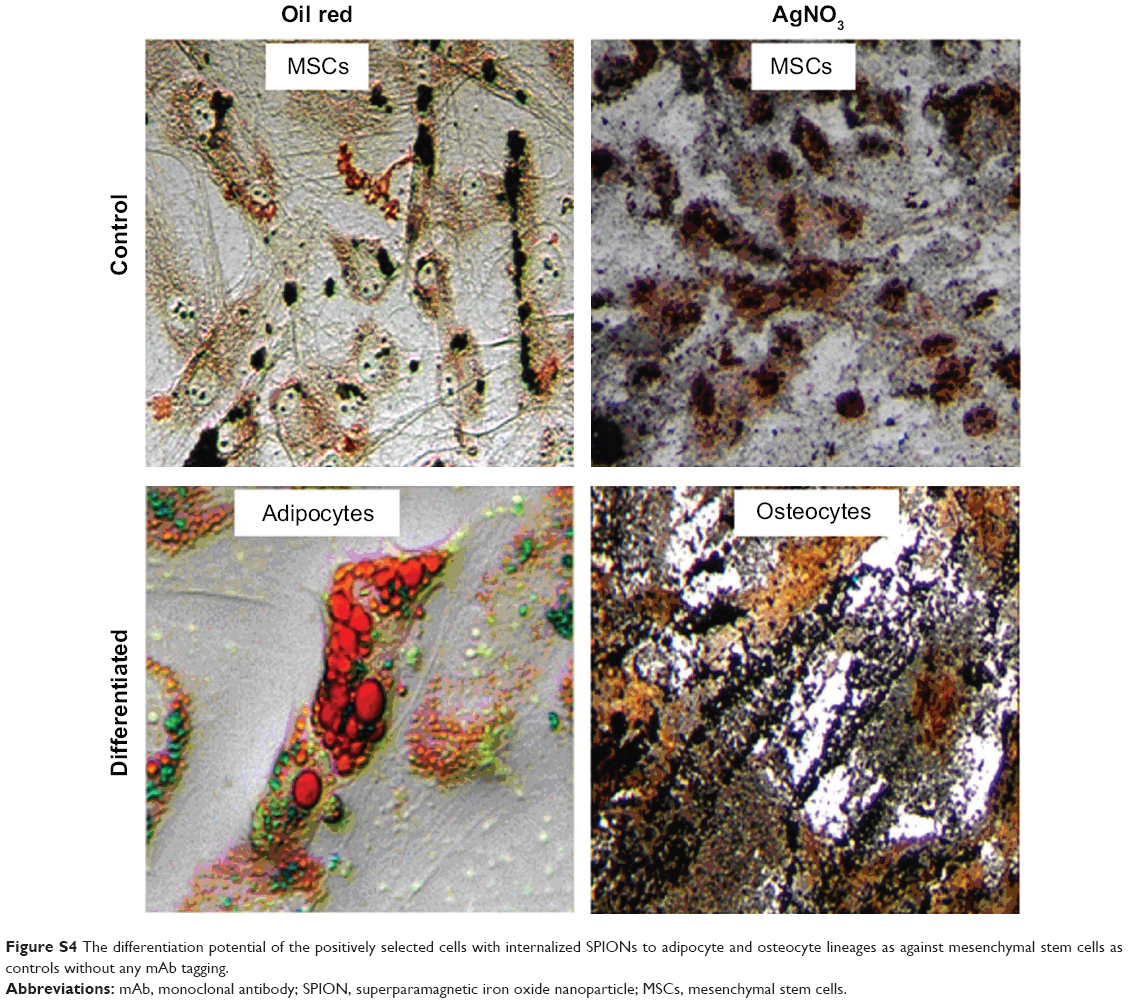 | Figure S4 The differentiation potential of the positively selected cells with internalized SPIONs to adipocyte and osteocyte lineages as against mesenchymal stem cells as controls without any mAb tagging. |
Detection of DNA strand breaks by terminal deoxynucleotidyltransferase-mediated UTP end labeling assay
DNA strand breaks were detected by terminal deoxynucleotidyltransferase-mediated UTP end labeling (TUNEL) technique using the FlowTACS™ labeling kit according to the manufacturer’s protocol (Trevigen Inc, Gaithersburg, MD, USA). Cells were trypsinized after labeling, processed as per the protocol and green fluorescence was detected on the FL1 channel by flow cytometry. Unlabeled cells and 10 μM H2O2-treated cells were used as the negative and positive controls, respectively.
Assessment of oxidative DNA damage by COMET assay
Oxidative DNA damage was evaluated by COMET assay using the assay kit as recommended by the manufacturer (Trevigen Inc, Gaithersburg, MD). Briefly, cells were trypsinized after labeling, combined with LMAgarose at a ratio of 1:10, and immediately pipetted onto a CometSlide™. The slides were immersed in lysis solution at 4°C for 60 minutes followed by DNA unwinding in alkaline electrophoresis buffer for 20–60 minutes at room temperature. Slides were then electrophoresed for 30 minutes at 21 V, dehydrated in 70% ethanol for 5 minutes and stained with SYBR® Green for imaging using a fluorescence microscope.
Measurement of inflammatory cytokines
Inflammatory cytokines such as interferon gamma (IFN-γ) and tumor necrosis factor alpha (TNF-α) were measured in the culture supernatant of labeled, unlabeled, and H2O2-treated cells by direct enzyme-linked immunosorbent assay (ELISA). Cells were labeled with SPION complexes as described previously. The culture supernatant was collected after 24 hours and coated onto ELISA plates at a final total protein concentration of 20 μg/mL. Antigen-coated ELISA plates were covered with adhesive plastic and incubated at 4°C overnight. After discarding the coating solution, the wells were washed twice with PBS and nonspecific binding was blocked by incubating with 5% bovine serum albumin at room temperature for 1 hour. The plates were incubated with IFN-γ and TNF-α-specific mAbs for 1 hour at room temperature, followed by washing four times with PBS and incubating with horseradish peroxidase-conjugated secondary antibody for another 1 hour at room temperature. The presence of antigen was detected by the addition of TMB (3,3′,5,5′-tetramethylbenzidine) substrate. Color development was measured at 490 nm after the addition of stop solution.
Karyotyping
The actively dividing cells were arrested at the mitotic phase after 48 hours of cell seeding. The cells were treated with colchine (0.6 mg/mL) for 45 minutes and harvested using 0.25% trypsin-EDTA. The cells were washed and suspended in prewarmed hypotonic solution (0.075M KOH) for 20 minutes at 37°C. After centrifugation the pellet was fixed in chilled methanol and glacial acetic acid (3:1) solution by pipetting vigorously. The cell pellet was incubated overnight at 4°C. The fixed cells were dropped on to a pre warmed slide by holding the slide at a 60° angle. The primary screening was done by giemsa stain. The stained slides were trypsin giemsa banded for screening using spectral imaging software.
Reference
Janic B, Rad AM, Jordan EK, et al. Optimization and validation of FePro cell labeling method. PLoS One. 2009;4(6):e5873. |
 © 2015 The Author(s). This work is published and licensed by Dove Medical Press Limited. The full terms of this license are available at https://www.dovepress.com/terms.php and incorporate the Creative Commons Attribution - Non Commercial (unported, v3.0) License.
By accessing the work you hereby accept the Terms. Non-commercial uses of the work are permitted without any further permission from Dove Medical Press Limited, provided the work is properly attributed. For permission for commercial use of this work, please see paragraphs 4.2 and 5 of our Terms.
© 2015 The Author(s). This work is published and licensed by Dove Medical Press Limited. The full terms of this license are available at https://www.dovepress.com/terms.php and incorporate the Creative Commons Attribution - Non Commercial (unported, v3.0) License.
By accessing the work you hereby accept the Terms. Non-commercial uses of the work are permitted without any further permission from Dove Medical Press Limited, provided the work is properly attributed. For permission for commercial use of this work, please see paragraphs 4.2 and 5 of our Terms.