")
Back to Journals » Therapeutics and Clinical Risk Management » Volume 11
Fluid accumulation threshold measured by acute body weight change after admission in general surgical intensive care units: how much should be concerning?
Authors Chittawatanarat K , Pichaiya T, Chandacham K, Jirapongchareonlap T, Chotirosniramit N
Received 10 April 2015
Accepted for publication 10 June 2015
Published 27 July 2015 Volume 2015:11 Pages 1097—1106
DOI https://doi.org/10.2147/TCRM.S86409
Checked for plagiarism Yes
Review by Single anonymous peer review
Peer reviewer comments 3
Editor who approved publication: Professor Garry Walsh
Kaweesak Chittawatanarat,1 Todsaporn Pichaiya,2 Kamtone Chandacham,1 Tidarat Jirapongchareonlap,1 Narain Chotirosniramit1
1Division of Surgical Critical Care and Trauma, Department of Surgery, Faculty of Medicine, 2Department of Physical Therapy, Faculty of Associated Medical Science, Chiang Mai University, Chiang Mai, Thailand
Background: The objective of this study (ClinicalTrials.gov: NCT01351506) was to identify the threshold level of fluid accumulation measured by acute body weight (BW) change during the first week in a general surgical intensive care unit (ICU), which is associated with ICU mortality and other adverse outcomes.
Methods: Four hundred sixty-five patients were prospectively followed for a 28-day period. The maximum BW change threshold during the first week was evaluated by the maximum percentage change in BW from the ICU admission weight (Max%ΔBW). Daily screening of adverse events in the ICU were recorded. The cutoff point of Max%ΔBW on ICU mortality was defined by considering the area under the receiver operating characteristic (ROC) curve, intersection of the sensitivity and specificity, and the Youden Index. Univariable and multivariable regression analyses were used to demonstrate the associations. Statistical significance was defined as P<0.05.
Results: The appropriate cutoff value of Max%ΔBW threshold was 5%. Regarding the multivariable regression model, in overall patients, the occurrence of the following adverse events (expressed as adjusted odds ratio [95% confidence interval]) were significantly associated with a Max%ΔBW of >5%: ICU mortality (2.38 [1.25–4.54]) (P=0.008), ICU mortality in patients without renal replacement therapy (RRT) (2.47 [1.21–5.06]) (P=0.013), reintubation within 72 hours (2.51 [1.04–6.00]) (P=0.039), RRT requirement (2.67 [1.13–6.33]) (P=0.026), and delirium (1.97 [1.08–3.57]) (P=0.025). Regarding the postoperative subgroup, a Max%ΔBW value of more than 5% was significantly associated with: ICU mortality (3.87 [1.38–10.85]) (P=0.010), ICU mortality in patients without RRT (6.32 [1.85–21.64]) (P=0.003), reintubation within 72 hours (4.44 [1.30–15.16]) (P=0.017), and vasopressor requirement (2.04 [1.04–4.01]) (P=0.037).
Conclusion: Fluid accumulation, measured as acute BW change of more than the threshold of 5% during the first week of ICU admission, is associated with adverse outcomes of higher ICU mortality, especially in the patients without RRT, with reintubation within 72 hours, with RRT requirement, with vasopressor requirement, and with delirium. Some of these effects were higher in postoperative patients. This threshold value might be an indicator for caution during fluid management in surgical ICU.
Keywords: fluid accumulation, body weight change, adverse events, surgical intensive care unit
Introduction
Appropriate fluid management in surgical patients continues to be a controversial issue. Two randomized controlled trials reported that perioperative fluid management with maintenance of the preoperative body weight (BW) could decrease postoperative complications.1,2 These reports are in contrast to a recent meta-analysis of perioperative fluid restriction in major abdominal surgery that showed no significant differences in postoperative complications, death, and hospital stay.3 In critically ill patients, fluid restriction shortened the duration of mechanical ventilation and days occupied in the intensive care unit (ICU) in the case of acute lung injuries.4 In addition, there have been different definitions of fluid overload in surgical patients.5,6 Previously, perioperative fluid overload was defined as gain of 10% of the dry weight that produced more postoperative complications.6 However, recent evidence found that a positive fluid balance of more than 2,000 mL (approximately 4%–7% of dry weight) during the intraoperative period was a strong risk factor for cardiovascular complications in thoracic surgical patients.7 Nonetheless, to date, there has been little evidence to demonstrate the threshold for concern and influence of fluid accumulation on outcomes, especially in high risk and critically ill surgical patients.6 In addition, accurate fluid output was difficult to measure in some surgical patients because of multiple drains, wounds, and insensible loss. For this population, acute BW change might be a surrogate parameter for estimated fluid balance and accumulation. The objective of this study was to identify the threshold level for acute BW change after fluid management, using the maximum BW change during the first week after surgical ICU admission, and to verify the association of this threshold with ICU mortality and other adverse outcomes in ICU.
Methods
This study was a prospective cohort study in a 14 bed, intensivist-led, general surgical ICU in a Northern Thai tertiary-care university-based teaching hospital. This ICU provides services mainly for abdominal surgical, noncardiac thoracic, vascular, and trauma patients. Postcardiac and neurological surgical patients were not accommodated in this unit. All patients who were expected to survive for more than 24 hours after the ICU admission and could be weighed, and patients who were not expected to die due to terminal illness were included, morbidly obese patients were excluded. All the patients were directly cared for by intensivists. The fluid resuscitation guidance was based on standard guidelines. Those patients who stayed in the ICU for less than 24 hours and could not have a second weight measurement were excluded. The Faculty of Medicine, Chiang Mai University Ethics Committee and Review Board approved this study protocol. The study protocol was registered with ClinicalTrials.gov, as trial number NCT01351506.
Fluid accumulation measurement using daily BW alteration
The reference weight (BW0) was measured on the ICU admission and established as the reference point for BW alteration calculations. Daily BW was obtained in kilograms, rounded to one decimal place. Two types of BW measurement devices were used in this study – weighing beds (with integrated weighing scales) and patient lift scales (for patients who were not in a weighing bed). Every patient was measured by the same tool throughout the study. The weight measurement was performed daily at the same time in the morning (every 24 hours). We measured the daily BW until the patient was discharged from the ICU or at maximum, at the seventh day. The percentage change in weight (%ΔBW) was calculated as:
| (1) |
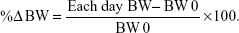
The maximum %ΔBW (Max%ΔBW) during the first week was selected as the predictor of patient outcomes.
Measurement of the outcomes
The adverse outcomes of interest were defined the same as the definitions of adverse events in a large multicenter cohort study – the Thai University-Based Surgical Intensive Care Units Study (THAI-SICU study) – and standard definitions.8–10 These included ICU deaths, 28-day deaths, reintubation within 72 hours, ICU readmission within 48 hours, new occurrences of acute respiratory failure, sepsis, acute kidney injury (AKI), primary myocardial infarction, and delirium. These adverse events were screened daily for up to 28 days after the ICU admission or until the ICU discharge. We also recorded mechanical ventilator use (days), as well as requirement of vasopressors, neuromuscular blocking agents, sedative agents, and renal replacement therapy (RRT), in addition to the length of the ICU stay.
The definitions for some of the adverse events are summarized as follows:8–10 Acute respiratory failure was defined as having all three of (1) acute onset of bilateral infiltration, (2) no evidence of left atrial hypertension, and (3) ratio of arterial partial pressure of oxygen to a fraction of inspired oxygen ≤300. Delirium was defined by at least four of the following criteria: consciousness alteration, inattention, disorientation, hallucination-delusion-psychosis, psychomotor agitation or retardation, inappropriate speech or mood, and symptom fluctuation. AKI was defined using the serum creatinine criteria, by the increase of the serum creatinine level by more than 0.3 g/dL from baseline. Primary myocardial infarction was defined by at least two of the following criteria: positive troponin-T, ischemic symptoms >20 minutes, and electrocardiographic alterations.
Data collection and statistical analysis
On admission, the patient’s age, sex, BW at admission, height, admission diagnosis, smoking status, Acute Physiologic and Chronic Health Evaluation II (APACHE II) score, and serum albumin level were recorded. Adverse outcome occurrences, fluid intake and output, type of fluid, days of mechanical ventilation, and days of vasopressor were screened and recorded daily until the ICU discharge. The survival status was recorded at the ICU discharge and 28 days after the ICU admission.
The data were analyzed using the STATA software (version 11.0; STATA Inc., College Station, TX, USA). Descriptive continuous variable data differences were reported as the mean and standard deviation for normal distribution data and as the median (25–75 interquartile range [IQR]) for nonparametric distribution. Categorical variables were reported in percentage. Regarding the Max%ΔBW cutoff point, Hosmer–Lemeshow goodness of fit was performed for calibration testing. Receiver-operating characteristic (ROC) plots and C statistic were used for assessing the discriminate ability between Max%ΔBW during the first week of admission and ICU mortality. Youden Index, calculated as
Youden index = Sensitivity + Specificity − 1 | (2) |
was used for capturing the maximum vertical distance of the ROC curve.11 The association between the Max%ΔBW cutoff point and other adverse events was tested by the regression method. These were reported as the odds ratio (OR) and the coefficient with 95% confidence interval (CI). The APACHE II score, albumin level, smoking status, surgical status, and age at the time of admission were the variables used for adjusting the multivariable regression analysis. For the sensitivity analysis, subgroups of postoperative and nonoperated patients were analyzed with multivariable regression analysis, adjusted using the APACHE II score, albumin level, smoking status, and age at the time of admission. Statistical significance was considered with a two-sided P-value less than 0.05.
Results
A total of 602 patients, as per the inclusion criteria, between May 2011 and August 2012 were enrolled on the ICU admission (day 0). One hundred and thirty-seven patients were excluded due to their short stay in the ICU or because they were not weighed a second time on day 1. The remaining 465 patients were included and followed in this study. All of these patients were followed up to the 28th day after the ICU admission. Figure 1 demonstrates the study process, follow-up, and number of patients weighed in the first 7 days after admission in the ICU.
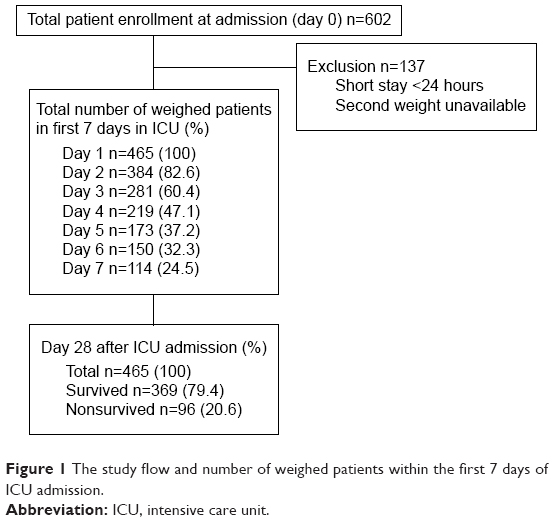 | Figure 1 The study flow and number of weighed patients within the first 7 days of ICU admission. |
The characteristics of the patients are demonstrated in Table 1, expressed as median (IQR) and number (%). Their median age was 60 (49–74) years. Approximately 60% of the patients were male. The median ICU admission weight was 53 (45–64) kg, with a median body mass index of 20.9 (17.9–24.0) kg/m2. Two-thirds of patients were postoperative patients. The median APACHE II score was 14 (11–19). The top three ICU primary admission diagnoses with organ involvement were abdominal diseases (44.3%), cardiovascular diseases (15.3%), and respiratory diseases (15.1%), respectively. Nearly half of the patients were nonsmokers. Ex-smokers and current smokers were 35% and 17%, respectively. Regarding the ICU outcomes, the ICU and 28-day mortality rates were 15.0% and 20.6% respectively. There were no differences in the age, sex, BW, height, BMI, and ICU primary diagnosis categories between the groups of surviving and nonsurviving patients at ICU discharge. There was statistical significance (P<0.001) for surgical status, admission APACHE II score, and albumin level, between groups. There was a tendency of difference in smoking status between the groups (P=0.068). All of these parameters were possible confounders and were considered as predictors in the multiple regression analysis.
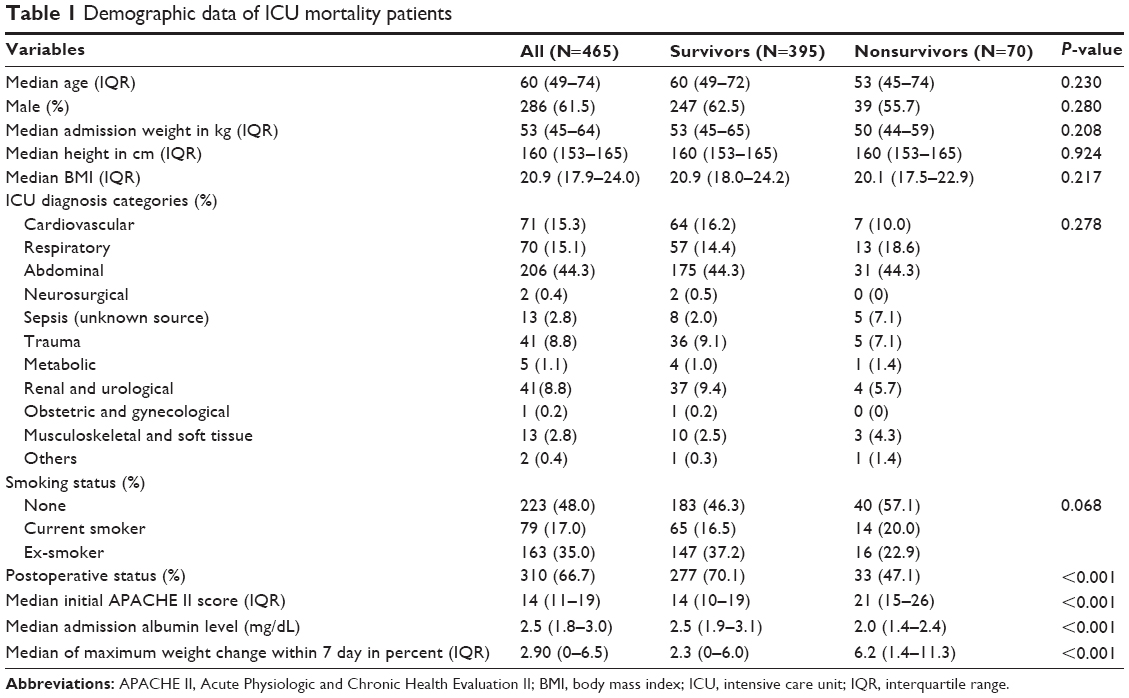 | Table 1 Demographic data of ICU mortality patients |
Regarding the percentage of BW change from ICU admission, there were statistically significant difference between surviving and nonsurviving patients except on day 1 and day 4 (Figure 2). In Table 1, the median (IQR) of Max%ΔBW in the first week of ICU admission was 2.9% (0%–6.5%). The median (IQR) Max%ΔBW in nonsurviving patients was significantly higher than in surviving patients (6.2 [1.4–11.3] vs 2.3 [0–6.0]) (P<0.001). Based on the Max%ΔBW categorization of ICU mortality, the model demonstrated goodness of fit and was well-calibrated (Hosmer–Lemeshow test; P=0.95), and the Pearson chi-square was 0.70. The area under the ROC curve (95% CI) for Max%ΔBW was 0.65 (0.58–0.73). The appropriate cutoff point value as well as the intersection of the sensitivity and specificity curves was nearly 5% of Max%ΔBW (Figure 3). The maximum Youden Index value was 0.27, and this correlated with the Max%ΔBW of 6.30%. Regarding simplification in clinical practice, considered together with the intersection curve in Figure 3 and given the higher sensitivity, the Max%ΔBW of 5% (Youden Index =0.25) was determined as the cutoff point in this study. For further testing of this cutoff, the Max%ΔBW was subdivided into six groups: negative or no change; 0.01–2.5; 2.51–5.00; 5.01–7.50; 7.51–10.00; and more than 10%. Figure 4 demonstrates the association between the Max%ΔBW and the ICU mortality in each subgroup. The significance for ICU mortality (P<0.05) began at the threshold of Max%ΔBW more than the 5%. Therefore, this cutoff was used for further analysis of association with other adverse events.
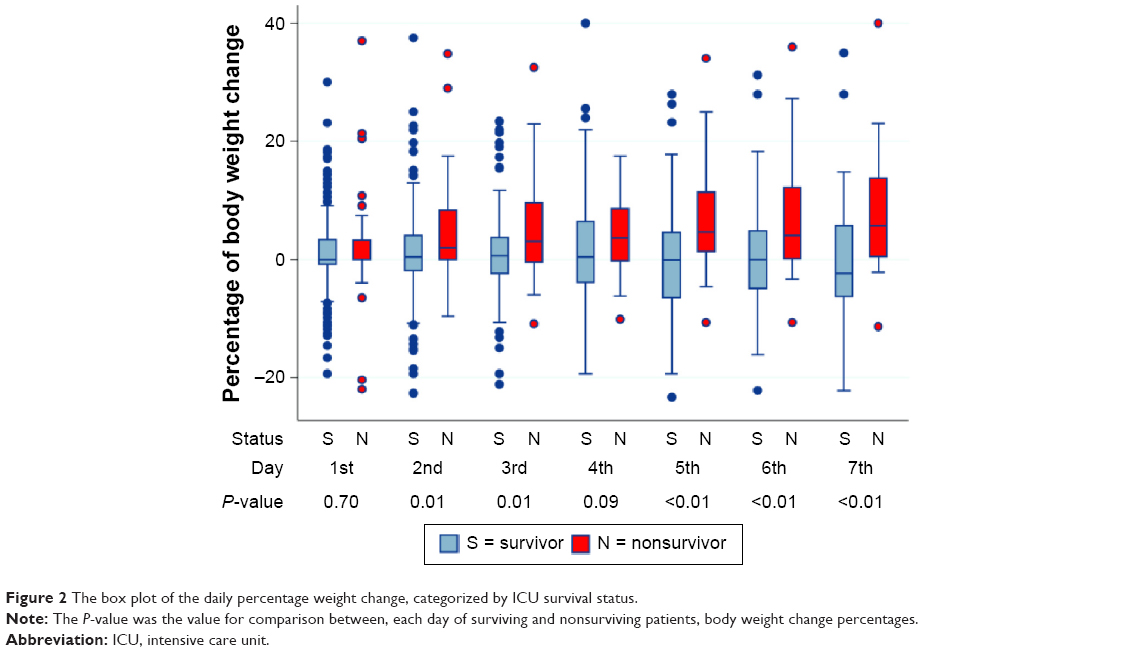 | Figure 2 The box plot of the daily percentage weight change, categorized by ICU survival status. |
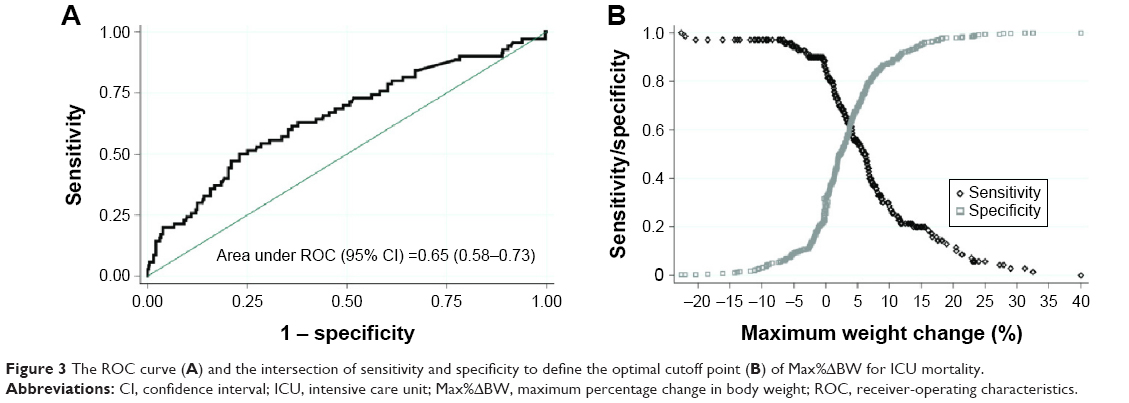 | Figure 3 The ROC curve (A) and the intersection of sensitivity and specificity to define the optimal cutoff point (B) of Max%ΔBW for ICU mortality. |
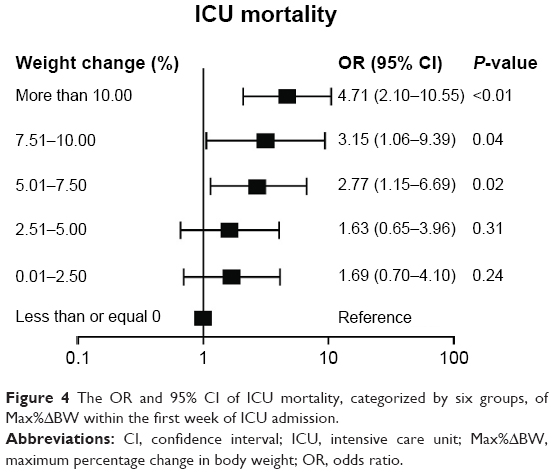 | Figure 4 The OR and 95% CI of ICU mortality, categorized by six groups, of Max%ΔBW within the first week of ICU admission. |
Table 2 demonstrates the average fluid intake per day for each type of fluid, the total output per day, the fluid balance per day, the total duration, and the total fluid accumulation during the surgical ICU admission, expressed as median [IQR]. Patients who were exposed to a Max%ΔBW of more than 5% had significantly higher fluid intake per day (2.9 [2.0–3.9] L/day vs 3.5 [2.5–4.9] L/day) (P<0.001), amount of crystalloid per day (2.2 [1.6–2.9] L/day vs 2.4 [1.6–3.2] L/day) (P=0.043), fluid balance per day (0.8 [0.1–1.9] L/day vs 1.2 [0.5–3.1] L/day) (P<0.001), total duration of fluid administration (3 [ 2–6] days vs 4 [2–9] days) (P=0.050), and total fluid accumulation during the study period (2.6 [0.5–5.5] L vs 4.5 [2.1–9.4] L) (P<0.001), but there was no difference in total average fluid output per day (1.9 [1.3–2.5] L/day vs 2.0 [1.2–2.7] L/day) (P=0.732). Although there were some differences in the proportion of the fluid types (ie, colloids and blood components) between groups of Max%ΔBW, there were no differences between the averages of the received amounts of colloids and blood components per day, where those fluids were received (P>0.05).
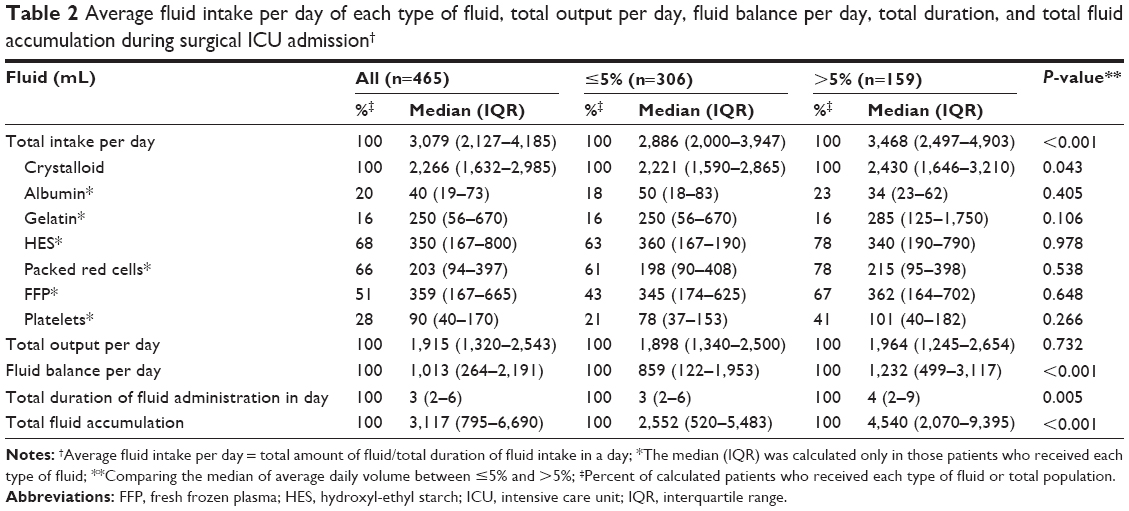 | Table 2 Average fluid intake per day of each type of fluid, total output per day, fluid balance per day, total duration, and total fluid accumulation during surgical ICU admission† |
In univariable analysis (Table 3), the Max%ΔBW significantly increased the OR of ICU mortality (P<0.001), especially mortality in groups patients without RRT (P=0.002), with 28-day mortality (P=0.007), with reintubation within 72 hours (P=0.019), with AKI (P=0.022), with vasopressor requirement (P<0.001), with delirium (P=0.003), with RRT requirement (P=0.001), with longer duration of mechanical ventilation (P=0.006), with longer duration of vasopressor (P=0.002), and with longer lengths of stay, in days, in the ICU (P=0.012). In addition, the Max%ΔBW showed a trend of increased risk of 28-day mortality in the groups of patients without RRT (P=0.066), and with the number of days sedation required (P=0.079). Regarding possible confounder variables (admission APACHE II score, age, smoking status, operative status, and admission albumin level), all of these outcomes were adjusted in the multivariable regression analysis (Table 4). With the adjusted values, the Max%ΔBW significantly increased the ICU mortality (OR [95% CI]) (2.38 [1.25–4.54]) (P=0.008), ICU mortality in the group without RRT patients (2.47 [1.21–5.06]) (P=0.013), the reintubation within 72 hours (2.51 [1.04–6.00]) (P=0.039), RRT (2.67 [1.13–6.33]) (P=0.026), and the delirium occurrence (1.97 [1.08–3.57]) (P=0.025). In the sensitivity analysis, regarding the postoperative group, the existing statistical significance increased the OR of ICU mortality (3.87 [1.38–10.85]) (P=0.010), ICU mortality in the group without RRT patients (6.32 [1.85–21.64]) (P=0.003), and reintubation within 72 hours (4.44 [1.30–15.16]) (P=0.017). In addition, there was significant increase in the vasopressor requirement (2.04 [1.04–4.01]) (P=0.037). However, the delirium was not different in this group. Regarding the nonoperated group (NO), the adverse outcomes were statistically no different between groups in the multiple regression analysis except delirium occurrence 3.16 (1.13–8.78) (P=0.027). It also had the tendency of an increase in the RRT (3.53 [0.93–13.43]) (P=0.065). The median (IQR) ICU length of stay and the median (IQR) admission APACHE II score in the postoperative were significantly lower than those in the NO subgroup (the ICU length of stay was 3 [2–6] vs 4 [2–10] days [P=0.003] and APACHE II score was 14 [10–19] vs 16 [12–20] [P<0.001]).
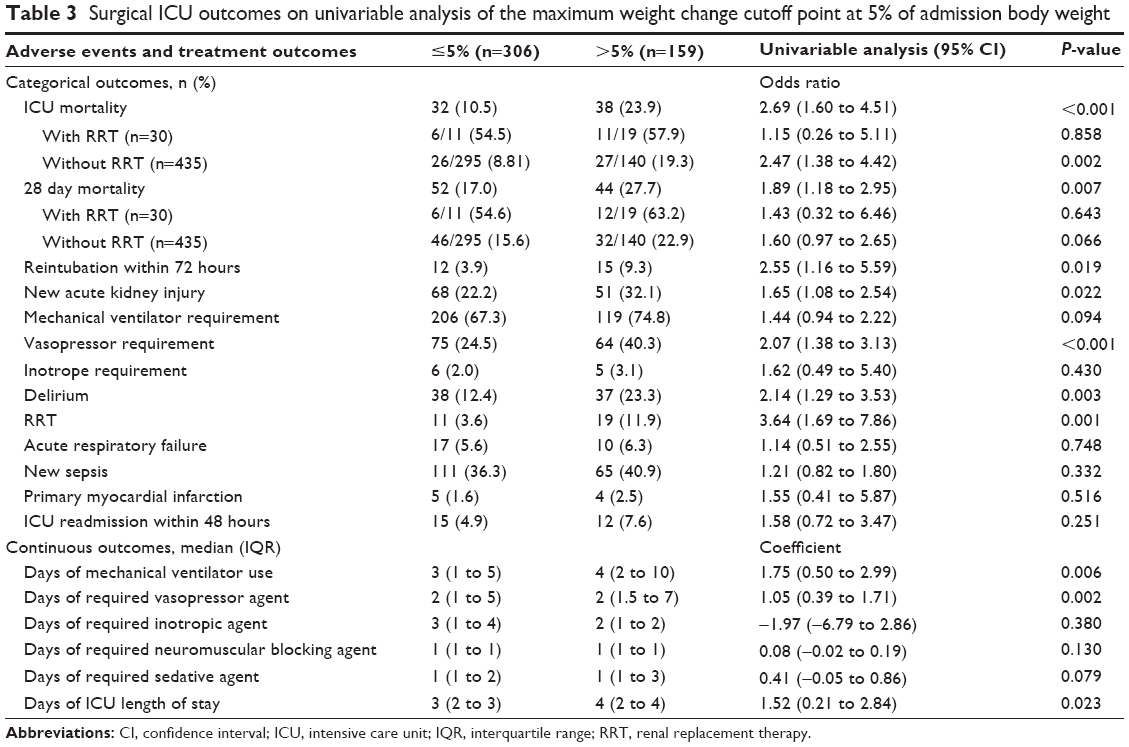 | Table 3 Surgical ICU outcomes on univariable analysis of the maximum weight change cutoff point at 5% of admission body weight |
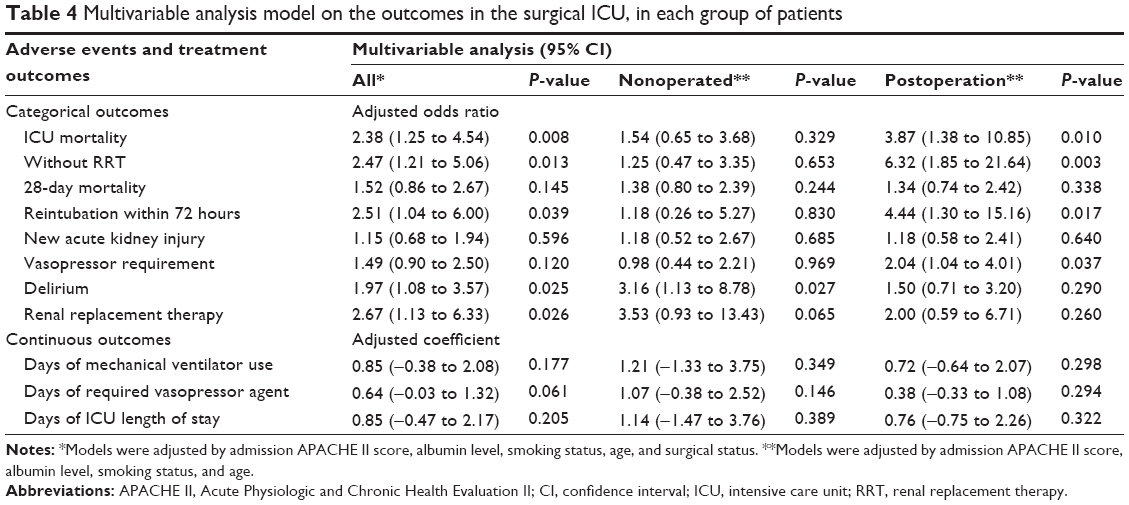 | Table 4 Multivariable analysis model on the outcomes in the surgical ICU, in each group of patients |
Discussion
The standard cutoff value of fluid overload is currently still uncertain. Although in previous studies, the cutoff level for fluid accumulation overload was considered to be 10% BW gain from dry weight,6,12 this cutoff might be a higher level than is appropriate for a fluid accumulation threshold in a fluid overload definition. Evidence in animal study has found that macroscopic intestinal wall edema was observed when fluid accumulation increased above 3.3%.13 Recently, the cutoff value has been decreasing. One recent cohort study of open heart surgery used the cutoff of 8.0% for fluid overload classification.5 Our results supported that ICU outcomes are impacted by a lower cutoff threshold, which is referenced on the ICU admission weight. The fluid accumulation threshold of Max%ΔBW of more than 5% from admission BW was observed to significantly increase ICU mortality in this study. In addition, this cutoff value was also an independent predictor for adverse outcomes regarding reintubation within 72 hours, RRT requirement, and delirium. The tendency to have longer duration of vasopressor requirement was also observed (Table 3). However, the reference value of BW used in this study was measured at ICU admission. In ICU practice, actual dry weight and accurate dry weight are seldom obtained because most surgical patients are resuscitated before ICU admission and the BW records from the general ward are, by and large, incomplete and unreliable. Therefore, the reference BW in this study might be higher than the dry weight that was used as reference BW in previous studies.6,12 Regarding the effect modification in postoperative patients, we separately analyzed the association between Max%ΔBW and ICU adverse outcomes. While the postoperative group had a higher OR of adverse outcomes for ICU mortality, especially in patients without RRT, with reintubation within 72 hours, and with vasopressor requirements, these effects were not statistically significant for the NO subgroup (Table 4). These results might be explained by intraoperative fluid accumulation that resulted in higher ICU admission BW than dry weight in comparison with the NO subgroup. Therefore, this cutoff value should be considered with great caution especially in the postoperative patients.
Regarding the type of fluid administered, Zarychanski et al performed meta-analysis to demonstrate the association of hydroxyethyl starch (HES) administration with significantly increased mortality and AKI in critically ill patients requiring volume resuscitation.14 In our study, HES was administered in 68% of the patients. However, the average HES intake per day was not significantly different between the Max%ΔBW groups. The amounts of other colloid and blood components per day were also not significant in our results. Therefore, fluid accumulation from the crystalloid solution was the main type of fluid in our study. Regarding RRT, interestingly, ICU mortality was observed to have significantly increased only in the group of patients without RRT. Therefore, RRT was an important effect modifier in patients who had amounts of fluid accumulation of more than 5% from ICU admission (as measured by BW) in our study. Among critically ill patients, many reports suggest an association between high fluid accumulation and increased ICU adverse outcomes in patients with or without AKI.1,6,15,16 According to this evidence, fluid accumulation, measured by increased weight gain or fluid balance, should be considered before further fluid administration, to prevent fluid overload, which results in worsened outcomes.17 In patients who develop AKI or oliguria with higher fluid accumulation, nephrology consultation and RRT should be initiated early with the aim of decreased morbidity, mortality, and fluid overload.18–21 In this study, although the RRT requirement was significant in the overall multiple regression analysis, subgroup analysis revealed the tendency of statistically significant increase only in the NO subgroup. This might be explained by the higher admission APACHE II score and smaller sample in the subgroup analysis.
Regarding respiratory complications, higher fluid accumulation, of more than 5% of the ICU admission weight, was an independent risk factor of reintubation within 72 hours after extubation. Although there has been no report of such association in previous studies,22,23 the impact of reintubation does increase the risk of nosocomial pneumonia and longer hospital stays.24,25 In addition, fluid overload has been reported as a cause of respiratory failure and increase in lung injury score in previous studies.26,27 Fluid restriction has been found to improve lung function and decrease the number of mechanical ventilation days in acute lung injury.4 Although there were a slightly higher number of acute respiratory failure occurrences in the higher-fluid-accumulation group (Table 3), there was no statistically significant difference between the groups that had less than 5% of fluid accumulation. These might have resulted from a lower cutoff value or existing patient diseases that had a greater impact than fluid accumulation. In addition, we did not record the lung injury score in this study, which might present more details, and might be a more sensitive indicator of alteration of gas exchange physiology and a surrogate for outcomes of acute respiratory failure.27
Regarding neurological complications, delirium had an independent association with higher fluid accumulation as observed in this study. Although many potential risk factors for delirium have been reported, such as age, severity of diseases, use of mechanical ventilation, etc,28 there was lack of evidence to demonstrate the association between fluid accumulation and delirium. The possible explanation would be that a greater inflammatory response induced acute cognitive dysfunction in critically ill patient.29 Repeated reports have described the mechanism between fluid accumulation and inflammatory response in acute illnesses.30,31 These inflammatory responses cause acute cognitive dysfunction and delirium. Recently, some inflammatory biomarkers, such as soluble tumor necrosis factor receptor, interleukin–1 beta, adiponectin, and C-reactive protein, were shown to have strong association with delirium.32,33 In the subgroup analysis for surgical status, higher Max%ΔBW was found to be significantly associated with delirium only in the NO subgroup (Table 4). This might be explained by the higher admission APACHE II score and the ICU length of stay of these patients.
The strength of this study is the demonstration that the fluid accumulation threshold is based on the individual patient’s body size instead of being a fixed amount of fluid.7,27 This study also verified the lower cutoff threshold, as compared with previous studies, that impacts surgical ICU outcomes.6,12 However, our study had some limitations. First, the reference point for the baseline BW was measured at ICU admission, which did not reflect fluid received prior to ICU admission. This value might have been higher than the patient dry weight that was used as the reference baseline BW in the previous reports.6,12 This might be the explanation for lower cutoff for acute BW change compared with the previous studies. In addition, this study did not include morbidly obese patients. The study results should not be generally applied to these patients. Second, the severity of disease in the various groups was significantly different from each other. It is unclear whether the fluid accumulation threshold association was the cause of the adverse outcomes or the severity marker. Although we attempted to adjust outcome values for these possible confounders in the multivariable regression analysis, the possible confounders, such as severity of inflammatory biomarkers, were not collected for confirmation in this study.5,32,33 Third, we did not control for types of fluid administered during study. Thus, while statistical significance was greater for total crystalloid intake and total intake accumulation in the groups with Max%ΔBW more than 5%, and while there was no difference in the average amount per day of other fluid types, where received, we cannot associate the type of fluid as having a causal effect or a mediating effect on the adverse outcomes. Finally, this was a single-center study in a limited-resource country, which might have produced different results in terms of the provided resources, initiation of RRT criteria, type of fluid resuscitation, and resuscitation protocol. Although this threshold value might be different in other settings, this value might remind physicians and health care providers to consider other treatment modalities instead of fluid administration in critically ill surgical patients. Further, pragmatic randomized, controlled studies using this threshold criterion to integrate fluid administration strategies are necessary to support these findings.
Conclusion
The threshold of fluid accumulation of more than 5% of the ICU admission BW was associated with the adverse outcome of higher ICU mortality, especially in patients without RRT, with reintubation within 72 hours, with vasopressor requirement, with RRT requirement, and with delirium occurrence. Some of these effects were higher in postoperative patients. This threshold value might be an indicator for caution during fluid management in the surgical ICU.
Acknowledgments
This study was funded by the Young Investigator Award Project from Chiang Mai University. The authors thank all the surgical ICU nurses and research assistants involved in this study.
Author contributions
K Chittawatanarat drafted the manuscript, participated in the study design, data collection, and performed the statistical analysis. N Chotirosniramit, K Chandacham, and T Jirapongchareonlap participated in coordination of the data collection. T Pichaiya serviced the BW equipment. All authors contributed toward data analysis, drafting and revising the paper and agree to be accountable for all aspects of the work.
Disclosure
The authors report no conflicts of interest in this work.
References
Brandstrup B, Tønnesen H, Beier-Holgersen R, et al; Danish Study Group on Perioperative Fluid Therapy. Effects of intravenous fluid restriction on postoperative complications: comparison of two perioperative fluid regimens: a randomized assessor-blinded multicenter trial. Ann Surg. 2003;238(5):641–648. | ||
Gao T, Li N, Zhang JJ, et al. Restricted intravenous fluid regimen reduces the rate of postoperative complications and alters immunological activity of elderly patients operated for abdominal cancer: a randomized prospective clinical trial. World J Surg. 2012;36(5):993–1002. | ||
Boland MR, Noorani A, Varty K, Coffey JC, Agha R, Walsh SR. Perioperative fluid restriction in major abdominal surgery: systematic review and meta-analysis of randomized, clinical trials. World J Surg. 2013;37(6):1193–1202. | ||
Wiedemann HP, Wheeler AP, Bernard GR, et al; National Heart, Lung, and Blood Institute Acute Respiratory Distress Syndrome (ARDS) Clinical Trials Network. Comparison of two fluid-management strategies in acute lung injury. N Engl J Med. 2006;354(24):2564–2575. | ||
Enger TB, Pleym H, Stenseth R, Wahba A, Videm V. Genetic and clinical risk factors for fluid overload following open-heart surgery. Acta Anaesthesiol Scand. 2014;58(5):539–548. | ||
Lowell JA, Schifferdecker C, Driscoll DF, Benotti PN, Bistrian BR. Postoperative fluid overload: not a benign problem. Crit Care Med. 1990;18(7):728–733. | ||
Pipanmekaporn T, Punjasawadwong Y, Charuluxananan S, Lapisatepun W, Bunburaphong P, Saeteng S. Association of positive fluid balance and cardiovascular complications after thoracotomy for noncancer lesions. Risk Manag Healthc Policy. 2014;7:121–129. | ||
Chittawatanarat K, Chaiwat O, Morakul S, et al. A multi-center Thai university-based surgical intensive care units study (THAI-SICU study): methodology and ICU characteristics. J Med Assoc Thai. 2014;97 Suppl 1:S45–S54. | ||
Artigas A, Bernard GR, Carlet J, et al. The American-European Consensus Conference on ARDS, part 2. Ventilatory, pharmacologic, supportive therapy, study design strategies and issues related to recovery and remodeling. Intensive Care Med. 1998;24(4):378–398. | ||
Levy MM, Fink MP, Marshall JC, et al; SCCM/ESICM/ACCP/ATS/SIS. 2001 SCCM/ESICM/ACCP/ATS/SIS International Sepsis Definitions Conference. Crit Care Med. 2003;31(4):1250–1256. | ||
Schisterman EF, Perkins NJ, Liu A, Bondell H. Optimal cut-point and its corresponding Youden Index to discriminate individuals using pooled blood samples. Epidemiology. 2005;16(1):73–81. | ||
Bouchard J, Soroko SB, Chertow GM, et al; Program to Improve Care in Acute Renal Disease (PICARD) Study Group. Fluid accumulation, survival and recovery of kidney function in critically ill patients with acute kidney injury. Kidney Int. 2009;76(4):422–427. | ||
Lobo DN. Fluid overload and surgical outcome: another piece in the jigsaw. Ann Surg. 2009;249(2):186–188. | ||
Zarychanski R, Abou-Setta AM, Turgeon AF, et al. Association of hydroxyethyl starch administration with mortality and acute kidney injury in critically ill patients requiring volume resuscitation: a systematic review and meta-analysis. JAMA. 2013;309(7):678–688. | ||
Payen D, de Pont AC, Sakr Y, Spies C, Reinhart K, Vincent JL; Sepsis Occurrence in Acutely Ill Patients (SOAP) Investigators. A positive fluid balance is associated with a worse outcome in patients with acute renal failure. Crit Care. 2008;12(3):R74. | ||
Horiguchi Y, Uchiyama A, Iguchi N, et al. Perioperative fluid balance affects staging of acute kidney injury in postsurgical patients: a retrospective case-control study. J Intensive Care. 2014;2(1):26. | ||
Murugan R, Kellum JA. Fluid balance and outcome in acute kidney injury: is fluid really the best medicine? Crit Care Med. 2012;40(6):1970–1972. | ||
Mehta RL, McDonald B, Gabbai F, et al. Nephrology consultation in acute renal failure: does timing matter? Am J Med. 2002;113(6):456–461. | ||
Rimmele T, Kellum JA. Oliguria and fluid overload. Contrib Nephrol. 2010;164:39–45. | ||
Yerram P, Karuparthi PR, Misra M. Fluid overload and acute kidney injury. Hemodial Int. 2010;14(4):348–354. | ||
Cerda J, Sheinfeld G, Ronco C. Fluid overload in critically ill patients with acute kidney injury. Blood Purif. 2010;29(4):331–338. | ||
Dupont H, Le Port Y, Paugam-Burtz C, Mantz J, Desmonts M. Reintubation after planned extubation in surgical ICU patients: a case-control study. Intensive Care Med. 2001;27(12):1875–1880. | ||
Miu T, Joffe AM, Yanez ND, et al. Predictors of reintubation in critically ill patients. Respir Care. 2014;59(2):178–185. | ||
de Lassence A, Alberti C, Azoulay E, et al; OUTCOMEREA Study Group. Impact of unplanned extubation and reintubation after weaning on nosocomial pneumonia risk in the intensive care unit: a prospective multicenter study. Anesthesiology. 2002;97(1):148–156. | ||
Beckmann U, Gillies DM. Factors associated with reintubation in intensive care: an analysis of causes and outcomes. Chest. 2001;120(2):538–542. | ||
Bendixen HH. Fluid overload as a cause of respiratory failure. Acta Anaesthesiol Belg. 1975;23 Suppl:S105–S108. | ||
de Almeida JP, Palomba H, Galas FR, et al. Positive fluid balance is associated with reduced survival in critically ill patients with cancer. Acta Anaesthesiol Scand. 2012;56(6):712–717. | ||
Huai J, Ye X. A meta-analysis of critically ill patients reveals several potential risk factors for delirium. Gen Hosp Psychiatry. 2014;36(5):488–496. | ||
Pandharipande P, Jackson J, Ely EW. Delirium: acute cognitive dysfunction in the critically ill. Curr Opin Crit Care. 2005;11(4):360–368. | ||
Wiig H. Pathophysiology of tissue fluid accumulation in inflammation. J Physiol. 2011;589(Pt 12):2945–2953. | ||
Reyes-Bahamonde J, Raimann JG, Thijssen S, Levin NW, Kotanko P. Fluid overload and inflammation – a vicious cycle. Semin Dial. 2013;26(1):31–35. | ||
Ritter C, Tomasi CD, Dal-Pizzol F, et al. Inflammation biomarkers and delirium in critically ill patients. Crit Care. 2014;18(3):R106. | ||
Zhang Z, Pan L, Deng H, Ni H, Xu X. Prediction of delirium in critically ill patients with elevated C-reactive protein. J Crit Care. 2014;29(1):88–92. |
 © 2015 The Author(s). This work is published and licensed by Dove Medical Press Limited. The full terms of this license are available at https://www.dovepress.com/terms.php and incorporate the Creative Commons Attribution - Non Commercial (unported, v3.0) License.
By accessing the work you hereby accept the Terms. Non-commercial uses of the work are permitted without any further permission from Dove Medical Press Limited, provided the work is properly attributed. For permission for commercial use of this work, please see paragraphs 4.2 and 5 of our Terms.
© 2015 The Author(s). This work is published and licensed by Dove Medical Press Limited. The full terms of this license are available at https://www.dovepress.com/terms.php and incorporate the Creative Commons Attribution - Non Commercial (unported, v3.0) License.
By accessing the work you hereby accept the Terms. Non-commercial uses of the work are permitted without any further permission from Dove Medical Press Limited, provided the work is properly attributed. For permission for commercial use of this work, please see paragraphs 4.2 and 5 of our Terms.