")
Back to Journals » Nature and Science of Sleep » Volume 13
Firefighters Have Cerebral Blood Flow Reductions in the Orbitofrontal and Insular Cortices That are Associated with Poor Sleep Quality
Authors Park S, Hong H, Kim RY, Ma J, Lee S, Ha E, Yoon S, Kim J
Received 25 March 2021
Accepted for publication 20 August 2021
Published 10 September 2021 Volume 2021:13 Pages 1507—1517
DOI https://doi.org/10.2147/NSS.S312671
Checked for plagiarism Yes
Review by Single anonymous peer review
Peer reviewer comments 3
Editor who approved publication: Professor Ahmed BaHammam
Shinwon Park,1,* Haejin Hong,1,2,* Rye Young Kim,1,3,* Jiyoung Ma,1 Suji Lee,1 Eunji Ha,1,2 Sujung Yoon,1,2 Jungyoon Kim1,2
1Ewha Brain Institute, Ewha Womans University, Seoul, South Korea; 2Department of Brain and Cognitive Sciences, Ewha Womans University, Seoul, South Korea; 3Graduate School of Pharmaceutical Sciences, Ewha Womans University, Seoul, South Korea
*These authors contributed equally to this work
Correspondence: Sujung Yoon Email [email protected]
Jungyoon Kim Email [email protected]
Purpose: To investigate the cerebral blood flow (CBF) alterations associated with poor sleep quality and memory performance in firefighters.
Participants and Methods: Thirty-seven firefighters (the FF group) and 37 non-firefighter controls (the control group) with sleep complaints were enrolled in this study. We performed brain arterial spin labeling perfusion magnetic resonance imaging (MRI) and compared the CBF between the two groups using whole-brain voxel-wise analyses. Self-reported sleep problems and actigraphy-measured sleep parameters, including the sleep efficiency, wake after sleep onset (WASO), total sleep time, and sleep latency, were assessed. Spatial working memory and learning performances were evaluated on the day of the MRI scan.
Results: The FF group, relative to the control group, had lower CBF in the right hemispheric regions: Middle temporal/lateral occipital, orbitofrontal, and insular cortices. Lower CBF in the right orbitofrontal cortex was linearly associated with poor sleep quality, as indicated by lower sleep efficiency and longer WASO. The CBF of the right insular cortex was also associated with longer WASO. Despite comparable degrees of self-reported sleep problems between the two groups, the FF group had lower sleep efficiency and longer WASO in the actigraphy, and lower spatial working memory and learning performance, relative to the control group. Poor sleep efficiency was linearly associated with lower spatial working memory performance.
Conclusion: These results demonstrated an association of poor sleep quality with decreased brain perfusion in the right orbitofrontal and insular cortices, as well as with reduced working memory performance.
Keywords: firefighters, sleep efficiency, wake after sleep onset, cerebral blood flow, arterial spin labeling, perfusion magnetic resonance imaging
Introduction
The firefighter is one of the representative professionals who have shift works and repetitive stress, which may increase sleep problems. Prevalence of insomnia symptoms has consistently been reported as approximately 50% among firefighters.1,2 Considering the impacts of sleep problems on cognitive dysfunctions, which can be directly associated with higher risks of workplace injuries and poor health outcomes, sleep problems and related brain alterations in firefighters need special attention.
In addition to the brain dysfunction caused by sleep problems, firefighters may have more prominent brain changes due to potential exposures to heat or toxins, relative to non-firefighters with similar degrees of sleep problems. Specifically, cerebral blood flow (CBF) has been reported to decrease in response to heat stress along with subsequent cognitive decline,3,4 or with emotional distress.5 With this regard, we focused on the CBF changes in the firefighters compared to the non-firefighter controls with similar degrees of sleep problems.
Since the cerebral perfusion is tightly regulated by homeostasis, altered CBF may be a robust neural correlate of brain dysfunctions secondary to sleep problems. Previous studies suggested that CBF could change dynamically with obstructive sleep apnea6,7 or sleep-deprived conditions.8,9 These alterations might be due to the fact that the brain has high energy and oxygen demand, making it vulnerable to sleep-deprived conditions. However, the specific brain regions that have prominent CBF alterations, as well as their association with sleep parameters, need further clarification.
We implemented arterial spin labeling (ASL) magnetic resonance imaging (MRI) of the brain to assess the CBF in relation to sleep problems. It is a non-invasive perfusion MRI technique that can quantify the perfusion of the grey matter in physiological units (mL/100 g tissue/min).10 Therefore, ASL has the advantage of higher precision over blood oxygen level-dependent functional MRI, which was used in a majority of the studies on the CBF.
In the current study, we hypothesized that the CBF might be altered in the firefighters relative to the non-firefighter controls, even with similar degrees of sleep problems. We implemented ASL to measure perfusion of the grey matter in the firefighters and non-firefighter controls with sleep complaints. In addition, we also investigated whether more severe sleep problems were associated with lower CBF and cognitive performance.
Participants and Methods
Participants
We recruited 37 firefighters (the FF group) and 37 non-firefighter controls (the control group) with sleep complaints that lasted for at least one month, but without a diagnosis of insomnia. While firefighters were recruited through advertisements in the local fire stations of the Seoul metropolitan area, non-firefighter controls were recruited through community advertisements, along with snowball sampling. Sleep complaints were defined as difficulties in onset or maintenance of sleep, waking up too early in the morning, or waking up feeling exhausted in the morning. Exclusion criteria were as follows: (1) current or a history of primary sleep disorders assessed by the Diagnostic and Statistical Manual of Mental Disorders, fourth edition (DSM-IV); (2) presence of significant medical, neurological, or psychiatric conditions; (3) current use of medications or oral supplements to relief sleep problems; or (4) contraindications to MRI.
Study Procedures
Participants were asked to wear wrist actigraphy (Actigraph GT3X+, Actigraph®, Pensacola, FL, USA) for 7 consecutive days before the brain MRI scan. Height, body weight, and waist circumference were measured on the day of brain MRI scan. Self-report questionnaires were also administered on the same day. The study protocol was approved by the Institutional Review Board of Ewha Womans University and conducted in accordance with the Declaration of Helsinki, national and institutional guidelines. All participants provided written informed consent prior to the participation.
Self-Report Questionnaires on Sleep Problems
Subjective sleep quality was evaluated with the Pittsburgh Sleep Quality Index (PSQI).11 PSQI consists of 19 items to generate 7 component scores: Self-reported sleep quality, sleep latency, sleep duration, habitual sleep efficiency, sleep disturbances, use of sleeping medication, and daytime dysfunction. Each of the component scores has a range of 0 to 3 points. The sum of 7 component scores yields a global score with a range of 0 to 21 points. A global score greater than 5 indicates poor sleep quality, which was validated as a cutoff value for identifying individuals with insomnia.12
The Athens Insomnia Scale (AIS) was used to assess sleep problems over the previous month.13 The AIS consists of 8 items on the following sleep problems: Awakening during the night, sleep induction, sleep duration, overall quality of sleep, early morning awakening, subjective well-being, functioning capacity, and sleepiness during the day. Each item of the AIS is rated on a scale of 0–3 with a maximum score of 24, with higher scores indicating worse sleep. The AIS score of 6 or higher is considered as an optimum diagnostic cutoff score for insomnia.14
The level of fatigue was evaluated with the Fatigue Severity Scale (FSS).15 This questionnaire includes nine items inquiring about the severity of fatigue and its effects on daily functioning during the past week. Each item of the FSS is rated from 1 to 7, and the final score is the mean of all 9 items.
Daytime sleepiness was measured using the Epworth Sleepiness Scale (ESS).16 The ESS consists of eight questions that depict different activities to which participants respond their likeliness of dozing off or falling asleep during the activity on a four-point Likert scale. The ESS also evaluate the degree of “somnificity”, defined as the activity’s capacity to facilitate sleep onset.17 The sum of all responses to the eight questions ranges from 0 to 24, and a higher score indicates more significant daytime sleepiness. Typically, total scores above 10 are considered excessive daytime sleepiness.
The Karolinska Sleepiness Scale (KSS) was used to evaluate the participant’s subjective sleepiness.18 The KSS is a single-item measure on a 9-point scale, where 1 indicates extremely alert, and 9 represents extremely sleepy.
Actigraphy-Measured Sleep Parameters
Actigraphy-measured sleep parameters were sleep efficiency, wake time after sleep onset (WASO), total sleep time, and sleep latency. Sleep efficiency indicates the ratio of total sleep time (or the total amount of time spent asleep) compared to the total amount of time spent in bed. WASO is an indicator of sleep fragmentation since it is defined as the amount of time spent awake after sleep onset. Total sleep time is the sum of actual sleep time. Sleep latency is the duration of time from lying down in bed to the sleep onset. Actigraphy data were processed using the Actilife 6-software (Version 6.13.1, ActiGraph).
Cognitive Function Tests
Cognitive functions were tested using the Korean version of Cambridge Neuropsychological Test Automated Battery (CANTAB), which is a touch screen-based computerized cognitive test battery (https://www.cambridgecognition.com/cantab/). Visual memory and learning performances were measured using the Paired Associates Learning (PAL) task while working memory and executive function were evaluated using the Spatial Working Memory (SWM) task.
In the PAL task, six boxes were displayed on the touch screen. A certain number of the figures were presented one by one in each box. When all the figures were presented and boxes were closed, one figure then appeared in the center of the screen. The participant was asked to remember and choose the box that had the figure shown in the center of the screen. If the participant chose the correct box, the task moved to the next stage. With increasing stages, the number of figures displayed increased from 1, 2, 3, 6, to 8 figures. If the participant chose an incorrect box, all figures were displayed again up to 9 times. The memory score was calculated as the number of correct answers at the first attempt. The number of errors adjusted for the number of trials was also calculated in the CANTAB software.
In the SWM task, the participant was asked to search for the hidden “tokens” among the array of the boxes. The strategy score of SWM was calculated as the number of times the participant began a new search from the same box that he/she tried previously. A lower strategy score indicated higher strategy use, as starting a new search from the same box was considered as a planned strategy to find the token. The score was reversed so that the higher strategy scores indicated better performance of the SWM task. The number of times a participant incorrectly revisited a box, in which a token had previously been found, was also calculated as the number of total errors.
Brain Perfusion Magnetic Resonance Imaging
MRI Data Acquisition
All MRI data were acquired using a Philips 3.0 Tesla Achieva magnetic resonance scanner (Philips Medical System, Netherlands) equipped with a 32-channel head coil. High-resolution structural images were acquired using a three-dimensional T1-weighted magnetization-prepared rapid gradient-echo imaging (MPRAGE) sequence with the following acquisition parameters: Repetition time (TR) = 7.4 ms; echo time (TE) = 3.4 ms; flip angle = 8º; field of view (FOV) = 220×220 mm2; voxel size = 1×1×1 mm3; 180 contiguous sagittal slices; scan time 4 min 31 s. Structural images were subsequently used for tissue segmentation and registration.
Perfusion MRI was performed using a pCASL single-shot echo-planar imaging sequence with the following acquisition parameters: TR = 4000 ms; TE = 11 ms; flip angle = 90°; FOV = 220×220 mm2; voxel size = 2.75×2.75 mm2; 18 slices in ascending order (thickness/gap = 6 mm/0 mm); post labeling delay = 1600 ms; 40 control-label pairs; scan time 5 min 27 s. The labeling plane was positioned 85 mm inferior to the center of the acquisition volume perpendicular to the internal carotid arteries. An echo-planar imaging proton density (M0) image without labeling or background suppression was acquired as a reference calibration image to estimate the equilibrium magnetization of arterial blood (TR = 6000 ms; scan time 54 s).
Data Processing and Analyses
Preprocessing of T1 and pCASL images were performed using the FMRIB Software Library tools (FSL, http://www.fmrib.ox.ac.uk/fsl). T1-weighted images were preprocessed using the command fsl_anat (https://fsl.fmrib.ox.ac.uk/fsl/fslwiki/fsl_anat) that includes reorientation, registration to standard space, bias-field correction, brain extraction, and segmentation into the grey matter, white matter, and cerebrospinal fluids.
The preprocessing of pCASL images and quantification of cerebral perfusion were performed by mainly utilizing the Bayesian Inference for Arterial Spin Labeling (BASIL) toolbox implemented in FSL (http://fsl.fmrib.ox.ac.uk/fsl/fslwiki/BASIL).19,20 First, the control and label images were motion-corrected via a rigid body algorithm using the FSL’s mcflirt.21 The equilibrium magnetization image (M0) images were skull-stripped to generated binary brain masks using FSL’s bet.22 Next, using the asl_file command of FSL’s BASIL toolbox, the mean perfusion-weighted images (relative CBF) were yielded via pairwise subtraction of control and label images, followed by an averaging of the difference images.19 Relative CBF was quantified into absolute CBF in the units of mL/100 g tissue/min using the oxford_asl command of FSL’s BASIL toolbox, which includes kinetic-model inversion, absolute quantification of perfusion using the M0 calibration image, and registration of perfusion maps into the structural and standard space.23,24 The inputs in this process were: T1 values = 1.3 for tissue and 1.65 for blood, inflow time = 3.25, labeling efficiency = 0.85, spatial priors. Segmented T1 images were used for registration, while the brain-extracted M0 images were utilized as a reference.
Individual perfusion-calibrated CBF maps were co-registered to the individual’s structural space using affine registration. The T1-weighted images were nonlinearly registered to the T1 template into the Montreal Neurological Institute (MNI) standard space with a resolution of 2×2×2 mm3. The perfusion-weighted images were then warped into the MNI space using the inverse transformation matrix of the above-mentioned nonlinear registration. They were merged into a 4D image (using FSL’s fslmerge) and smoothed with a 6.9 mm full-width-at-half-maximum Gaussian kernel (using FSL’s fslmaths) prior to statistical analysis. Binary grey matter masks for statistical analyses were generated using a threshold of 0.4 for tissue probability maps. We excluded the cerebellum from the mask using a neuroanatomically segmented atlas (FSL MNI atlas). We also adjusted the superior parts of the mask considering the limited brain coverage of the ASL images.
Statistical Analyses
Demographic characteristics and scores in self-report questionnaires were compared between the two groups using independent t-tests for continuous variables and chi-square tests for categorical variables. Voxel-wise differences in CBF within the whole-brain grey matter mask were assessed using FSL’s randomise (http://fsl.fmrib.ox.ac.uk/fsl/randomise), a nonparametric, permutation-based analysis tool. Demeaned age and mean global CBF of the grey matter were included as covariates in the model. Mean global CBF values were extracted using a grey matter mask thresholded at 0.7 for tissue probability maps that were derived from the partial volume estimates by fsl_anat. In the whole-brain voxel-wise analyses using FSL’s randomise, a threshold-free cluster-enhancement correction was applied with 5000 permutations. The clusters with a significance level of p < 0.005 with more than 100 contiguous voxels were considered as significant for multiple comparisons, unless the clusters survived the family-wise error (FWE) correction at the level of p < 0.05.
The association between the CBF of the significant clusters and sleep parameters were assessed using the multivariate regression models that included the following variables: The CBF of each cluster as a dependent variable; each sleep measure as an independent variable; age, sex, and mean global CBF of the grey matter as covariates. Sleep measures included sleep efficiency, WASO, total sleep time, and sleep latency. Since it has been alleged that overweight/obesity affects sleep problems, sensitivity analyses were also conducted using the multivariate regression models that included the body mass index (BMI) or waist circumference as covariates.
To identify the cognitive dysfunction related to poor sleep quality, the multivariate regression models were constructed including the following variables: Each cognitive test score as a dependent variable; each sleep parameter as an independent variable; age, sex, and educational level as covariates. The education level was stratified into 2 categories: Higher (college graduates or higher) or lower education levels.
The associations were tested using STATA software package, version 13.0 (StataCorp, College Station, TX, USA). A significance value was set as p < 0.013 considering the multiple comparisons of 4 sleep parameters, which were sleep efficiency, WASO, total sleep time, and sleep latency.
Results
Demographic Characteristics and Sleep Parameters
Thirty-seven firefighters and non-firefighter controls did not differ in age (t = −1.94, p = 0.06), proportion of sex (Χ2 = 0.21, p = 0.64), BMI (t = −1.26, p = 0.21), and waist circumference (t = −0.22, p = 0.82) (Table 1).
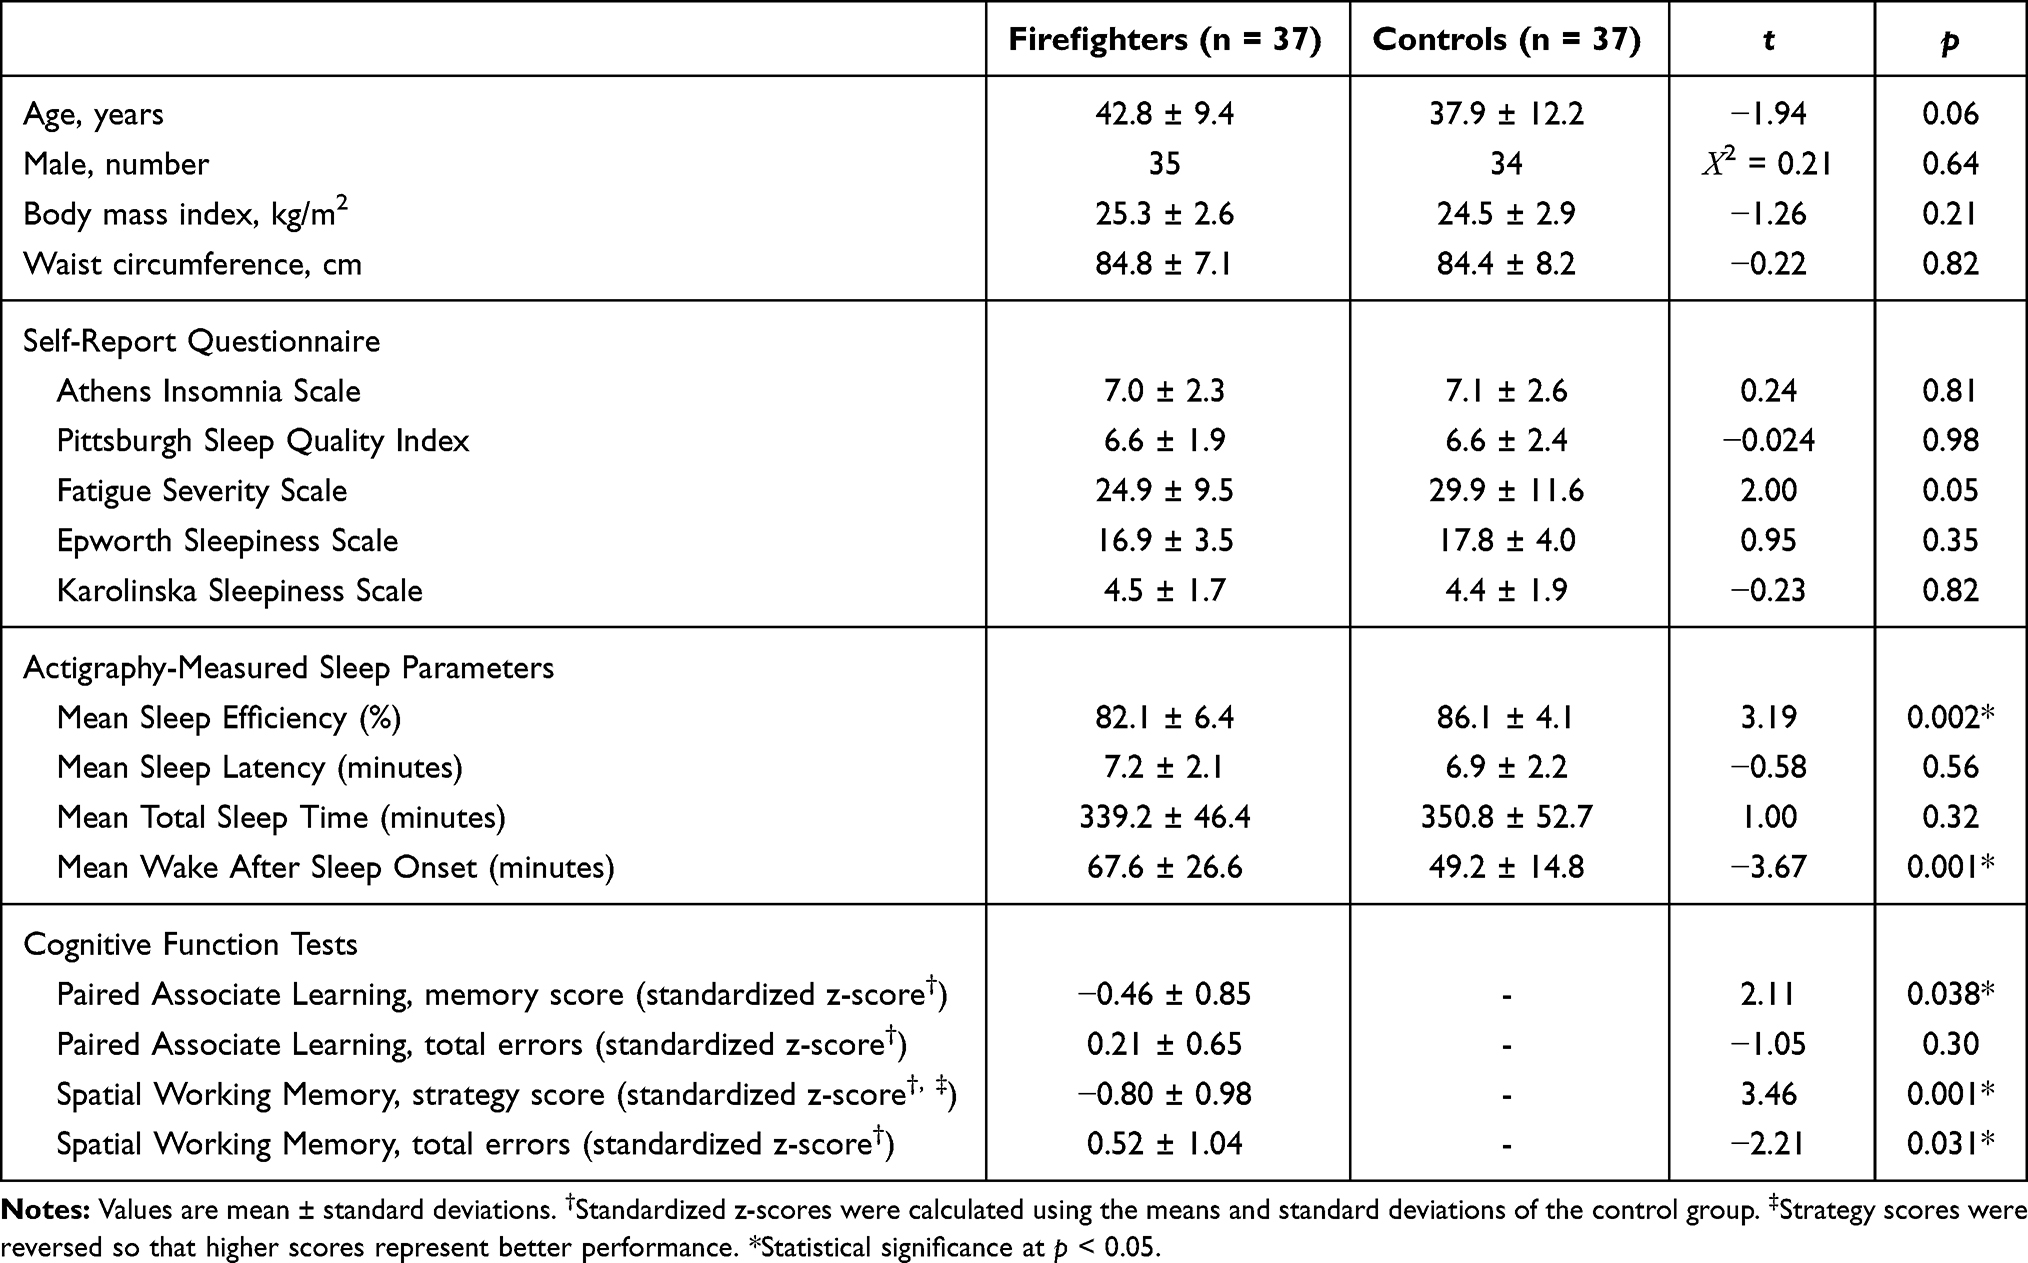 |
Table 1 Demographic Characteristics, Sleep Parameters, and Cognitive Function Test Results of the Participants |
Scores of self-report questionnaires did not significantly differ between the two groups regarding the overall severity of insomnia symptoms (Table 1). The AIS and PSQI scores in both groups implied that participants of the current study had mild to moderate degrees of insomnia symptoms, as the mean AIS and PSQI scores were similar to the cutoff values for the screening of insomnia.12,14 A marginal difference was found in the scores of FSS, in which the control group tends to report higher degrees of fatigue relative to the FF group (t = 2.00, p = 0.049).
In actigraphy-measured sleep parameters, the FF group had lower mean sleep efficiency (t = 3.19, p = 0.002) and longer mean WASO (t = −3.67, p = 0.001) relative to the control group, indicating poor sleep quality in the FF group (Table 1). The mean sleep latency and total sleep time did not differ between the two groups (Table 1).
Differences in the Cerebral Blood Flow Between Firefighters and Controls
The FF group had lower CBF relative to the control group in 3 clusters located in the right cerebral hemisphere — middle temporal/lateral occipital, orbitofrontal, and insular cortices — after adjusting for age, sex, and the mean global CBF of the grey matter in each participant (uncorrected p < 0.005, contiguous voxels > 100) (Table 2 and Figure 1). These clusters did not survive the FWE correction at p < 0.05.
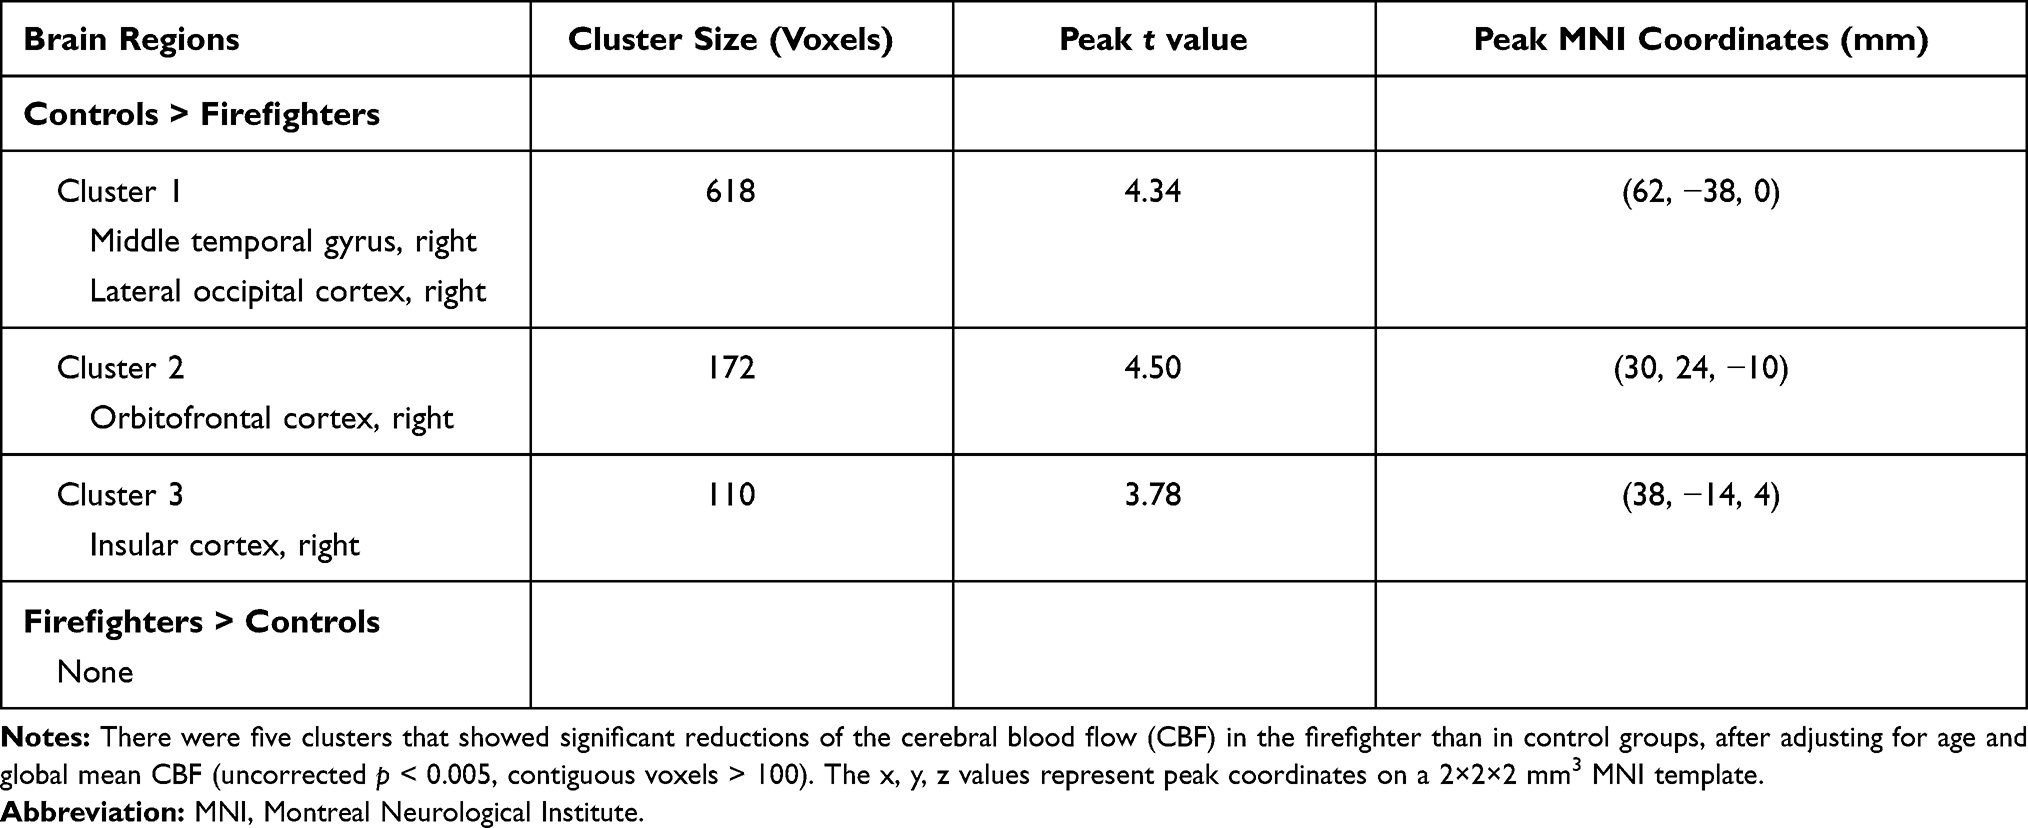 |
Table 2 Brain Regions That Showed Significant Group Differences in Cerebral Blood Flow |
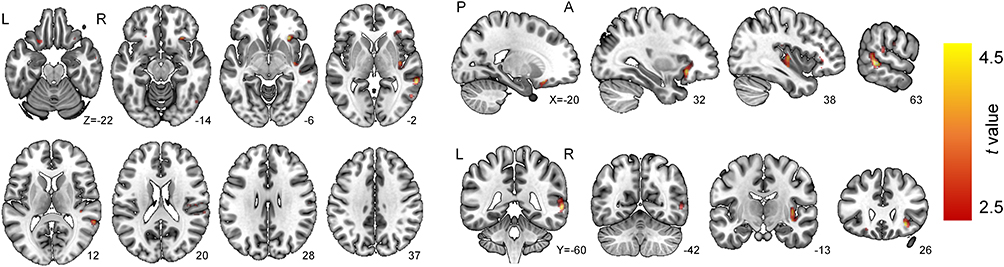 |
Figure 1 Brain regions that showed lower absolute cerebral blood flow in the FF group than in the control group are displayed in the axial, sagittal and coronal sections. Whole brain voxel-wise analyses were performed after adjusting for age and global mean cerebral blood flow of the grey matter. The color bar represents voxel-level t values. The numbers below the brain slices indicate z, x, y coordinates in the Montreal Neurological Institute space. Abbreviations: L, Left; R, Right; A, Anterior; P, Posterior. |
The mean global CBF of the grey matter did not differ between the FF and control groups (49.9 ± 7.0 mL/100 g/min in the FF group and 49.7 ± 7.5 mL/100 g/min in the control group; t = −0.16, p = 0.87).
Relationship Between Cerebral Blood Flow and Sleep Parameters
Reduced CBF was associated with lower mean sleep efficiency, as measured by averaging the actigraphy recordings of 7 days, in the right orbitofrontal (cluster 2: β = 0.21, p = 0.002) cortex (Figure 2). In addition, reduced CBF of the right orbitofrontal (cluster 2: β = −0.22, p = 0.001) and insular (cluster 3: β = −0.18, p = 0.012) cortices were also negatively associated to the longer mean WASO for 7 days (Figure 2).
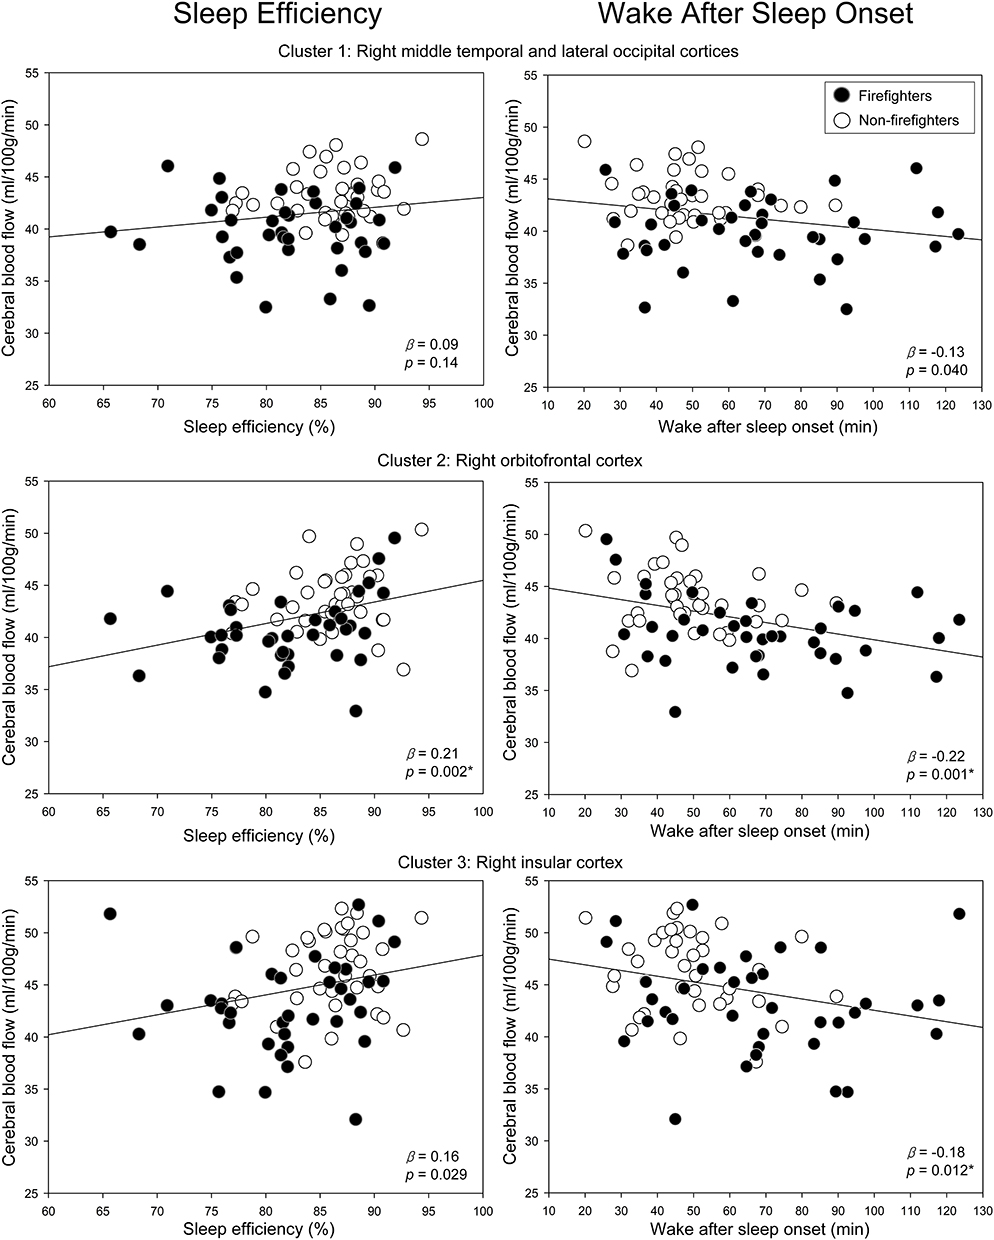 |
Figure 2 Relationship between sleep efficiency (left panels), wake after sleep onset (WASO) (right panels) and cerebral blood flow (CBF) of the significant three clusters. Mean sleep efficiency for 7 days, as measured by wrist-worn actigraphy, has a positive linear association with the CBF of the cluster 2 that is located in the right orbitofrontal cortex (β = 0.21, p = 0.002). Mean WASO for 7 days, also measured by wrist-worn actigraphy, has a negative linear association with the CBF of the clusters 2 (β = −0.22, p = 0.001) and 3 (β = −0.18, p = 0.012), which are located in the right orbitofrontal and insular cortices, respectively. A regression line and beta coefficients are from the multivariate regression model including the following variables: the CBF values extracted from each cluster as the dependent variables; sleep efficiency or WASO as an independent variable; age, sex, and mean global CBF as covariates. The CBF of each cluster is displayed in the values adjusted for age, sex, and mean global CBF. *p < 0.013. |
The CBF of each cluster was not significantly associated with the mean total sleep time or sleep latency. Adding the BMI or waist circumference to the regression models did not change the significant associations between the CBF reduction and sleep efficiency or WASO (Supplementary Table 1). However, no significant associations were found between the CBF and sleep parameters when tested in each FF or control group separately (Supplementary Figures 1 and 2).
The scores of self-report questionnaires AIS, PSQI, FSS, ESS, and KSS were not associated with the CBF of each cluster considering the multiple comparison correction (Supplementary Table 2).
Cognitive Performance in Relation to Sleep Parameters
The FF group showed a lower memory score of the PAL task (t = 2.11, p = 0.038) that evaluated visual memory and learning relative to the control group (Table 1). The number of total errors of the PAL task did not differ between the two groups (t = −1.05, p = 0.030). Performance in the SWM task, which assessed spatial working memory and executive functions, was also lower in the FF group relative to the control group, showing poorer strategic search (t = 3.46, p = 0.001) and higher numbers of total errors (t = −2.21, p = 0.031) (Table 1).
Lower sleep efficiency (β = 0.28, p = 0.010) was linearly associated with a poor performance of the strategic search in the SWM task, when age, sex, and education level were included as covariates (Figure 3). No significant associations were detected between other sleep parameters and cognitive measures (Supplementary Figure 3).
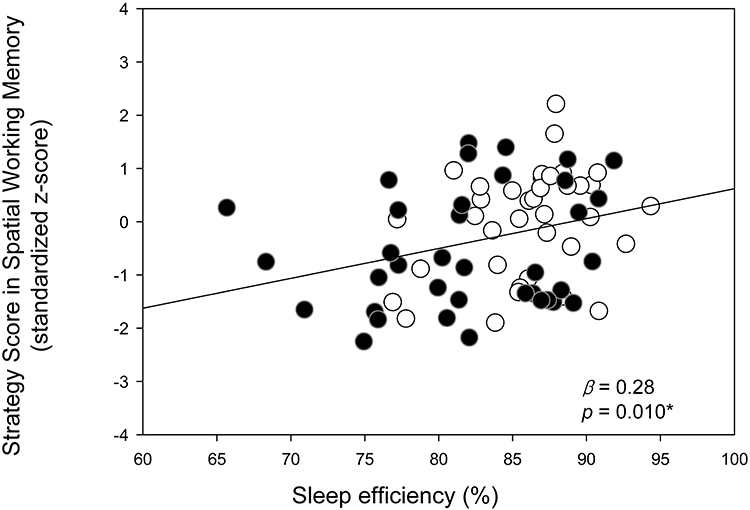 |
Figure 3 Relationship between the sleep efficiency and performance in the Spatial Working Memory (SWM) task of the CANTAB. Higher sleep efficiency showed a positive linear association with the higher strategy score of the SWM (β = 0.28, p = 0.010). A regression line and beta coefficients are from the regression model including the following variables: The strategy score of SWM as the dependent variable; sleep efficiency as an independent variable; age, sex, and education level as covariates. *p < 0.013. |
Discussion
The current study demonstrated that firefighters with sleep complaints had reduced CBF in the brain regions lateralized to the right hemisphere, relative to the non-firefighter controls with similar degrees of sleep complaints. Specifically, reduced CBF of the right orbitofrontal and insular cortices was linearly associated with poor sleep quality that is indicated by lower sleep efficiency and longer WASO. Poor sleep quality was also associated with lower spatial working memory performance.
A linear association between the CBF of the right orbitofrontal and insular cortices and sleep quality may imply that these brain regions, as a part of the limbic system,25 may be involved in the cognitive and emotional dysfunctions induced by sleep loss.26,27 The right insular cortex is also known to modulate the switching of brain activities between the on-task central executive and off-task default-mode networks,28 which are critically impaired with sleep loss.26 Therefore, reduced CBF of the right orbitofrontal and insular cortices in the current study may potentially be a neural correlate underlying the detrimental effects of poor sleep quality on the brain in firefighters, which manifests as low cognitive performance. It is also in line with the previous findings suggesting the potential vulnerability of the orbitofrontal and insular cortices to sleep loss.29,30 In addition, the current study may add new findings to the neural correlates of low sleep efficiency that have been reported in resting-state functional MRI of patients with depression.31,32
Notably, firefighters in the current study had more pronounced abnormalities in actigraphy-measured sleep parameters, relative to the non-firefighter controls, despite comparable degrees of insomnia symptoms in self-report questionnaires. These findings may propose the firefighters’ tendency to underreport sleep problems in self-report questionnaires, which is in concordance with the previous report in South Korean firefighters.33 It may be partly due to the cultural context that firefighters usually refrain from reporting physical or psychiatric problems, despite a high prevalence of disorders in this population.33 Given that sleep problems often impair psychomotor speed, attention, working memory, and executive performance34,35 that are essential in the tasks of firefighters, screening of sleep problems may need to be done by using more objective measures, such as actigraphy.
Although poor sleep quality was linearly associated with lower memory performance, suggesting the harmful effects of poor sleep quality on the brain, the CBF of the brain regions was not directly associated with memory performance. It may be due to the fact the CBF cannot entirely represent the functional activity of the corresponding brain regions. Future studies using multimodal brain imaging are warranted to further investigate the relationship between the CBF and cognitive functions related to sleep problems.
There are a few limitations that should be considered in interpreting the current study results. First of all, a causal relationship between the reduced CBF and sleep parameters cannot be established in this study as it was a cross-sectional design. However, previous studies on sleep deprivation have enlightened the potential effects of sleep loss on the CBF reductions in the specific brain regions that included the orbitofrontal and insular cortices.29,30 In addition, sleep problems and related CBF alterations in firefighters could be clarified in future studies with other occupational groups with and without sleep problems, as well as the firefighters without sleep problems. Effects of occupational factors, such as heat or toxin exposures, on the sleep quality and CBF in the firefighters also need to be studied with this regard. Moreover, the participants might have undiagnosed sleep disorders, such as mild to moderate degrees of obstructive sleep apnea, restless leg syndrome, or other conditions. Although we excluded individuals with a diagnosis of sleep disorders or medical, neurological, psychiatric disorders from the study participation, further studies implementing polysomnography are needed to uncover the impact of undiagnosed sleep disorders and their effects on the CBF. The current study results should be interpreted with caution since no clusters survived the FWE correction. Instead, an alternative criterion of the p < 0.005 with 100 contiguous voxels was applied. Therefore, there could have been an inflated false positive rate in this study. In addition, a relatively low resolution of the ASL might have impeded the exact quantification of CSF. Although the ASL has advantages in non-invasiveness and convenience, the gold standard for CSF measurement, which is the angiography-based method, might be needed to confirm the CSF changes in relation to sleep problems. Even though we have explored the BMI and waist circumference, studies with a larger sample size need to further clarify the associations between the CBF and metabolic factors, such as BMI, waist circumference, lipid profiles, or inflammation. Lastly, the association of the reduced CBF in specific brain regions with cognitive functions needs to be verified in future studies since the current study may not have a sample size large enough to show this association.
Conclusions
The current study results suggest that decreased perfusion in the right orbitofrontal and insular cortices may be a neural correlate of poor sleep quality in the firefighters. Furthermore, more objective measures of sleep may be required in evaluating sleep problems in the firefighters, considering the discrepancy between self-report questionnaires and actigraphy-measured sleep parameters.
Data Sharing Statement
The data underlying this manuscript will be shared on reasonable request to the corresponding authors.
Funding
This study was supported by the National Research Foundation of Korea (NRF-2020R1A6A1A03043528, NRF-2020M3E5D9080555, and 2020R1F1A1077421) and by the National Fire Agency (MPSS-Fire Fighting Safety-2016-86).
Disclosure
The authors report no financial/non-financial interests in this work.
References
1. Vargas de Barros V, Martins LF, Saitz R, Bastos RR, Ronzani TM. Mental health conditions, individual and job characteristics and sleep disturbances among firefighters. J Health Psychol. 2013;18(3):350–358. doi:10.1177/1359105312443402
2. Hom MA, Stanley IH, Rogers ML, Tzoneva M, Bernert RA, Joiner TE. The Association between Sleep Disturbances and Depression among Firefighters: emotion Dysregulation as an Explanatory Factor. J Clin Sleep Med. 2016;12(2):235–245. doi:10.5664/jcsm.5492
3. Nybo L, Nielsen B. Middle cerebral artery blood velocity is reduced with hyperthermia during prolonged exercise in humans. J Physiol. 2001;534(Pt 1):279–286. doi:10.1111/j.1469-7793.2001.t01-1-00279.x
4. Wilson TE, Cui J, Zhang R, Crandall CG. Heat stress reduces cerebral blood velocity and markedly impairs orthostatic tolerance in humans. Am J Physiol Regul Integr Comp Physiol. 2006;291(5):R1443–1448. doi:10.1152/ajpregu.00712.2005
5. Ma J, Hong G, Ha E, et al. Hippocampal cerebral blood flow increased following low-pressure hyperbaric oxygenation in firefighters with mild traumatic brain injury and emotional distress. Neurol Sci. Epub 2021 Feb 2. doi:10.1007/s10072-021-05094-5
6. Baril AA, Gagnon K, Arbour C, et al. Regional Cerebral Blood Flow during Wakeful Rest in Older Subjects with Mild to Severe Obstructive Sleep Apnea. Sleep. 2015;38(9):1439–1449. doi:10.5665/sleep.4986
7. Chen HL, Lin HC, Lu CH, et al. Systemic inflammation and alterations to cerebral blood flow in obstructive sleep apnea. J Sleep Res. 2017;26(6):789–798. doi:10.1111/jsr.12553
8. Volk S, Kaendler SH, Weber R, et al. Evaluation of the effects of total sleep deprivation on cerebral blood flow using single photon emission computerized tomography. Acta Psychiatr Scand. 1992;86(6):478–483. doi:10.1111/j.1600-0447.1992.tb03301.x
9. Elvsashagen T, Mutsaerts HJ, Zak N, et al. Cerebral blood flow changes after a day of wake, sleep, and sleep deprivation. NeuroImage. 2019;186:497–509. doi:10.1016/j.neuroimage.2018.11.032
10. Detre JA, Leigh JS, Williams DS, Koretsky AP. Perfusion imaging. Magn Reson Med. 1992;23(1):37–45. doi:10.1002/mrm.1910230106
11. Buysse DJ, Reynolds CF
12. Backhaus J, Junghanns K, Broocks A, Riemann D, Hohagen F. Test-retest reliability and validity of the Pittsburgh Sleep Quality Index in primary insomnia. J Psychosom Res. 2002;53(3):737–740. doi:10.1016/s0022-3999(02)00330-6
13. Soldatos CR, Dikeos DG, Paparrigopoulos TJ. Athens Insomnia Scale: validation of an instrument based on ICD-10 criteria. J Psychosom Res. 2000;48(6):555–560. doi:10.1016/s0022-3999(00)00095-7
14. Soldatos CR, Dikeos DG, Paparrigopoulos TJ. The diagnostic validity of the Athens Insomnia Scale. J Psychosom Res. 2003;55(3):263–267. doi:10.1016/s0022-3999(02)00604-9
15. Krupp LB, LaRocca NG, Muir-Nash J, Steinberg AD. The fatigue severity scale. Application to patients with multiple sclerosis and systemic lupus erythematosus. Arch Neurol. 1989;46(10):1121–1123. doi:10.1001/archneur.1989.00520460115022
16. Johns MW. A new method for measuring daytime sleepiness: the Epworth sleepiness scale. Sleep. 1991;14(6):540–545. doi:10.1093/sleep/14.6.540
17. Johns MW. Sleep propensity varies with behaviour and the situation in which it is measured: the concept of somnificity. J Sleep Res. 2002;11(1):61–67. doi:10.1046/j.1365-2869.2002.00274.x
18. Akerstedt T, Gillberg M. Subjective and objective sleepiness in the active individual. The Int J Neurosci. 1990;52(1–2):29–37. doi:10.3109/00207459008994241
19. Chappell MA, Groves AR, Whitcher B, Woolrich MW. Variational Bayesian Inference for a Nonlinear Forward Model. IEEE T Signal Proces. 2009;57(1):223–236. doi:10.1109/TSP.2008.2005752
20. Chappell MA, MacIntosh BJ, Donahue MJ, Gunther M, Jezzard P, Woolrich MW. Separation of macrovascular signal in multi-inversion time arterial spin labelling MRI. Magn Reson Med. 2010;63(5):1357–1365. doi:10.1002/mrm.22320
21. Jenkinson M, Bannister P, Brady M, Smith S. Improved optimization for the robust and accurate linear registration and motion correction of brain images. Neuroimage. 2002;17(2):825–841. doi:10.1016/s1053-8119(02)91132-8
22. Smith SM. Fast robust automated brain extraction. Hum Brain Mapp. 2002;17(3):143–155. doi:10.1002/hbm.10062
23. Alsop DC, Detre JA, Golay X, et al. Recommended implementation of arterial spin-labeled perfusion MRI for clinical applications: a consensus of the ISMRM perfusion study group and the European consortium for ASL in dementia. Magn Reson Med. 2015;73(1):102–116. doi:10.1002/mrm.25197
24. Buxton RB, Frank LR, Wong EC, Siewert B, Warach S, Edelman RR. A general kinetic model for quantitative perfusion imaging with arterial spin labeling. Magn Reson Med. 1998;40(3):383–396. doi:10.1002/mrm.1910400308
25. Haber SN, Knutson B. The reward circuit: linking primate anatomy and human imaging. Neuropsychopharmacology. 2010;35(1):4–26. doi:10.1038/npp.2009.129
26. Venkatraman V, Chuah YM, Huettel SA, Chee MW. Sleep deprivation elevates expectation of gains and attenuates response to losses following risky decisions. Sleep. 2007;30(5):603–609. doi:10.1093/sleep/30.5.603
27. Greer SM, Goldstein AN, Walker MP. The impact of sleep deprivation on food desire in the human brain. Nat Commun. 2013;4:2259. doi:10.1038/ncomms3259
28. Sridharan D, Levitin DJ, Menon V. A critical role for the right fronto-insular cortex in switching between central-executive and default-mode networks. Proc Natl Acad Sci U S A. 2008;105(34):12569–12574. doi:10.1073/pnas.0800005105
29. Krause AJ, Simon EB, Mander BA, et al. The sleep-deprived human brain. Nat Rev Neurosci. 2017;18(7):404–418. doi:10.1038/nrn.2017.55
30. Kokkinos V, Vulliemoz S, Koupparis AM, et al. A hemodynamic network involving the insula, the cingulate, and the basal forebrain correlates with EEG synchronization phases of sleep instability. Sleep. 2019;42(4):zsy259. doi:10.1093/sleep/zsy259
31. Zhu DA, Zhang C, Yang Y, et al. The relationship between sleep efficiency and clinical symptoms is mediated by brain function in major depressive disorder.J. Affect Disord. 2020;266:327–337. doi:10.1016/j.jad.2020.01.155
32. Yang Y, Zhu DM, Zhang C, et al. Brain structural and functional alterations specific to low sleep efficiency in major depressive disorder. Front Neurosci. 2020;14:50. doi:10.3389/fnins.2020.00050
33. Kim JE, Dager SR, Jeong HS, et al. Firefighters, posttraumatic stress disorder, and barriers to treatment: results from a nationwide total population survey. PLoS One. 2018;13(1):e0190630. doi:10.1371/journal.pone.0190630
34. Chee MW, Choo WC. Functional imaging of working memory after 24 hr of total sleep deprivation. J Neurosci. 2004;24(19):4560–4567. doi:10.1523/JNEUROSCI.0007-04.2004
35. Park S, Kang I, Edden RAE, Namgung E, Kim J, Kim J. Shorter sleep duration is associated with lower GABA levels in the anterior cingulate cortex. Sleep Med. 2020;71:1–7. doi:10.1016/j.sleep.2020.02.018
 © 2021 The Author(s). This work is published and licensed by Dove Medical Press Limited. The full terms of this license are available at https://www.dovepress.com/terms.php and incorporate the Creative Commons Attribution - Non Commercial (unported, v3.0) License.
By accessing the work you hereby accept the Terms. Non-commercial uses of the work are permitted without any further permission from Dove Medical Press Limited, provided the work is properly attributed. For permission for commercial use of this work, please see paragraphs 4.2 and 5 of our Terms.
© 2021 The Author(s). This work is published and licensed by Dove Medical Press Limited. The full terms of this license are available at https://www.dovepress.com/terms.php and incorporate the Creative Commons Attribution - Non Commercial (unported, v3.0) License.
By accessing the work you hereby accept the Terms. Non-commercial uses of the work are permitted without any further permission from Dove Medical Press Limited, provided the work is properly attributed. For permission for commercial use of this work, please see paragraphs 4.2 and 5 of our Terms.