")
Back to Journals » International Journal of Nanomedicine » Volume 15
Finite Element Analysis for Predicting Skin Pharmacokinetics of Nano Transdermal Drug Delivery System Based on the Multilayer Geometry Model
Authors Gu Y, Gu Q, Yang Q, Yang M, Wang S, Liu J
Received 8 May 2020
Accepted for publication 30 July 2020
Published 12 August 2020 Volume 2020:15 Pages 6007—6018
DOI https://doi.org/10.2147/IJN.S261386
Checked for plagiarism Yes
Review by Single anonymous peer review
Peer reviewer comments 2
Editor who approved publication: Dr Linlin Sun
Yongwei Gu,1– 3,* Qing Gu,4,* Qing Yang,1,2 Meng Yang,3 Shengzhang Wang,5 Jiyong Liu1– 3
1Department of Pharmacy, Fudan University Shanghai Cancer Center, Shanghai 200032, People’s Republic of China; 2Department of Oncology, Shanghai Medical College, Fudan University, Shanghai 200032, People’s Republic of China; 3Department of Pharmacy, Changhai Hospital, Second Military Medical University, Shanghai 200433, People’s Republic of China; 4Department of Pharmacy, Jingan District Zhabei Central Hospital, Shanghai 200070, People’s Republic of China; 5Institute of Biomechanics, Department of Aeronautics and Astronautics, Fudan University, Shanghai 200433, People’s Republic of China
*These authors contributed equally to this work
Correspondence: Shengzhang Wang
Department of Aeronautics and Astronautics, Institute of Biomechanics, Fudan University, Shanghai 200433, People’s Republic of China
Tel/Fax +86-21-65647825
Email [email protected]
Jiyong Liu
Department of Pharmacy, Fudan University Shanghai Cancer Center, Shanghai 200032, People’s Republic of China; Department of Oncology, Shanghai Medical College, Fudan University, Shanghai 200032, People’s Republic of China
Tel/Fax +86-21-64175590
Email [email protected]
Background: Skin pharmacokinetics is an indispensable indication for studying the drug fate after administration of transdermal drug delivery systems (TDDS). However, the heterogeneity and complex skin structured with stratum corneum, viable epidermis, dermis, and subcutaneous tissue inevitably leads the drug diffusion coefficient (Kp) to vary depending on the skin depth, which seriously limits the development of TDDS pharmacokinetics in full thickness skin.
Methods: A multilayer geometry skin model was established and the Kp of drug in SC, viable epidermis, and dermis was obtained using the technologies of molecular dynamics simulation, in vitro permeation experiments, and in vivo microdialysis, respectively. Besides, finite element analysis (FEA) based on drug Kps in different skin layers was applied to simulate the paeonol nanoemulsion (PAE-NEs) percutaneous dynamic penetration process in two and three dimensions. In addition, PAE-NEs skin pharmacokinetics profile obtained by the simulation was verified by in vivo experiment.
Results: Coarse-grained modeling of molecular dynamic simulation was successfully established and the Kp of PAE in SC was 2.00× 10− 6 cm2/h. The Kp of PAE-NE in viable epidermis and in dermis detected using penetration test and microdialysis probe technology, was 1.58× 10− 5 cm2/h and 3.20× 10− 5 cm2/h, respectively. In addition, the results of verification indicated that PAE-NEs skin pharmacokinetics profile obtained by the simulation was consistent with that by in vivo experiment.
Discussion: This study demonstrated that the FEA combined with the established multilayer geometry skin model could accurately predict the skin pharmacokinetics of TDDS.
Keywords: nano transdermal drug delivery system, skin pharmacokinetics, finite element analysis, multilayer geometry model, diffusion coefficient, paeonol nanoemulsion
Introduction
Transdermal drug delivery system (TDDS) is of interest for the drug delivery system that can be subject to a strong first-pass effect, or the skin-targeted drug.1 Skin pharmacokinetics, the monitor of detecting the fate of TDDS in vivo, can directly reflect the drug concentration change, the intensity of the drug at the target site, the relationship of dose-effect, and drug absorption and metabolism in the skin. However, there is little research on the TDDS skin pharmacokinetics throughout the whole skin.
SC is considered to be the main barrier to percutaneous absorption of drug. So, the dermatopharmacokinetics, referred to as the pharmacokinetics of TDDS in SC, was widely applied to investigate the drug metabolic in skin.2 However, the heterogeneous structure of skin can be arranged into stratum corneum (SC), viable epidermis, dermis, and subcutaneous tissue from a macro perspective: SC, the brick-and-mortar model, is the formidable barrier of drug absorption through the skin; viable epidermis, structured with viable cells, inherently presents certain obstacles to TDDS diffusion; while the dermis surely effects TDDS on penetration depth and extent underlying the skin.3 The penetration process of TDDS includes overcoming the SC barrier, penetrating into the viable epidermis and dermis, and then being absorbed by capillaries. So, the dermatopharmacokinetics might not fully explain the skin pharmacokinetics of the drug. In addition, TDDS pharmacokinetics was also determined by measuring the drug concentration over time in blood4 or the drug retention in skin tissue after subcutaneous administration,5 or a combination of the two.6 However, the blood pharmacokinetics did not accurately reflect the drug dynamic distribution in the whole skin and the drug retention in skin could not insight the drug transport properties in different skin layers. To more accurately explore the dynamic distribution of TDDS in various layers of the skin, drug transport properties in skin different layers require a more systematic study, especially for the drugs to target the specific skin layer.
Mathematical models of skin have lead to increasing concern in predicting the permeability of transdermal drug delivery. The predictive mathematical model for skin penetration was developed from the steady-state models (quantitative structure–permeation relationship models, structure-based models, and porous pathway model) to the transient models with time dependence (including basic models, compartment models, complex models, and slow binding/partitioning kinetics in the SC), in which the compartment models, also known as PK models, could be applied to trace the drug fate after penetration into skin.7 McCarley et al8 described one/two-compartment models representing the SC/viable epidermis to predict the drug absorption into and through the skin. Unfortunately, the one/two-compartment mode could not fully accurately reflect the diffusion process of the drug in the whole skin. (Previously, we also used a two-compartment model to study the transdermal process of the drug. However, the in vivo skin pharmacokinetics results were significantly different from the simulation results (P<0.01) as shown in the Supplementary data). So, a multi-compartment model should be established to simulate the entire skin and drug penetration process. However, drug permeability in different skin layers cannot be obtained by experiment due to the complex skin structure and limited experimental facilities. In recent years, a mathematical method was reported to compute drug penetration processes in time and space.9
The FEA provides an approximate numerical solution of a partial differential equation. The primary basis for the FEA is handle domains with polygon meshes (elements) and boundaries, which could discrete the continuous domain. For example, skin could be dispersed into connecting subdomains. As reported, the two-dimensional (2D) FEA model was used to investigate the diffusion of lipophilic solute in SC.10 Rim et al11 developed a FEA model to mimic the percutaneous diffusion of compounds into two isotropic materials, respecting vehicle and skin. It was also reported that 2D FEA was used to simulate the dynamic water diffusion in SC and macromolecules penetration in the epidermis.12,13 However, the simulation of the drug diffusion over time in skin was confined to studying that in SC, or the skin described as homogeneous, as well as the simulation results are rarely experimentally verified. To probe drug absorption and metabolism over time and space (three-dimensional, 3D) in whole skin structured with different layer, the multilayer geometry of TDDS, SC, viable epidermis, and dermis should be meshed with different polygons and density in the FEA. And, the simulation of FEA was executed with the input Kps, including the Kp of drug permeability from vehicle into SC, from SC to the viable epidermis, and from viable epidermis to dermis.
Paeonol (PAE, 2ʹ-hydroxy-4ʹ-methoxyphenyl), extracted from the traditional Chinese Medicine Paeonia moutan and Radix Cynanchi Paniculati, is widely used as an anti-inflammatory and anti-allergic.14 In addition, PAE loaded in the nanoemulsion could improve the properties of drug loading and stability.15 Therefore, PAE-NEs was selected as a model nano transdermal drug to study the skin pharmacokinetics. In this study, we established a multilayer geometry model, and the Kps of PAE-NEs in SC, viable epidermis, and dermis was obtained by MD simulation, in vitro permeation experiments, and in vivo skin microdialysis probe technology. Besides, the FEA method was applied to predict the fate of PAE-NEs in the skin according to the input parameters. Finally, the feasibility of simulating drug skin pharmacokinetics using FEA was verified by in vivo experiments. The developed combination of multilayer geometry model, numerical simulation, and experiment is a powerful tool to push the development of TDDS skin pharmacokinetics.
Materials and Methods
Materials
Lecithin E200 was purchased from Degussa (Germany). Isopropyl myristate (IPM) was obtained from Sinopyharm Chemical Reagent Co., Ltd. Alkyl poly-glucosides (APG) was purchased from China Research Institute of Daily Chemical Industry. Paeonol, with a purity of not less than 98.0%, was supplied by the National Institutes for Food and Drug Control (Beijing, China). Methanol was obtained from Sigma-Aldrich (HPLC grade). Other reagents were of AR grade.
Animals
Male SD rats of SPF grade, weighing 200±20 g and about 1.5 months of age, were purchased from the Second Military Medical University. All animal protocols complied with the International Ethical Guideline and National Institutes of Health Guidelines on the Care and Use of Laboratory Animals, and with the approval of the Committee on Ethics of Biomedical, Second Military Medical University; the approval number is PREC2017-073.
Preparations of PAE-NEs
PAE-NEs were prepared using emulsification technology. Briefly, The PAE (1%) dissolved in IPM (12%) was mixed with alkylpolyglucosides (APG, surfactant, 12%), lecithin (surfactant, 6%), and 1, 2-propylene glycol (co-surfactant, 9%). Then, the mixture was added with aqueous (60%) dropwise at room temperature under stirring at 300 revs/minute until the system was clear.
Establishment of the Model of the Drug Transport System
The drug transport system was composed of the TDDS and the skin (Figure 1). Due to the heterogeneous skin, the drug permeability in the skin depends on the depth of penetration. The fate of drug exposed to skin was diffusion into SC, penetration or metabolism into the viable epidermis, dermis, and absorbed by the system or binding to tissues.16 Hence, the multilayer structure model of the intact drug transport system was divided into TDDS and the skin structured with SC, viable epidermis, and dermis, as shown in Figure 1A and B.
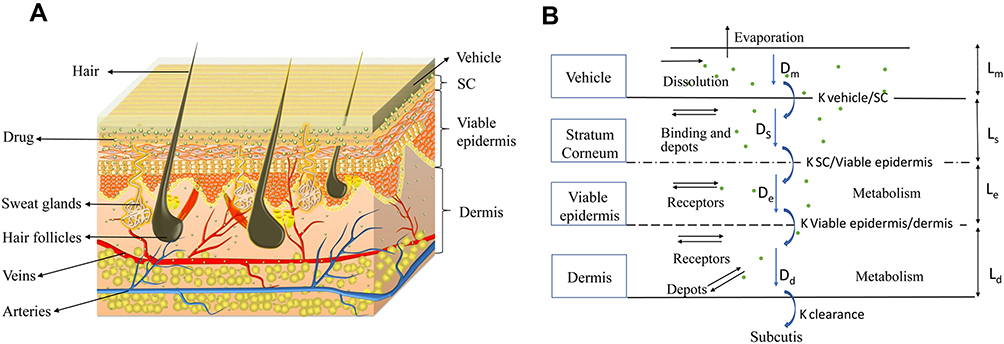 |
Figure 1 The multilayer geometry model of the drug transport system: vehicle, SC, viable epidermis, and dermis. (A) The 3D schematic diagram of vehicle and skin texture. (B) The 2D schematic diagram of drug permeation process from vehicle to subcutis and the highlighted pathways remarked with diffusion coefficients (Dm, Ds, De, and Dd). |
The drug permeability profile of the drug transport system as a function of time (t) and depth (x) in the vehicle, skin, and capillary via the Fick’s diffusion equation are as the following equations (Eqns. 1–4).17,20 And the initial conditions are as follows (Eqns. 5–8):
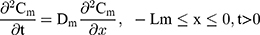
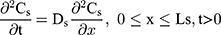
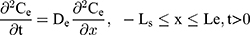
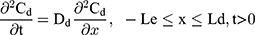
where Cm, Cs, Ce, Cd; Dm, Ds, De, Dd; and Lm, Ls, Le, Ld stand for the drug concentration; drug Kp; and thickness of vehicle, SC, epidermis, and dermis, respectively.


Where Cm0, Cs0, Ce0, and Cd0 stand for the initial drug concentration in the vehicle, SC, viable epidermis, and dermis of the first application, respectively.
For the boundary condition, there is no exchange of drug between the drug delivery system and the surrounding (Eqn. 9). Eqn. (10) shows the equilibrium condition at the vehicle/skin surface (SC). Eqns. (11–13) represent the continuity of flux across the vehicle/SC, SC/viable epidermis, and viable epidermis/dermis, respectively. Moreover, Eqn. (14) states the drug absorbed and eliminated by the capillary.
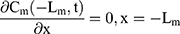

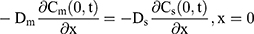
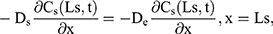
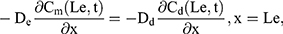
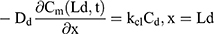
where Cm, Cs, Ce, and Cd mean the drug concentration in vehicle, in SC, in viable epidermis, and in dermis, respectively, Km means the isolation factor at the interface between the vehicle and skin, and kcl refers to the clearance rate of drugs by capillaries.
The Kps of Drug in the Multilayer Geometry Skin Model
The parameters of drug Kps in the different layers of the multilayer structure model are the key points for the numerical simulation. In this work, the Kps in different skin layers were conducted by different methods, including the MD simulation, in vitro penetration test, and in vivo skin microdialysis probe technology. The drug Kp was calculated based on Fick’s law, as in Eqn. (15):

where D (cm2/h) is the drug Kp, J (μg/cm2/h) is the permeation flux in each layer, C (μg/cm3) is the initial interface drug concentration, and x (cm) is the thickness of model layers.
MD Simulation for PAE Kp in SC
The technology of coarse-grained (CG) MD simulation was applied to simulate the process of the drug diffusion in skin SC. In the simulation, the dimyristoyl-sn-glycero-3-phosphocholine (DMPC) was structured to simulate the bi-monolayer system of SC using the software of GROMACS V4.5.1 and van der Waals (VMD).21,23 Besides, the TIP3P were constructed to simulate the water in the initial system.24,25
The parameters of CG DMPC and water force field were set according to the theory of Marrink et al.26 The simulation environment is room temperature and atmospheric pressure. The atomic bond length is kept within the equilibrium distance under the LINCS algorithm, and the electrostatic interaction is calculated using Particle-Mesh-Ewald (PME) algorithm. In addition, the descent algorithm and the conjugate gradient algorithms were used to minimize the system energy. Then drug molecules were placed on the upper surface of the phospholipid bilayer to simulate the process of membrane permeation and the dynamics diffusion under 310.15 K for 100 ns. The Kp of the drug molecule through SC was calculated according to the Einstein relation:
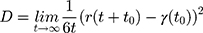
where D represents the drug Kp, r(t) represents the proton coordinates at time t, and 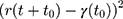 represents the mean square displacement (MSD) calculated from the initial time t0.
The Kp of PAE-NEs in the Viable Epidermis
Franz diffusion cells were employed to investigate the Kp of PAE-NEs in the viable epidermis. Briefly, rats abdominal hair was removed with electrical clippers and the skin harvested without subcutaneous tissue and then the SC was stripped with tape stripping.2 The skin sample was treated with 1 M NaBr solution for 4 hours, and the viable epidermis was obtained with a medical cotton swab.27 Then the tissue of the epidermis layer was mounted between the donor and acceptor compartments and treated with 0.5 g of PAE-NEs. The acceptor compartments were filled with receptor medium (normal saline) and stirred under 300 revs/minute at 32±0.5°C.28,29 At regular intervals (0.5, 1, 2, 4, 6, 8, 10, and 12 hours), 1 mL of receiver medium was withdrawn for analysis and the acceptor compartments refilled with fresh medium. The cumulative permeability was detected and the Kp was fitted using the penetration profile and Eqns. (15), (17), and (18):29,30
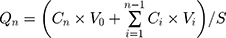

where Qn (μg/cm2) is in vitro accumulation percutaneous permeability, Cn is the drug concentration of extracted samples, V0 and Vi are the volume of receiver medium and extracted samples, Ci is the drug concentration of the ith extracted samples, S is the effective penetration area, and J (μg/cm2/h) is the slop of PAE-NEs penetration profile.
The Kp of PAE-NEs in the Dermis
The Kp of PAE-NEs in the skin dermis was obtained using skin microdialysis probe technology combined with MATLAB software. Rats anesthetized with 25% of urethane (0.4 mL/100 g) were fixed on warm-pad supine to maintain body temperature. Then, a skin microdialysis probe was implanted in the dermis guiding with an 18 G puncture needle under monitoring by 3D computer tomography (CT). Then, the probe implanted in the abdominal skin was balanced for 1 hour with perfusate (PBS solution) at a flow rate of 5 μL/min.29 After the rats were treated with PAE-NEs (area administration=3×4 cm2), the dialysis solution was sampled and analyzed using LC-MS every 20 minutes (100 μL) for 12 hours. The drug concentration in the dermis was calculated according to the established microdialysis methodology, as displayed in the supplementary data. Then, the concentration–time curve of drug in dermis was Fourier series fitted using the software of MATLAB. Further, the concentration-time curve was integrated to obtain the total drug flux. And the Kp of PAE-NEs in the dermis was calculated using Fick’s law (Eqn. 15).
FEA for Simulation of the PAE-NEs Skin Pharmaceutics
Numeralization of the Multilayer Geometry Models
Mapped mesh is used for numeralization of the multilayers of the drug transport system with the thickness of the vehicle, SC, viable epidermis, and dermis at 0.1 cm, 0.02 cm, 0.02 cm, and 0.16 cm, respectively.31,32 The element grids were divided and optimized using the grid division tool provided by PDE tool software in Matlab 12.0. The initial drug concentration in the simulation was 0.2 g/cm3, and that in the skin was 0 g/cm3. The dimension of the transverse (spread direction) is much larger than that of the longitudinal (depth direction) in entire skin layers, which meet the boundary conditions of the numerical multilayer geometry model. The time step and convergence criteria were set at 1 and 0.0001, respectively.
2D and 3D Dynamic Penetration Processes of PAE-NEs in Skin Using FEA
The multilayer geometry model and the input parameters (Kps of the drug in SC, viable epidermis, and dermis detected by MD simulation, in vitro permeation test, and in vivo microdialysis probe technology, respectively) were used to simulate the transport process of the PAE-NEs in skin. 2D dynamic diffusion processes of PAE-NEs over a period of time within the numeralization multilayers model and the 3D drug concentration in the entire skin over time and space was profiled using the FEA method assisted with the PDE Tool in Matlab12.0.
Validation of FEA Method Used for Predicting Skin Pharmacokinetics of TDDS
The experimental and simulated drug concentration–time curve results were compared to validate the feasibility of the FEA method to predict skin pharmacokinetics of TDDS. For experiment, the drug concentration over time in the dermis layer was acquired using the skin microdialysis probe technology and the depth of the probe in the skin was monitored by a CT. Correspondingly, a single line (the profile of drug concentration–time) of the simulation curve was separated from the 3D dynamic processes of PAE-NEs obtained using FEA, in which the depth was the same as the probe in the dermis.
Statistical Analysis
The data was shown as mean±SD. The PK parameters were analyzed with Kinetica 5.0 software. P-values less than 5% were considered to be significant.
Results and Discussion
The Kps of Drug in the Multilayer Geometry Skin Model
MD Simulation for PAE Kp in SC
Research on the drug permeation process in SC is restricted with the traditional method, whereas MD simulation is a powerful tool to visually investigate the drug transport process over time and skin depth.33,34 In the MD simulation, coarse-grained (CG) modeling allowing long-time period and larger length scale simulation compared with the traditional atomistic models.22,35 Considering the main penetration barrier in the SC is located in lipid and the phospholipid molecule of DMPC is considered to be similar to the lipid membrane structure, DMPC was selected to construct the SC phospholipid bilayer as shown in Figure 2A and B.22,36 Further, the simulation system structured by DMPC, water (Grey), and PAE (blue) is displayed in Figure 2C. As shown in Figure 2D–F, the dynamic diffusion process of PAE in the skin indicated that the drug gradually approached the DMPC as the simulation time increases.
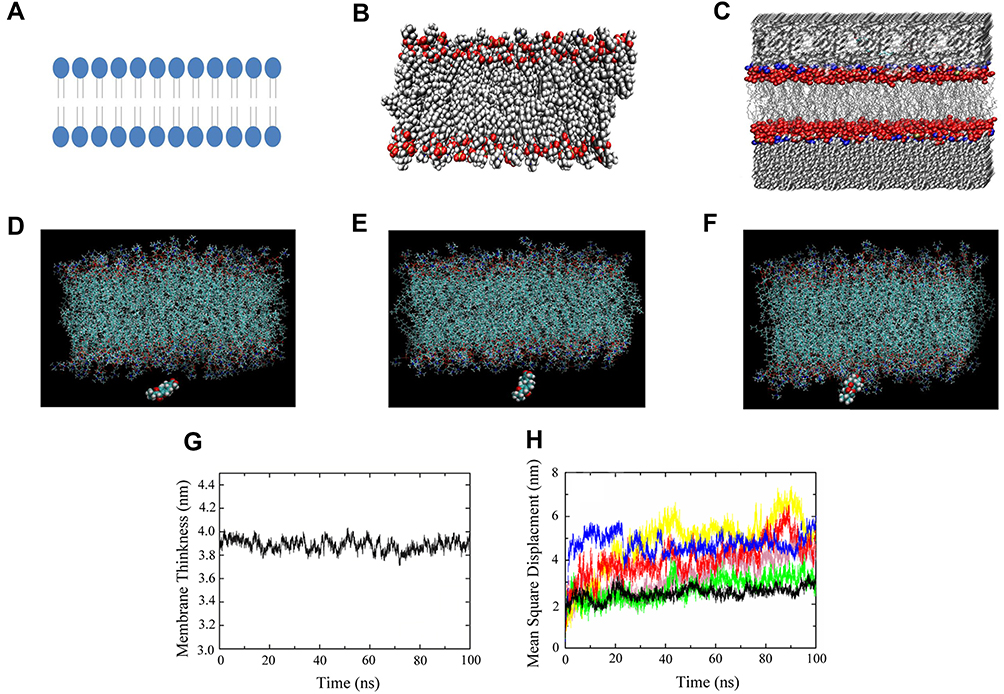 |
Figure 2 MD simulation for PAE dynamic penetration in SC. (A) 2D schematic diagram of phospholipid bilayer structure of SC; (B) the 3D structure of phospholipid molecules modeled by van der Waals spherical model. Carbon atoms: dark gray; oxygen atoms: red; nitrogen atoms: blue; hydrogen atoms: light gray; and phosphorus atoms: gold; (C) simulation system, the hydrophobic part of DMPC is modeled with the van der Waals model: Blue, red, and gold marked nitrogen atoms, Oxygen and phosphorus atoms, respectively. While the hydrophilic tail carbon chain is modeled with the current model and the carbon atoms are gray. In addition, both sides of the bimolecular shaded in gray are water molecules; (D–F) the dynamic processes of PAE in SC, the coordinate of (D–F) were (35.758, 29.998, 23.602), (40.145, 25.609, 24.273), and (33.722, 21.450, 31.305), respectively; (G) changes in phospholipid bilayer thickness; (H) the diffusivities trajectories of the drug molecules (n=6). |
As shown in Figure 2G, the thickness of the phospholipid bilayer was kept within a reasonable and stable range within 100 ns of the simulation, indicating reasonable parameters, settings, and a stable simulation system. In the analysis of drug diffusion trajectories (n=6, Figure 2H), the stochastic initial conditions (the relative position of the drug and DMPC) were contributed to the incomplete match of drug molecular trajectories. In addition, the mean square displacement (MSD) (Figure 2H) combined with Eqn. (16) was used to fit the Kp of PAE in SC, calculating the Kp was approximately 2.00×10⁻⁶ cm2/h. However, the MD simulation of PAE-NEs penetration in SC or that in the epidermis and dermis of the skin requires further research.
The Kp of PAE-NEs in the Viable Epidermis
The permeation profile of PAE-NEs in the viable epidermis is illustrated in Figure 3. According to Eqns. (17) and (18) (Qn=103.03 t+66.86, R2=0.996), Eqn. (15) and the viable epidermis thickness (0.20 mm),36 the Kp of PAE-NEs in the viable epidermis was 1.58×10⁻⁵ cm2/h. Besides, the cumulative permeability reached 75.82±2.85% at 12 hours. In general, tape-stripping is a minimally invasive approach to obtain the SC layer for measuring the drug concentration in SC.2 In the research, the method of tape-stripping was applied to remove the SC. The in vitro penetration test was a wide alternative method and a useful tool to investigate the TDDS pharmacokinetics.37,38 So, the in vitro permeability of PAE-NEs in the viable epidermis could be calculated according to the in vitro penetration profiles. The Kp of PAE-NEs in the viable epidermis is slightly different from previous reports, which might be due to the fact that the Kp of drug varies with the drug molecule and the skin species.13,39
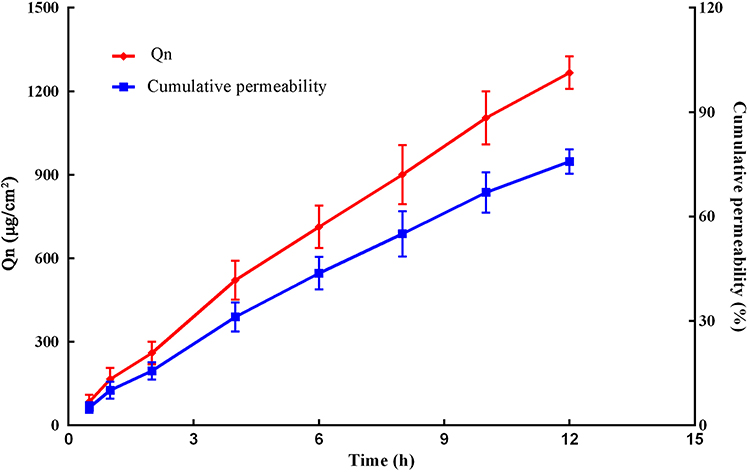 |
Figure 3 In vitro permeation profiles of PAE-NEs. The solid lines in red represent accumulation percutaneous permeability and the solid lines in blue represent the accumulation permeability (n=5). |
The Kp of PAE-NEs in the Dermis
Microdialysis probe technology used to detect the TDDS pharmacokinetics was frequently reported.29,40,41 In the research, we creatively applied the technology to detect the Kp of drug in the dermis. The depth of the microdialysis probe implanted in the dermis visualized and located by the CT was 1.36 mm. A Fourier series curve of the PAE-NEs concentration–time in the dermis was fitted with MATLAB, as illustrated in Figure 4. According to Fick’s law, the Kp of PAE-NEs was 3.20×10⁻⁵ cm2/h. The results of drug Kp in SC, viable epidermis, and dermis demonstrated that the penetrability of PAE-NEs was gradually increased with skin depth and that in the dermis is about twice that in the viable epidermis, which is consistent with previous reports.13,39,42
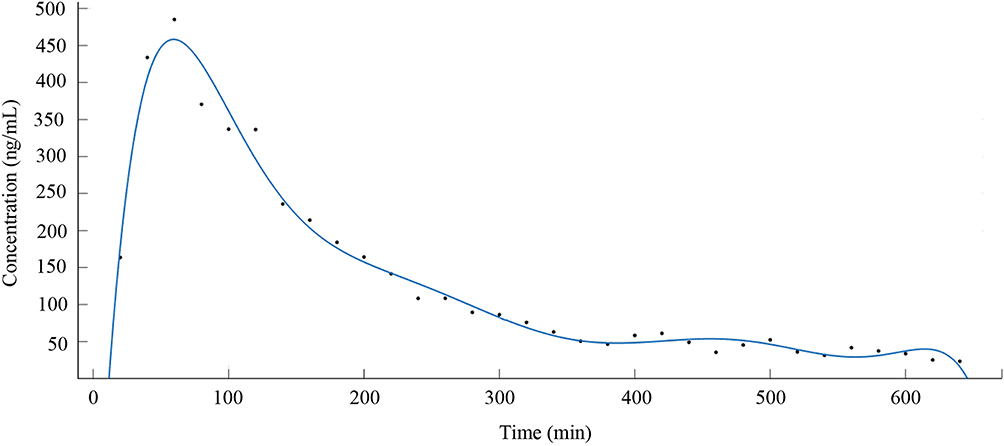 |
Figure 4 Concentration–time profile of PAE-NEs in microdialysate of skin probe located at 0.136 cm in the skin (solid points) and the Fourier series fitting curve of the drug concentration over time (solid line). |
FEA for Simulation of the PAE-NEs Skin Pharmaceutics
Numeralization of the Multilayer Geometry Models
The FEA is a powerful grid-based method for the numerical solution of partial differential equations for dynamic drug penetration within the skin.13,23 The spatial domain interconnected by node was divided into elementary shapes, which can be triangles, quadrangle, and polygons. The nodes density varies in the domains and each point and node have a unique property.43 The meshing of the multilayer domain, the diffusivities, as well as the internal boundary conditions of the skin multilayer models are shown in Figure 5. The time domain is 10 hours, the time step = 0.001 hours = 0.06 minutes and the convergence was 0.001.
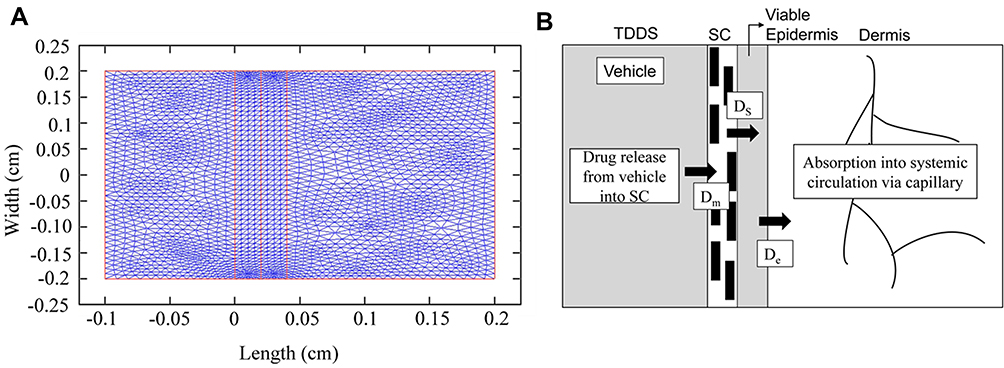 |
Figure 5 Finite elementary mesh of the finite element solutions (A) and the multilayer geometry of drug transport system (B), Dm, Ds, and De are the Kp of drug from vehicle to SC, from SC to viable epidermis, and from viable epidermis to dermis, respectively. |
2D and 3D Dynamic Penetration Processes of PAE-NEs in Skin Using FEA
The 2D dynamic penetration process of PAE-NEs at different simulation times in the drug transport system is shown in Figure 6A–D. The results indicated that the drug penetration is time-dependent: initially, there is no penetration of the drug at the simulation time=0. And as the simulation time prolongs, the drug penetration proceeds from the vehicle to the SC, viable epidermis, and dermis. Besides, as depicted in Figure 6E, the 3D schematic of the drug concentration of PAE-NEs over time and skin depth based on the four-layer model simulates the entire dynamic process from drug administration to metabolism in the skin.
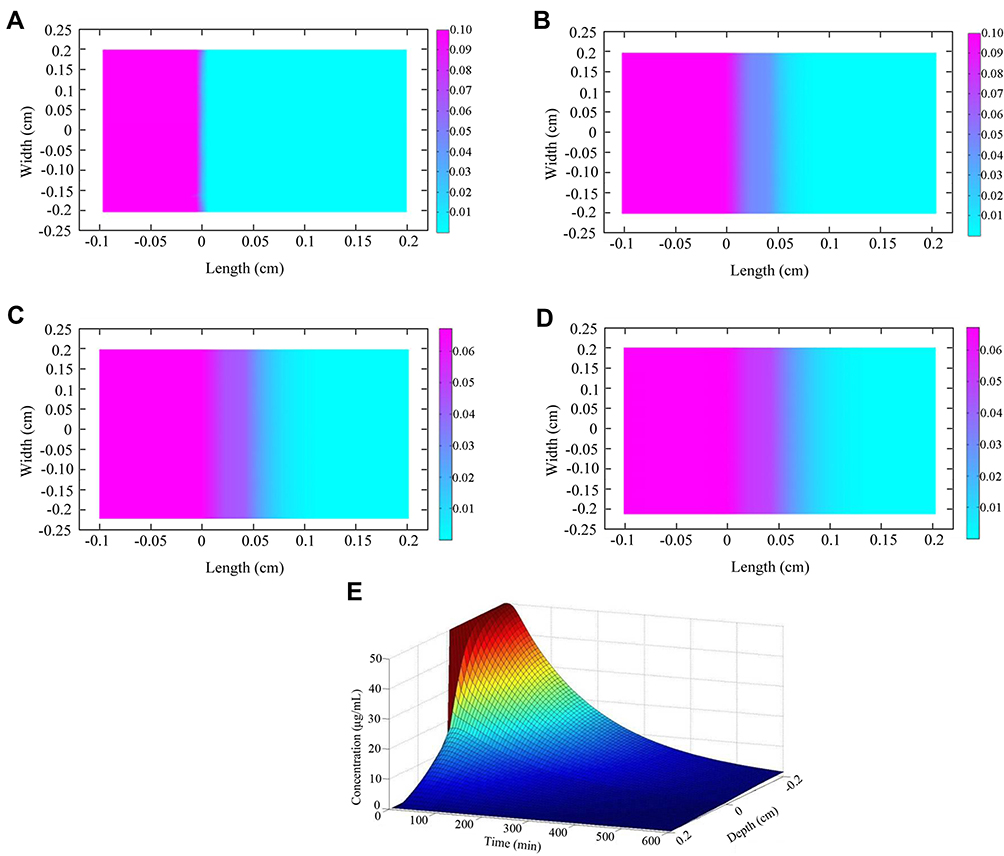 |
Figure 6 The drug concentration of PAE-NEs over time and skin depth. (A–D) The 2D drug penetration process and the drug concentration at the FEA simulation time of 0, 100, 200, and 300 min, respectively; (E) 3D schematic of the drug concentration–time–skin depth of FEA simulation. |
Validation of FEA Method Used for Predicting Skin Pharmacokinetics of TDDS
In the validation experiment, the depth of the liner microdialysis probe implanted was 1.68 mm. The drug concentration–time profile is shown as a green dotted line in Figure 7. The comparison between the drug concentration–time curves at the skin depth of 1.68 mm measured by in vivo skin microdialysis probe technology and the numerical simulation profiles extracted from FEA simulation profile of drug concentration-time-skin at a depth of 1.68 cm were plotted in the same coordinate system as shown in Figure 7: the green dotted line and blue dotted line stand for the experimental results and the numerical simulation results, respectively. The comparative results showed that the overall skin pharmacokinetics could best be fitted by the FEA. The small error between the experimental and simulation results indicated that the FEA method combined with a multilayer geometry model is an accurate method for investigating the skin pharmacokinetics of PAE-NE.
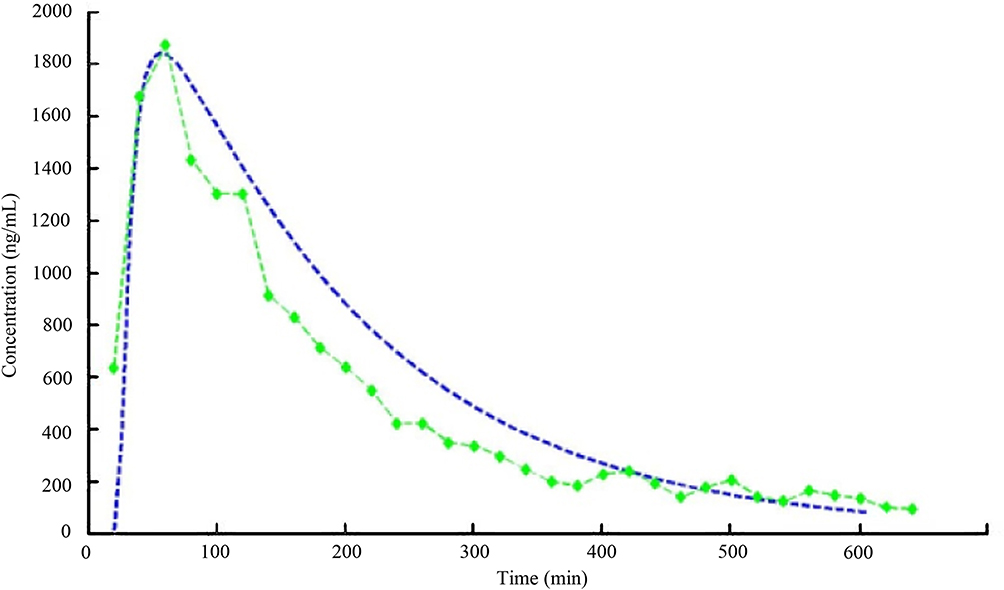 |
Figure 7 The comparison between the experimental data obtained by skin pharmacokinetics and FEA simulation results. The green dotted line stands for the experimental results, while the blue dotted line refers to the numerical simulation results. |
Study Limitations
In the research of the FEA method used for simulating skin pharmacokinetics of TDDS based on the drug Kps in a multilayer geometry model, the limitation is whether it is possible to accurately determine the Kps of the drug in the SC, viable epidermis, and dermis. The Kp of the PAE molecule in SC simulated with MD simulation was an approximation. And the Kp of preparations (PAE-NEs) using the MD simulation model needs further research with the development of computing power. Besides, the permeability of PAE-NEs in the viable epidermis using exfoliated skin might be different from that in vivo. Indeed, the skin inevitably undergoes elastic deformation in the preparing process, which may affect transcutaneous penetration.13,40 As for PAE-NEs permeability in dermis, the flux J was fitted with Fourier series fitting, which cannot be completely matched with the experimental concentration–time curves. It is important to realize that the more complex models and technologies should be developed to obtain more accurate input parameters for predicting skin pharmacokinetics with FEA.
Conclusions
This was the first study to combine FEA simulation methods based on the mathematical multilayer geometry of drug transport system to investigate skin pharmacokinetics of TDDS. We explored the interaction between PAE and SC on a molecule level using coarse-grained MD simulation to simulate the Kp in SC. Also, an in vitro penetration experiment of PAE-NEs in extraneous skin was carried out to gain the Kp in the viable epidermis. In addition, The Kp of PAE-NEs in the dermis was obtained by the in vivo skin microdialysis probe technology combined with Fourier series fitting. Excitedly, PAE-NEs skin pharmacokinetics profiles simulated by the FEA method with the input parameters showed great consistency with the actual in vivo performance. It can be concluded that the method of FEA based on a multilayer geometry model is a promising strategy to predict the TDDS skin pharmacokinetics.
Funding
This work was supported by the National Natural Science Foundation of China (81873011, 81573613), the Science and Technology Commission of Shanghai Municipality (18401931500), the Outstanding Talents Program of Shanghai Health and Family Planning Commission (2018BR27), and Shanghai Sailing Program (20YF1412100).
Disclosure
The authors report no conflicts of interest in this work.
References
1. Prausnitz MR, Langer R. Transdermal drug delivery. Nat Biotechnol. 2008;26(11):1261–1268. doi:10.1038/nbt.1504
2. Calatayud-Pascual MA, Sebastian-Morelló M, Balaguer-Fernández C, Delgado-Charro MB, López-Castellano A, Merino V. Influence of chemical enhancers and iontophoresis on the in vitro transdermal permeation of propranolol: evaluation by dermatopharmacokinetics. Pharmaceutics. 2018;10(4):265. doi:10.3390/pharmaceutics10040265
3. Amarah A, Petlin DG, Grice JE. Compartmental modeling of skin transport. Eur J Pharm Biopharm. 2018;130:336–344. doi:10.1016/j.ejpb.2018.07.015
4. Kleinhenz MD, Van Engen NK, Gorden PJ, et al. Effect of age on the pharmacokinetics and pharmacodynamics of flunixin meglumine following intravenous and transdermal administration to Holstein calves. Am J Vet Res. 2018;79(5):568–575. doi:10.2460/ajvr.79.5.568
5. Flo A, Cambras T, Díez-Noguera A, Calpena A. Melatonin pharmacokinetics after transdermal administration changes according to the time of the day. Eur J Pharm Sci. 2017;96:164–170. doi:10.1016/j.ejps.2016.09.020
6. Matsumoto K, Kitaoka M, Kuroda Y, et al. Pharmacokinetics and skin-tissue penetration of daptomycin in rats. Clin Pharmacol. 2015;7:79–82. doi:10.2147/CPAA.S83447
7. Mitragotri S, Anissimov YG, Bunge AL, et al. Mathematical models of skin permeability: an overview. Int J Pharm. 2011;418(1):115–129. doi:10.1016/j.ijpharm.2011.02.023
8. McCarley KD, Bunge AL. Physiologically relevant two-compartment pharmacokinetic models for skin. J Pharm Sci. 2000;89(9):1212–1235. doi:10.1002/1520-6017(200009)89:9<1212::AID-JPS13>3.0.CO;2-4
9. Naegel A, Heisig M, Wittum G. Detailed modeling of skin penetration–an overview. Adv Drug Deliv Rev. 2013;65(2):191–207. doi:10.1016/j.addr.2012.10.009
10. Frasch HF, Barbero AM. Steady-state flux and lag time in the stratum corneum lipid pathway: results from finite element models. J Pharm Sci. 2003;92(11):2196–2207. doi:10.1002/jps.10466
11. Rim JE, Pinsky PM, van Osdol WW. Finite element modeling of coupled diffusion with partitioning in transdermal drug delivery. Ann Biomed Eng. 2005;33(10):1422–1438. doi:10.1007/s10439-005-5788-6
12. Xiao P, Imhof RE. Two dimensional finite element modelling for dynamic water diffusion through stratum corneum. Int J Pharm. 2012;435(1):88–92. doi:10.1016/j.ijpharm.2012.01.047
13. Römgens AM, Bader DL, Bouwstra JA. Diffusion profile of macromolecules within and between human skin layers for (trans)dermal drug delivery. J Mech Behav Biomed Mater. 2015;50:215–222. doi:10.1016/j.jmbbm.2015.06.019
14. Zong SY, Pu YQ, Xu BL, Zhang T, Wang B. Study on the physicochemical properties and anti-inflammatory effects of paeonol in rats with TNBS-induced ulcerative colitis. Int Immunopharmacol. 2017;42:32–38. doi:10.1016/j.intimp.2016.11.010
15. Chen S, Zhang J, Wu L, Wu H, Dai M. Paeonol nanoemulsion for enhanced oral bioavailability: optimization and mechanism. Nanomedicine. 2018;13(3):269–282. doi:10.2217/nnm-2017-0277
16. Karadzovska D, Brooks JD, Monteiro-Riviere NA, Riviere JE. Predicting skin permeability from complex vehicles. Adv Drug Deliv Rev. 2013;65(2):265–277. doi:10.1016/j.addr.2012.01.019
17. Scheuplein RJ, Blank IH. Permeability of the skin. Physiol Rev. 1971;51(4):702–747. doi:10.1152/physrev.1971.51.4.702
18. Kubota K. Finite dose percutaneous drug absorption: a BASIC program for the solution of the diffusion equation. Comput Biomed Res. 1991;24(2):196–207. doi:10.1016/0010-4809(91)90030-Z
19. Couto A, Fernandes R, Cordeiro MN, Reis SS, Ribeiro RT, Pessoa AM. Dermic diffusion and stratum corneum: a state of the art review of mathematical models. J Control Release. 2014;177:74–83. doi:10.1016/j.jconrel.2013.12.005
20. Jalili S, Saeedi M. Study of procaine and tetracaine in the lipid bilayer using molecular dynamics simulation. Eur Biophys J. 2017;46(3):265–282. doi:10.1007/s00249-016-1164-8
21. Yang C, Dai X, Yang S, et al. Coarse-grained molecular dynamics simulations of the effect of edge activators on the skin permeation behavior of transfersomes. Colloids Surf B Biointerfaces. 2019;183:110462. doi:10.1016/j.colsurfb.2019.110462
22. Lin X, Bai T, Zuo YY, Gu N. Promote potential applications of nanoparticles as respiratory drug carrier: insights from molecular dynamics simulations. Nanoscale. 2014;6(5):2759–2767. doi:10.1039/C3NR04163H
23. Barbero AM, Frasch F. Effect of stratum corneum heterogeneity, anisotropy, asymmetry and follicular pathway on transdermal penetration. J Control Release. 2017;260:234–246. doi:10.1016/j.jconrel.2017.05.034
24. Dorrell J, Pártay LB. Thermodynamics and the potential energy landscape: case study of small water clusters. Phys Chem Chem Phys. 2019;21(14):7305–7312. doi:10.1039/C9CP00474B
25. Yin Y, Sieradzan AK, Liwo A, He Y, Scheraga HA. Physics-based potentials for coarse-grained modeling of protein-DNA interactions. J Chem Theory Comput. 2015;11(4):1792–1808. doi:10.1021/ct5009558
26. Marrink SJ, Risselada HJ, Yefimov S, Tieleman DP, De Vries AH. The MARTINI force field: coarse grained model for biomolecular simulations. J Phys Chem B. 2007;111(27):7812–7824. doi:10.1021/jp071097f
27. Liu X, Fu L, Dai W, et al. Design of transparent film-forming hydrogels of tolterodine and their effects on stratum corneum. Int J Pharm. 2014;471:322–331. doi:10.1016/j.ijpharm.2014.05.051
28. OECD. Test Guideline 427: Skin Absorption: In Vitro Method OECD. Paris; 2004.
29. Gu Y, Tang X, Yang M, Yang D, Liu J. Transdermal drug delivery of triptolide-loaded nanostructured lipid carriers: preparation, pharmacokinetic, and evaluation for rheumatoid arthritis. Int J Pharm. 2019;554:235–244. doi:10.1016/j.ijpharm.2018.11.024
30. Dai X, Wang R, Wu Z, et al. Permeation-enhancing effects and mechanisms of borneol and menthol on ligustrazine: a multiscale study using in vitro and coarse-grained molecular dynamics simulation methods. Chem Biol Drug Des. 2018;92(5):1830–1837. doi:10.1111/cbdd.13350
31. Lian G, Chen L, Han L. An evaluation of mathematical models for predicting skin permeability. J Pharm Sci. 2008;97(1):584–598. doi:10.1002/jps.21074
32. Loizidou EZ, Inoue NT, Ashton-Barnett J, Barrow DA, Allender CJ. Evaluation of geometrical effects of microneedles on skin penetration by CT scan and finite element analysis. Eur J Pharm Biopharm. 2016;107:1–6. doi:10.1016/j.ejpb.2016.06.023
33. Selyutina OY, Apanasenko IE, Kim AV, Shelepova EA, Khalikov SS, Polyakov NE. Spectroscopic and molecular dynamics characterization of glycyrrhizin membrane-modifying activity. Colloids Surf B Biointerfaces. 2016;147:459–466. doi:10.1016/j.colsurfb.2016.08.037
34. Wilkosz N, Jamróz D, Kopeć W, et al. Effect of polycation structure on interaction with lipid membranes. J Phys Chem B. 2017;121(30):7318–7326. doi:10.1021/acs.jpcb.7b05248
35. Dai X, Yin Q, Wan G, Wang R, Shi X, Qiao Y. Effects of concentrations on the transdermal permeation enhancing mechanisms of borneol: a coarse-grained molecular dynamics simulation on mixed-bilayer membranes. Int J Mol Sci. 2016;17(8):1349. doi:10.3390/ijms17081349
36. Nitsche JM, Kasting GB. A microscopic multiphase diffusion model of viable epidermis permeability. Biophys J. 2013;104(10):2307–2320. doi:10.1016/j.bpj.2013.03.056
37. Shin SH, Thomas S, Raney SG, et al. In vitro-in vivo correlations for nicotine transdermal delivery systems evaluated by both in vitro skin permeation (IVPT) and in vivo serum pharmacokinetics under the influence of transient heat application. J Control Release. 2018;270:76–88. doi:10.1016/j.jconrel.2017.11.034
38. Lehman PA, Raney SG, Franz TJ. Percutaneous absorption in man: in vitro-in vivo correlation. Skin Pharmacol Physiol. 2011;24(4):224–230. doi:10.1159/000324884
39. Raphael AP, Meliga SC, Chen X, Fernando GJ, Flaim C, Kendall MA. Depth-resolved characterization of diffusion properties within and across minimally-perturbed skin layers. J Control Release. 2013;166(2):87–94. doi:10.1016/j.jconrel.2012.12.010
40. Yang M, Gu Y, Yang D, Tang X, Liu J. Development of triptolide-nanoemulsion gels for percutaneous administration: physicochemical, transport, pharmacokinetic and pharmacodynamic characteristics. J Nanobiotechnol. 2017;15(1):88. doi:10.1186/s12951-017-0323-0
41. Voelkner NM, Voelkner A, Costa J, et al. Dermal pharmacokinetics of pyrazinamide determined by microdialysis sampling in rats. Int J Antimicrob Agents. 2018;51(2):190–196. doi:10.1016/j.ijantimicag.2017.10.001
42. Liu P, Huang Y, Guo Z, Wang J, Zhuang Z, Liu S. Discrimination of dimethyl sulphoxide diffusion coefficient in the process of optical clearing by confocal micro-Raman spectroscopy. J Biomed Opt. 2013;18(2):020507. doi:10.1117/1.JBO.18.2.020507
43. Kretsos K, Miller MA, Zamora-Estrada G, Kasting GB. Partitioning, diffusivity and clearance of skin permeants in mammalian dermis. Int J Pharm. 2008;346:64–79. doi:10.1016/j.ijpharm.2007.06.020
 © 2020 The Author(s). This work is published and licensed by Dove Medical Press Limited. The full terms of this license are available at https://www.dovepress.com/terms.php and incorporate the Creative Commons Attribution - Non Commercial (unported, v3.0) License.
By accessing the work you hereby accept the Terms. Non-commercial uses of the work are permitted without any further permission from Dove Medical Press Limited, provided the work is properly attributed. For permission for commercial use of this work, please see paragraphs 4.2 and 5 of our Terms.
© 2020 The Author(s). This work is published and licensed by Dove Medical Press Limited. The full terms of this license are available at https://www.dovepress.com/terms.php and incorporate the Creative Commons Attribution - Non Commercial (unported, v3.0) License.
By accessing the work you hereby accept the Terms. Non-commercial uses of the work are permitted without any further permission from Dove Medical Press Limited, provided the work is properly attributed. For permission for commercial use of this work, please see paragraphs 4.2 and 5 of our Terms.