")
Back to Journals » Patient Preference and Adherence » Volume 16
Finalization and Validation of Questionnaire and Algorithm of SPUR, a New Adherence Profiling Tool
Authors de Bock E, Dolgin K , Kombargi L , Arnould B, Vilcot T , Hubert G , Laporte ME , Nabec L, Reach G
Received 11 January 2022
Accepted for publication 14 April 2022
Published 12 May 2022 Volume 2022:16 Pages 1213—1231
DOI https://doi.org/10.2147/PPA.S354705
Checked for plagiarism Yes
Review by Single anonymous peer review
Peer reviewer comments 2
Editor who approved publication: Dr Johnny Chen
Video abstract of "Finalization and validation of questionnaire and algorithm of SPUR" [ID 354705].
Views: 132
Elodie de Bock,1 Kevin Dolgin,2 Léa Kombargi,2 Benoit Arnould,1 Tanguy Vilcot,1 Guillaume Hubert,2 Marie-Eve Laporte,3 Lydiane Nabec,4 Gérard Reach5
1Patient Centred Outcomes, ICON plc, Lyon, France; 2Observia, Paris, France; 3IAE Paris - Sorbonne Business School, Université Paris 1 Panthéon-Sorbonne, Paris, France; 4Université Paris-Saclay, RITM (Réseaux, Innovation, Territoire et Mondialisation), Paris, France; 5Health Education and Practices Laboratory (LEPS), Sorbonne Paris-Nord University, Bobigny, France
Correspondence: Elodie de Bock, ICON plc, 27 rue de la Villette, Lyon, 69003, France, Tel + 33 472 13 59 81, Email [email protected]
Purpose: The SPUR (Social, Psychological, Usage and Rational) Adherence Profiling Tool is a recently developed adaptive instrument for assessing key patient-level drivers for non-adherence. This study describes the SPUR questionnaire’s finalization and psychometric evaluation.
Patients and Methods: Data were collected through an online survey among patients with type 2 diabetes included by general practitioners and diabetologists in France. The survey included four questionnaires, SPUR and three validated adherence measures: BMQ, MARS and ACCEPT. Item-level analysis and a partial credit model (PCM) were performed to refine the response option coding of SPUR items. The final item selection of SPUR was defined using a PCM and a principal component analysis (PCA). Construct validity, concurrent validity and known-groups validity were assessed on the final SPUR questionnaire.
Results: A total of 245 patients (55% men, mean age of 63 years) completed the survey remotely and were included in this analysis. Refining response option coding allowed a better discrimination of patients on the latent trait. After item selection, a short, an intermediate, and a long form composed the final SPUR questionnaire. The short form will be used to screen patients for risk and then the other forms will allow the collection of further information to refine the risk assessment and decide the best levers for action. Results obtained were supportive of the construct validity of the forms. Their concurrent validity was demonstrated: moderate to high significant correlations were obtained with BMQ, MARS and ACCEPT scores. Their known-groups validity were shown with a logical pattern of higher scores obtained for patients considered non-adherent and significant differences between the scores obtained for patients considered adherent versus non-adherent.
Conclusion: SPUR is a valid tool to evaluate the risk of non-adherence of patients, allowing effective intervention by providing insights into the respective individual reasons for lack of adherence.
Keywords: digital questionnaire, non-adherence drivers, psychometric validation, Rasch modelling
Introduction
Adherence to medication is a key factor in the management of chronic disease. As pointed out by the World Health Organization,
Increasing the effectiveness of adherence interventions may have a far greater impact on the health of the population than any improvement in specific medical treatments.1
Non-adherence to treatment for chronic disease is common and is a major predictor of poor disease outcomes.1 While a number of questionnaires are available to assess non-adherence, they tend to provide little information about the underlying drivers of non-adherence, delivering only one or two specific scores. For example, the Morisky questionnaires (MMAS-4 and MMAS-8) provide useful adherence measures, but without quantifiable insights into the reasons behind the patient’s behavior. Furthermore, none are designed to take advantage of the ability of digital administration to alleviate total testing burden by using adaptive questionnaire structure to reduce the potential number of questions asked to any respondent on the basis of their initial responses. For this purpose, the SPUR (Social, Psychological, Usage and Rational) tool was developed.
The SPUR tool currently consists of 45 items with 5-point Likert scale response options. SPUR’s underlying framework is based on a categorization of previously studied drivers of non-adherence for patients with chronic disease.2 SPUR categorizes drivers for adherence to chronic treatments into four broad dimensions: Social which includes both how the patient perceives the support of those close to them as well as the patient’s perceptions of how the treatment affects their place in society; Psychological which includes items referring to the patient’s sense of identity, their degree of reactance and the discounting of future benefits; Usage which corresponds to unintentional non-adherence, namely practical elements such as financial burden, forgetfulness, complexity of administration and perceived self-efficacy; and Rational which focuses on perceptions of the treatment’s benefits, the seriousness of the illness, and the individual’s perceived risk for bad outcomes, including fear of side effects, as per the Health Belief Model.3
The most common approach used to develop and validate an algorithm of an instrument like SPUR is Classical Test Theory (CTT).4,5 However, while CTT can provide unbiased estimates of the target construct, random measurement error can make those estimates unreliable in practice. Rasch-family models can improve the precision of scale scores while minimizing the number of items.6 Our goal was to develop an algorithm for calculating summary adherence measures accurately even in the context of missing data on some of the items.2 To reach this goal, CTT and Rasch modelling were used together for the finalization of the SPUR questionnaire and algorithm and its validation in order to combine the assets of both approaches in a complementary way.
A previously online survey conducted on 501 participants with type 2 diabetes in the United States was the basis for the preliminary development of SPUR algorithm.7 The objective was to create an adaptive algorithm to streamline the use of the SPUR questionnaire via digitally-based means. Administering the SPUR questionnaire in this manner would allow health care providers to get information more reliably and quickly. Results obtained would enable health care providers to focus on gathering detailed information within the range of adherence issues experienced by the respondent while focusing less on less relevant issues. In this way, the SPUR algorithm could be used in the growing field of Digital Adherence Technology (DAT) to provide personalized digital behavioral interventions. In order to retain sufficient flexibility to be incorporated into DATs for a variety of situations, questions were designed in such a way as to not be specific to any one pathology or healthcare system.
The current study presents the analyses and results of the SPUR questionnaire and algorithm finalization and validation. The study used data collected via an online survey of type 2 diabetes patients living in France.
Patients and Methods
Study Design and Population
All study methods were discussed by an Academic Board comprised of doctors in endocrinology and diabetology; experts in health behavior, chronic disease, clinical and applied pharmacy practice, management sciences, therapeutic education and adherence issues. The Academic Board contributed to the writing of the study protocol. They did not contribute to the data collection. The Academic Board was also consulted before the analysis of the data to validate the methodological approach. This study was a phase 3 observational study submitted to and validated by the “Comité de Protection des Personnes (CPP)” on September 4th, 2019. This study complies with the Declaration of Helsinki. French law (Jardé) does not require approval from an Ethical Committee or Institutional Review Board for studies in the field of Human and Social Sciences. General practitioners and diabetologists, who volunteered to be included in this study, signed a financial agreement. The list of the general practitioners and diabetologists included in this study was registered to the “Conseil National de l’Ordre des Médecins (CNOM)”. These general practitioners and diabetologists presented the study to their patients. The patients interested in this study received an information and consent note and they had then 7 days of reflection before accepting to participate to the study. If they wanted to accept to participate, an oral consent was sufficient. Patients included in this study were patients who volunteered and were 18 years of age or above, have type 2 diabetes, have consented to participate to the study, speak French and use at least one oral anti-diabetic medicine. Exclusion criteria were subjects with injectable treatment for diabetes, subjects who participate in another study, subjects with severe psychiatric disorders, subjects with language barrier, and subjects with mental disability. After providing consent, these patients were invited to complete the survey questionnaires online. The duration of completion of the questionnaires was approximately 15 minutes. This study was non-interventional and was not designed to influence the physician’s drug prescription or therapeutic management. Any patient personal data collected was de-identified. The inclusion period lasted from November 2019 to October 2020.
Patients were asked to complete a battery of 4 questionnaires, including the SPUR tool, the Medication Adherence Rating Scale (MARS), the Beliefs about Medicine Questionnaire (BMQ) and the 3-item General Acceptance dimension of the Acceptance by the Patients of their Treatment (ACCEPT) questionnaire as well as questions about their sociodemographic and clinical characteristics. The French versions of the MARS, the BMQ and the ACCEPT questionnaires were used; all licenses and permissions have been obtained prior to the use of these questionnaires in this study.
The MARS is a 10-item questionnaire measuring medication adherence.8 The first four items assess medication adherence behavior including the intensity of drug use and persistence, the four subsequent items evaluate the attitude toward taking medication including beliefs about medications and the two remaining items assess side effects and attitudes to psychotropic medication. Total scores range from 0 to 10, with a higher score indicating better medication adherence.
The BMQ is an 18-item questionnaire evaluating people’s beliefs about medicines, for example, perceptions of medication necessity and perceived concerns about medicines in general.9 The Necessity scale of the BMQ assesses patients’ beliefs about the necessity of medication for maintaining present and future health (score ranges from 5 to 25). The Concern scale of the BMQ assesses the patient’s attitudes with respect to the potential adverse consequences of using medication (score ranges from 5 to 25). For both Necessity and Concerns scores, higher scores indicate stronger beliefs regarding medicine.
The ACCEPT General Acceptance dimension consists of three items: Advantages outweigh disadvantages; Medication is an acceptable solution; Medication is worth taking in the long term. Its summary score ranges from 0 to 100, with higher scores indicating greater medication acceptance.10–12
The 6-month Medication Possession Ratio (MPR) was calculated for the patients who answered the questionnaires. The MPR was computed using general practitioner and diabetologist prescription, and drug dispensing data from health insurance. General practitioners and diabetologists filled in the patients’ electronic Case Report Forms (eCRFs) using prescription and drug dispensing data that they could access using their health insurance professional portal.
Analysis
Finalization of the SPUR Questionnaire and Algorithm
Exploration of Item Response Option Coding
An item-level analysis was performed, consisting of calculation of the frequency and percentage of responses for each item of the SPUR tool in order to determine whether floor or ceiling effects occurred.13 A Partial Credit Model (PCM) analysis was conducted to compute the item characteristic curve (ICC) of each SPUR item in order to verify whether the response options were ordered in accordance with the scoring function specifications.14 In the case of misfit of an item whose response options are not ordered in accordance with the scoring function specifications, this item was recoded. The recoding consists of combining adjacent response options in the scoring algorithm taking into account the response option distribution described with the item-level analysis.
Item Selection
A PCM analysis was conducted to understand the structure of the SPUR tool and determine whether all items reflect the same underlying concept.15–17 The fit of each item was examined using p-value (χ2). The person-item map was computed. This map shows the conjoint distribution of the patient measures and the location of the items along the range of scores defined by the latent dimension: low non-adherence to high non-adherence.18 The purpose of the person-item map is to confirm that the SPUR items cover the full range of adherence behaviors in the population. This is determined by examining the distribution of the item difficulties and thresholds (represented in Figure 1 at the bottom of the map in blue) along the latent dimension (x axis) in the person-item map.
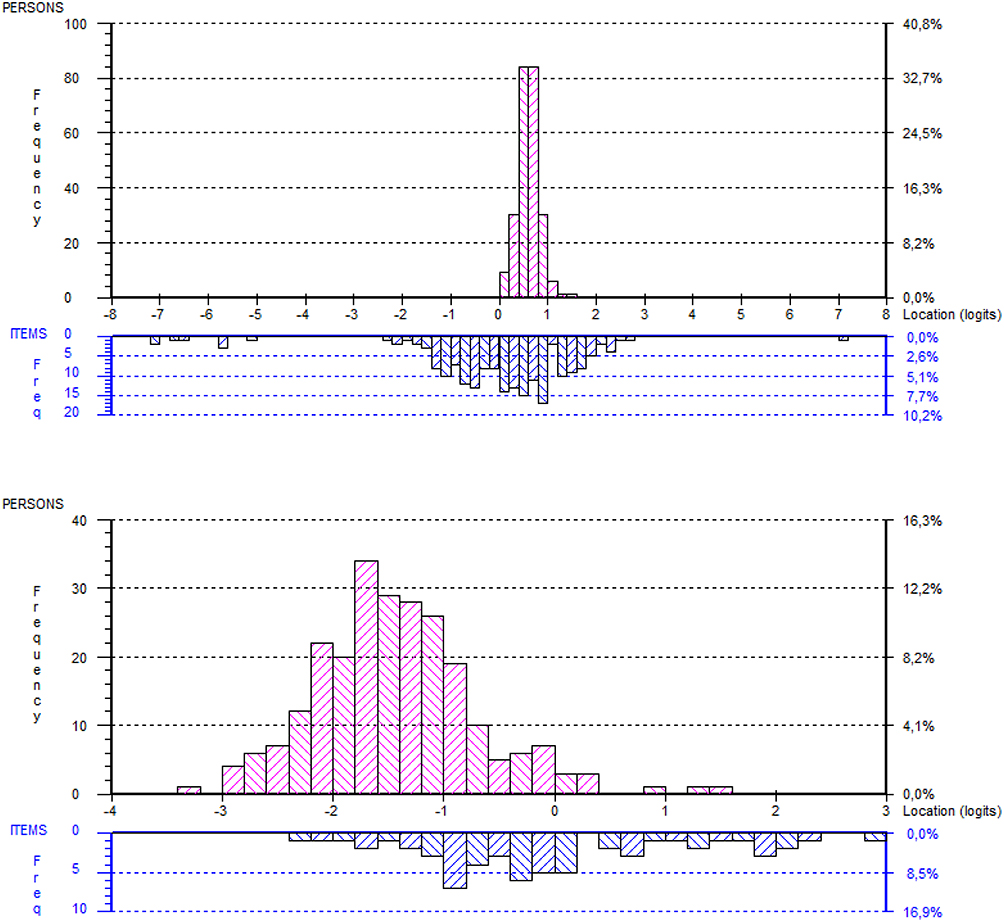 |
Figure 1 Partial credit model – person-item map. The participants are represented at the top of the map and the items are at the bottom of the map. The hardest items for participants to endorse are located on the right of the map, and the easiest items for participants to endorse are on the left. Person-item maps obtained using partial credit model analysis on all SPUR – Social, Psychological, Usage, Rational – items (First figure. Person-item map obtained using partial credit model analysis on all SPUR – Social, Psychological, Usage, Rational – items before response option recoding; Second figure. Person-Item map obtained using partial credit model analysis on all SPUR – Social, Psychological, Usage, Rational – items after response option recoding). |
The initial structure of the SPUR questionnaire was tested using Principal Component Analysis (PCA). The PCA aimed at evaluating whether empirical data confirms this hypothesized structure and defining adjustments that may be needed in the construction of the scoring algorithm. PCA was conducted multiple times on the SPUR items using VARIMAX rotation to refine the scale structure. These analyses were run for the purpose of exploring the underlying factor structure of the latent variable “non-adherence”. The final structure of SPUR was determined using the following elements: the hypothetical structure of SPUR, the Kaiser Criterion provided by PCA, item fit and the person-item map generated by PCM analysis. These analyses allowed the identification of items not fitting with the scale structure and possible candidates for exclusion. A multitrait analysis was also used to confirm the final SPUR structure. In this analysis, Pearson correlation coefficients were calculated between each item and each dimension score after the considered item was removed. Two criteria were assessed: item convergent validity (correlation between each item and its own dimension ≥0.40) and item divergent validity (each item should have a higher correlation with its own dimension than with other dimensions).
Validation of the SPUR Algorithm
Construct Validity
The construct validity examines the extent to which a measure captures the underlying “construct” or concept it set out to evaluate. In accordance with the FDA guidance,19 construct validity was examined regarding convergent/divergent aspects (concurrent validity) and the degree to which SPUR can distinguish among groups hypothesized a priori to be different (known-groups validity). Furthermore, the Receiver operating characteristic (ROC) curve with calculation of the area under the curve (AUC) was used to identify the relationship between the final algorithm score of SPUR and the categorization of patients based on the latent trait obtained with the PCM using a threshold of −1 for the 20% of patients the most at risk of being non-adherent.20,21
Concurrent Validity
Concurrent validity was assessed by calculating Spearman correlation coefficients between the final algorithm score of SPUR and the MARS total score, the ACCEPT General Acceptance dimension score, the BMQ dimension scores, the latent trait provided by PCM analysis, MPR and HbA1c (glycated hemoglobin, average blood glucose levels for the last two to three months).
Known-Groups Validity
For the known-groups validity, SPUR scores were described and compared between groups defined using MPR (MPR ≥ 80%; MPR < 80%; the a priori hypothesis being that higher SPUR scores are expected for patients with MPR < 80%), HbA1c (HbA1c ≤ 6 for excellent glycated hemoglobin; HbA1c =]6;9[for good glycated hemoglobin; HbA1c ≥ 9 for poor glycated hemoglobin; a priori hypothesis being that higher SPUR scores are expected for patients with HbA1c ≥ 9), current comorbidities assessed by the general practitioner or the diabetologist (absence versus presence; a priori hypothesis being that higher SPUR scores are expected for patients with comorbidities), latent trait (latent trait ≥ −1 for the 20% of patients the most at risk of being non-adherent; latent trait < −1 for other patients; a priori hypothesis being that higher SPUR scores are expected for patients with latent trait ≥ −1), ACCEPT General Score Group (ACCEPT General Score Group ≤ 50; ACCEPT General Score Group > 50, threshold provided by the author of the ACCEPT questionnaire; a priori hypothesis being that higher SPUR scores are expected for patients with Accept General Score Group ≤ 50), MARS score (MARS score ≥ 7; MARS score < 7; a priori hypothesis being that higher SPUR scores are expected for patients with MARS score < 7),22–24 BMQ Necessity score (BMQ Necessity score ≥ 18; BMQ Necessity score < 18 for the 20% of patients the most at risk of being non-adherent; a priori hypothesis being that higher SPUR scores are expected for patients with BMQ Necessity score < 18), BMQ Concern score (BMQ Concern score ≥ 13; BMQ Concern score < 13 for the 20% of patients the most at risk of being non-adherent; a priori hypothesis being that higher SPUR scores are expected for patients with BMQ Concern score < 13).
The threshold for statistical significance was fixed at 5%.
Statistical Analyses Software
Statistical analyses were performed using SAS software for Windows (Version SAS® Studio 3.7; SAS Institute, Inc., Cary, NC, USA) and the PCM analysis was performed with RUMM 2030 (Rumm Laboratory Pty Ltd).
Results
Population Characteristics
Two hundred and forty five patients (55% men) completed the online survey and were included in the analysis. Most respondents (75%) had comorbidities and almost all (84%) lived at home with other people. Patients had a mean age of 63 years and a mean recent HbA1c of 7.3 (standard deviation (SD)=1.3) (Table 1).
 |
Table 1 Description of Patients |
The mean MPR of the population was 84.2 (SD=23.2, range: 11.7–100), indicating a high level of adherence. The mean MARS total score of the population was 7.2 (SD=1.6, range: 1–10), indicating a high level of medication adherence but with the full range of possible scores used. The mean BMQ-Concerns subscale and Necessity subscale scores were 17.0 (SD=4.7, range: 5–25) and 20.5 (SD=4.0, range: 5–25), respectively; indicating strong level of beliefs regarding medicine but with the full range of possible scores used. The mean ACCEPT General Score was 75.7 (SD=22.7, range: 0.0–100), indicating a high level of treatment acceptance but with the full range of possible scores used.
Finalization of SPUR Questionnaire and Algorithm
Exploration of Item Response Option Coding
The item-level analysis showed that 28 items presented floor or ceiling effects (depending on the positive or negative wording of the questions regarding non-adherence assessment). The under-representation of a part of the 5-point Likert scale response options was further examined using a PCM analysis. The ICC obtained for each SPUR item showed that the response options were not ordered in accordance with the scoring function specifications for 43 items. (Figure 2) These analyses (item-level analysis and PCM analysis) led to the recoding of 31 items into two response options and 14 items into three response options.
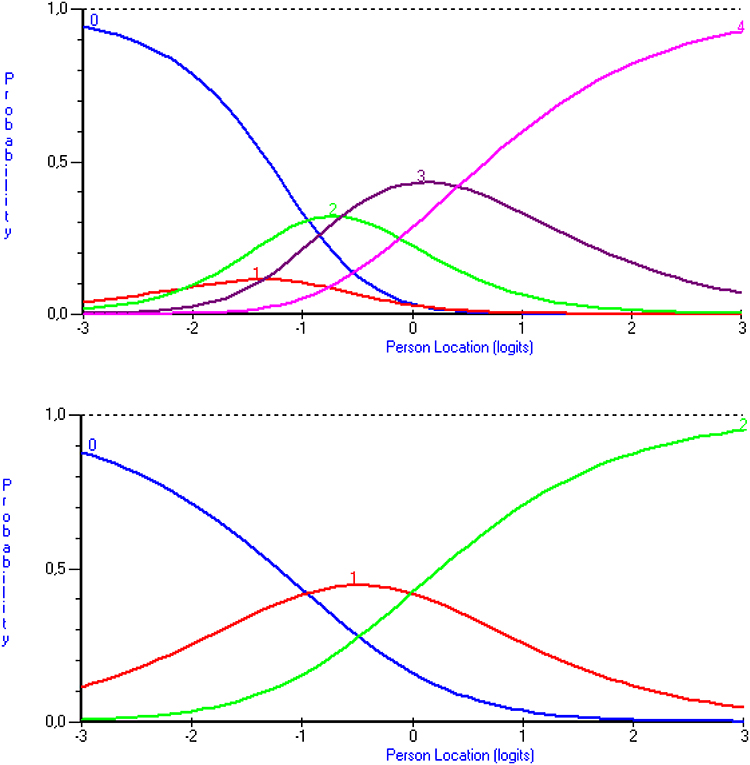 |
Figure 2 Partial credit model – item characteristics curve (ICC) plots. These curves are plots of the probability for each response options to be answered by the participants (y axis) depending on the continuum of the latent trait being measured (x axis representing the non-adherence level). Example of one SPUR item Item characteristics curve with response options not ordered in accordance with the scoring function specifications before response option recoding (First figure. SPUR Item 33 characteristics curve before response option recoding) and then reordered after response option recoding (Second figure. SPUR Item 33 characteristics curve after response option recoding). |
Furthermore, since some questions are positively worded and others negatively regarding non-adherence assessment, some items were reverse scored so that a higher item score corresponds to a higher level of non-adherence or higher barriers to adherence before proceeding with the analysis.
The examination of the person-item threshold distribution before and after the response option recoding showed a better coverage of the latent trait by the SPUR items after recoding (Figure 1).
A comparison of the correlations between the SPUR total score and the latent trait obtained on each SPUR dimension, on all SPUR items (45 items and 4 “meta” items) and on the 4 “meta” items before and after recoding showed an increase of 0.07 (for S dimension latent trait) to 0.18 (for P dimension latent trait) points after recoding (Table 2).
 |
Table 2 Spearman’S Correlation Coefficient Between the SPUR Questionnaire Total Score and the SPUR Latent Trait, the 4 “Meta” Item Latent Trait, the S Dimension Latent Trait, the P Dimension Latent Trait, the U Dimension Latent Trait and the R Dimension Latent Trait (Before Response Option Recoding and After Response Option Recoding) |
Item Selection
The PCM fit was good (Person Separation Index (PSI) of 0.78), confirming that SPUR responses reflected one underlying latent trait hypothesized as non-adherence. 24 of 45 items did not fit the PCM model (p-value (χ2) < 0.05).
Figure 1 shows the person-item map that represents the distribution of the sample on the latent trait hypothesized to be non-adherence. The person-item map indicates that the items of the SPUR tool covered the full range of the patient population distribution except the extreme left (extremely adherent patients). Furthermore, the items of the SPUR tool covered the extreme right of the person-item map (even if no patient is located at this extremity), indicating that high levels of non-adherence also can be well assessed by this tool. Respondents were mainly located on the left of the map, indicating that most were moderately to highly adherent. Items located to the right of the map are more “difficult” than those located to the left. The “easiest” items were “I am worried about the side effects of some medications” and “I live in the moment” and the most “difficult” items were “It is essential that I follow my treatment plan” and “I am able to follow my treatment plan”.
A PCM analysis was performed only on the 4 “meta” items to explore their added value in the SPUR model. The PCM fit was not good (PSI of 0.03) highlighting that no underlying latent trait existed for these 4 “meta” items. Furthermore, the correlations obtained between the SPUR total score and the 4 “meta” items latent trait were low: 0.29 before recoding and 0.41 after recoding, suggesting that the 4 “meta” items did not assess the same underlying concept than the 45 SPUR items (Table 2).
Iterative PCAs were performed to test the impact of variations in the number of factors on the scale structure. PCAs with number of factors free and then forced with defined number of factors (for instance, 4 and 5) were tested. Results from the PCA with four factors yielded the most readily interpretable dimensions for the SPUR structure and were used to define the final SPUR structure. PCA Scree Plot show that a structure of four factors was optimal. (Supplementary Materials) The PCA results led to propose a final SPUR structure made of four multi-item dimensions (Social, Psychological, Usage and Rational) close to the initial hypothesized structure which was based on the results of the qualitative interview analysis performed during the SPUR item development phase.7
Results of the multitrait analysis are shown in Table 3. The analysis revealed three items with convergent validity issue and two with divergent validity issue in the dimension P; ten items with convergent validity issue and three with divergent validity issue in the dimension R; four items with convergent validity issue and four with divergent validity issue in the dimension S; and eight items with convergent validity issue and three with divergent validity issue in the dimension U.
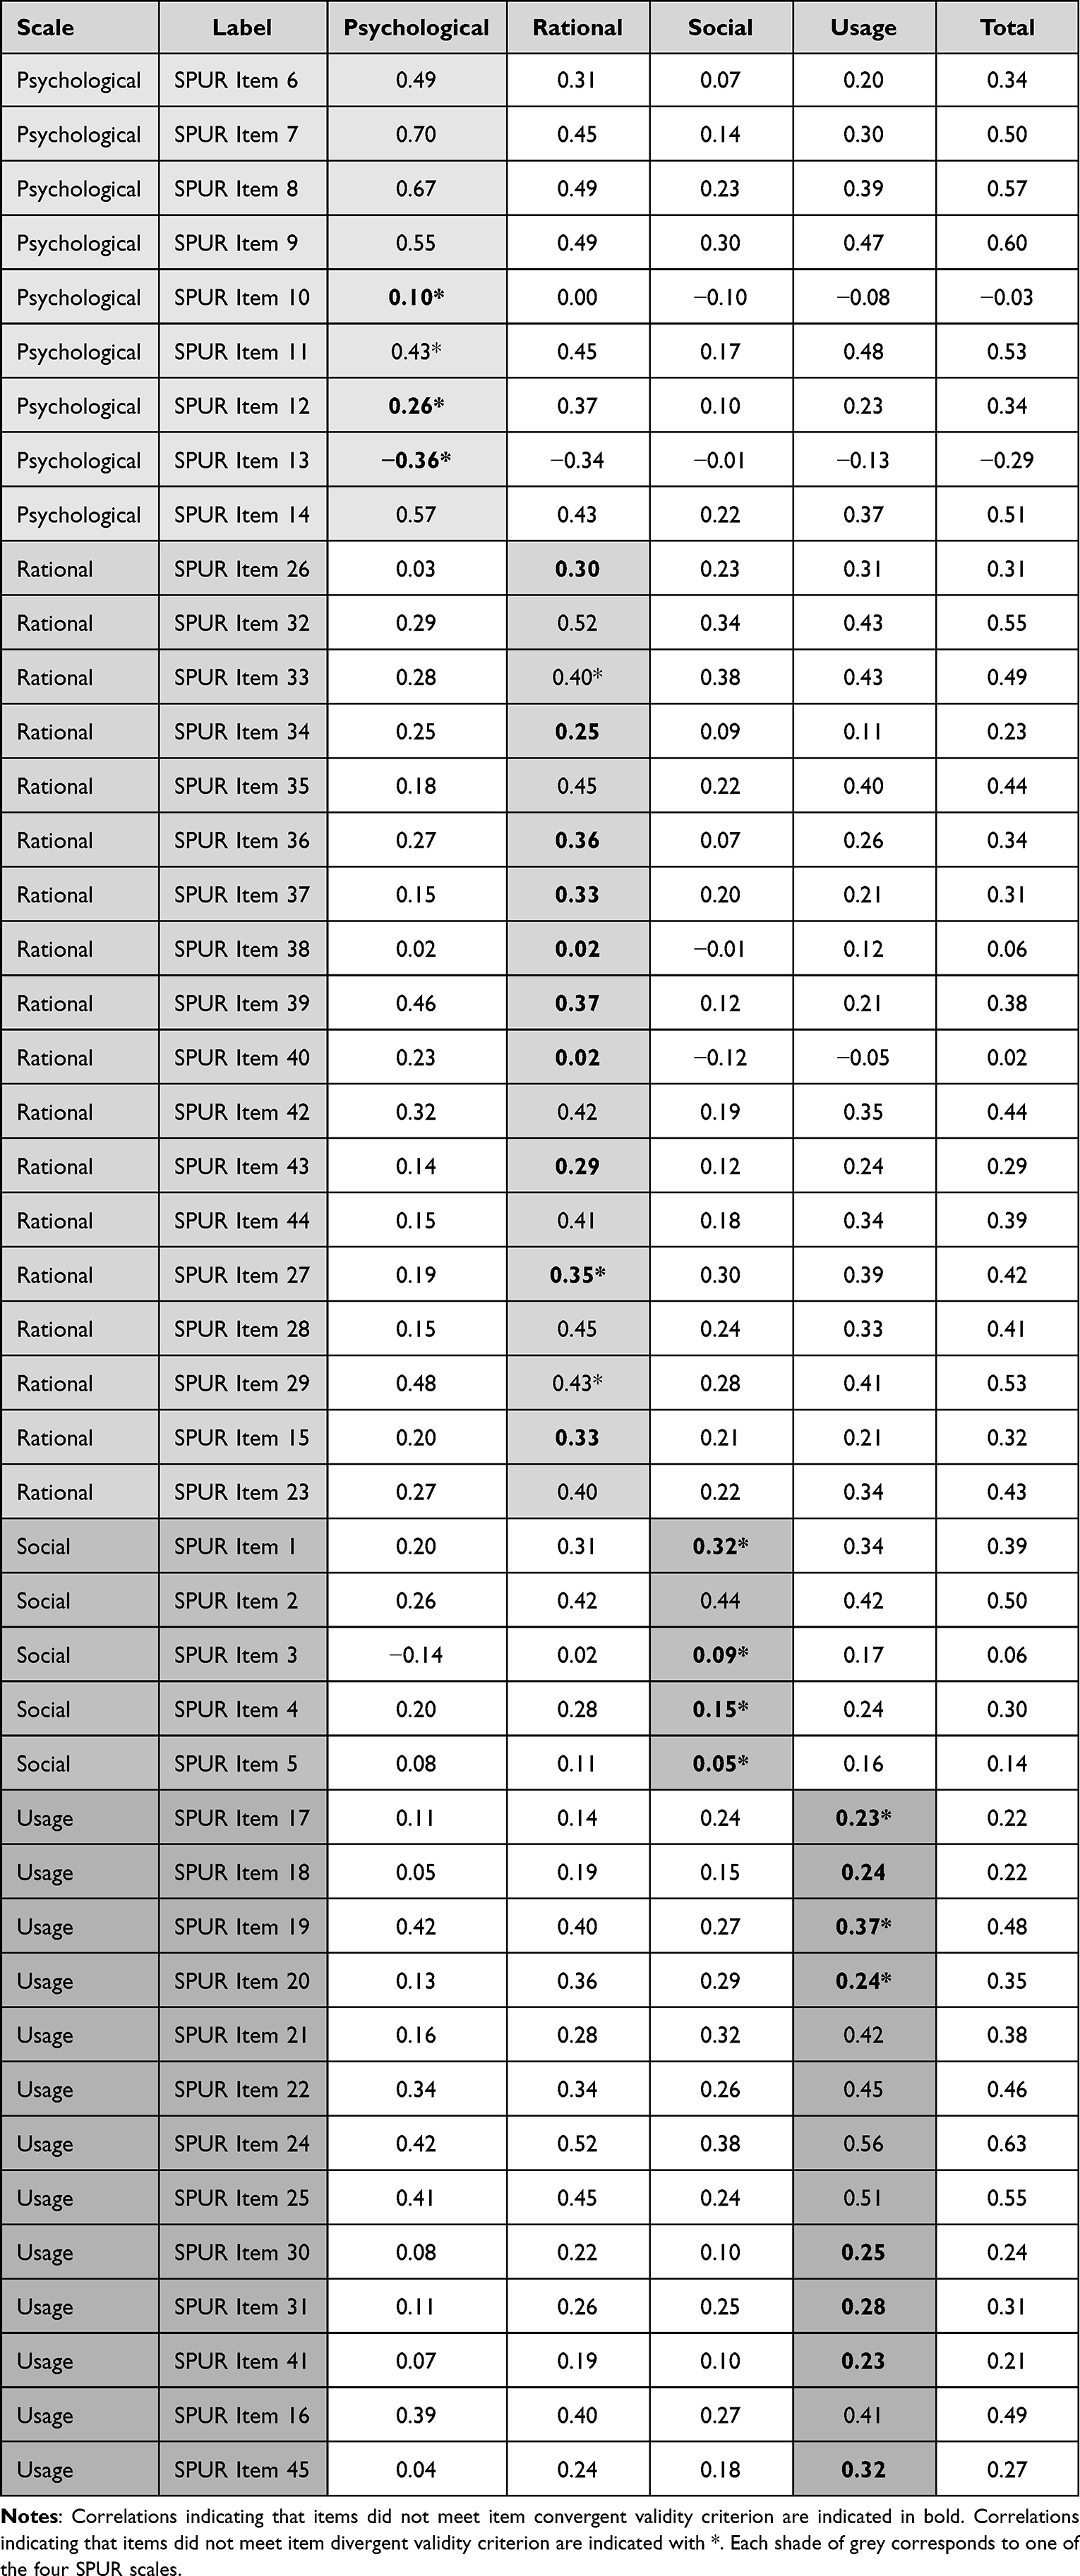 |
Table 3 Item-Scale Pearson Correlations from the Multitrait Analysis |
It was determined that the 4 “meta” items and 21 items of the SPUR initial 45 items were to be excluded based on the results of the PCM analyses, the iterative PCAs and the multitrait analysis but also the hypothetical structure of SPUR. 6 of the remaining 24 items were selected to comprise the short form: these 6 items obtained the strongest statistical results and were meaningful for experts. A further 11 items of the remaining items were added to the short form to comprise the intermediate 17-items form. Finally, a 24-items long form was developed that consisted of a further 7 items added to the intermediate version.
The short form will be used to screen patients for risk and then the other forms will allow the collection of further information to refine the risk assessment and decide the best levers for action.
Validation of SPUR Algorithm
Construct Validity
The construct validity was examined regarding concurrent and known-groups validity (see details below).
The ROC curves show that the relationship between the final algorithm score of SPUR and the latent trait was strong. (Figure 3). The 20% of patients at the highest risk for being non-adherent according to the latent trait were well discriminated using the final algorithm score of SPUR short form (AUC = 0.79), intermediate form (AUC = 0.93) and long form (AUC = 0.94).
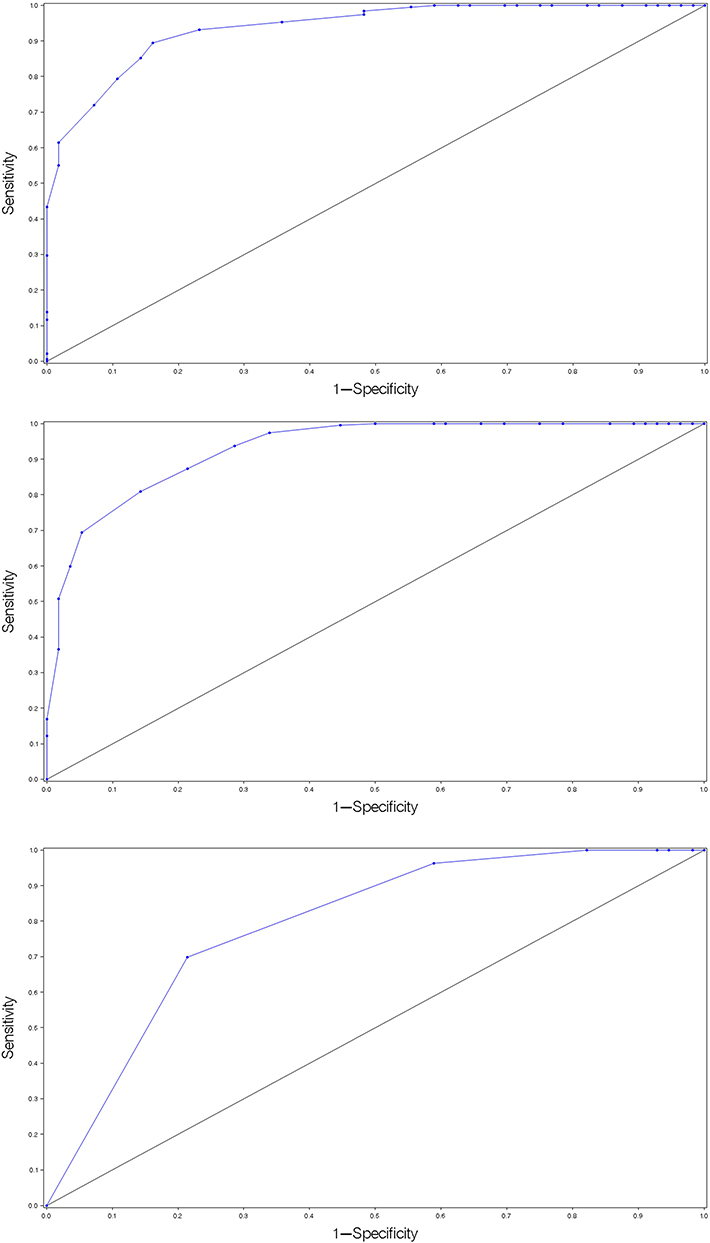 |
Figure 3 Receiver operating characteristic (ROC) curves with calculation of the area under the curve (AUC). ROC curves between SPUR short form (First figure. Receiver Operating Characteristic curve for SPUR – Social, Psychological, Usage, Rational – short form) (AUC = 0.79), intermediate form (Second figure. Receiver Operating Characteristic curve for SPUR – Social, Psychological, Usage, Rational – intermediate form) (AUC = 0.93), long form (Third figure. Receiver Operating Characteristic curve for SPUR – Social, Psychological, Usage, Rational – long form) (AUC = 0.94) total score and all SPUR item latent trait using a threshold of −1 on the latent trait for the 20% of patients the most at risk of being non-adherent. |
Concurrent Validity
As presented in Table 4, the final algorithm score of the three SPUR forms presented statistically significant correlations of medium to high size with all selected concurrent scales, as expected as these instruments measure related but distinct concepts. The highest correlations were obtained between the BMQ concern score and the SPUR intermediate and long form final algorithm scores (0.55 for both). Correlations between the final algorithm scores of the three SPUR forms and the latent trait were high (0.68, 0.86 and 0.87 for the short form, the intermediate form and the long form, respectively). Correlations between the final algorithm score of the three SPUR forms and both the MPR and the HbA1c were small and non-significant.
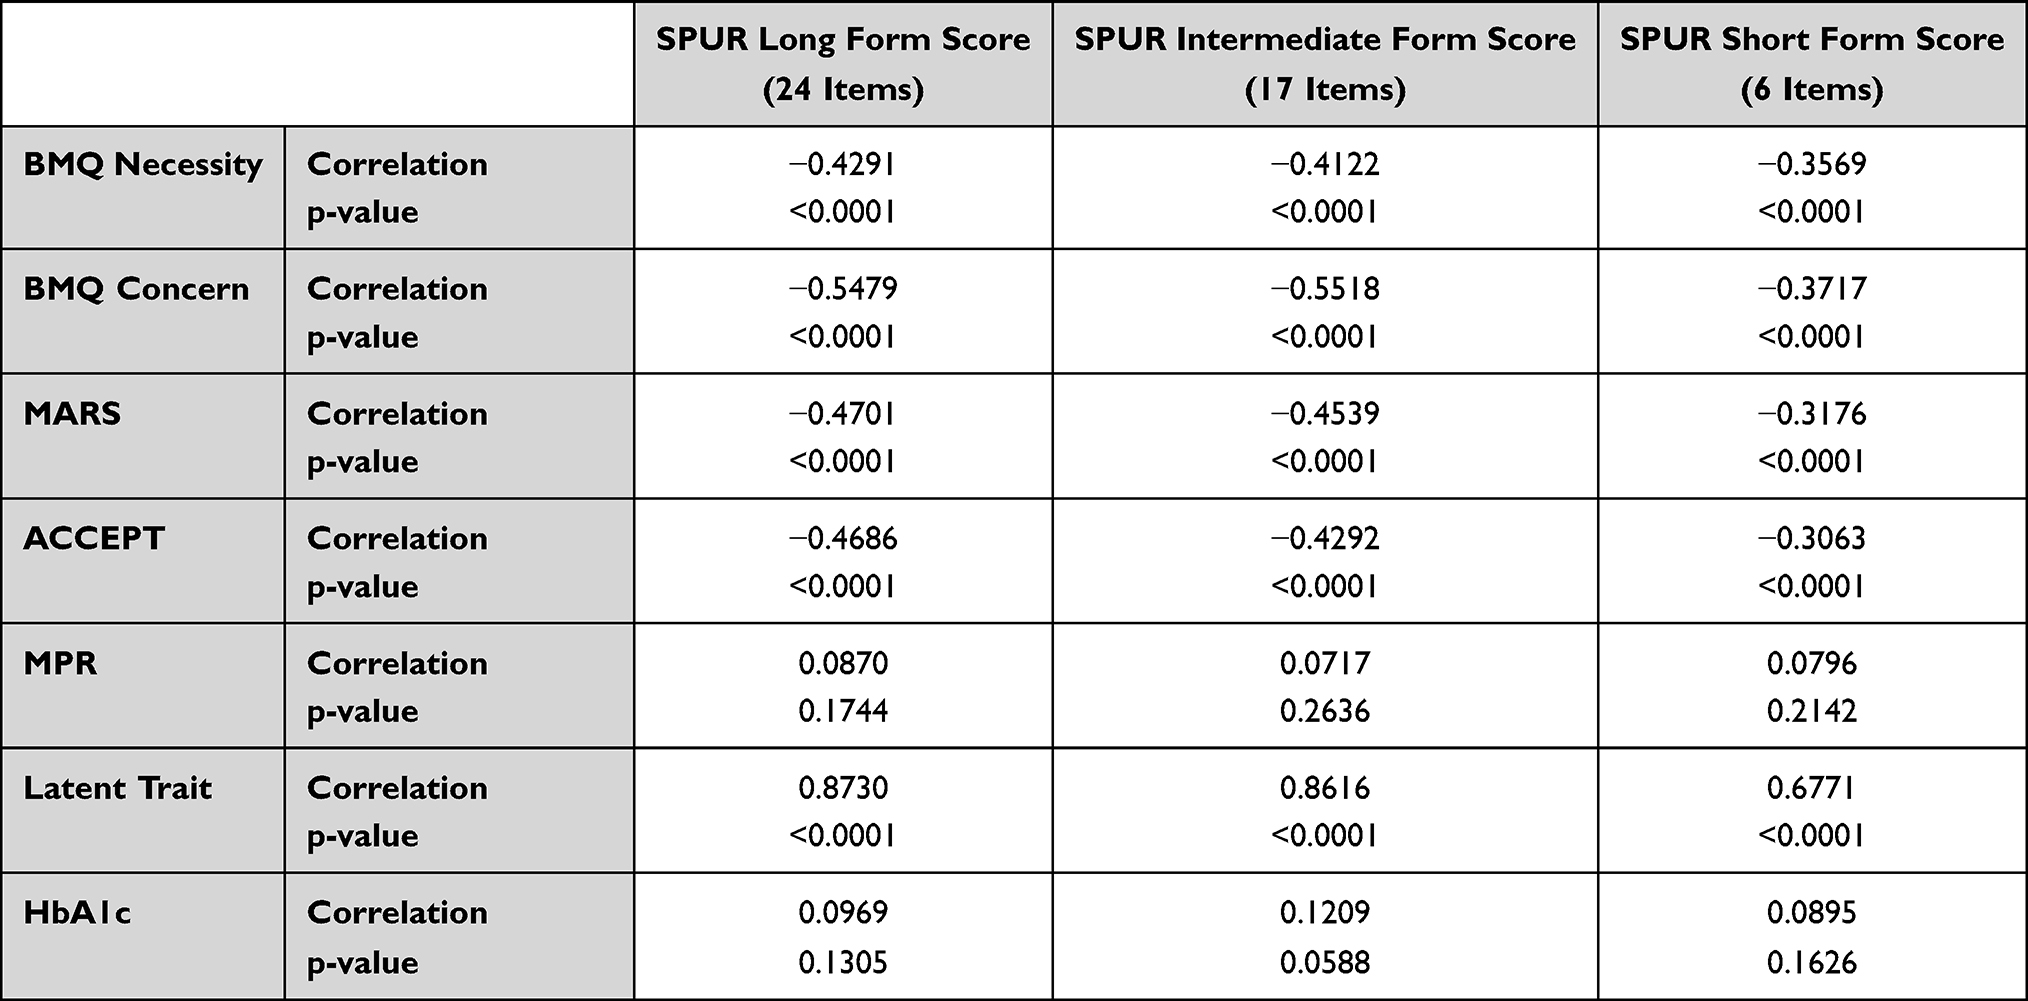 |
Table 4 Spearman Correlation Coefficient (“Correlation” in the Table) Between the Final Algorithm Score of SPUR and the MARS Total Score, the ACCEPT General Acceptance Dimension Score, the BMQ Dimension Scores, the Latent Trait Provided by PCM Analysis, MPR and HbA1c (Glycated Hemoglobin, Average Blood Glucose Levels for the Last Two to Three Months) |
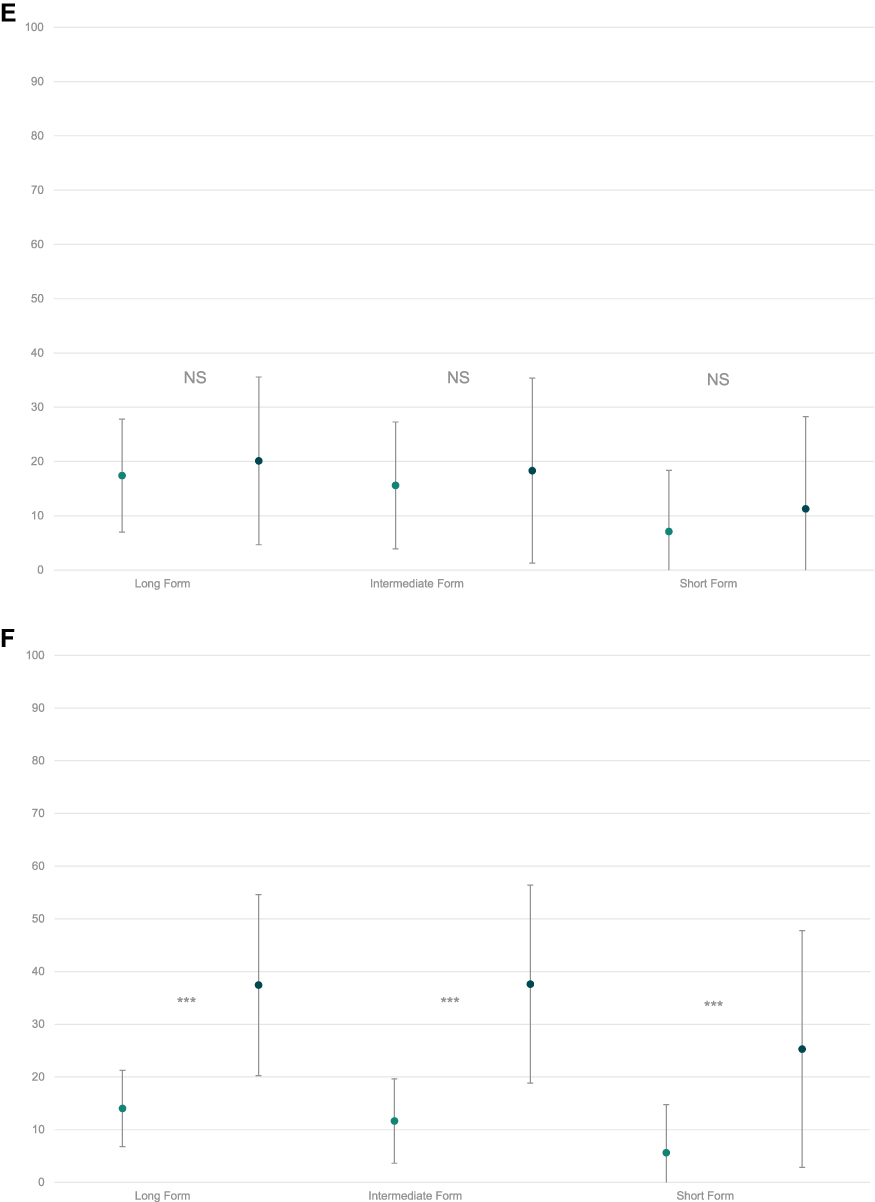
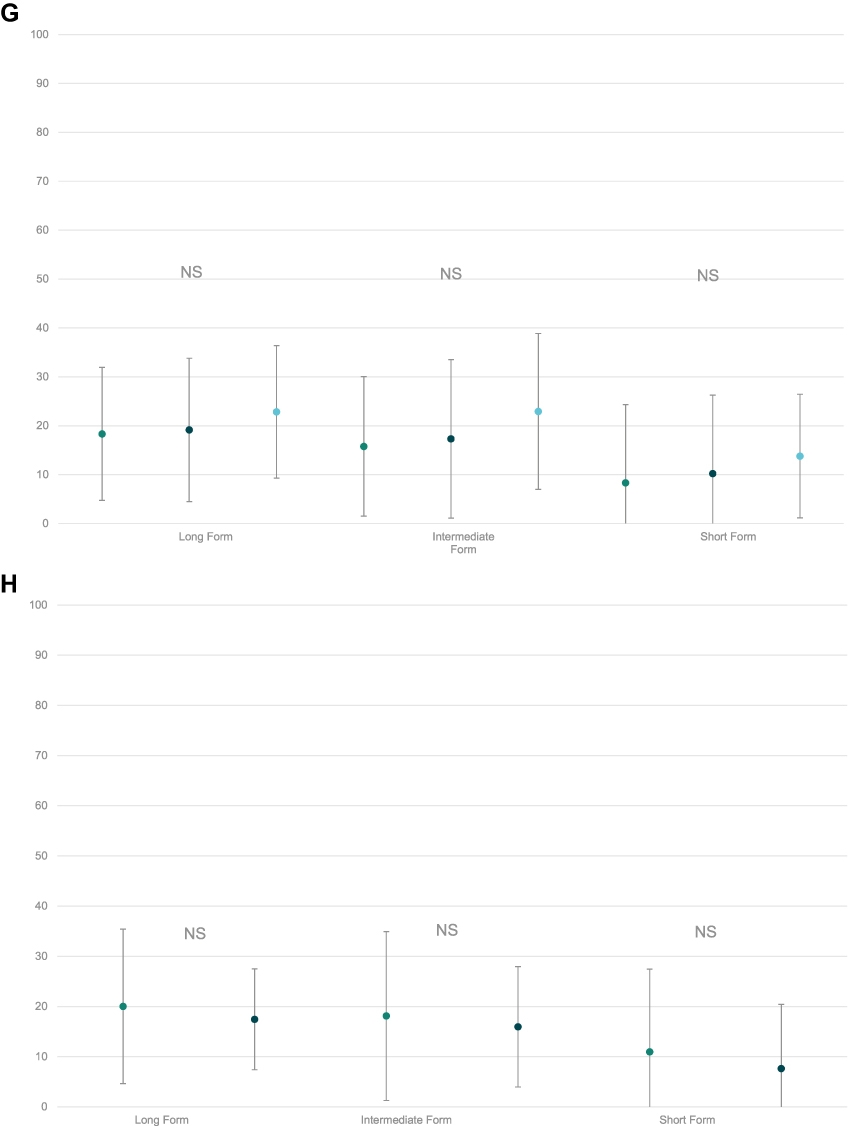
Known-Groups Validity
The three forms of SPUR demonstrated a good ability to discriminate between different groups expected to present different levels of adherence as shown in Figure 4. Patients with a low MPR (< 80%), poor glycated hemoglobin (HbA1c ≥ 9), comorbidities, high latent trait (≥ −1), low ACCEPT General Score (≤ 50), low MARS score (< 7), low BMQ Necessity score (< 18) and low BMQ Concern score (< 13) presented a logical pattern of higher means in SPUR scores. Highly significant between-groups differences (p < 0.001) were obtained for the three SPUR form score means of the groups based on: latent traits, ACCEPT General Scores, MARS scores, BMQ Necessity scores and BMQ Concern scores. Figure 4 Continued. Figure 4 Continued. Figure 4 Continued. Figure 4 Known-groups validity. Mean (standard deviation) SPUR short form, intermediate form, long form total scores by (A) the Beliefs about Medicine Questionnaire BMQ necessity score groups (BMQ necessity <18 vs BMQ necessity ≥18) (First figure. Known-groups validity between the Beliefs about Medicine Questionnaire (BMQ) necessity score groups), (B) the Beliefs about Medicine Questionnaire (BMQ) concern score groups (BMQ concern <13 vs BMQ concern ≥13) (Second figure. Known-groups validity between the Beliefs about Medicine Questionnaire (BMQ) Concern score groups), (C) the Medication Adherence Rating Scale (Mars) total score groups (Mars total score <7 vs Mars total score ≥7) (Third figure. Known-groups validity between the Medication Adherence Rating Scale (Mars) total score groups), (D) the Acceptance by the Patients of their Treatment (ACCEPT) general score groups (ACCEPT general score ≤50 vs ACCEPT general score >50) (Fourth figure. Known-groups validity between the acceptance by the patients of their treatment (ACCEPT) general score groups), (E) Medication Possession Ratio (MPR) groups (MPR <80 vs MPR ≥80) (Fifth figure. Known-groups validity between Medication Possession Ratio (MPR) groups), (F) latent trait groups (latent trait <-1 vs latent trait ≥-1) (Sixth figure. Known-groups validity between latent trait groups), (G) HbA1c (glycated hemoglobin, average blood glucose levels for the last two to three months) groups (HbA1c ≤6 vs HbA1c]6;9[vs HbA1c ≥9) (Seventh figure. Known-groups validity between HbA1c (glycated hemoglobin, average blood glucose levels for the last two to three months) groups) and (H) Comorbidities groups (presence of comorbidities vs absence of comorbidities) (Eight figure. Known-groups validity between comorbidities groups). p-value from t-test for between-group comparisons when two groups, from ANOVA when more than two groups, NS non significant, *** p ≤ 0.001.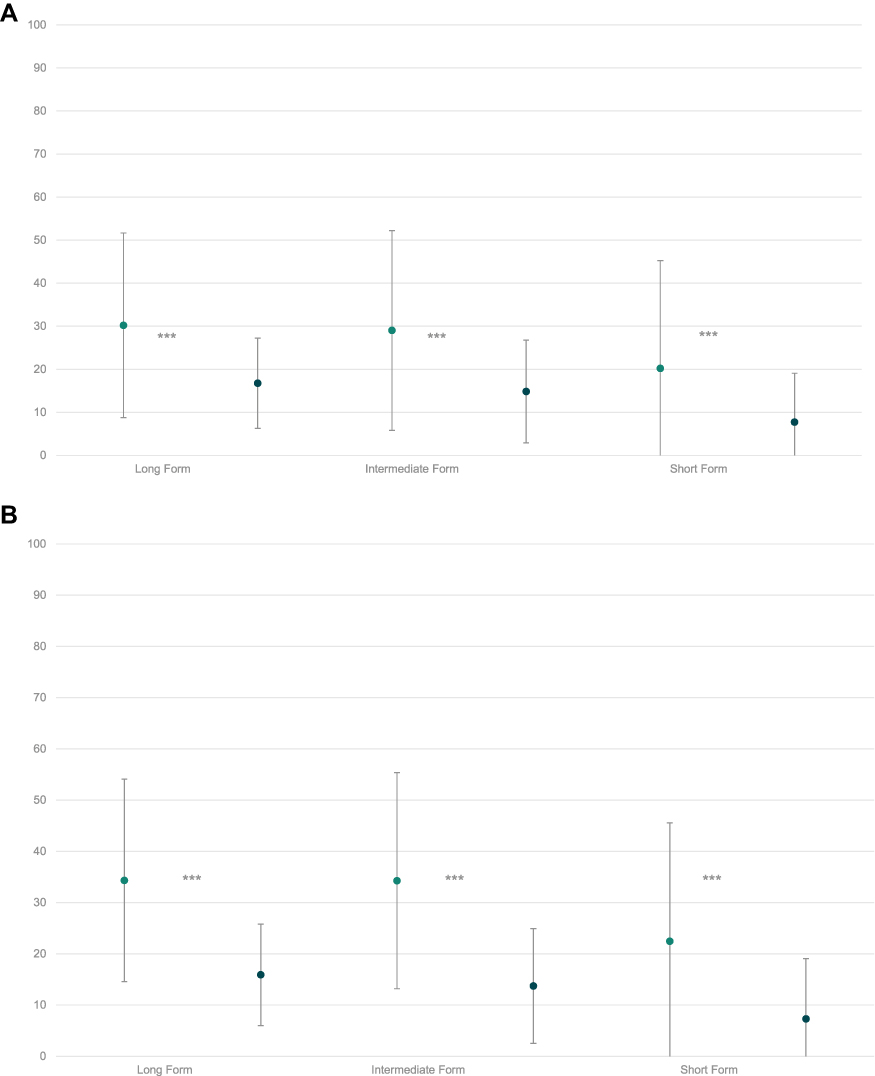
Discussion
This study has allowed a refinement of the SPUR tool initially examined in the US population via 245 patients with type 2 diabetes in France.6 An analysis of SPUR item response option distribution and SPUR item response option ordering using ICC provided by Rasch modelling led to recode 31 items into two response options, and a further 14 into three response options. This recoding allowed a better discrimination of patients on the latent trait and increased correlations between the SPUR total score and the latent traits, both the global latent trait – corresponding to non-adherence – and the latent trait of each dimension in the SPUR framework.
Analysis of the scale structure using PCA and the item fit statistics along with Rasch modelling using item location and fit has led to eliminating 21 items from the tool, along with the four “meta” items. The remaining items can be structured into three different versions of SPUR: a short form, consisting of six items; an intermediate form, consisting of a further 11 items added to the short version; and a long form, consisting of a further 7 items added to the intermediate version. The short, intermediate and long forms and also the initial 45 items of the SPUR tool are available for consultation (Supplementary Materials). Copyright permission for SPUR 24 questionnaire was granted by Observia.
Results from the psychometric analysis were supportive of the validity of the SPUR tool in assessing the risk of non-adherence and its drivers. ROC curves supported the construct validity of the short, intermediate and long forms while the concurrent validity of the three forms was demonstrated:
- All three versions of SPUR were highly correlated with the latent trait.
- Both the intermediate and the long forms displayed high correlations with the BMQ Concern score.
- The short form showed moderate correlations with the BMQ Concern score.
- All three forms were moderately correlated with the BMQ Necessity score, the MARS score and the ACCEPT General score.
The analysis allows validation of the SPUR tool as a predictor of patient adherence given the following evidence:
- Patients with a low MPR (< 80%), poor glycated hemoglobin (HbA1c ≥ 9), comorbidities, high latent trait (≥ −1), low ACCEPT General Score (≤ 50), low MARS score (< 7), low BMQ Necessity score (< 18) and low BMQ Concern score (< 13) presented a logical pattern of higher means in SPUR scores.
- Highly significant between-group differences (p < 0.001) were obtained for the three SPUR form score means of the groups based on: latent traits, ACCEPT General scores, MARS scores, BMQ Necessity scores and BMQ Concern scores.
Note at the same time that none of the SPUR measures, nor the BMQ, MARS and ACCEPT measures were significantly correlated with MPR. As all three of the other measures have been correlated with measures of adherence in other studies,25 and as the MPR in the study group was unexpectedly high, we believe that this is due to the lack of variance across MPR in the study group, largely a function both of an unbalanced selection in the study sample with patients more adherent than in general population and the relatively short period of time over which MPR was measured (six months).
The high correlation of a recoded result of the short version of SPUR with the latent trait allows for accurate assessment of adherence risk via a short questionnaire of simply six items. The intermediate and long versions can then be used to provide a dynamic questionnaire to patients who are at risk in order to assess which of the behavioral drivers in the SPUR framework are prevalent for the patient. The ROC curve built using the short form total score demonstrated that the short form provides sufficient information to accurately discriminate the patient at risk for non-adherence with good sensitivity and specificity. This is preferable, in this case, to classify an adherent patient as non-adherent because the classification is then finalized using the intermediate and long forms of SPUR. Indeed, the items added by the intermediate and the long forms allow the refinement of adherence classification and greatly decreases the risk of error (AUC = 0.94 for the SPUR long form). The level of accuracy of the assessment provided by the short form can be explained by the strong methodology used to develop the SPUR tool but also by the use of Rasch modelling to finalize and validate the SPUR tool. Indeed, one of the specific properties of Rasch modelling is to allow consistent estimation of the parameters associated with the latent trait independently from the items used for these estimations. In other words, even if some patients do not respond to all items, estimates of the latent trait parameters are unbiased.26–31
Using the CTT and the Rasch modelling approaches together to finalize and validate the SPUR tool allowed combining the assets of the two methods. While the CTT aims to explore the questionnaire structure, the Rasch analysis assesses the existence of an underlying latent trait and examines finely the information contained in the items and their contribution to the latent trait. Rasch analysis remains underused, perhaps because the disadvantage of Rasch modelling lies in the complexity of scoring it, which makes its use in paper-based tools difficult and hence, practically unusable. This is not a disadvantage for SPUR since we are focusing on DATs. For this reason, this approach is specifically well adapted to a validation of an instrument like the SPUR.
Limitations
While useful to examine the validity of the SPUR questionnaire in assessing non-adherence behavior, the study has a number of limitations.
First, although the SPUR questionnaire was designed to be universal, the study was conducted in only one disease, type 2 diabetes, one country, France, and one language, French.
Second, in few cases, a bit of precision was lost when going from 17 items (SPUR intermediate form) to 24 items (SPUR long form) in terms of correlations (Table 4). This is the case for HbA1c. It is possible that this is indicative of the non-significance of the correlations, but we believe it is more a function of how the long form was established. Certain items (items 13 and 42) were included in the long form in order to better examine specific behavioral drivers according to the SPUR theoretical framework, even though their statistical properties were not convincing.
Lastly, there is a limitation in terms of how MPR data was gathered. MPR was calculated over the six-month period prior to the questionnaires’ administration, using disbursement data. The data was gathered by physicians during patient visits, who accessed the patients’ disbursement records via France’s electronic health records. This introduces selection bias, as only patients who had made the effort to visit their physicians were included. Furthermore, many of the medications studied were disbursed in 3-month packs, thereby reducing the potential for variability over the short period studied. Furthermore, this approach precluded the measurement of discontinuation and non-initiation, as defined by the ABC taxonomy.32 As such, any observed variance in MPR is indicative purely of poor implementation and patients who have not initiated treatment or have discontinued it are not included. This is a common problem in research about adherence and is a function of how patients are typically recruited.
Conclusions
SPUR is a valid tool to evaluate the risk of non-adherence of patients. Results can facilitate effective behavioral interventions by providing insights into the individual reasons for lack of adherence. Its use of Rasch modelling allows it to be adapted to each patient so as to reduce testing burden while generating reliable, useful information. Patients can be screened via the short form, and those deemed at risk can then be taken through the relevant items in the intermediate form, while the relevant items in the long form can then be applied as needed to identify exactly which of the behavioral drivers are at work in the patient’s decision-making process. While the scoring of such a tool is too involved to be applied in a paper-based setting, in the context of a DAT, SPUR allows an effective behavioral diagnosis to then drive the relevant choice of content and intensity of intervention.
While the tool was designed to be agnostic to pathology and culture, further research is needed to confirm its diagnostic validity in other pathologies and other countries. Furthermore, as more data are collected across different patient groups, we hope to explore in more detail the interplay between the different drivers outlined in the SPUR framework and the items in the SPUR questionnaire. Hopefully, further research can include patients recruited in such a way to reduce selection bias and to capture those who do not initiate treatment or who discontinue it. We strongly believe that the latent trait uncovered in the SPUR research does correlate to overall adherence, but it will require further research to examine this and to explore whether different elements of SPUR results can be correlated to the three types of non-adherence (primary non-adherence or non-fulfillment adherence, non-persistence, and non-conforming), not just to implementation.33 In so doing, it is possible that further insights into the types of patient behavior and their drivers be identified and affected.
Data Sharing Statement
The data sets analyzed during this study are available from the corresponding author on reasonable request.
Acknowledgments
The authors would like to thank all patients, general practitioners and diabetologists who contributed to this study work, as well as Hanna Rebibo Seror, who was instrumental in managing the data collection process.
Funding
This study was funded by Observia.
Disclosure
KD and GH are employees of Observia. BA, EdB and TV are employees of ICON plc which was paid by Observia to carry out this research. In addition, BA has a patent “Accept Questionnaire” licensed to ICON. GR reports personal fees from Several Pharma groups, outside the submitted work. The authors report no other conflicts of interest in this work.
References
1. Sabate E. Adherence to Long-Term Therapies: Evidence for Action. Geneva, Switzerland: World Health Organization; 2003. Available from: https://www.who.int/chp/knowledge/publications/adherence_full_report.pdf.
2. Dolgin K. The SPUR model: a framework for considering patient behavior. Patient Prefer Adherence. 2020;14:97–105. doi:10.2147/PPA.S237778
3. Green EC, Murphy E. Health belief model. In: Cockerham WC, Dingwall R, Quah S, editors. The Wiley Blackwell Encyclopedia of Health, Illness, Behavior, and Society. Chichester UK: John Wiley & Sons, Ltd; 2014:766–769. doi:10.1002/9781118410868.wbehibs410
4. Falissard B. Mesurer la subjectivité en santé: Perspective méthodologique et statistique. [Assess the subjectivity in health: Methodological and statistic perspective]. Masson; 2001.
5. Fayers PM, Machin D. Quality of Life: The Assessment, Analysis and Interpretation of Patient-Reported Outcomes. Wiley; 2013.
6. Boone WJ. Rasch analysis for instrument development: why, when, and how? CBE Life Sci Educ. 2016;15(4):rm4. doi:10.1187/cbe.16-04-0148
7. de Bock E, Dolgin K, Arnould B, Hubert G, Lee A, Piette JD. The SPUR adherence profiling tool: preliminary results of algorithm development. Curr Med Res Opin. 2021;38:171–179. doi:10.1080/03007995.2021.2010437
8. Thompson K, Kulkarni J, Sergejew AA. Reliability and validity of a new Medication Adherence Rating Scale (MARS) for the psychoses. Schizophr Res. 2000;42(3):241–247. doi:10.1016/S0920-9964(99)00130-9
9. Horne R, Weinman J, Hankins M. The beliefs about medicines questionnaire: the development and evaluation of a new method for assessing the cognitive representation of medication. Psychol Health. 1999;14(1):1–24. doi:10.1080/08870449908407311
10. Arnould B, Gilet H, Patrick DL, Acquadro C. Item reduction, scoring, and first validation of the ACCEPTance by the patients of their treatment (ACCEPT©) questionnaire. patient. 2017;10(1):81–92. doi:10.1007/s40271-016-0187-7
11. Marant MC, Longin J, Gauchoux R, et al. Long-term treatment acceptance: What is it, and How can it be assessed? Patient. 2012;5:239–249. doi:10.1007/BF03262496
12. Marant Micallef C, Spizak C, Longin J, et al. Development of the ACCEPT (c) questionnaire to assess acceptability of long term treatments: qualitative steps. Value Health. 2009;12:A400.
13. Jackson SL. Research Methods and Statistics: A Critical Thinking Approach. Cengage Learning; 2015.
14. Bjorner JBWJE. Using Modern Psychometric Methods to Measure Health Outcomes. Medical Outcomes Trust; 1998.
15. Embretson SE, Reise SP. Item Response Theory for Psychologists. Mahwah, NJ, US: Lawrence Erlbaum Associates Publishers; 2000:xi, 371–xi.
16. Rasch G. Probabilistic Models for Some Intelligence and Attainment Tests. University of Chicago Press; 1980.
17. Verhelst ND. Testing the unidimensionality assumption of the Rasch model; 2001.
18. Engelhard JG. Invariant Measurement: Using Rasch Models in the Social, Behavioral, and Health Sciences. New York, NY, US: Routledge/Taylor & Francis Group; 2013:xxi, 288–xxi.
19. FDA. Guidance for industry on patient-reported outcome measures: use in medical product development to support labeling claims. Fed Regist. 2009;74(235):65132–65133.
20. Hu L-T, Bentler PM. Cutoff criteria for fit indexes in covariance structure analysis: conventional criteria versus new alternatives. Struct Equ Modeling. 1999;6(1):1–55. doi:10.1080/10705519909540118
21. O’Bryant SE, Waring SC, Cullum CM, et al. Staging dementia using clinical dementia rating scale sum of boxes scores: a Texas Alzheimer’s research consortium study. Arch Neurol. 2008;65(8):1091–1095. doi:10.1001/archneur.65.8.1091
22. Siddiqui MA, Pattojoshi A, Khess CRJ. Factors affecting adherence in patients with schizophrenia. Int J Adv Med. 2016;3(1):25–32. doi:10.18203/2349-3933.ijam20151483
23. Corréard N, Consoloni J-L, Raust A, et al. Neuropsychological functioning, age, and medication adherence in bipolar disorder. PLoS One. 2017;12(9):e0184313. doi:10.1371/journal.pone.0184313
24. Hallit S, Haddad C, Sacre H, et al. Medication adherence among Lebanese adult patients with hypothyroidism: validation of the Lebanese medication adherence scale and correlates. Clin Epidemiology Glob Health. 2021;9:196–201. doi:10.1016/j.cegh.2020.08.014
25. Lin C-Y, Ou H-T, Nikoobakht M, Broström A, Årestedt K, Pakpour AH. Validation of the 5-item medication adherence report scale in older stroke patients in Iran. J Cardiovasc Nurs. 2018;33(6):536–543.
26. Fischer GHMIW. Rasch Models: Foundations, Recent Developments, and Application. New York: Springer; 1995.
27. Baker F, Kim S. Item Response Theory: Parameter Estimation Techniques. CRC press; 2004.
28. de Bock E, Hardouin JB, Blanchin M, et al. Rasch-family models are more valuable than score-based approaches for analysing longitudinal patient-reported outcomes with missing data. Stat Methods Med Res. 2016;25(5):2067–2087. doi:10.1177/0962280213515570
29. de Bock E, Hardouin JB, Blanchin M, Le Neel T, Kubis G, Sébille V. Assessment of score- and Rasch-based methods for group comparison of longitudinal patient-reported outcomes with intermittent missing data (informative and non-informative). Qual Life Res. 2015;24(1):19–29. doi:10.1007/s11136-014-0648-1
30. de Gruijter DNM, van der Kamp LJT. Statistical Test Theory for the Behavioral Sciences. CRC Press; 2007.
31. Andrich D. A rating formulation for ordered response categories. Psychometrika. 1978;43(4):561–573. doi:10.1007/BF02293814
32. Vrijens B, De Geest S, Hughes DA, et al. A new taxonomy for describing and defining adherence to medications. Br J Clin Pharmacol. 2012;73(5):691–705. doi:10.1111/j.1365-2125.2012.04167.x
33. Beena J, Jose J. Patient medication adherence: measures in daily practice. Oman Med J. 2011;26(3):155–159. doi:10.5001/omj.2011.38
 © 2022 The Author(s). This work is published and licensed by Dove Medical Press Limited. The full terms of this license are available at https://www.dovepress.com/terms.php and incorporate the Creative Commons Attribution - Non Commercial (unported, v3.0) License.
By accessing the work you hereby accept the Terms. Non-commercial uses of the work are permitted without any further permission from Dove Medical Press Limited, provided the work is properly attributed. For permission for commercial use of this work, please see paragraphs 4.2 and 5 of our Terms.
© 2022 The Author(s). This work is published and licensed by Dove Medical Press Limited. The full terms of this license are available at https://www.dovepress.com/terms.php and incorporate the Creative Commons Attribution - Non Commercial (unported, v3.0) License.
By accessing the work you hereby accept the Terms. Non-commercial uses of the work are permitted without any further permission from Dove Medical Press Limited, provided the work is properly attributed. For permission for commercial use of this work, please see paragraphs 4.2 and 5 of our Terms.