")
Back to Archived Journals » Hypoxia » Volume 4
Fifteen days of 3,200 m simulated hypoxia marginally regulates markers for protein synthesis and degradation in human skeletal muscle
Authors D'Hulst G, Ferri A, Naslain D, Bertrand L, Horman S, Francaux M, Bishop D, Deldicque L
Received 23 November 2015
Accepted for publication 24 December 2015
Published 3 March 2016 Volume 2016:4 Pages 1—14
DOI https://doi.org/10.2147/HP.S101133
Checked for plagiarism Yes
Review by Single anonymous peer review
Peer reviewer comments 3
Editor who approved publication: Prof. Dr. Dörthe Katschinski
Gommaar D'Hulst,1 Alessandra Ferri,2,3 Damien Naslain,4 Luc Bertrand,5 Sandrine Horman,5 Marc Francaux,4 David J Bishop,2 Louise Deldicque1,4
1Department of Kinesiology, Exercise Physiology Research Group, FaBeR, KU Leuven, Leuven, Belgium; 2Institute of Sport, Exercise and Active Living (ISEAL), Victoria University, Melbourne, Australia; 3Department of Health Sciences, University of Milano-Bicocca, Monza, Italy; 4Institute of Neuroscience, Université catholique de Louvain, Louvain-la-Neuve, 5Institut de Recherche Expérimentale et Clinique, Pôle de Recherche Cardiovasculaire, Université catholique de Louvain, Brussels, Belgium
Abstract: Chronic hypoxia leads to muscle atrophy. The molecular mechanisms responsible for this phenomenon are not well defined in vivo. We sought to determine how chronic hypoxia regulates molecular markers of protein synthesis and degradation in human skeletal muscle and whether these regulations were related to the regulation of the hypoxia-inducible factor (HIF) pathway. Eight young male subjects lived in a normobaric hypoxic hotel (FiO2 14.1%, 3,200 m) for 15 days in well-controlled conditions for nutrition and physical activity. Skeletal muscle biopsies were obtained in the musculus vastus lateralis before (PRE) and immediately after (POST) hypoxic exposure. Intramuscular hypoxia-inducible factor-1 alpha (HIF-1α) protein expression decreased (−49%, P=0.03), whereas hypoxia-inducible factor-2 alpha (HIF-2α) remained unaffected from PRE to POST hypoxic exposure. Also, downstream HIF-1α target genes VEGF-A (−66%, P=0.006) and BNIP3 (−24%, P=0.002) were downregulated, and a tendency was measured for neural precursor cell expressed, developmentally Nedd4 (−47%, P=0.07), suggesting lowered HIF-1α transcriptional activity after 15 days of exposure to environmental hypoxia. No difference was found on microtubule-associated protein 1 light chain 3 type II/I (LC3b-II/I) ratio, and P62 protein expression tended to increase (+45%, P=0.07) compared to PRE exposure levels, suggesting that autophagy was not modulated after chronic hypoxia. The mammalian target of rapamycin complex 1 pathway was not altered as Akt, mammalian target of rapamycin, S6 kinase 1, and 4E-binding protein 1 phosphorylation did not change between PRE and POST. Finally, myofiber cross-sectional area was unchanged between PRE and POST. In summary, our data indicate that moderate chronic hypoxia differentially regulates HIF-1α and HIF-2α, marginally affects markers of protein degradation, and does not modify markers of protein synthesis or myofiber cross-sectional area in human skeletal muscle.
Keywords: HIF-1α, hypoxia, autophagy, mTORC1
Introduction
Hypoxia, a state of lowered oxygen tension, can have opposite effects on the regulation of muscle mass according to its duration.1 While acute and intermittent hypoxia can favor muscle hypertrophy,2 chronic hypoxia generally leads to a loss of muscle mass. Several studies in hikers3,4 and subjects exposed to simulated chronic hypoxia,5 but not all,6,7 report reductions in skeletal muscle fiber cross-sectional area (CSA). As chronic hypoxia often induces decreased physical activity and appetite and is usually related to cold temperatures, it is difficult to know which factors contribute to hypoxia-induced loss of muscle mass. Nevertheless, animal studies using pair-fed groups to account for the restricted energy intake in hypoxia still find reductions in skeletal muscle CSA or muscle weight after hypoxia,8–10 suggesting hypoxia per se can cause skeletal muscle atrophy.
Muscle mass is regulated by the balance between protein synthesis and protein breakdown.11 Long-term disruption of this equilibrium can promote muscle hypertrophy or atrophy. The mammalian target of rapamycin complex 1 (mTORC1) is a master regulator of protein synthesis coordinating upstream signals from growth factors, intracellular energy levels, and amino acid availability to promote cell growth.12 mTORC1 phosphorylates S6 kinase 1 (S6K1) and 4E-binding protein 1 (4E-BP1) to promote translation initiation and elongation.13 Severe hypoxia suppresses mTORC1 via various pathways.14 As a result of prolonged hypoxic stress, (AMP + ADP)/ATP ratio increases, activating AMP-activated protein kinase (AMPK).15 Once activated, AMPK phosphorylates the tuberous suppressor complex 2 (TSC2)16 and regulatory-associated protein of mTOR,17 leading to mTORC1 inhibition. Furthermore, low oxygen levels increase the expression of a small molecule called regulated in development and DNA damage responses 1 (REDD1) through stabilization of the transcription factor hypoxia-inducible factor-1 alpha (HIF-1α). An increase in REDD1 expression has been associated with an activation of TSC218 and a dephosphorylation of Akt,19 both leading to a decreased mTORC1 signaling.
Compared with protein synthesis, the regulation of protein degradation by hypoxia has been much less studied. In skeletal muscle, the ubiquitin-proteasome system and autophagy-lysosomal system are two main proteolytic pathways.20 The mRNA level of the two muscle-specific E3 ligases, muscle RING-finger protein-1 (MuRF-1) and muscle atrophy F box (MAFbx), has been shown to be increased after both acute and chronic hypoxia.21–23 In addition, short-term hypoxia could increase the autophagic flux in human skeletal muscle as an increase in microtubule-associated protein 1 light chain 3 type II/I (LC3b-II/I) ratio, together with a decrease in P62 expression, were measured after 8-hour exposure to environmental hypoxia.24
Protein turnover is determined not only by protein synthesis and degradation but also by cell turnover, namely, the addition of new myonuclei through satellite cell fusion and the loss of myonuclei through nuclear apoptosis.25 The activation and differentiation of satellite cells is mainly regulated by a family of factors called myogenic regulatory factors (MRFs).26 While hypoxia promotes satellite cell proliferation in vitro,27 it is not known whether this is the case in vivo and what the molecular mechanisms are.
While chronic hypoxia can lead to a loss of muscle mass, the molecular mechanisms are far from being defined. Therefore, the purpose of the present study was to quantify markers of protein synthesis and degradation as well as markers of cell turnover before and after 15 days of exposure to environmental hypoxia. To decrease the influence of confounding factors, physical activity, temperature, and nutritional intake were monitored and controlled throughout the experiment. Based on in vitro and animal studies, we hypothesized that chronic hypoxia would inhibit the mTORC1 pathway and would activate the proteasome and autophagy pathways, potentially resulting in a decreased myofiber CSA.
Methods
Subjects and ethical approval
The data presented here are original and are part of a larger study investigating the effects of chronic hypoxia on skeletal muscle adaptations (Victoria University, Melbourne, Australia). In brief, eight recreationally active, nonsmokers male (mean ± standard deviation: age, 24±1 years; body mass, 83.8±20.1 kg; body mass index, 26.5±5.1 kg/m2; maximal oxygen consumption [VO2] peak, 43.0±10.5 mL·min−1·kg−1) volunteered to participate in this study. All participants were screened for cardiovascular (eg, high blood pressure, diabetes, and arrhythmias) or pulmonary diseases (eg, asthma, bronchitis, etc) by a medical doctor before all experiments took part. All subjects gave their written informed consent before the experiment started. The experimental protocol received the approval by the Victoria University Human Research Ethics Committee. All the procedures conformed to the standards set by the Declaration of Helsinki.
Experimental design
Each participant underwent two muscle biopsies after a 12-hour overnight fast in normoxia: one at basal (PRE) and one after 15 days of exposure to normobaric hypoxia, within 15 minutes after returning to normoxia (POST). Muscle biopsies were taken under local anesthesia (1% xylocaine). A small incision (~5 mm) was made in the skin of the left musculus vastus lateralis, and a muscle sample was taken (~150–300 mg) using a Bergström biopsy needle with the application of manual suction. Once obtained, muscle samples were cleaned of excess blood, fat, and connective tissue and snap frozen in liquid nitrogen and stored at −80°C for further analyses. Both muscle biopsies were taken at the sea level, and one biopsy was taken per leg. Four days after basal muscle biopsy, the participants went to live in a hypoxic hotel for a total of 15 days. The volunteers were gradually exposed to an incremental decrease in the O2 concentration over 4 days, corresponding to simulated altitudes of 2,500 m (FiO2 15.4%), 2,800 m (FiO2 14.8%), 3,000 m (FiO2 14.4%), and 3,200 m (FiO2 14.1%). SpO2 was 89.2%±0.8% during the hypoxic stay. To standardize the experimental procedures and to maximally exclude confounding factors such as physical activity and food intake, participants were asked to wear a small accelerometer (Sensewear, BodyMedia, Inc., Pittsburh, PA, USA) and fill out a dietary recall questionnaire for 1 week and 1 month before main experiments started. The hypoxic facility was furnished with a treadmill and some dumbbells to allow the participants to replicate their previously recorded physical activity levels via the aforementioned accelerometers. The physical activity that was measured before entering the hotel and maintained while in the hotel was 10,747±3,602 kJ/day. A nutritionist calculated the self-reported food intake and replicated composition and total calories from the participant’s diet. For 2 weeks before entering the altitude hotel and while living in the altitude hotel, the participants were required to follow their own individually designed diet (all food supplied by a nutritionist). Participants cooked their own personal food provided by the nutritionist. The nutritional intake that was measured before entering the hotel and maintained while in the hotel was 6,027±1,920 kJ/d, 72.3±25.2 g/d protein, 151.3±38.2 g/d carbohydrate, and 65.1±26.5 g/d fat.
Measurements
Enzyme activity assay
Methods for the measurements of the activity of AMPK28,29 and S6K130 have been described in detail previously.
Western blot
Frozen muscle tissue (~20 mg) was homogenized 3×5 seconds with a Polytron mixer in an ice-cold buffer (1:10, w/v) (50 mM Tris–HCl pH 7.0, 270 mM sucrose, 5 mM ethylene glycol tetraacetic acid (EGTA), 1 mM ethylenediaminetetraacetic acid (EDTA), 1 mM sodium orthovanadate, 50 mM glycerophosphate, 5 mM sodium pyrophosphate, 50 mM sodium fluoride, 1 mM DTT, 1% Triton-X 100, and a protease inhibitor cocktail [Hoffman-La Roche Ltd., Basel, Switzerland]). Homogenates were then centrifuged at 10,000× g for 10 minutes at 4°C. The supernatant was collected and immediately stored at −80°C. The protein concentration was measured using the DC protein assay kit (Bio-Rad Laboratories Inc., Hercules, CA, USA).
Proteins (15–30 μg) were separated by sodium dodecyl sulfate-polyacrylamide gel electrophoresis (7.5%–12.5%) and wet transferred to polyvinylidene difluoride membranes. Subsequently, membranes were blocked with 3% nonfat milk or 3% bovine serum albumin for 1 hour and afterward incubated overnight (4°C) with the following antibodies: p-mTOR Ser2448 (#5536), mTOR (#2983), p-4E-BP1 Thr37/46 (#2855), 4E-BP1 (#9644), p-Akt Ser473 (#5171), Akt pan (#2920), p-S6K1 Thr389 (#9206), S6K1 (#2708), p-AMPKα Thr172 (#2535), AMPKα (#2532), phospho-forkhead box 1 Thr24/forhead box 3a Thr32 (p-FoxO1/3a, #9464), HIF-1α (#3716), LC3b (#3868), and α-tubulin (#3873) from Cell Signaling (Leiden, the Netherlands). P62 antibody was from PROGEN Biotechnik GmbH (#GP-62; Heidelberg, Germany), REDD1 from Proteintech (#10638-1-AP; Chicago, IL, USA), and hypoxia-inducible factor-2 alpha (HIF-2α) from Abcam (#ab109616; Cambridge, UK). Appropriate horseradish peroxidase-conjugated secondary antibodies (Sigma-Aldrich Co., St Louis, MO, USA) were used for chemiluminescent detection of the proteins of interest. Membranes were scanned and quantified with GeneSnap and GeneTools software (Syngene, Cambridge, UK), respectively. Then, membranes were stripped and reprobed with the antibody against the total form of the respective protein to ascertain the relative amount of the phosphorylated protein compared with the total form throughout the whole experiment. The data are presented as the ratio protein of interest/α-tubulin or as the ratio of phosphorylated/total form of the protein when the phosphorylation status of the protein was measured. The POST value of each subject was reported to his own PRE value. The mean of the PRE values was assigned the arbitrarily value of 1.0.
RNA extraction and cDNA synthesis
RNA was extracted using TRIzol (Thermo Fisher Scientific, Waltham, MA, USA) from 20 to 25 mg of frozen muscle tissue. RNA quality and quantity were assessed by spectrophotometry with a Nanodrop (Thermo Fisher Scientific). One microgram of RNA was reverse transcribed using the High-Capacity cDNA Reverse Transcription Kit (Thermo Fisher Scientific) according to the manufacturer’s instructions. A SYBR Green-based Master Mix (Thermo Fisher Scientific) was used for real-time polymerase chain reaction analyses using the ABI PRISM 7300 (Thermo Fisher Scientific). Real-time polymerase chain reaction primers were designed for BNIP3, Cathepsin L, HIF-1α, HIF-2α, GABA(A) receptor-associated protein-like 1 (Gabarapl1), LC3b, MAFbx, MRF4, MuRF-1, myogenin, myogenic differentiation (MyoD), Myf-5, Nedd4, P62, PCNA, PLIN2, Psmb1, REDD1, and VEGF-A (Table 1). Thermal cycling conditions consisted of 40 three-step cycles, including denaturation of 30 seconds at 95°C, annealing of 30 seconds at 58°C, and extension of 30 seconds at 72°C. All reactions were performed in triplicate. To compensate for variations in input RNA amounts and efficiency of reverse transcription, cyclophilin A and ribosomal protein L4 mRNA were quantified, and the results were normalized to these values. These genes were chosen out of four normalization genes using the GeNorm applet according to the guidelines and theoretical framework described elsewhere.31 The POST value of each subject was reported to his own PRE value. The mean of the PRE values was assigned the arbitrarily value of 1.0.
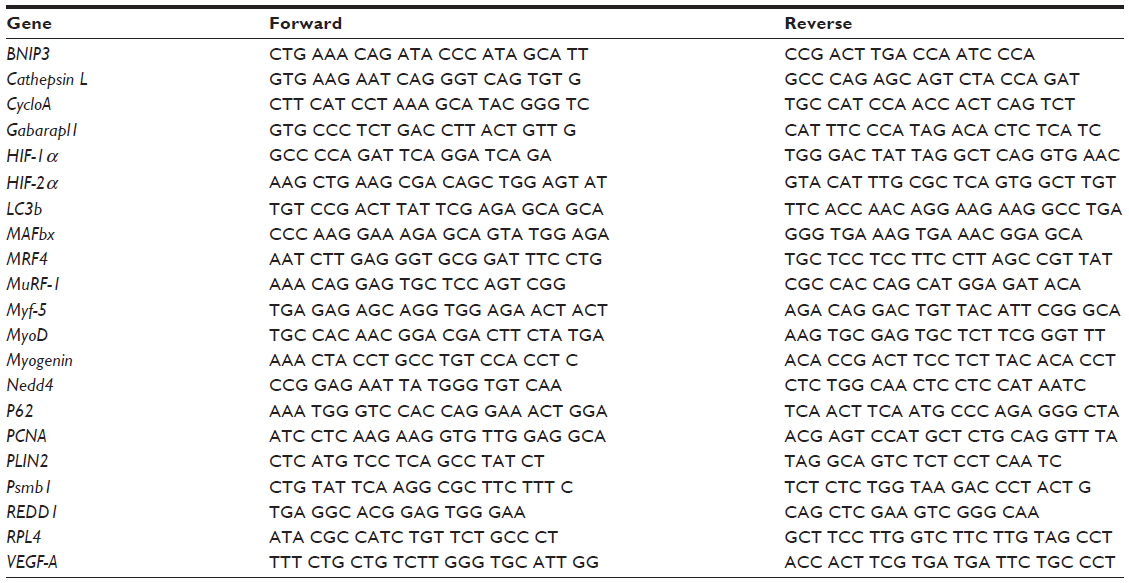 | Table 1 Primer sequences used for real-time PCR |
Immunofluorescence
Serial sections (4 μm) from biopsy samples were laid together on uncoated glass slides. Cryosections were prehybridized in 1% bovine serum albumin in phosphate-buffered saline for 60 minutes. Thereafter, slides were incubated for 2 hours at room temperature with the following primary antibodies: LC3b (#3868, Cell Signaling) and P62 (#GP62-C; PROGEN Biotechnik GmbH) to determine LC3b and P62 migration as described in Ching et al32 and Myosin heavy chain I, BA-F8 (Developmental Studies Hybridoma Bank, Iowa City, IA, USA) and Myosin heavy chain IIa, SC-71 (Developmental Studies Hybridoma Bank) to determine fiber types I and IIa, respectively, as described in Vaisy et al.33 After a three 5-minute washes with phosphate-buffered saline, slides were incubated with the appropriate secondary conjugated antibodies and with wheat germ agglutinin (#w11263; Thermo Fisher Scientific). Slides were examined with a Nikon E1000 fluorescence microscope (Nikon Corporation, Tokyo, Japan) equipped with a high-resolution digital camera. Captured images (×20 for fiber typing and ×40 for LC3b and P62 overlays) were analyzed and processed using ImageJ software (National Institutes of Health, Rockville Pike, USA).
Statistics
Levene’s test and D’Agostino and Pearson omnibus normality test were used to calculate if the data were normally distributed. If not, the appropriate pairwise Wilcoxon signed-rank test was used to assess statistical significance between PRE and POST. When normally distributed, the paired Student’s t-test was used. The Benjamini and Hochberg false discovery rate test was used to correct for multiple hypothesis testing. Pearson product–moment correlation was applied for intraindividual correlation. Statistical threshold was set at α=0.05. Power analysis (β>0.8) for paired t-tests showed that eight subjects would suffice to find an effect on the desired parameters.
Results
Chronic hypoxia decreases HIF-1α protein expression and downstream targets
Fifteen days of chronic hypoxia decreased HIF-1α protein content in all but one subject, resulting in a mean decrease of 49% (P=0.03, Figure 1A), while HIF-2α (Figure 1B) and REDD1 (Figure 1C) protein content did not change. We then analyzed the mRNA expression of genes specifically regulated by either HIF-1α or HIF-2α. Compared with PRE, HIF-1α target genes were downregulated as VEGF-A (−66%, P=0.006; Figure 1D) and BNIP3 (−24%, P=0.002; Figure 1E) mRNA content decreased, while Nedd4 (−47%, P=0.07; Figure 1F) and REDD1 (−46%, P=0.12; Figure 1G) mRNA content tended to decrease. The mRNA level of PLIN2, a HIF-2α target gene, was not modified between PRE and POST (Figure 1H). Of note, HIF-1α (Figure 1I) and HIF-2α (Figure 1J) mRNA content was not different between PRE and POST. These results show that chronic hypoxia differently and specifically regulates the HIF-1α and HIF-2α pathways; HIF-1α being downregulated, while HIF-2α remaining unaltered.
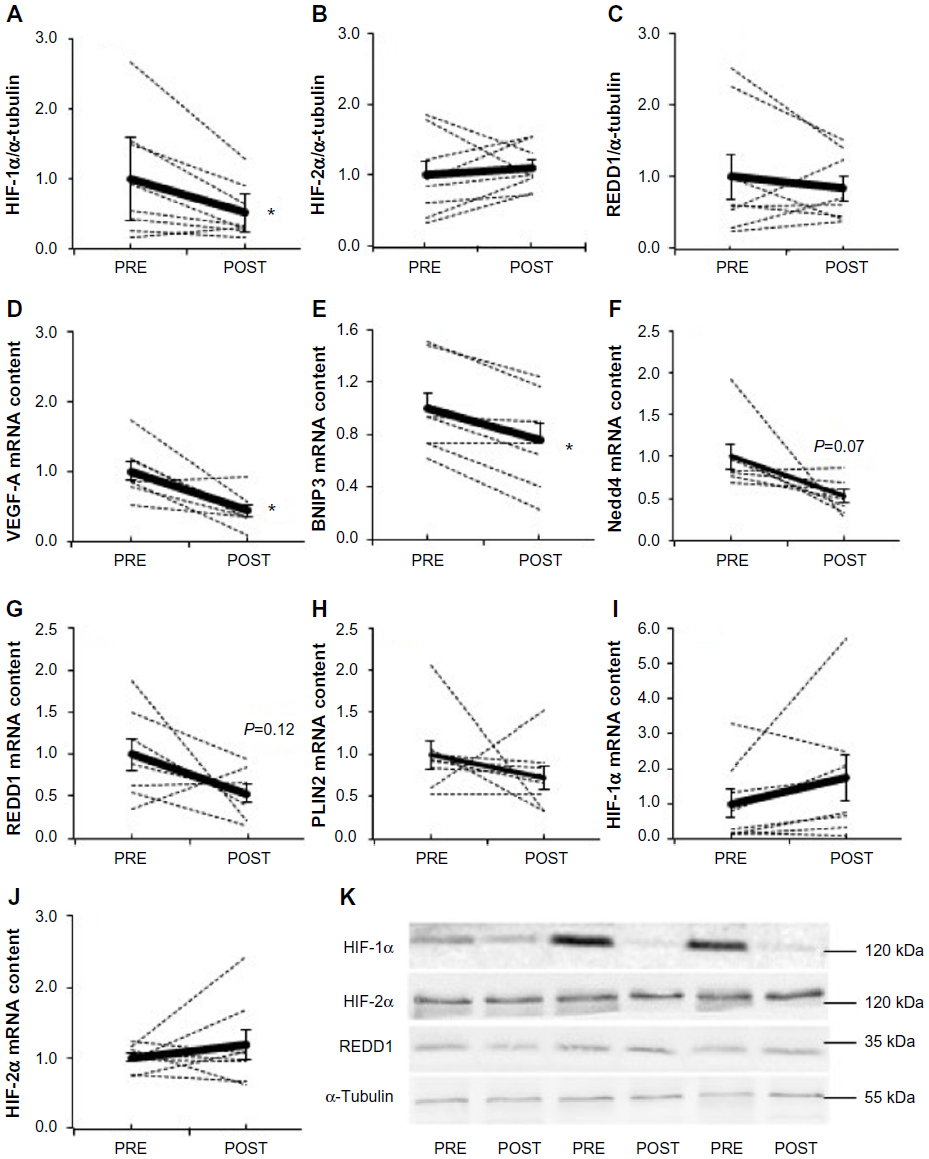 | Figure 1 Effect of chronic hypoxia on key markers of the HIF pathway. |
High interindividual variability in the response of mTORC1 signaling to chronic hypoxia
A large interindividual variability was observed in the response of the mTORC1 pathway to 15-day environmental hypoxia. The phosphorylation state of Akt Ser473 (Figure 2A), mTOR Ser2448 (Figure 2B), S6K1 Thr389 (Figure 2C), 4E-BP1 Thr37/46 (Figure 2D), and AMPK Thr172 (Figure 2E) increased up to three times in some subjects, while it decreased up to six times in others. Hypoxia-induced changes in phosphorylation resulted in a mean value that was not different from PRE values, and these results were confirmed by measuring the activity of S6K1 (Figure 2F) and AMPK (Figure 2G). Interestingly, although chronic hypoxia did not modify mean S6K1 or AMPK activity or phosphorylation, the changes in activity induced by hypoxia (POST–PRE values) were highly negatively correlated (r=−0.92, P<0.001; Figure 2H). Despite the high interindividual response of the mTORC1 pathway, such strong negative correlation indicates a strong intraindividual similarity between hypoxia-induced changes in S6K1 and AMPK activities. Likewise, the changes PRE–POST of phospho-S6K1 Thr389, a surrogate of mTORC1 activity, and LC3b-II/I ratio (r=−0.75, P=0.02, Figure 2I) as well as HIF-1α protein content (r=−0.80, P=0.01; Figure 2J) were also negatively regulated. This further suggests a strong intraindividual regulation of members of mTORC1 signaling.
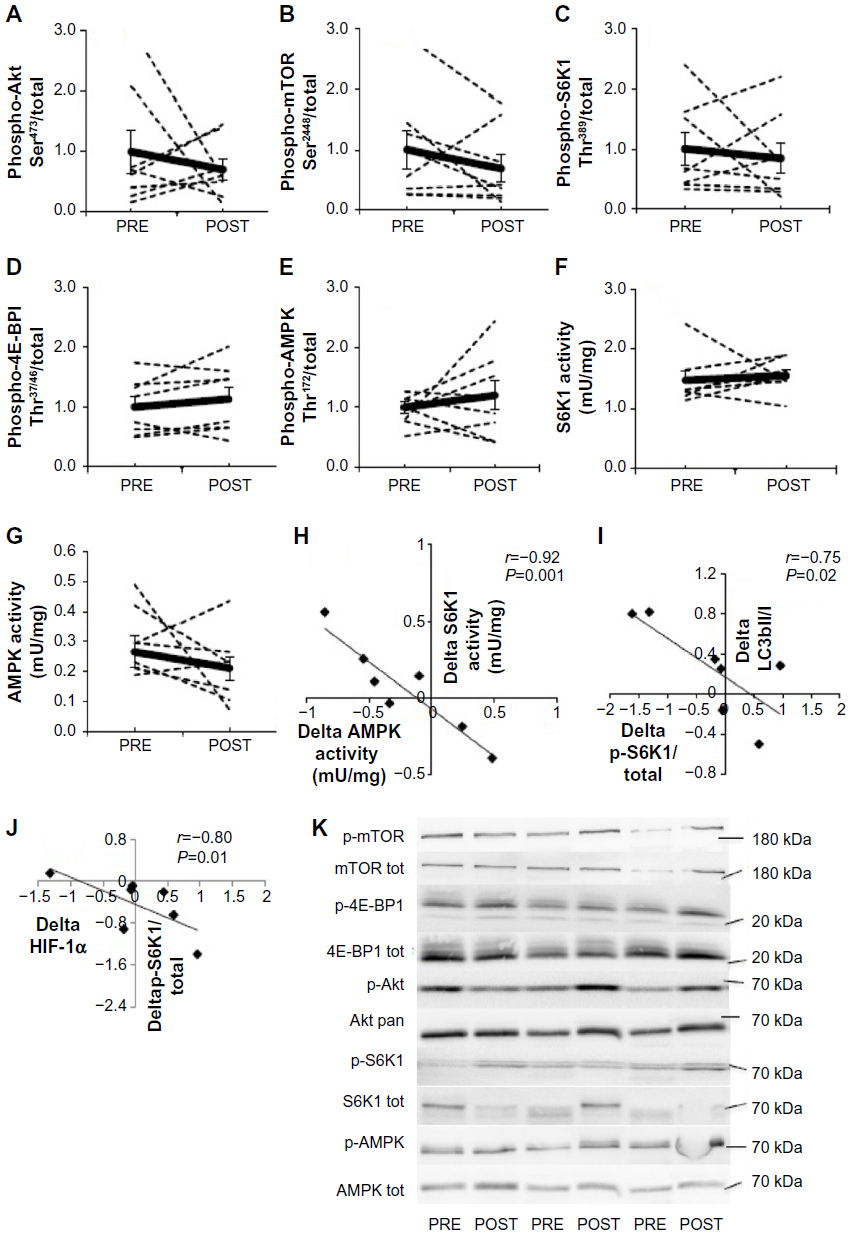 | Figure 2 Effect of chronic hypoxia on key markers of the Akt-mTORC1 pathway. |
Markers of autophagy and ubiquitin-proteasome system remain unaltered by chronic hypoxia
Acute exposure to hypoxia (8 hours) has recently been shown to increase markers of autophagy in human skeletal muscle,34 but data are lacking on a longer term. LC3b lipidation, measured by the LC3b-II to I ratio, was unaltered (P=0.11, Figure 3A). Furthermore, neither the lipidated form LC3b-II (Figure 3B) nor the nonlipidated form LC3b-I (Figure 3C) changed from PRE to POST. LC3b mRNA content (Figure 3D) was unaffected compared with PRE values. In addition, P62, the molecular link between LC3b and ubiquitinated substrates to deliver them selectively into the autophagosome increased by 45%, however, without reaching the statistical threshold due to one subject responding the opposite way (P=0.07, Figure 3E). A representative immunofluorescent image for LC3b and P62 is provided in Figure 4. Panels A–C represent a positive control image we acquired from a human sample after 30 minutes of exercise in normobaric hypoxia (FiO2 10.7%) from an earlier study in our laboratory.24 In these autophagy-positive control myofibers, a bright migration of P62 and LC3b toward the center of the cell is visible. In contrast, in the present study, the distribution pattern is scattered in PRE conditions (Figure 4D–F), and the migration of P62 and LC3b toward the center of the cell is only partial in POST conditions (Figure 4G–I). Clearly, the overall abundance of both LC3b and P62 was substantially lower in our samples compared with the positive controls from Masschelein et al.24 Similar to LC3b, P62 mRNA content did not change from PRE to POST (Figure 3F). Gabarapl1 mRNA, an autophagy-related gene, decreased after 15 days of hypoxia (P=0.03, Figure 3G). Finally, Cathepsin L mRNA content was unaffected by chronic hypoxia (Figure 3H). Taken together, these data suggest that 15 days of environmental hypoxia did not regulate the autophagy–lysosomal pathway.
 | Figure 3 Effect of chronic hypoxia on key markers of proteolytic pathways. |
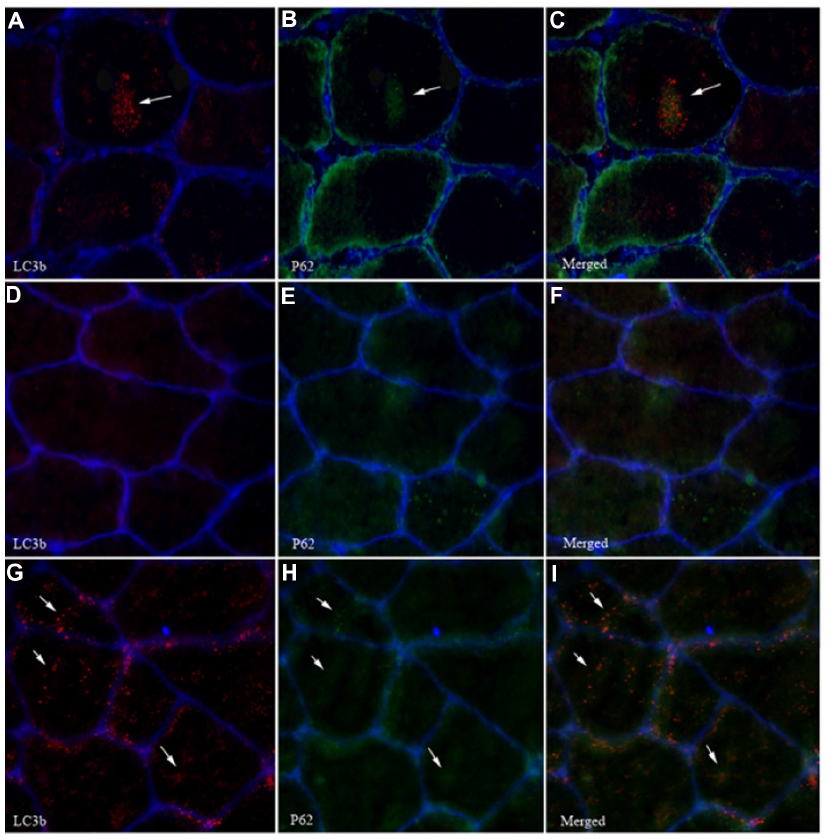 | Figure 4 Effect of chronic hypoxia on LC3b and P62 migration in myofibers. |
Next to autophagy, we further examined the effect of chronic hypoxia on the proteolytic pathways by measuring the phosphorylation state of FoxO1/3a as well as ubiquitin-proteasome-related genes. The phosphorylation state of FoxO1/3a Thr24/32 (Figure 3I) and the mRNA content of MAFbx (Figure 3J) and Psmb1 (Figure 3K), a proteasome subunit, were not modified, while MuRF-1 mRNA decreased compared with PRE (−39%, P=0.012, Figure 3L). All together, these results show that 15 days of moderate chronic hypoxia is insufficient to either regulate autophagy or markers of the ubiquitin-proteasome system in human skeletal muscle.
Chronic hypoxia reduces markers of cellular proliferation
The MRF genes have a well-described role in the regulation of satellite cell proliferation and differentiation into new myofibers,26 including transcription factors myogenin (Figure 5A), MyoD (Figure 5B), MRF4 (Figure 5C), and Myf-5 (Figure 5D). Myf-5 mRNA content was 38% lower after hypoxia (P=0.007), whereas MRF4, MyoD, and myogenin were unaffected. PCNA mRNA content, a marker of DNA replication and cellular proliferation,35 decreased by ~50% after chronic hypoxia (P=0.045; Figure 5E). The lower mRNA content of Myf-5 and PCNA suggests that satellite cell proliferation could be altered after 15 days of exposure to environmental hypoxia.
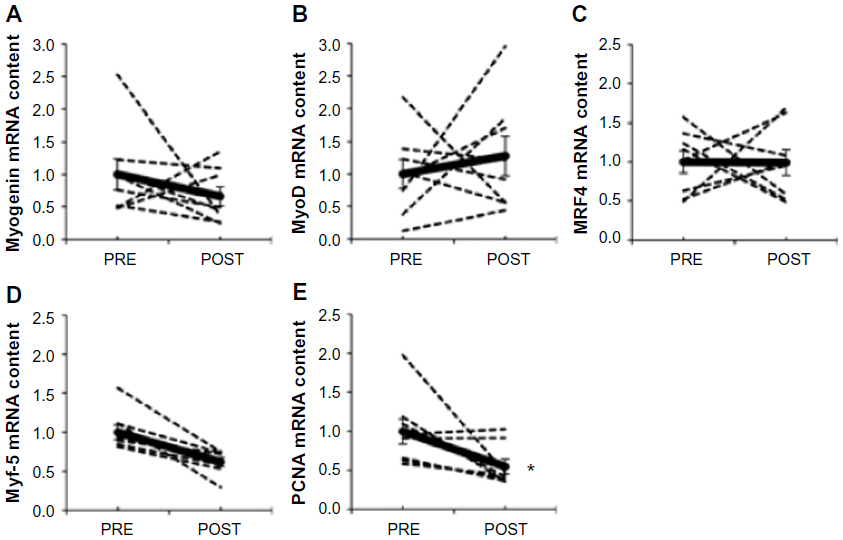 | Figure 5 Effect of chronic hypoxia on key markers of satellite cell proliferation and differentiation. |
Myofiber CSA is unaffected by 15 days of hypoxia
In line with the unaffected key markers of autophagy, ubiquitin-proteasome, mTORC1, and cellular proliferation systems, no difference in skeletal muscle fiber CSA (Figure 6A) or distribution (Figure 6B and C) was measured between PRE and POST.
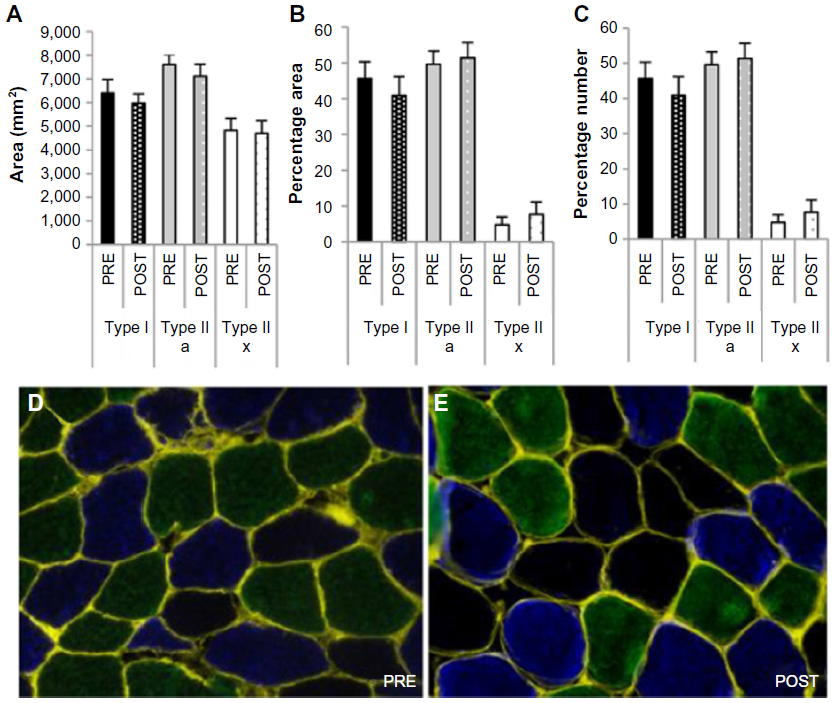 | Figure 6 Effect of chronic hypoxia on muscle fiber cross-sectional area and distribution. |
Discussion
We show for the first time that 15 days of simulated altitude exposure corresponding to 3,200 m decreases HIF-1α protein stabilization and the mRNA expression of its downstream target genes BNIP3, VEGF-A, and Nedd4 in human skeletal muscle, while HIF-2α signaling was unaffected. Furthermore, chronic hypoxia was insufficient to alter autophagy or ubiquitin-proteasome-related markers. Finally, a very high intersubject variability was observed on mTORC1 signaling with some subjects responding in opposite directions. However, the different markers of this pathway were consistently regulated within each subject leading to a high intrasubject similarity as shown by the strong correlation between the regulation of AMPK and S6K1 activities by chronic hypoxia, indicating a profound connection between these two elements. Contrary to our hypothesis, no decrease in myofiber CSA was measured after exposure to hypoxia. The lack of decrease in fiber section contrasts with some studies in human3,5 and in mice10,21 but not all.6,7 Fiber atrophy has been found when hypoxic conditions were higher (from 5,250 to 7,400 m) and when exposure duration was longer (from 3 weeks to 75 days) compared to the present study (3,200 m for 15 days). However, more severe hypoxic conditions and a longer duration do not imply that muscle atrophy occurs as observed by Green et al6 (21 days at 6,194 m) and Lundby et al7 (8 weeks at 4,100 m). It still remains difficult to know in which conditions muscle atrophy occurs after exposure to hypoxia.
Downregulation of the HIF-1α pathway
Although oxygen supply (SaO2) to skeletal muscle is vastly reduced in hypoxia, there is only a slight intramuscular drop in pO2 at extreme altitude in resting skeletal muscle (eg, from ~25 mmHg in normoxia to ~20 mmHg at 4,000 m).36,37 Moreover, 8–9 mmHg has been put forward as a critical threshold below which HIF-1 is stabilized.36 Although not measured, it is plausible to assume that such severe drops in intramuscular pO2 have not occurred in this study, since the physical activity patterns were submaximal and altitude exposure was only modest (3,200 m). Indeed, this suggests that the hypoxic stimulus to the muscle was too low to induce increases in HIF-1α activity, changes in CSA, or modification of any other parameter tested here. This is in line with an earlier study from Viganò et al that reported a lack of HIF-1α stabilization in humans after a 5-day inactive sojourn at 4,559 m.38 Conversely, several animal studies found a stabilization of HIF-1α after long-term hypoxia in various tissues.39,40 A higher contractile activity pattern of the postural hindlimb muscles in rodents41 and a ~15-fold higher resting VO2 in mice compared to humans42 could contribute to the differences seen in both models. Based on the fact that intramuscular pO2 likely did not drop much in the present study, a similar expression of HIF-1α was projected between basal and postexposure conditions. Unexpectedly, HIF-1α expression was decreased as well as its transcriptional activity. Chronic intermittent stimuli, such as repeated exercise, blunt the increase in HIF-1α,43 arguing for limited long-term stabilization of HIF-1α. In addition, HIF-1α and other oxygen-sensitive proteins are known to be rapidly ubiquitinated and degraded by the proteasome after reoxygenation, resulting in a 5–8-minute half-life.44–46 Since the POST biopsy was taken at normoxia, shortly (maximum 15 minutes) after hypoxic exposure, a prompt degradation of HIF-1α likely occurred, leading to a rapid downregulation of the transcription of its target genes.
No effect of environmental hypoxia on the mTORC1 pathway, despite high intraindividual regulation
In vitro data using very low levels of oxygen (<1%) clearly demonstrate that hypoxia inhibits mTORC1.47 In rodents, the phosphorylation state of the mTORC1 pathway in basal conditions is either unchanged9,48,49 or reduced21 after exposure to hypoxia for ~2–3 weeks. The present study is the first to measure the phosphorylation state of different components of the mTORC1 pathway in humans exposed to environmental hypoxia for >2 weeks. None of the key components of the mTORC1 pathway was modified when the results of the eight subjects were averaged. However, a high correlation between the changes in S6K1 and AMPK activities indicates a strong intraindividual regulation of the mTORC1 pathway. As nutrition and physical activities, two main regulators of the mTORC1 pathway, were controlled, it remains unknown why some subjects showed increased phosphorylation while others showed decreased phosphorylation of the latter pathway after exposure to hypoxia.
Autophagy and proteasome-related markers are marginally regulated by chronic hypoxia
Autophagy is regulated by mTORC1-dependent mechanisms, including Unc-51-like autophagy activating kinase 1 (ULK1) complex dissociation, and by FoxO-mediated transcription of ATG genes.50 Hypoxia specifically activates autophagy via a HIF-dependent suppression of mTORC1, resulting in an activation of the ULK1/Atg/LC3b pathway.51 Indeed, although no difference in the mTORC1 pathway was found after hypoxic exposure due to a high interindividual variability, the intraindividual changes in S6K1 phosphorylation, a surrogate of mTORC1 activity, were highly correlated with the changes in LC3b-II/I ratio (r=−0.75, P=0.02, Figure 2I). These results suggest that mTORC1 could contribute to the regulation of autophagy. Therefore, together with previous observations from this laboratory,24 we expected an increased autophagic flux, measured by LC3b-II/I ratios and P62 protein content after chronic hypoxia. In contrast to our hypothesis, our results do not indicate any elevated autophagic flux after 15 days of moderate environmental hypoxia. In our previous study, a clear increase in LC3b-II/I ratio and a decrease in P62 protein expression were measured after 8 hours of seated rest in 10.7% O2, reflecting an increased removal of damaged cellular components.24 Based on this previous study and the results of the present work, it could be hypothesized that the autophagic flux is activated after a few hours exposure to hypoxia and turns off afterward unless the intensity of the hypoxic stimulus, more than the duration, is the key factor for activating autophagy. Indeed in Masschelein et al, FiO2 was equal to 11% compared with 14% in the present study. Together with autophagy, the ubiquitin-proteasome system constitutes a main proteolytic system in the skeletal muscle. Contrary to our hypothesis but likewise markers for the autophagy flux, markers for the proteasome pathway were either unchanged or decreased. Unexpectedly, MuRF-1 mRNA level was lower after exposure to hypoxia for 15 days, while it has previously been shown to increase after chronic hypoxia in the diaphragm52 and heart53 of rodents as well as in skeletal muscle of patients with COPD,54 although not confirmed at the protein level.55,56
Environmental hypoxia reduces markers for cell proliferation
Satellite cells are the primary contributors to muscle cell homeostasis and muscle regeneration after injury or stress. Some in vitro studies have established a role for hypoxia to accelerate their proliferation.27 In contrast, we show a decreased Myf-5 and PCNA mRNA content after chronic hypoxic exposure, while myogenin, MRF4, and MyoD showed high variation between subjects and were unaffected by chronic hypoxia. This suggests reduced conversion of nonmuscle cells into muscle,57 whereas markers of later stage myogenesis were unaffected. However, the changes in mRNA content seen here do not necessarily imply changes in protein expression; extrapolation must therefore be done with caution. In addition, the role of satellite cells in models of muscle atrophy is far from being elucidated.
Limitations and strengths
The inclusion of a normoxic control group would have made it possible to isolate differences due to the duration of the experiment, that is, 15 days and not due to environmental hypoxia per se. However, as the duration of the experiment was limited to 2 weeks, it is likely that the time effects were minimal. Owing to the small sample size, caution should be made with statements regarding the lack of effect of hypoxia. Nevertheless, a power analysis indicated that eight subjects would suffice for adequate power (β>0.8). Likewise, a biopsy in the middle of the hypoxic period or at the end of hypoxia could have strengthened the discussion and the interpretation of early events in molecular signaling, which was not performed due to ethical considerations. Lastly, we have to acknowledge the lack of direct measurement of protein synthesis and/or breakdown since indirect markers such as mTORC1 signaling have been reported to not fully relate to the actual protein synthesis rate. Nevertheless, these limitations are largely overcome by the originality of the study and the unique character of the latter. This is the first study to systematically screen markers for both protein synthesis and protein breakdown at a molecular level after chronic environmental hypoxia in human skeletal muscle in a well-controlled setup for nutrition and physical activity.
Conclusion
We show here for the first time that chronic environmental hypoxia differently and specifically regulates the HIF-1α and HIF-2α pathways in human skeletal muscle, HIF-1α being downregulated, while HIF-2α remaining unaltered. In addition, contrary to our hypothesis, chronic hypoxia did not affect markers for protein synthesis and marginally modified markers for protein degradation. In line with these results, no difference in myofiber CSA was found.
Acknowledgments
The authors would like to thank the subjects for their participation in the study, N Marquet for technical assistance during the activities of assays, and S De Smet for interpretation of the data.
Author contributions
GDH: writing manuscript, biochemical analysis, and interpretation of data. AF: conception and design and acquisition of data. DN: biochemical analysis and interpretation of data. LB, SH, and MF: interpretation of data and revising manuscript. DJB: interpretation of data, conception and design, acquisition of data, and revising manuscript. LD: writing manuscript, biochemical analysis, interpretation of data, and revising manuscript. All authors contributed toward data analysis, drafting and critically revising the paper and agree to be accountable for all aspects of the work.
Disclosure
The authors report no conflicts of interest in this work.
References
Deldicque L, Francaux M. Acute vs chronic hypoxia: what are the consequences for skeletal muscle mass? Cell Mol Exerc Physiol. 2013;2(1):1–23. | |
Kurobe K, Huang Z, Nishiwaki M, Yamamoto M, Kanehisa H, Ogita F. Effects of resistance training under hypoxic conditions on muscle hypertrophy and strength. Clin Physiol Funct Imaging. 2015;35(3):197–202. | |
Mizuno M, Savard GK, Areskog NH, Lundby C, Saltin B. Skeletal muscle adaptations to prolonged exposure to extreme altitude: a role of physical activity? High Alt Med Biol. 2008;9(4):311–317. | |
Hoppeler H, Kleinert E, Schlegel C, et al. Morphological adaptations of human skeletal muscle to chronic hypoxia. Int J Sport Med. 1990;11(suppl 1):S3–S9. | |
MacDougall JD, Green HJ, Sutton JR, et al. Operation Everest II: structural adaptations in skeletal muscle in response to extreme simulated altitude. Acta Physiol Scand. 1991;142(3):421–427. | |
Green H, Roy B, Grant S, et al. Downregulation in muscle Na(+)-K(+)-ATPase following a 21-day expedition to 6,194 m. J Appl Physiol. 2000;88(2):634–640. | |
Lundby C, Pilegaard H, Andersen JL, van Hall G, Sander M, Calbet JA. Acclimatization to 4100 m does not change capillary density or mRNA expression of potential angiogenesis regulatory factors in human skeletal muscle. J Exp Biol. 2004;207(pt 22):3865–3871. | |
Bigard AX, Douce P, Merino D, Lienhard F, Guezennec CY. Changes in dietary protein intake fail to prevent decrease in muscle growth induced by severe hypoxia in rats. J Appl Physiol. 1996;80(1):208–215. | |
De Theije CC, Langen RCJ, Lamers WH, Schols AM, Köhler SE. Distinct responses of protein turnover regulatory pathways in hypoxia- and semistarvation-induced muscle atrophy. Am J Physiol Lung Cell Mol Physiol. 2013;305(1):L82–L91. | |
De Theije CC, Langen RCJ, Lamers WH, Gosker HR, Schols AM, Köhler SE. Differential sensitivity of oxidative and glycolytic muscles to hypoxia-induced muscle atrophy. J Appl Physiol. 2015;118(2):200–211. | |
Phillips SM. A brief review of critical processes in exercise-induced muscular hypertrophy. Sport Med. 2014;44(suppl1):71–77. | |
Sancak Y, Bar-Peled L, Zoncu R, Markhard AL, Nada S, Sabatini DM. Ragulator-rag complex targets mTORC1 to the lysosomal surface and is necessary for its activation by amino acids. Cell. 2010; 141(2):290–303. | |
Bodine SC, Stitt TN, Gonzalez M, et al. Akt/mTOR pathway is a crucial regulator of skeletal muscle hypertrophy and can prevent muscle atrophy in vivo. Nat Cell Biol. 2001;3(11):1014–1019. | |
Arsham AM, Howell JJ, Simon MC. A novel hypoxia-inducible factor-independent hypoxic response regulating mammalian target of rapamycin and its targets. J Biol Chem. 2003;278(32):29655–29660. | |
Hardie DG, Ross FA, Hawley SA. AMPK: a nutrient and energy sensor that maintains energy homeostasis. Nat Rev Mol Cell Biol. 2012;13(4):251–262. | |
Liu L, Cash TP, Jones RG, Keith B, Thompson CB, Simon MC. Hypoxia-induced energy stress regulates mRNA translation and cell growth. Mol Cell. 2006;21(4):521–531. | |
Gwinn DM, Shackelford DB, Egan DF, et al. AMPK phosphorylation of raptor mediates a metabolic checkpoint. Mol Cell. 2008;30(2):214–226. | |
Sofer A, Lei K, Johannessen CM, Ellisen LW. Regulation of mTOR and cell growth in response to energy stress by REDD1 regulation of mTOR and cell growth in response to energy stress by REDD1. Mol Cell Biol. 2005;25(14):5834–5845. | |
Dennis MD, Coleman CS, Berg A, Jefferson LS, Kimball SR. REDD1 enhances protein phosphatase 2A-mediated dephosphorylation of Akt to repress mTORC1 signaling. Sci Signal. 2014;7(335):ra68. | |
Egerman MA, Glass DJ. Signaling pathways controlling skeletal muscle mass. Crit Rev Biochem Mol Biol. 2014;49(1):59–68. | |
Favier FB, Costes F, Defour A, et al. Downregulation of Akt/mammalian target of rapamycin pathway in skeletal muscle is associated with increased REDD1 expression in response to chronic hypoxia. Am J Physiol Regul Integr Comp Physiol. 2010;298(6):R1659–R1666. | |
D’Hulst G, Jamart C, Van Thienen R, Hespel P, Francaux M, Deldicque L. Effect of acute environmental hypoxia on protein metabolism in human skeletal muscle. Acta Physiol (Oxf). 2013;208(3):251–264. | |
Glass DJ. Signalling pathways that mediate skeletal muscle hypertrophy and atrophy. Nat Cell Biol. 2003;5(2):87–90. | |
Masschelein E, Van Thienen R, D’Hulst G, Hespel P, Thomis M, Deldicque L. Acute environmental hypoxia induces LC3 lipidation in a genotype-dependent manner. FASEB J. 2014;28(2):1022–1034. | |
Schiaffino S, Dyar KA, Ciciliot S, Blaauw B, Sandri M. Mechanisms regulating skeletal muscle growth and atrophy. FEBS J. 2013;280(17):4294–4314. | |
Zanou N, Gailly P. Skeletal muscle hypertrophy and regeneration: interplay between the myogenic regulatory factors (MRFs) and insulin-like growth factors (IGFs) pathways. Cell Mol Life Sci. 2013;70(21):4117–4130. | |
Liu W, Wen Y, Bi P, et al. Hypoxia promotes satellite cell self-renewal and enhances the efficiency of myoblast transplantation. Development. 2012;139(16):2857–2865. | |
Krause U, Bertrand L, Hue L. Control of p70 ribosomal protein S6 kinase and acetyl-CoA carboxylase by AMP-activated protein kinase and protein phosphatases in isolated hepatocytes. Eur J Biochem. 2002;269(15):3751–3759. | |
Mitchelhill KI, Stapleton D, Gao G, et al. Mammalian AMP-activated protein kinase shares structural and functional homology with the catalytic domain of yeast Snf1 protein kinase. J Biol Chem. 1994;269(4):2361–2364. | |
Krause U, Rider MH, Hue L. Protein kinase signaling pathway triggered by cell swelling and involved in the activation of glycogen synthase and acetyl-CoA carboxylase in isolated rat hepatocytes. J Biol Chem. 1996;271(28):16668–16673. | |
Vandesompele J, De PK, Pattyn F, et al. Accurate normalization of real-time quantitative RT-PCR data by geometric averaging of multiple internal control genes. Genome Biol. 2002;3(7):RESEARCH0034. | |
Ching JK, Ju JS, Pittman SK, Margeta M, Weihl CC. Increased autophagy accelerates colchicine-induced muscle toxicity. Autophagy. 2013;9(12):2115–2125. | |
Vaisy M, Szlufcik K, De Bock K, et al. Exercise-induced, but not creatine-induced, decrease in intramyocellular lipid content improves insulin sensitivity in rats. J Nutr Biochem. 2011;22(12):1178–1185. | |
Masschelein E, Van Thienen R, D’Hulst G, Hespel P, Thomis M, Deldicque L. Acute environmental hypoxia induces LC3 lipidation in a genotype-dependent manner. FASEB J. 2013;28(2):1022–1034. | |
Baserga R. Growth regulation of the PCNA gene. J Cell Sci. 1991; 98(pt 4):433–436. | |
Flueck M. Plasticity of the muscle proteome to exercise at altitude. High Alt Med Biol. 2009;10(2):183–193. | |
Richardson RS, Duteil S, Wary C, Wray DW, Hoff J, Carlier PG. Human skeletal muscle intracellular oxygenation: the impact of ambient oxygen availability. J Physiol. 2006;571(pt 2):415–424. | |
Viganò A, Ripamonti M, De Palma S, et al. Proteins modulation in human skeletal muscle in the early phase of adaptation to hypobaric hypoxia. Proteomics. 2008;8(22):4668–4679. | |
De Palma S, Ripamonti M, Viganò A, et al. Metabolic modulation induced by chronic hypoxia in rats using a comparative proteomic analysis of skeletal muscle tissue. J Proteome Res. 2007;6(5):1974–1984. | |
Chavez JC, Agani F, Pichiule P, LaManna JC. Expression of hypoxia-inducible factor-1alpha in the brain of rats during chronic hypoxia. Culture. 2000;4938:1937–1942. | |
Zwetsloot KA, Westerkamp LM, Holmes BF, Gavin TP. AMPK regulates basal skeletal muscle capillarization and VEGF expression, but is not necessary for the angiogenic response to exercise. J Physiol. 2008;586(pt 24):6021–6035. | |
Tanner J, Kearns D, Kim BJ, et al. Fasting-induced restrictions in cardiovascular and metabolic variables occur sooner in obese vs. lean mice. Exp Biol Med. 2010;235(12):1489–1497. | |
Lundby C, Gassmann M, Pilegaard H. Regular endurance training reduces the exercise induced HIF-1alpha and HIF-2alpha mRNA expression in human skeletal muscle in normoxic conditions. Eur J Appl Physiol. 2006;96(4):363–369. | |
Wang GL, Jiang BH, Rue EA, Semenza GL. Hypoxia-inducible factor 1 is a basic-helix-loop-helix-PAS heterodimer regulated by cellular O2 tension. Proc Natl Acad Sci U S A. 1995;92(12):5510–5514. | |
Jewell UR, Kvietikova I, Scheid A, Bauer C, Wenger RH, Gassmann M. Induction of HIF-1alpha in response to hypoxia is instantaneous. FASEB J. 2001;15(7):1312–1314. | |
Berra E, Roux D, Richard DE, Pouysségur J. Hypoxia-inducible factor-1 alpha (HIF-1 alpha) escapes O(2)-driven proteasomal degradation irrespective of its subcellular localization: nucleus or cytoplasm. EMBO Rep. 2001;2(7):615–620. | |
Koumenis C, Naczki C, Koritzinsky M, et al. Regulation of protein synthesis by hypoxia via activation of the endoplasmic reticulum kinase PERK and phosphorylation of the translation initiation factor eIF2alpha. Mol Cell Biol. 2002;22(21):7405–7416. | |
Chaillou T, Koulmann N, Meunier A, et al. Ambient hypoxia enhances the loss of muscle mass after extensive injury. Pflugers Arch. 2014;466(3):587–598. | |
Chaillou T, Koulmann N, Simler N, et al. Hypoxia transiently affects skeletal muscle hypertrophy in a functional overload model. Am J Physiol Regul Integr Comp Physiol. 2011;302(5):R643–R654. | |
Rabinowitz JD, White E. Autophagy and metabolism. Science. 2010;330(6009):1344–1348. | |
Bellot G, Garcia-Medina R, Gounon P, et al. Hypoxia-induced autophagy is mediated through hypoxia-inducible factor induction of BNIP3 and BNIP3L via their BH3 domains. Mol Cell Biol. 2009;29(10):2570–2581. | |
Cannata DJ, Ireland Z, Dickinson H, et al. Maternal creatine supplementation from mid-pregnancy protects the diaphragm of the newborn spiny mouse from intrapartum hypoxia-induced damage. Pediatr Res. 2010;68(5):393–398. | |
Razeghi P, Baskin KK, Sharma S, et al. Atrophy, hypertrophy, and hypoxemia induce transcriptional regulators of the ubiquitin proteasome system in the rat heart. Biochem Biophys Res Commun. 2006;342(2):361–364. | |
Doucet M, Russell AP, Léger B, et al. Muscle atrophy and hypertrophy signaling in patients with chronic obstructive pulmonary disease. Am J Respir Crit Care Med. 2007;176(3):261–269. | |
Plant PJ, Brooks D, Faughnan M, et al. Cellular markers of muscle atrophy in chronic obstructive pulmonary disease. Am J Respir Cell Mol Biol. 2010;42(4):461–471. | |
Natanek SA, Riddoch-Contreras J, Marsh GS, et al. MuRF-1 and atrogin-1 protein expression and quadriceps fiber size and muscle mass in stable patients with COPD. COPD. 2013;10(5):618–624. | |
Davis RL, Weintraub H, Lassar AB. Expression of a single transfected cDNA converts fibroblasts to myoblasts. Cell. 1987;51(6):987–1000. |
 © 2016 The Author(s). This work is published and licensed by Dove Medical Press Limited. The full terms of this license are available at https://www.dovepress.com/terms.php and incorporate the Creative Commons Attribution - Non Commercial (unported, v3.0) License.
By accessing the work you hereby accept the Terms. Non-commercial uses of the work are permitted without any further permission from Dove Medical Press Limited, provided the work is properly attributed. For permission for commercial use of this work, please see paragraphs 4.2 and 5 of our Terms.
© 2016 The Author(s). This work is published and licensed by Dove Medical Press Limited. The full terms of this license are available at https://www.dovepress.com/terms.php and incorporate the Creative Commons Attribution - Non Commercial (unported, v3.0) License.
By accessing the work you hereby accept the Terms. Non-commercial uses of the work are permitted without any further permission from Dove Medical Press Limited, provided the work is properly attributed. For permission for commercial use of this work, please see paragraphs 4.2 and 5 of our Terms.