")
Back to Journals » Cancer Management and Research » Volume 13
Fibrinogen–Albumin Ratio Index (FARI) as a Certain Prognostic Biomarker in Pretreated Patients with Immunotherapy
Received 18 February 2021
Accepted for publication 8 April 2021
Published 24 May 2021 Volume 2021:13 Pages 4169—4180
DOI https://doi.org/10.2147/CMAR.S307272
Checked for plagiarism Yes
Review by Single anonymous peer review
Peer reviewer comments 2
Editor who approved publication: Dr Eileen O'Reilly
Ziwei Guo,1,2 Jun Liang2
1Medical Oncology, Peking University International Hospital, Beijing, People’s Republic of China; 2Medical Oncology, Peking University Cancer Hospital and Institute, Beijing, People’s Republic of China
Correspondence: Jun Liang Tel +8615801353728
Fax +86 901069007625
Email [email protected]
Purpose: Immunotherapy has become the standard treatment for advanced tumors so that many biomarkers play parts in predicting prognosis and clinical outcome. Use of FARI is increasing, but there are no studies on its use prior to immunotherapy.
Patients and Methods: A retrospective study prior to immunotherapies in advanced carcinoma used FARI and other biomarkers as clinical parameters from which to analyse data from January 2014 to November 2020. Data were presented in GraphPad Prism 7 and X-Tile and analyzed using IBM SPSS.
Results: A total of 146 patients were enrolled in our study. FARI (with an optimal cut-off value of 11.1%) was divided into a high group, in connection with shorter OS mainly in patients with bone metastasis (120m vs 11.5m, 95% Cl: 12.17– 23.83, SE: 2.974, p=0.03), and a low group with a longer PFS (11.0m vs 5.0m, 95% Cl: 3.303– 12.697, SE: 2.397, p=0.03) in NSCLC but a shorter PFS (3.5m vs 5.5m, 95% Cl: 3.757– 6.243, SE: 0.634, p=0.01) in liver metastasis. FARI was not determined as an independent predictor of OS in patients undergoing medical therapies (> 11.1% vs ≤ 11.1%, HR: 1.296, 95% Cl: 0.687– 2.032, p=0.314). ECOG (HR: 2.892, 95% Cl: 1.911– 4.378, p< 0.001) can be an independent predictor for PFS and OS in advanced carcinoma.
Conclusion: Our findings highlight certain potential values for predicting prognosis but no outstanding biomarkers prior to immunotherapy according to FARI.
Keywords: fibrinogen–albumin ratio, prognosis, biomarker, immunotherapy
Introduction
It is clear that immunology plays a key role in different biological stages of the development and progression of tumors, a fact that has attracted considerable attention in both academia and popular culture.1 Several new agents have been found to prolong median overall survival (mOS) and median progression-free survival (mPFS) over the last 15 years.2,3 There has been substantial research undertaken on the role of immunotherapies in various carcinomas pre-/post-surgery and/or advanced tumors undergoing recurrence, metastases, and the last chance to treat certain diseases.1 With the development of research, immunotherapy biomarkers have emerged as a powerful tool in studying the behaviour of the population who can benefit. A better understanding of the significance of these markers will help us identify individuals most likely to benefit from immunotherapy.
Previous research has indicated potential associations between inflammation of the microenvironment and cancer surveillance and elimination.4 Thus, several biomarkers and systemic immune-inflammation have been verified as prognostic factors in different tumors. These were often derived from blood results, such as the platelet-lymphocyte ratio (PLR), neutrophil-lymphocyte ratio (NLR), lymphocyte-monocyte ratio(LMR), etc.5–7 Some studies have shown that NLR and PLR8,9 could predict prognosis when patients were treated with chemotherapy,10,11 surgery12,13 and immunotherapy14,15 in varieties of solid cancer.16,17 One study showed that a pretreatment NLR of ≥5 was independent of inferior OS (median 5.5 vs 8.4 months; HR 2.07, 95% CI 1.3–3.3; p=0.002) in multivariate analyses.14 In contrast, another study15 demonstrated that there was no significant PFS (HR for log [NLR] 1.46, 95% CI 0.91–2.34, p=0.114) or PLR. NLR and PLR did not correlate with other prognostic factors (i.e. histology, tobacco use, performance status/PS) in their cohort with non-small-cell lung cancer (NSCLC) treated with nivolumab. However, many factors, such as infection, rating according to the Eastern Cooperative Oncology Group (ECOG) scale, age, previous history or medication history, have interrupted the outcomes of biomarkers and not entirely evaluated these parameters.
Another study demonstrated that tumor mutation burden, deficient DNA mismatch repair and microsatellite instability were significantly correlated with prognosis.18 A blood-based tumor mutation burden (bTMB) of ≥16 was one expected outcome for patients who accepted atezolizumab in the POPLAROAK study19 and a cut-off of ≥10 in the Checkmate 227 trials.20 However, the studycould only obtain response rates of <50% in patients with high TMB. And that, tumor-infiltrating lymphocytes, including eosinophils, also were correlated with cancer survival. Clinical trials and/or clinical applications fail to explore the value of eosinophils. Increasing evidence indicates that significant differences in inflammatory proteins such as fibrinogen(Fib) and albumin(Alb) were widely researched in relation to cancer survival and repeatedly proven to be an independent prognostic factor.21–23 Moreover, many researchers reported that a preoperative upregulated fib-alb ratio (FAR) can predict poor prognosis in various cancer types.24,25 Generally, FARI was not established for pre-immunotherapy for advanced solid cancers.
Above all, this study was conducted to establish the prognostic value of FARI with patients prior to immunotherapy, and to compare it with systemic inflammation markers, including NLR, LMR, PLR and eosinophils in advanced solid cancers.
Patients and Methods
Ethical approval was granted by the Peking University International Hospital, and all patients in our study provided informed consent. This study was conducted in accordance with the Declaration of Helsinki.
Patients
This retrospective study was conducted at Peking University International Hospital and used data from January 2014 to November 2020. Patients with advanced carcinoma who obtained immunotherapy were proposed for inclusion in this study. Patients with an autoimmune disease, requiring systemic immunosuppressive drugs and a previous therapeutic regimen with an antibody or drug specifically targeting T-cell co-stimulation or checkpoint pathways, or interstitial lung disease were excluded.
Diagnosis and Systemic Inflammation Factors
NSCLC, small-cell lung cancer (SCLC), primary hepatocellular carcinoma, gastrointestinal cancer, and sarcoma were defined on the basis of histological and/or cytological evidence. The stage was determined according to the 2018 National Comprehensive Cancer Network (NCCN) guidelines of tumor, node metastasis classification system.18,26–30
Serum fibrinogen and albumin levels and white blood cell count were received during two weeks before immunotherapies and the time of each follow-up. We collected 2 mL of venous blood from the patients and placed these blood samples in a disposable vacuum tube containing EDTA-K2 for routine blood. The samples were shaken and refrigerated for use. Routine blood tests were performed using SYSMEX XN3000 automatic blood cell analyzer, and the numbers of neutrophils, lymphocytes and platelets in the blood were recorded. Matching test reagents and quality control agents were used during the test. 4mL of venous blood was extracted into a biochemical vacuum tube. After the serum components of the blood sample were naturally separated out, the blood sample was placed in a centrifuge for centrifugation.The speed of the centrifuge was set at 3500 r/min, and the centrifugation time was set at 5 min. The supernatant after separation was extracted as the serum specimen, and this was put into the separation tube. According to the bromocresol green method, the level of serum albumin in serum samples was detected. The instruments used for the above tests are all BECKMAN AU5800 automatic biochemical analyzers. The plasma fibrinogen level was detected by ACL-TOP 700 automatic coagulation analyzer after anticoagulation and centrifugation of 3 mL of venous blood. Systemic inflammation factors were expressed as the following indicators: FARI = fibrinogen: albumin; NLR = neutrophil count: lymphocyte count; PLR = platelet count: lymphocyte count; and LMR = lymphocyte count: monocyte count.
Treatment and Follow-Up
Routine examinations from patients before immunotherapies included chest, abdominal and pelvic computed tomography (CT) or magnetic resonance (MR), blood routine examination, liver and kidney function tests, and coagulation function measurement. After two or more oncologists confirmed that a patient had no evidence of surgery or radiotherapy, we decided to continue immunotherapy after a disciplinary discussion meeting.
Patients were followed up every 10±2 weeks. Chest, abdomen and pelvis contrast-enhanced CT or MR imaging of lesions, blood routine test, coagulation function test, and biochemical function test were routinely conducted. Tumor recurrence was defined as new lesion(s) with the presence of nearly primary site or nearly lymphonodi, and tumor metastasis was identified as remote organs or non-focal lymph nodes. OS was calculated from the date of cancer diagnosis to the date of death from any cause. Patients still alive at the time of follow-up and disease free survival (DFS) time were presented as the randomly selected time until tumor recurrence, new metastasis or death from various causes.
Statistical Analysis
Prism 7 (GraphPad Software, San Diego, CA, USA), X-tile analysis software version 3.6.1 (Yale University), and IBM SPSS (version 21.0; SPSS Inc, Chicago, IL, USA) were used to analyze data. The continuous parameters were presented as median (interquartile range [IQR]) and were compared using the two-sided Mann–Whitney U-test, as well as categorical parameters using the two-sided Chi square test or Fisher’s exact test in two independent samples. Of the 146 patients, 99 had developed disease progression and 76 passed away. X-tile analysis was conducted to identify 30 months OS as the optimal cut-off values for system inflammatory factors and FARI. Time-dependent operating characteristic (ROC) curve analysis used the “time ROC” package in R version 3.6.1 (http://www.r-progect.org/). OS and PFS were calculated using the Kaplan–Meier method and were compared between groups using the log rank test. Multivariable Cox regression analysis was used for estimating the independent predictors of OS and PFS. A p-value of <0.05 was presented as statistically significant.
Results
All 157 patients met the study criteria. Eleven cases were excluded due to a failure of follow-up, thus 146 patients were enrolled in our study.
Baseline Characteristics
Of the consecutive 146 patients, approximately two-thirds were male and the median age was 63 years (IQR 56–67), in both the low and high FARI groups. Of these 146 patients, 38.4% were diagnosed with gastrointestinal cancer and 42 with NSCLC; the majority were wild types of KARS and EGFR. The proportion of ≥2 metastatic sites was 87%, and half of patients had a history of heavy smoking. The median levels of FARI, NLR, LMR, PLR and eosinophilia were 9.9% (IQR 7.9–13.2%), 3.4 (IQR 2.4–5.0), 2.7 (IQR 1.9–3.8), 173 (IQR 133–258), and 0.09 (IQR 0.04–0.16), respectively. Patients’ characteristics are summarized in Table 1.
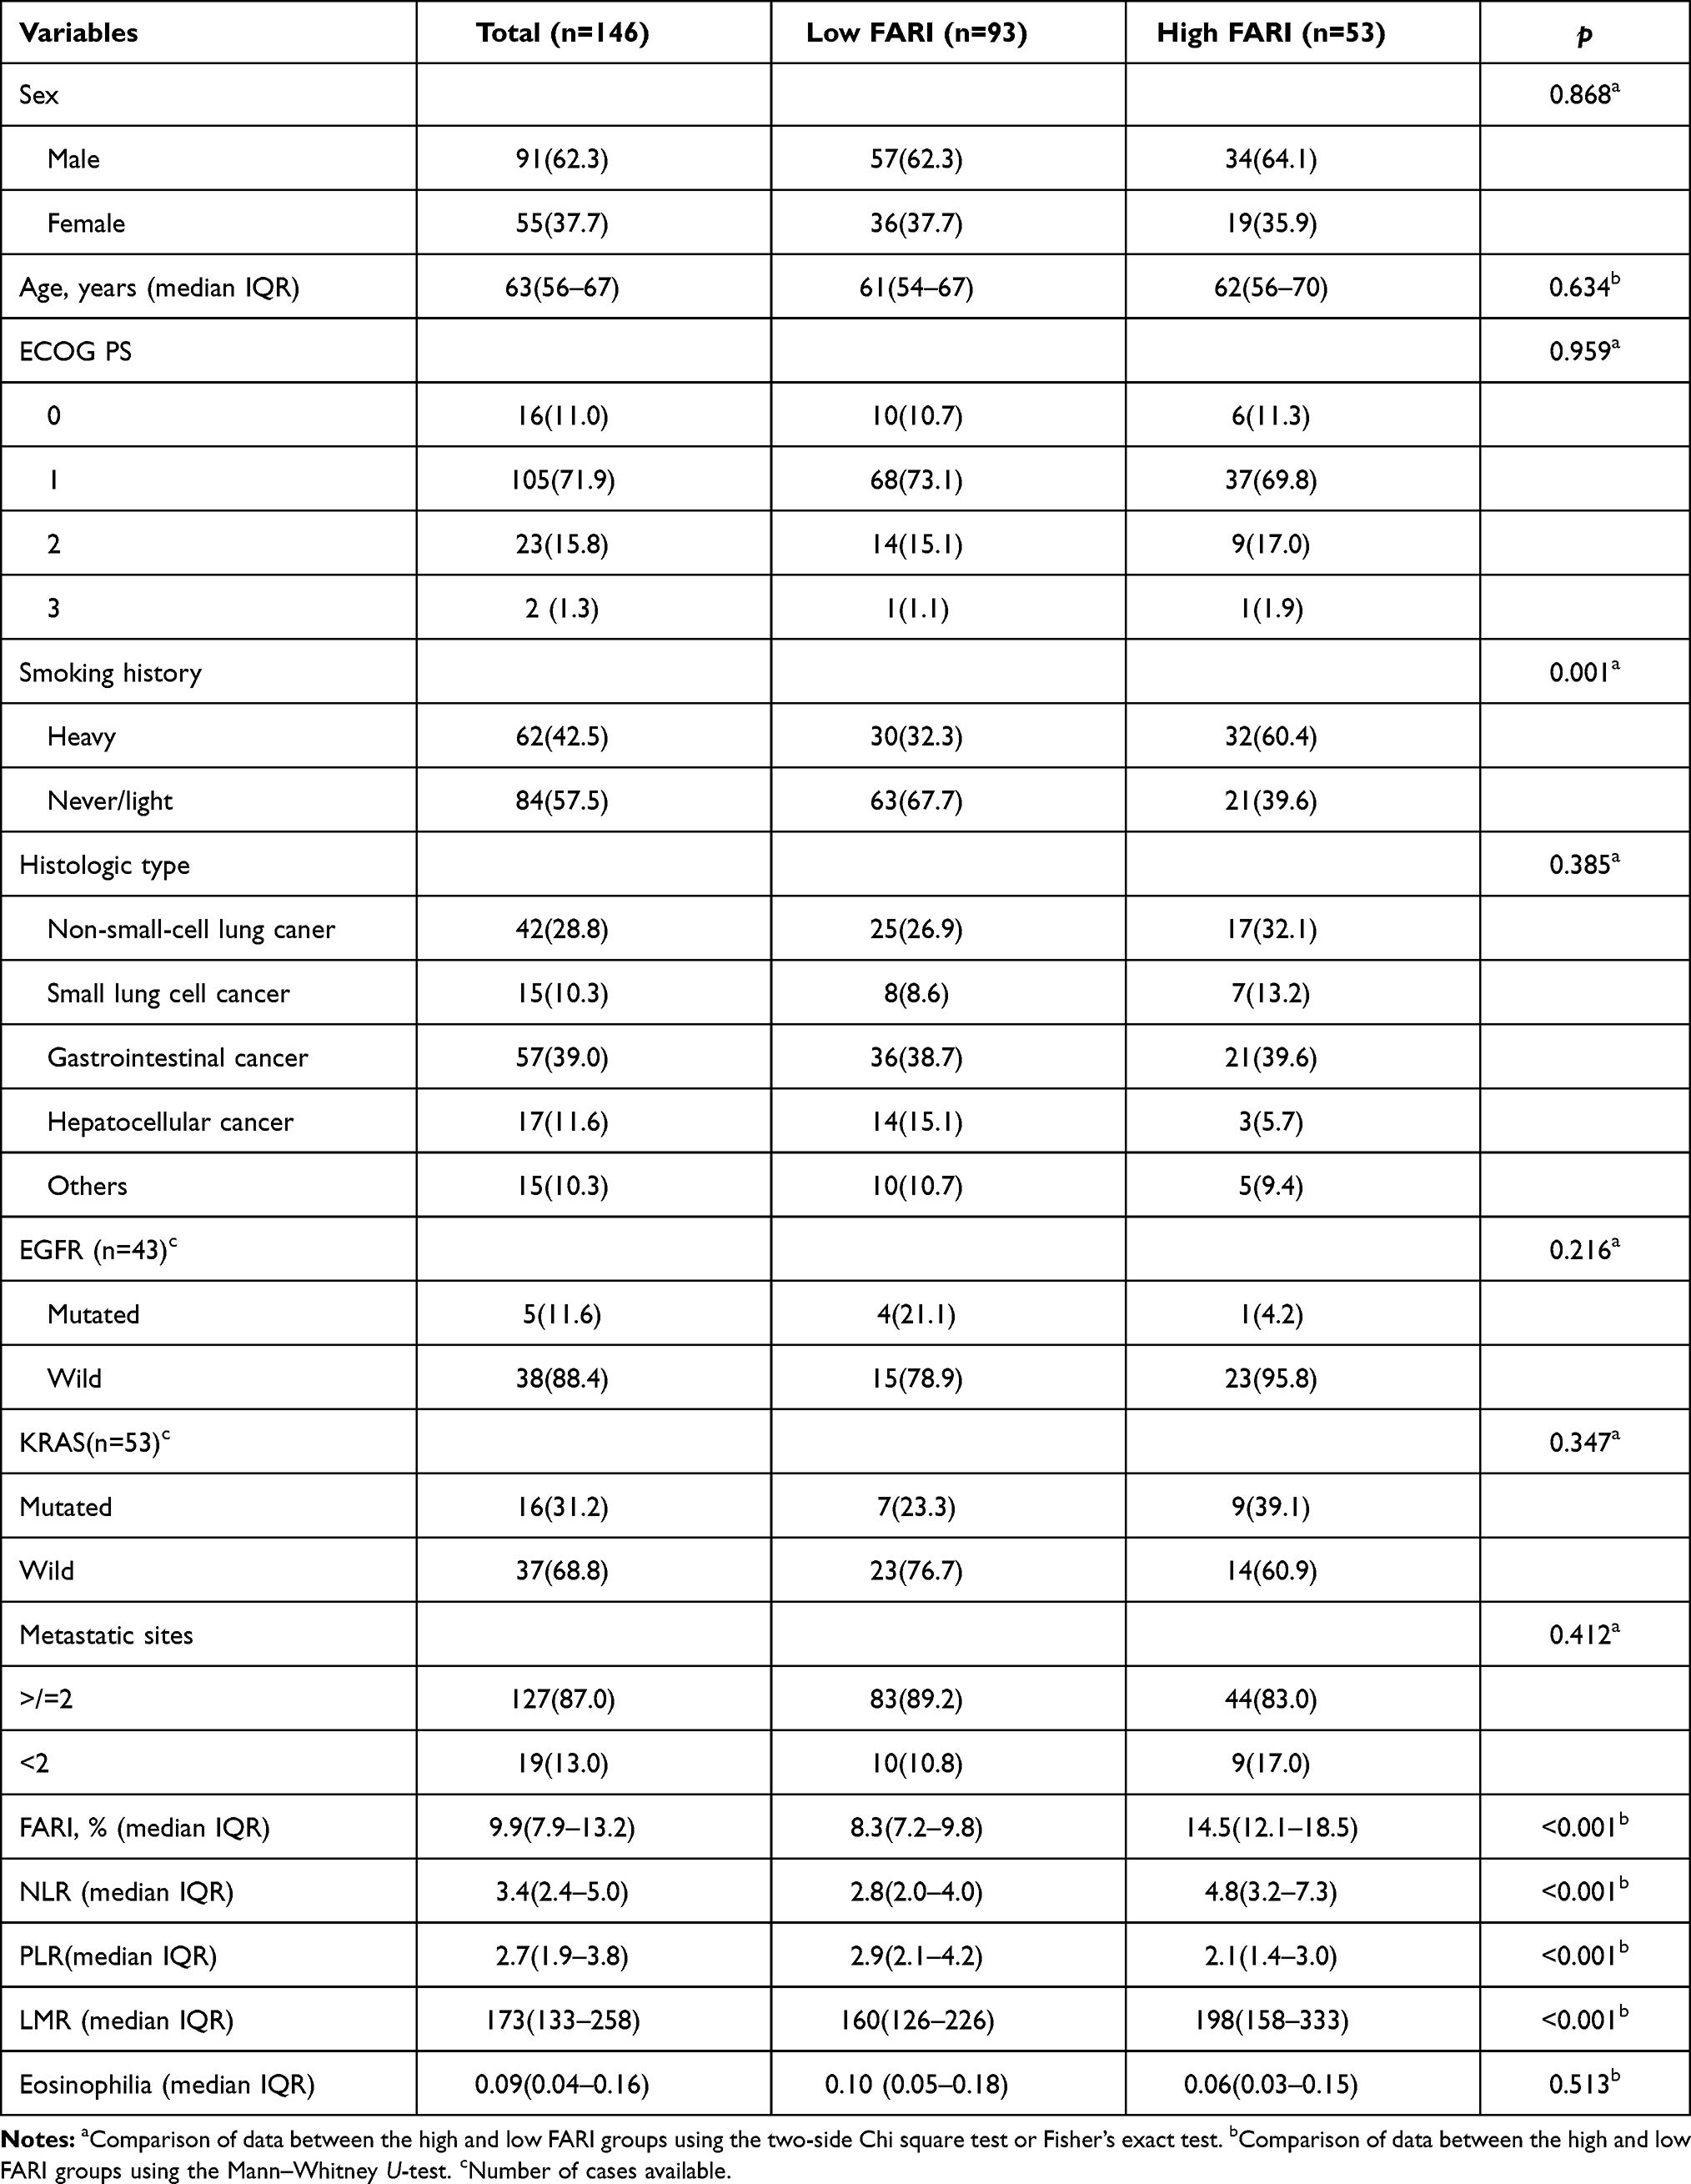 |
Table 1 Patient Characteristics of 146 Cases, as Well as Cases in the High (>11.1%) and Low (≤11.1%) FARI Groups |
X-Tile Analysis to Clear the Optimal Cut-Off Values of FARI, NLR, LMR, and PLR
X-tile analysis illustrated that the optimal cut-off value of the FARI was 11.1% (Figure 1) for 30 months OS. Based on the cut-off value, the cases were identified into low (≤11.1%, n=93) and high (>11.1%, n=53) FARI groups. The best cut-off values for PLR, NLR, LMR, and eosinophilia were 150.7, 6.6, 3.1 and 0, respectively (Figure 1).
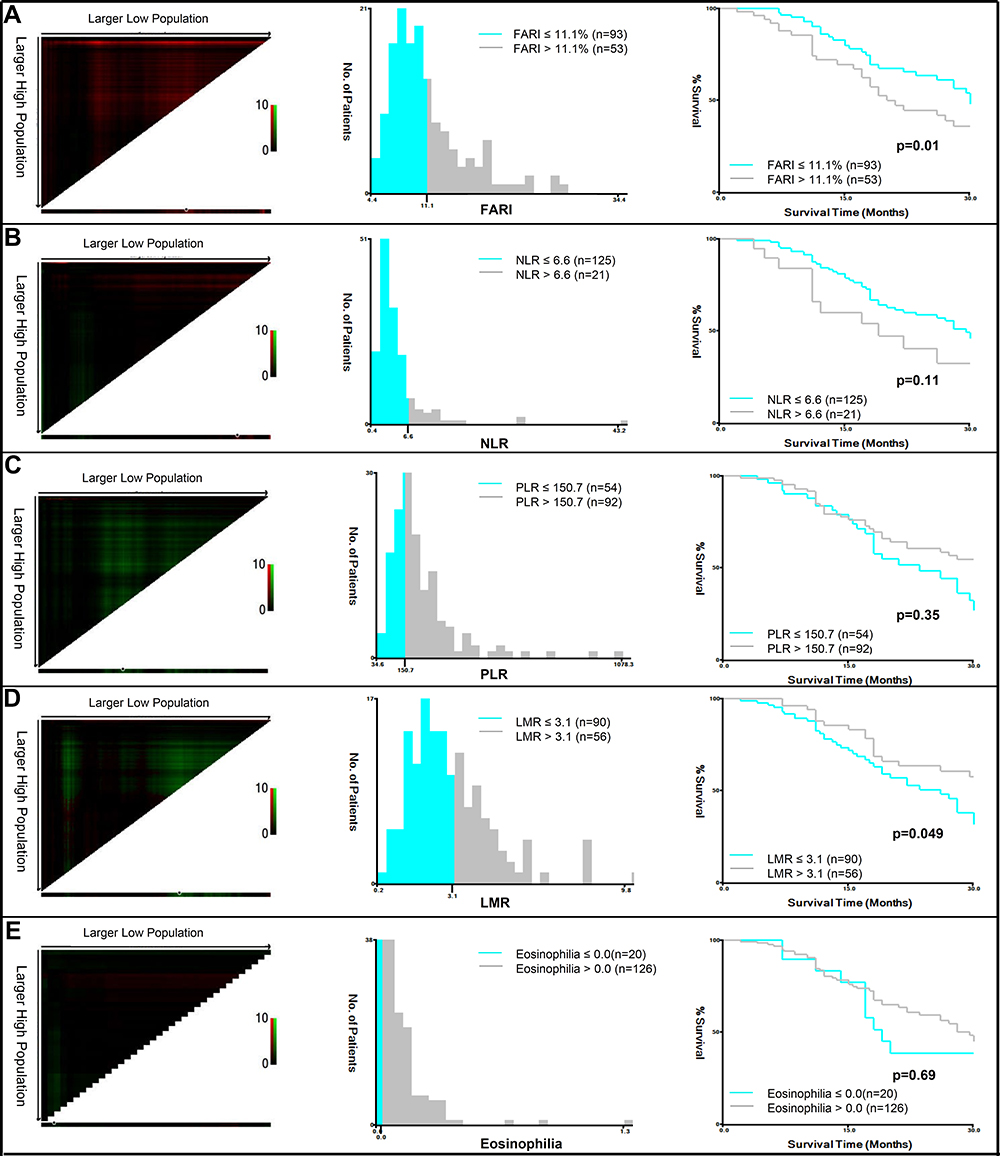 |
Figure 1 X-title analysis to determine the optimal cut-off values of FARI (A), NLR (B), LMR (C), PLR (D) and eosinophilia (E). |
Correlation Between the Fibrinogen–Albumin Ratio Index and Clinical Pathologic Parameters
The correlation was most significant in relation to a history of heavy smoking (p=0.001) for patients in the high FARI group. Sex, age, PS score, histologic type, gene (EGFR or Kras) status, and metastatic sites had no significance in the higher FARI group. For high FARI group, low LMR (<0.001), high NLR (<0.001) and PLR (<0.001) were significant. Howevertively, no p-value was significant in relation to eosinophilia. The detailed parameters are shown in Table 1.
Efficiency of Inflammation Markers in Predicting OS and PFS
The AUC of FARI in predicting OS and PFS was identified in comparison to that of NLR,LMR, PLR, and eosinophilia in Figure 2. As seen, the AUC of FARI in predicting OS was similar to PLR at the time points between 30 months to 50 months approximately. Only at 50 months later was the AUC higher than others. Additionally, it was difficult to judge the clinical significance or the comparison of predictive ability for PFS from the AUCs of FARI, PLR, NLR, LMR, and eosinophilia (Figure 2B).
 |
Figure 2 Time-dependent ROC curve analysis to compare the effect of FARI, PLR, NLR, LMR, and eosinophilia in predicting (A) overall survival and (B) progression-free survival. The vertical axis shows the corresponding area under the ROC curve at different time points, and the horizontal axis represents the time. |
OS and PFS in the High FARI and Low FARI Groups
From the median follow-up time of 17 months (IQR 11–28), we collected 93 patients (63.9%) in the low FARI (≤11.1%) group and 53 patients (36.1%) in the high FARI group (>11.1%). The 1-, 2- and 5-year OS rate in the low FARI group (71.6%, 33.6% and 9.6%, respectively) was significantly longer than that in the high FARI group (52.9%, 27.5% and 4.2%, respectively; p=0.01). The mOS was 29.5 vs 22.0 months in the low FARI group compared with the high FARI group, respectively (Figures 3A, 95%Cl: 0.886–2.425, standard error: 1.466, p=0.01). In NSCLC patients, the mOS was 19.0 months in the high FARI group yet did not achieve an outcome in the low FARI group (Figure 3B–G, 95%Cl: 0.499–1.490, standard error: 4.024, p<0.001). Importantly, the patients who underwent bone metastasis had shorter mOS (120m vs 11.5m) in the high FARI group, respectively (Figure 3H and I,95%Cl: 12.17–23.83, standard error: 2.974, p=0.03). Meanwhile, the PFS did not achieve significance in the two FARI groups (p=0.08) (Figure 4A). From the low FARI group (Figure 4B–I), we found a phenomenon of significant PFS in NSCLC patients (11.0m vs 5.0m, 95%Cl: 3.303–12.697, standard error: 2.397, p=0.03), but no significance in other cancers and metastasis of lung, liver, and bone (Figures 4G–I). The difference between bone, liver, and lung metastasis had an approximately statistical outcome. Only with liver metastasis did patients have shorter PFS than those who did not have liver metastasis in the low FARI group (3.5m vs 5.5m, 95%Cl: 0.547–2.640;3.757–6.243, standard error: 0.634, p=0.01) (Figures 5A–I). Additionally, in the high FARI group, patients who had bone metastasis achieved shorter OS (95%Cl: 10.945–29.055, standard error: 4.62, p=0.04) (Figure 5H). However, no statistical difference was obtained in analysis of PFS or OS (Supplement 1) of PLR, NLR, LMR, and eosinophilia.
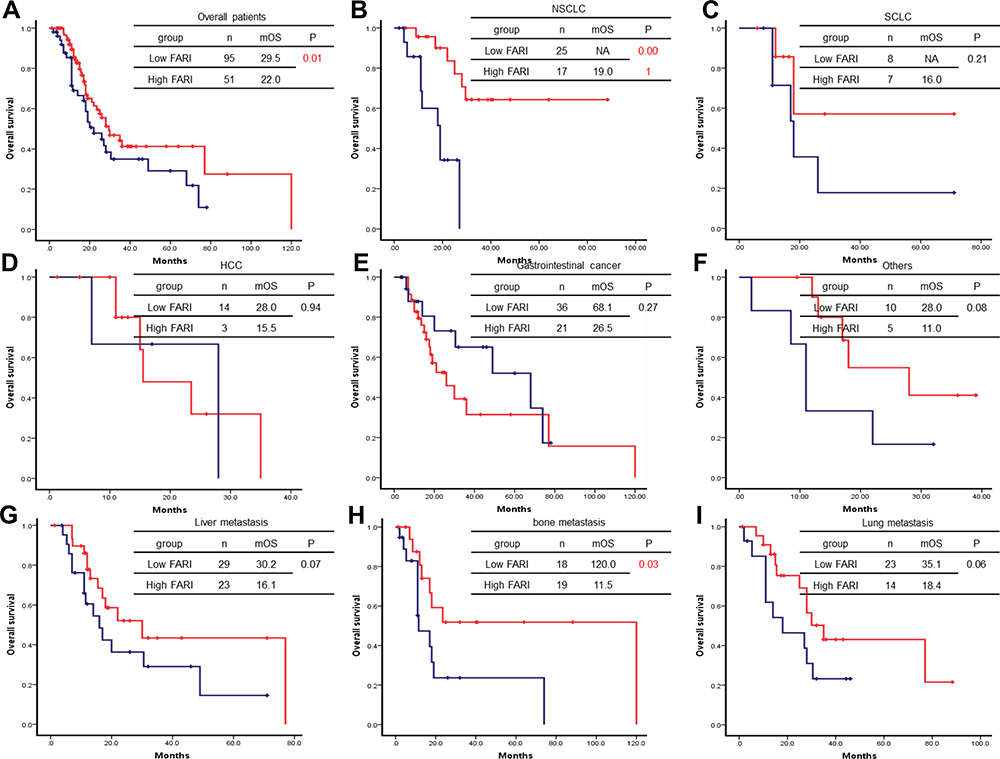 |
Figure 3 Overal survival in different tumor types based on low and high FARI groups. Total OS (A), non-small-cell lung cancer (B), small-cell lung cancer (C), hepatocellular carcinoma (D), gastrointestinal cancer (E), other tumor types (F), liver metastasis (G), bone metastasis (H), and lung metastasis (I) were present. The number, median overall survival and p-value can be seen clearly. A p-value of ≤0.05 was considered significant. |
 |
Figure 4 Progression-free survival in different tumor types based on low and high FARI groups. Total PFS (A), non-small-cell lung cancer (B), small-cell lung cancer (C), hepatocellular carcinoma (D), gastrointestinal cancer (E), other tumor types (F), liver metastasis (G), bone metastasis (H), and lung metastasis (I) were present. The number, median overall survival and p-value can be seen clearly. A p-value of ≤0.05 was considered significant. |
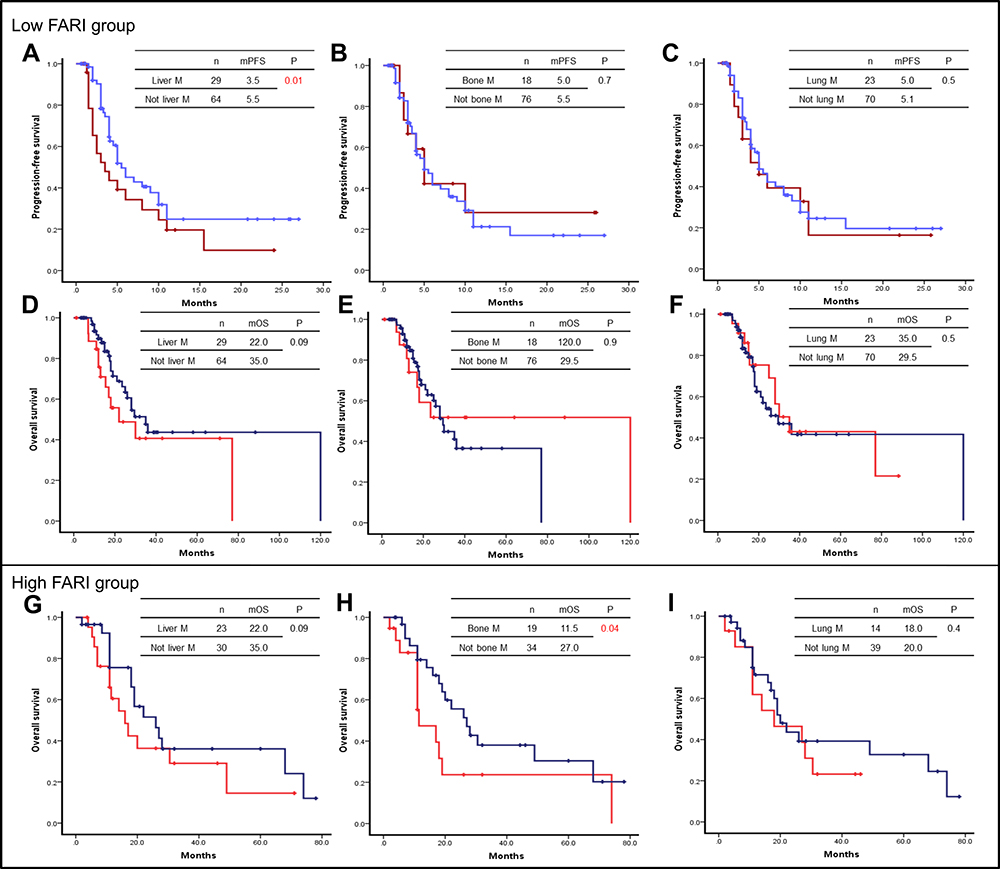 |
Figure 5 We divided patients into two groups: high FARI and low FARI. PFS (A–C) and OS (D–F) patients with liver metastasis or not (A), with bone metastasis or not (B), with lung metastasis or not (C) were present in low FARI group (A–F). And OS (G–I) with liver metastasis or not (G), with bone metastasis or not (H), with lung metastasis or not (I) were shown in the high FARI group. |
Univariable and Multivariable Analyses for PFS and OS
Univariable analyses for PFS demonstrated that ECOG was significant (HR: 2.519, 95%Cl: 1.482–4.282, p<0.001), but not statistically different in FARI, NLR, LMR, PLR, and other levels (Table 2). Multivariable analyses showed that only ECOG was an independent predictor of PFS among patients diagnosed with different therapies. Meanwhile, based on the variables for PFS, ECOG (HR: 3.355, 95%Cl: 1.929–5.834, p<0.001) and FARI (>11.1% vs ≤11.1%: HR:1.324, 95%Cl:0.737–2.376, p=0.048) were significantly associated with OS according to univariable analyses (Table 2). In multivariable analysis, FARI was not determined as an independent predictor of OS in patients undergoing medical therapies (>11.1% vs ≤11.1%:HR:1.269, 95%Cl:0.687–2.032, p=0.314). ECOG (HR: 2.892, 95%Cl: 1.911–4.378, p<0.001) can be an independent predictor for PFS and OS in advanced carcinoma (Table 2).
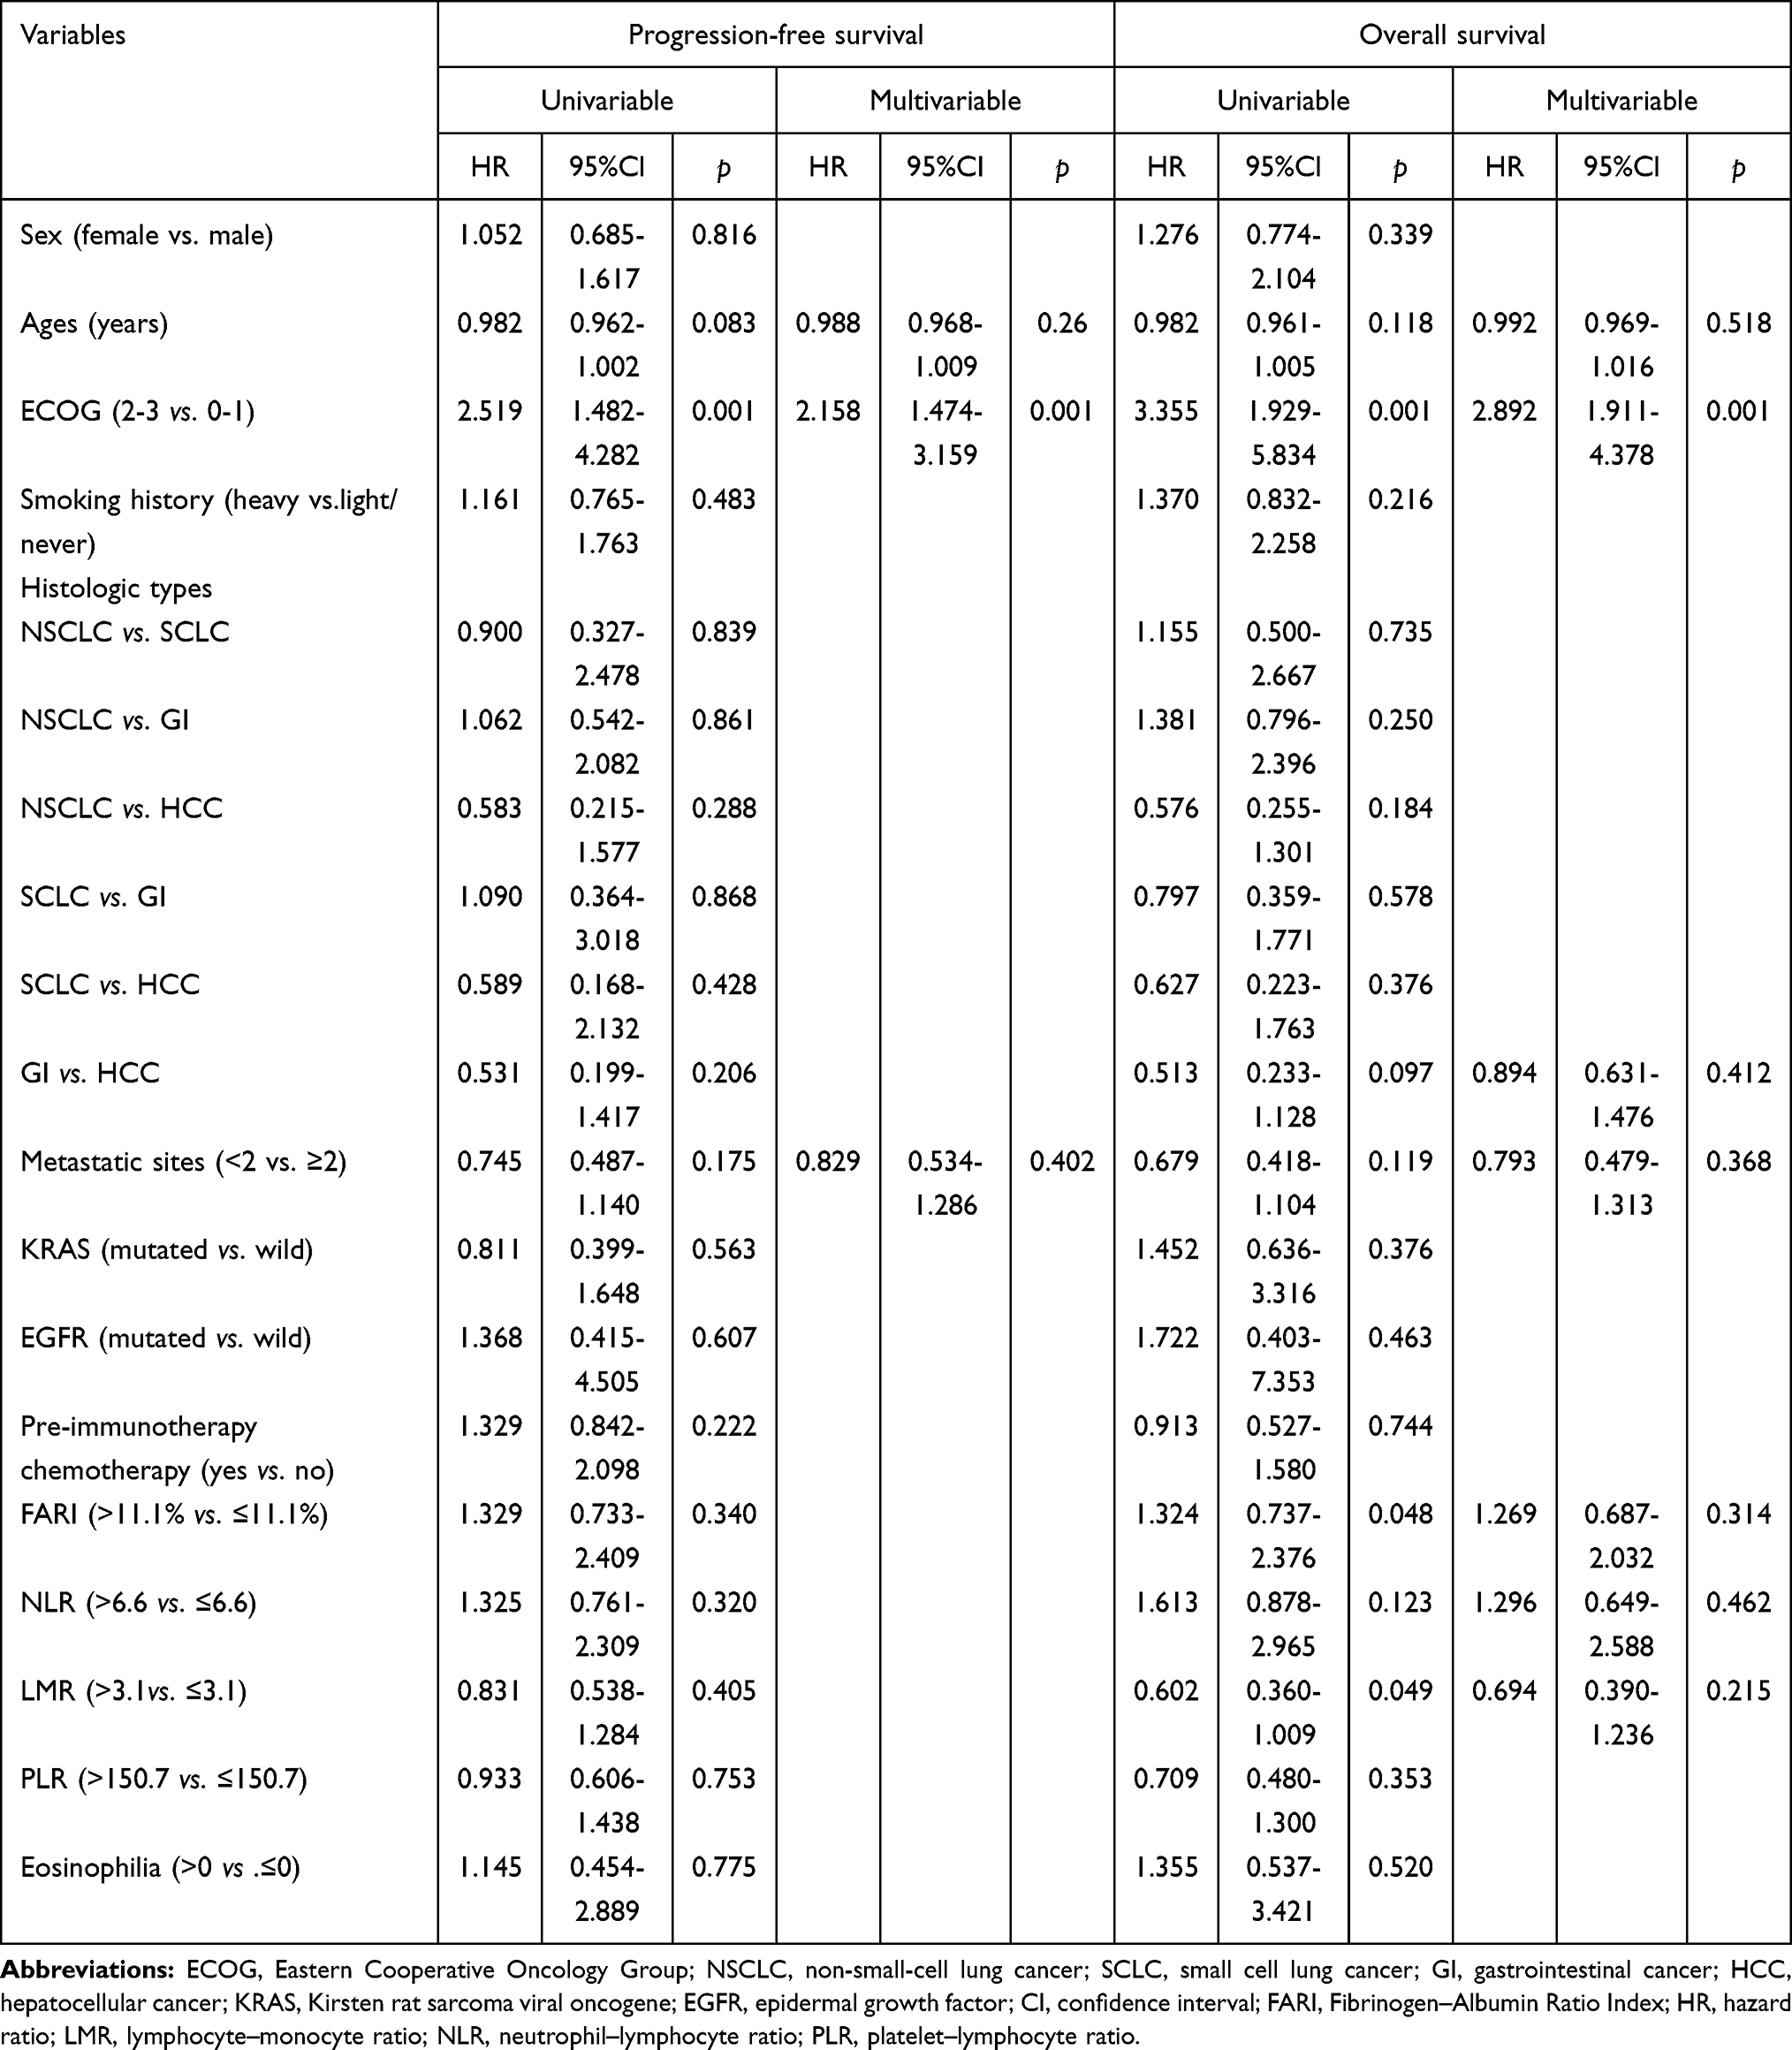 |
Table 2 Univariable and Multivariable Analyses to Determine Independent Predictors of Overall Survival and Progression-Free Survival |
Discussion
In our study, we found the AUC of FARI in predicting PFS and OS was not significant in relation to PLR, NLR, LMR, and eosinophils. Patients with a history of heavy smoking (p=0.001) were more significant in the higher FARI group of various cancer types. What’s more, high FARI indicated high PLR (p<0.001) and NLR (p<0.001), and the low LMR (p<0.001), respectively. The OS was prolonged in the low FARI group. Accordingly, in the low FARI group only together with liver metastasis did patients have shorter PFS; in the high FARI group, patients undergoing bone metastasis achieved shorter OS. Furthermore, ECOG can be an independent predictor for PFS and OS in advanced carcinoma.
Firstly, our paper demonstrated that high FARI reveals high PLR and NLR and low LMR, respectively. Similar results have been reported in many studies.31–33 Wang and Li showed that high FARI had low LMR and high PLR. The results of this paper were similar to those of previous studies.14–17 Different studies demonstrated that NLR and PLR can have potential value or no significance in different cancer types. Whatever the role these biomarkers play in predicting prognosis, this indicates that FARI, PLR, and NLR are consistent in the occurrence and development of the disease.
Interestingly, patients with bone metastases had shorter OS in the high FARI group and patients with liver metastases had shorter PFS in the low FARI group, which had not been mentioned in previous studies.31,32,34 Previous studies have explored how low FARI, low PLR and NLR can indicate further prognosis and better clinical outcomes in different cancers after surgical resection, adjuvant chemo-radiotherapy and first-line treatment. However, our research recruiting patients undergoing multi-line therapy with multiple metastases in advanced tumors showed a variety of differentiating factors in the low and high FARI groups. This research found that if patients had bone metastasis, prognosis was poor in the high FARI group. High FARI also provides a potential biomarker in patients with bone metastases. Besides, based on worse PFS for patients with liver metastasis in the low FARI group, the choice of treatment agents and strategy may have some value. For example, local treatment of the liver may be considered, or more aggressive treatment may be integrated into the therapeutic schedule. Patients with NSCLC with low FARI had longer PFS, but no OS data was obtained, which requires more clinical practice and studies to further explore the significance of FARI.
Furthermore, our paper illustrated that ECOG alone is an independent prognostic risk factor for OS and PFS, not FARI.31,32,34 Many other studies have proven that FARI is an independent risk factor. Why did we get this result? FARI as a biomarker has been researched in perioperative patients more widely. Nevertheless, FARI cannot simply reflect the prognosis in the real world of our data in patients whose ECOG scores were high in general due to more confounding factors in advanced tumors undergoing multiple-line treatment.21–25 In previous studies, we learned that FARI played a certain auxiliary role in predicting prognosis when ECOG was 0–1 preoperatively and before adjuvant therapy and first-line treatment. However, when the ECOG score was ≥1, FARI was not appropriate as an indicator for predicting the prognosis. At this point, the ECOG score and related factors often disturb the prognosis. Does this mean that FARI is not suitable for application in advanced cancer? More clinical practice and related research is needed to explore this issue. After all, in the real world, treating patients with advanced cancer is extremely common and difficult and involves facing difficult choices of treatment strategy. We may provide different schemes for patients; however, our choice may result in improvement of the disease but lose the chance of anti-tumor treatment. We hope these patients can receive better potential prognoses from a more simple, such as FARI. Due to the complexity of advanced tumors in patients, FARI cannot accurately help to predict prognosis and clinical outcome.
The biggest limitations we observed in our study were the small number of cases, many types of tumors, and the limits of the electronic medical record system. An unbalanced number of patients with bone and liver metastasis was present in the low and high FARI group due to the retrospective study. However, it showed that FARI is rarely reported in advanced tumors. This study revealed thatpatients with advanced malignant tumors should not rely on FARI to predict their prognosis.
The important strengths of our study included the setting within integrated therapeutic models with stable patients and meticulous follow-up data. Thus, we studied a historic cohort of patients. Also, we were able to gain reliable, assigned indications from radiographic assessment and complete blood routines using clinical information from real-world Chinese data, using a simple, rapid, accurate, and affordable test.
Conclusion
In conclusion, we have comprehensively described the FARI landscape as a biomarker and identified prognostic immune-associated biomarkers of advanced solid carcinomas. Our findings highlight certain potential biomarkers for predicting responses and clinical values, but also notice that FARI may not be a remarkable marker in patients pretreated with immunotherapy.
Acknowledgments
Ethics approval was obtained and all participants in the study provided informed written consent. TThis study was supported by Peking University International Hospital Research Funds (No. YN2018QN09).
Disclosure
The authors report no conflicts of interest in this work.
References
1. Mantovani A, Allavena P, Sica A, et al. Cancer-related inflammation. Nature. 2008;454:436–444. doi:10.1038/nature07205
2. Beer TM, Armstrong AJ, Rathkopf DE, et al. Enzalutamide in metastatic prostate cancer before chemotherapy. N Engl J Med. 2014;371(5):424–433. doi:10.1056/NEJMoa1405095
3. Ryan CJ, Smith MR, Fizazi K, et al. Abiraterone acetate plus prednisone versus placebo plus prednisone in chemotherapy-naive men with metastatic castration-resistant prostate cancer (COU-AA-302): final overall survival analysis of a randomised, double-blind, placebo-controlled Phase 3 study. Lancet Oncol. 2015;16(2):152–160. doi:10.1016/S1470-2045(14)71205-7
4. Zou W. Immunosuppressive networks in the tumour environment and their therapeutic relevance. Nat Rev Cancer. 2005;5(4):263–274. doi:10.1038/nrc1586
5. Dolan RD, McSorley ST, Park JH, et al. The prognostic value of systemic inflammation in patients undergoing surgery for colon cancer: comparison of composite ratios and cumulative scores. Br J Cancer. 2018;119(1):40–51. doi:10.1038/s41416-018-0095-9
6. Hu B, Yang XR, Xu Y, et al. Systemic immune–inflammation index predicts prognosis of patients after curative resection for hepatocellular carcinoma. Clin Cancer Res. 2014;20(23):6212–6222. doi:10.1158/1078-0432.CCR-14-0442
7. Jagadesham VP, Lagarde SM, Immanuel A, et al. Systemic inflammatory markers and outcome in patients with locally advanced adenocarcinoma of the oesophagus and gastro-oesophageal junction. Br J Surg. 2017;104(4):401–407. doi:10.1002/bjs.10425
8. Zhu ML, Feng M, He F, et al. Pretreatment neutrophil-lymphocyte and platelet-lymphocyte ratio predict clinical outcome and prognosis for cervical cancer. Clinica Chimica Acta. 2018;483:296–302. doi:10.1016/j.cca.2018.05.025
9. Cruz-Ramos M, Puerto-Nevado LD, Zheng BB, et al. Prognostic significance of neutrophil-to lymphocyte ratio and platelet-to lymphocyte ratio in older patients with metastatic colorectal cancer. J Geratic Oncol. 2019;10(5):742–748. doi:10.1016/j.jgo.2018.10.002
10. Wu YC, Li C, Zhao J, et al. Neutrophil-to-lymphocyte and platelet-tolymphocyte ratios predict chemotherapy outcomes and prognosis in patients with colorectal cancer and synchronous liver metastasis. World J Surg Oncol. 2016;14(1):289. doi:10.1186/s12957-016-1044-9
11. Kang MH, Go S-I, Song H-N, et al. The prognostic impact of the neutrophil-tolymphocyte ratio in patients with small-cell lung cancer. Br J Cancer. 2014;111(3):452–460. doi:10.1038/bjc.2014.317
12. Deng Q, He B, Liu X, et al. Prognostic value of pre-operative inflammatory response biomarkers in gastric cancer patients and the construction of a predictive model. J Transl Med. 2015;13:66. doi:10.1186/s12967-015-0409-0
13. Giakoustidis A, Neofytou K, Neves MC, et al. Identifying the role of neutrophil-to-lymphocyte radio and platelets-to-lymphocyte radio as prognostic markers in patients undergoing resection of pancreatic ductal adenocarcinoma. Ann Hepatobiliary Pancreat Surg. 2018;22(3):197–207. doi:10.14701/ahbps.2018.22.3.197
14. Bagley SJ, Kothari S, Aggarwal C, et al. Pretreatment neutrophil-to-lymphocyte ratio as a marker of outcomes in nivolumab-treated patients with advanced non-small-cell lung cancer. Lung Cancer. 2017;106:1–7. doi:10.1016/j.lungcan.2017.01.013
15. Diem S, Schmid S, Krapf M, et al. Neutrophil-to-Lymphocyte ratio (NLR) and Platelet-to-Lymphocyte ratio(PLR) as prognostic markers in patients with non-small cell lung cancer(NSCLC) treated with nivolumab. Lung Cancer. 2017;111:176–181. doi:10.1016/j.lungcan.2017.07.024
16. Templeton AJ, Pezaro C, Omlin A, et al. Simple prognostic score for metastatic castration-resistant prostate cancer with incorporation of neutrophil-to-lymphocyte ratio. Cancer. 2014;120(21):3346–3352. doi:10.1002/cncr.28890
17. Templeton AJ, Ace O, McNamara MJ, et al. Prognostic role of platelet to lymphocyte radio in solid tumors: a systematic review and meta-analysis. Cancer Epidemoil Biomarkers Prev. 2014;23(7):1204–1212. doi:10.1158/1055-9965.EPI-14-0146
18. Ettinger DS, Aisner DL, Wood DE, et al. NCCN guidelines insights: non-small cell lung cancer, version 5. 2018. J Natl Compr Cancer Netw. 2018;16(7):807–821. doi:10.6004/jnccn.2018.0062
19. Gandara DR, Paul SM, Kowanetz M, et al. Blood-based tumor mutational burden as a predictor of clinical benefit in non-small-cell lung cancer patients treated with atizolizumab. Nat Med. 2018;24(9):1441–1448. doi:10.1038/s41591-018-0134-3
20. Hellamnn MD, Ciuleanu TE, Pluzanski A, et al. Nivolumab plus Ipimumab in lung cancer with a high tumor mutational burden. N Engl J Med. 2018;378(22):2093–2104. doi:10.1056/NEJMoa1801946
21. Cai W, Kong W, Dong B, et al. Pretreatment serum prealbumin as an independent prognostic indicator in patients with metastatic renal cell carcinoma using tyosine kinase inhibitors as first-line target therapy. Clin Genitourin Cancer. 2017;15(3):437–446. doi:10.1016/j.clgc.2017.01.008
22. Kawai H, Ota H. Low perioperative serum prealbumin predicts early recurrence after curative pulmonary resction for non-small-cell lung cancer. World J Surg. 2012;36(12):2853–2857. doi:10.1007/s00268-012-1766-y
23. Kelly P, Paulin F, Lamont D, et al. Pre-treatment plasma proteomic markers associated with survival in oesophageal cancer. Br J Cancer. 2012;106(5):955–961. doi:10.1038/bjc.2012.15
24. Gao QF, Qia JC, Huang XH, et al. The predictive and prognostic role of a novel ADS score in esophageal squamous cell carcinoma patients undergoing esophagectomy. Cancer Cell Int. 2018;18:153. doi:10.1186/s12935-018-0648-2
25. Xu WY, Zhang HH, Xiong JP, et al. Prognositic significance of the fibrinogen-to-albumin ratio in gallbladder cancer patients. World J Gastroenterol. 2018;24(29):3281–3292. doi:10.3748/wjg.v24.i29.3281
26. Kalemkerian GP, Loo BW, Akerley W, et al. NCCN guidelines insights: small cell lung cancer, version 2. 2018. J Natl Compr Cancer Netw. 2018;16:1171–1182. doi:10.6004/jnccn.2018.0079
27. Von Mehren M, Randall RL, Benjamin RS, et al. Soft tissue sarcoma, version 2.2018, NCCN clinical practive guidelines in oncology. J Natl Compr Cancer Netw. 2018;16(5):536–563. doi:10.6004/jnccn.2018.0025
28. Qiu H, Zhou Z. Updates and interpretation on NCCN clinical practice guidelines for gastric cancer 2017 version 5. Zhonghua Wei Chang Wai Ke Za Zhi. 2018;21(2):160–164.
29. Provenzale D, Gupta S, Ahnen DJ, et al. NCCN guidelines insights: colorectal cancer screeing, version 1.2018. Natl Compr Cancer Netw. 2018;16(8):939–949. doi:10.6004/jnccn.2018.0067
30. Covey AM. Hepatocellular carcinoma: updates to screeing and diagonsis. J Natl Compr Cancer Netw. 2018;16(5S):633–665.
31. Li SQ, Jiang YH, Lin J, et al. Albumin-to-fibrinogen ratio as a promising biomarker to predict clinical outcome of non-small cell lung cancer individuals. Cancer Med. 2018;7(4):1221–1231. doi:10.1002/cam4.1428
32. Man YN, Chen YF. Systemic immune-inflammation index, serum albumin, and fibrinogen impact prognosis in castration-resistant prostate cancer patients treated with first-line docetaxel. Int Urol Nephrol. 2019;51(12):2189–2199. doi:10.1007/s11255-019-02265-4
33. Wang YY, Liu ZZ, Xu D, et al. Fibrinogen-Albumin Ratio Index (FARI): a more promising inflammation-based pronostic marker for patients undergoing hepatectomy for colorectal liver metastases. Ann Surg Oncol. 2019;26(11):3682–3692. doi:10.1245/s10434-019-07586-3
34. You XY, Zhou Q, Song J, et al. Preoperative albumin-to-fibrinogen ratio predicts severe postoperative complications in elderly gastric cancer subjects after radical laparoscopic gastrectomy. BMC Cancer. 2019;19(1):931. doi:10.1186/s12885-019-6143-x
 © 2021 The Author(s). This work is published and licensed by Dove Medical Press Limited. The full terms of this license are available at https://www.dovepress.com/terms.php and incorporate the Creative Commons Attribution - Non Commercial (unported, v3.0) License.
By accessing the work you hereby accept the Terms. Non-commercial uses of the work are permitted without any further permission from Dove Medical Press Limited, provided the work is properly attributed. For permission for commercial use of this work, please see paragraphs 4.2 and 5 of our Terms.
© 2021 The Author(s). This work is published and licensed by Dove Medical Press Limited. The full terms of this license are available at https://www.dovepress.com/terms.php and incorporate the Creative Commons Attribution - Non Commercial (unported, v3.0) License.
By accessing the work you hereby accept the Terms. Non-commercial uses of the work are permitted without any further permission from Dove Medical Press Limited, provided the work is properly attributed. For permission for commercial use of this work, please see paragraphs 4.2 and 5 of our Terms.