")
Back to Journals » Diabetes, Metabolic Syndrome and Obesity » Volume 14
Fibrinogen to Albumin Ratio as an Independent Risk Factor for Type 2 Diabetic Kidney Disease
Authors Wang K, Xu W, Zha B, Shi J, Wu G, Ding H
Received 14 September 2021
Accepted for publication 2 November 2021
Published 15 November 2021 Volume 2021:14 Pages 4557—4567
DOI https://doi.org/10.2147/DMSO.S337986
Checked for plagiarism Yes
Review by Single anonymous peer review
Peer reviewer comments 2
Editor who approved publication: Prof. Dr. Antonio Brunetti
Kai Wang,1,2,* Wenjun Xu,3,* Bingbing Zha,1 Jindong Shi,2 Guowei Wu,3 Heyuan Ding1,3
1Department of Endocrinology, Shanghai Fifth People’s Hospital, Fudan University, Shanghai, People’s Republic of China; 2Department of Respiratory and Critical Care Medicine, Shanghai Fifth People’s Hospital, Fudan University, Shanghai, People’s Republic of China; 3Department of Nephrology, Zhejiang Kaihua County Hospital of Chinese Medicine, Zhejiang, People’s Republic of China
*These authors contributed equally to this work
Correspondence: Heyuan Ding
Department of Endocrinology, Shanghai Fifth People’s Hospital, Fudan University, 801 Heqing Road, Minhang District, Shanghai, 200240, People’s Republic of China
Email [email protected]
Guowei Wu
Department of Nephrology, Zhejiang Kaihua County Hospital of Chinese Medicine, 10 Zhongshan Road, Kaihua County, Zhejiang, 324399, People’s Republic of China
Email [email protected]
Purpose: Diabetic kidney disease (DKD) is an inflammatory disease. This study aimed to investigate the association of fibrinogen to albumin ratio (FAR) with DKD.
Patients and Methods: A total of 1022 type 2 diabetes mellitus (T2DM) patients with DKD and 1203 T2DM patients without DKD were enrolled in this study. Laboratory values including blood cell count, hemoglobin A1c, biochemical parameters, and fibrinogen and albumin creatinine ratio were recorded. Patients were classified according to tertile of admission FAR. Clinical parameters were compared between groups. Logistic regression, linear regression, ROC analysis and spline regression were carried out.
Results: FAR in the DKD group was significantly higher than that in the non-DKD group. FAR had the highest odds ratio as an independent risk factor for the development of DKD and the highest area under ROC curve for predicting DKD compared with albumin (ALB) or fibrinogen (FIB) alone. Simple linear regression analyses revealed a significant and linear correlation of FAR with neutrophil and neutrophil-to-lymphocyte ratio. FAR was an independent risk factor for development of DKD. Spline regression showed that there was a significant linear association between DKD incidence and continuous FAR value when it exceeded 67.3mg/g.
Conclusion: FAR is a stronger independent predictor of DKD than FIB and ALB. FAR is an independent risk factor for DKD development when it exceeded 67.3mg/g. FAR might be one of novel diagnostic biomarkers to predict and prevent DKD progression. However, a prospective study to validate the prognostic model is still needed.
Keywords: type 2 diabetes mellitus, diabetic kidney disease, inflammation, fibrinogen to albumin ratio
Graphical Abstract:
Introduction
Diabetic kidney disease (DKD) is the most prevalent chronic renal disease.1 Around 35–40% of patients with type 2 diabetes mellitus (T2DM) will go on to develop DKD.2 DKD is characterized by albuminuria and reduced estimated glomerular filtration rate (eGFR), both of which are independent risk factors for end-stage kidney disease (ESKD), cardiovascular events, and death.3,4 DKD accounts for a significant increase in mortality among diabetic patients and is a grave threat to their clinical outcome.
Inflammation plays a major role in the development of DKD.5,6 Serum fibrinogen (FIB) is a biomarker of coagulation and inflammation.7–9 Elevated serum FIB is an independent risk factor of DKD progression to ESKD in patients with T2DM.10 Albumin (ALB) has anti-inflammatory functions and antioxidant properties.11,12 Hypoalbuminemia is associated with a poorer renal prognosis in patients with T2DM and DKD.13 Fibrinogen to albumin ratio (FAR) is a more significant prognostic marker than each single marker itself in cancer study.14–16 We speculated that FAR is also closely related to DKD.
To date, the prognostic role of FAR in patients with DKD has not been determined. Our study aimed to investigate this association.
Patients and Methods
Study Participants
The study complied with the Declaration of Helsinki and all subjects gave written informed consent. The study was approved by the ethics committees of Shanghai Fifth People’s Hospital (No.2018–213) and Zhejiang Kaihua County Hospital of Chinese Medicine (No.2019–002).
Between January 2018 and December 2020, 2602 patients with T2DM, diagnosed according to the American Diabetes Association (ADA) criteria,17 were recruited from the Department of Endocrinology, Shanghai Fifth People’s Hospital and the Department of Nephrology, Zhejiang Kaihua County Hospital of Chinese Medicine.
DKD was defined as the presence of macro-albuminuria or micro-albuminuria in association with diabetic retinopathy according to the diagnostic criteria of KDOQI clinical practice guidelines.18 Macroalbuminuria was defined as an albumin creatinine ratio (ACR) > 300 mg/g and micro-albuminuria as an ACR 30 to 300 mg/g in two of three urine samples.
Patients were excluded from study if they had any of the following: ESKD (defined as requirement of dialysis, renal transplantation, or eGFR<15mL/min/1.73 m2 at baseline), manifest cardiovascular disease (CVD), acute infectious disease, history of hepatitis and HIV virus infection or carrier, diabetic ketoacidosis, any kind of cancer, unstable thyroid function, undergoing steroid therapy, or established autoimmune disease. The retrospective analysis is described in Figure 1. After exclusions, data from 1022 patients with DKD and 1203 patients without DKD were analyzed.
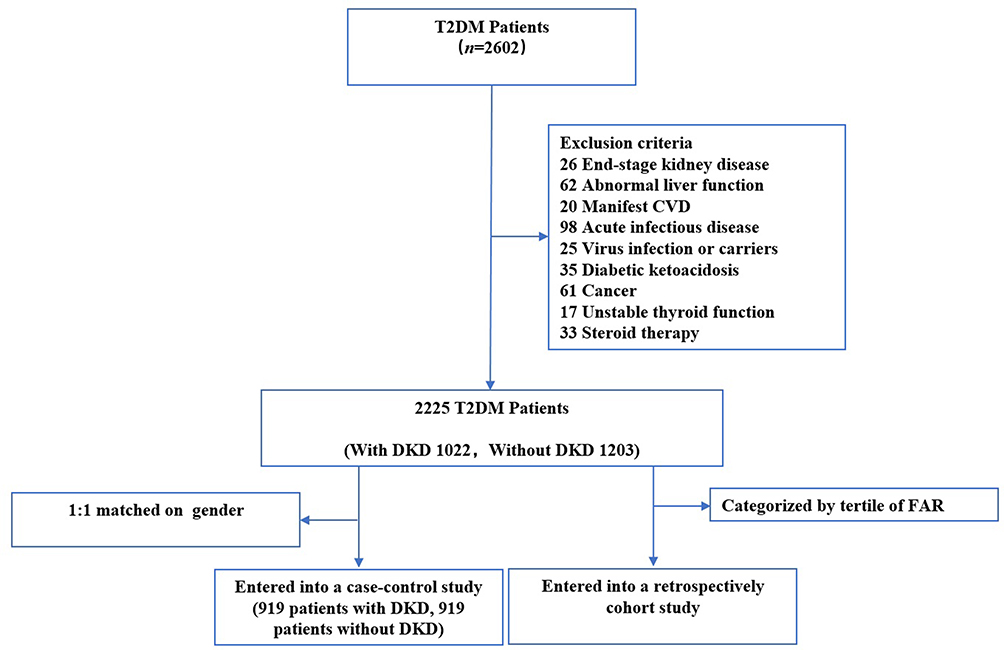 |
Figure 1 The flowchart of this study. Abbreviations: DKD, diabetic kidney disease; T2DM, type 2 diabetes mellitus; CVD, cardiovascular disease; FAR, fibrinogen to albumin ratio. |
Data Collection and Laboratory Assessments
Patient’s age and medical history, duration of disease, hypertension, body mass index (BMI), and systolic (SBP) and diastolic blood pressure (DBP) were recorded. After a 12-hour overnight fast, blood was collected for measurement of full blood count (XN9000, Sysmex, Japan) and hemoglobin A1c (HbA1c, Variant II, Bio-Rad, USA), biochemical parameters (Cobas 8000, Roche, Switzerland), and FIB (CS5100, Sysmex Corporation, Japan). A urine sample was collected for measurement of ACR (Turbidimetry Hitachi system, Roche, Germany). eGFR was calculated using the modification of diet in renal disease (MDRD) equation developed for the Chinese population: eGFR (mL/min/1.73m2) = 186 × (Crea×0.011)−1.154 × (age)−0.203 × (0.742 if female/1 if male) ×1.233, where creatinine (Crea) was in µmol/L and 1.233 was the adjusting coefficient for Chinese patients.19
Statistical Analysis
A case control matching analysis was performed to avoid the potential bias of an uneven distribution of covariates between individuals with and without DKD. Data with normal distribution are expressed as mean ± standard deviation and were analyzed by student t test or ANOVA test. Non-normally distributed variables are expressed as median and interquartile range (IQR) and were analyzed by nonparametric tests (Mann–Whitney or Kruskal–Wallis). Categorical variables are presented as frequencies and proportions and were analyzed by χ2 test. Pearson correlation analysis was used to determine the biochemical parameters that showed significant changes in the case control matching analysis. To determine the risk factors for development of DKD, logistic regression analysis (enter method) was used in the matched case-control analysis and cohort study. Statistical descriptions for logistic regression analysis are presented as regression coefficient (standard error) and odds ratio (95% confidence interval). Continuous association of FAR with DKD incidence was determined by spline regression analysis. All data were analyzed using SPSS 24.0 software (IBM, Armonk, NY) and R software (version R 4.0.1). A two-tailed P value < 0.05 was considered statistically significant.
Results
Demographics of Patients with and without DKD in the Matched Case-Control Study
Demographics and clinical data of all subjects were shown in Table 1. There were significant differences on clinical characteristics, including gender (male/female) (736:467 vs 452:570, P<0.001), age, disease duration, BMI and SBP between the patients with or without DKD. Meanwhile, significant differences were also observed on laboratory parameters, including neutrophil (NEU), lymphocyte (LYM), neutrophil-to-lymphocyte ratio (NLR), fasting plasma glucose (FPG), triglyceride (TG), urea nitrogen (UN), uric acid (UA), creatinine (Crea), eGFR, ACR, alanine aminotransferase (ALT), FIB (2652.7 ± 711.1 mg/L vs 3112.8 ± 992.7 mg/L, P<0.001) between the patients with or without DKD. Notably, patients with DKD had a higher level of FAR than individuals without DKD (62.8 ± 19.9 mg/g vs 78.1 ± 33.6 mg/g, P<0.001) (Table 1).
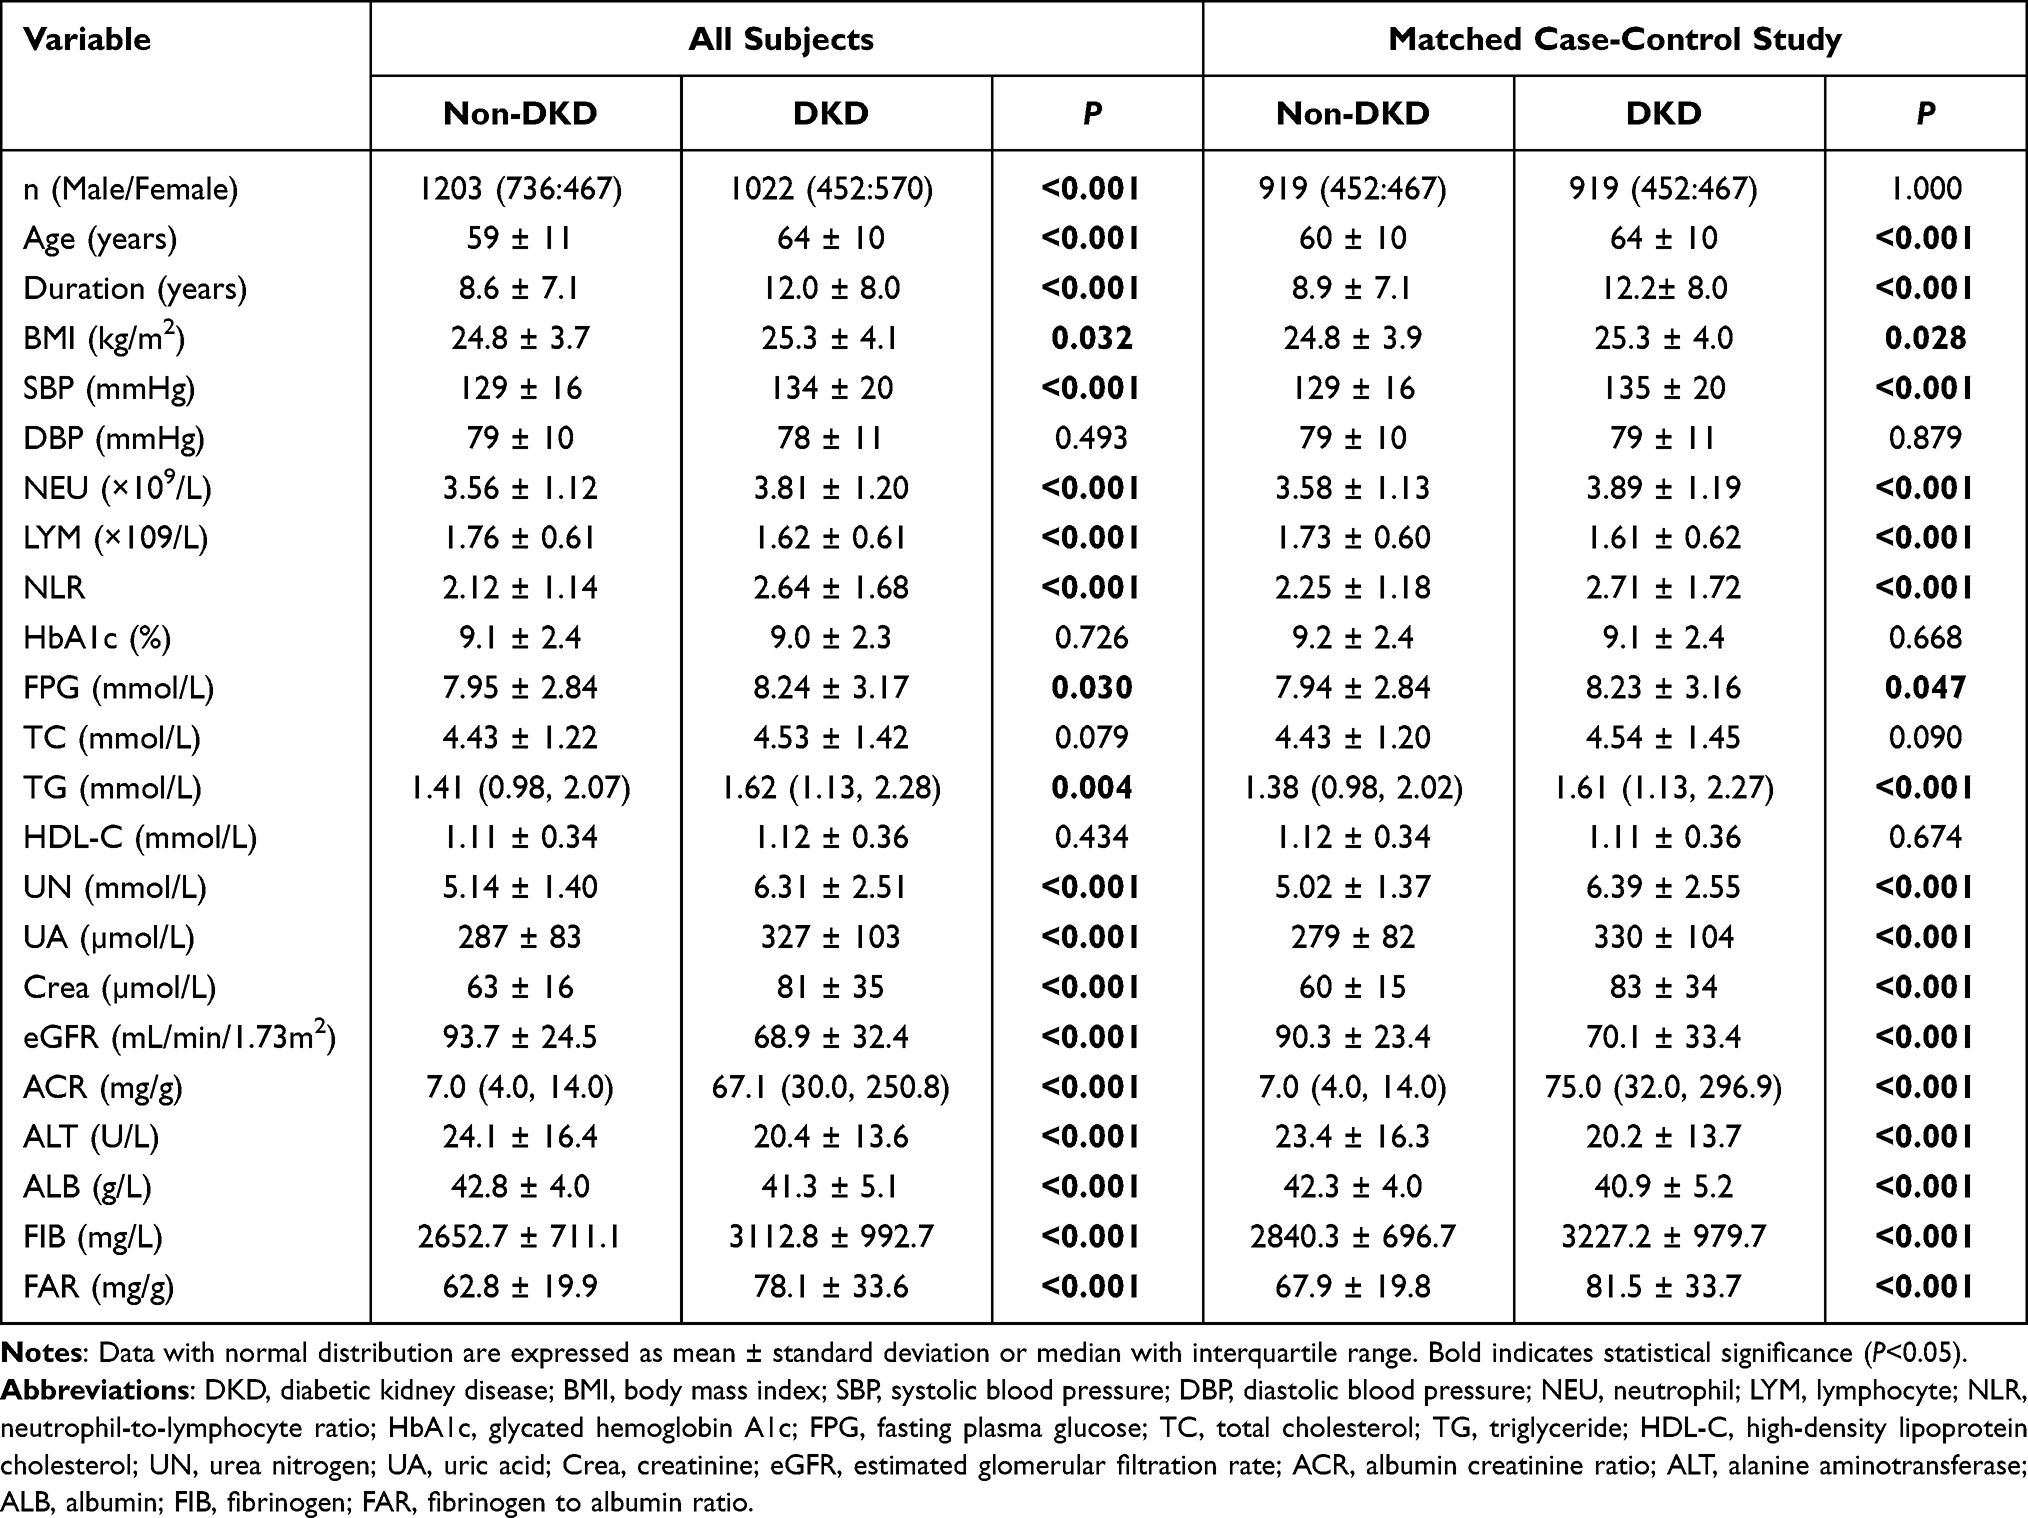 |
Table 1 Demographics of the Study Population |
To avoid the statistical bias, which may cause uneven distribution of covariates between the individuals with and without DKD, a 1:1 case-control matching analysis was performed. After covariates matching, significant differences were still remained on age, disease duration, BMI, SBP, NEU, LYM, NLR, FPG, TG, UN, UA, Crea, eGFR, ACR, ALT, ALB (42.3 ± 4.0 g/L vs 40.9 ± 5.2 g/L, P<0.001), FIB (2840.3 ± 696.7 mg/L vs 3227.2 ± 979.7 mg/L, P<0.001), FAR (67.9 ± 19.8 mg/g vs 81.5 ± 33.7 mg/g, P<0.001) (Table 1).
Higher FAR Outperformed ALB and FIB as an Independent Risk Factor and Diagnostic Predictive Factor for DKD in the Matched Case-Control Study
Logistic regression analysis with enter selection was performed separately in the matched case-control study to compare the predictive ability of FAR, ALB and FIB for development of DKD. Results revealed that FAR had the highest odds ratio (OR) value as an independent risk factor for the development of DKD in the middle (OR: 1.395; 95% CI:1.089–1.788; vs the lowest tertile, P= 0.008) and highest tertile of patients (OR: 2.879; 95% CI: 2.239, 3.700; vs the lowest tertile, P <0.001) regardless of age or TG compared with ALB (OR: 0.754; 95% CI: 0.590, 0.963 in the middle tertile vs the lowest tertile, P= 0.024; OR: 0.648; 95% CI: 0.504–0.832 in the highest tertile vs the lowest tertile, P=0.001) and FIB (OR: 1.343; 95% CI: 1.047–1.724 in the middle tertile vs the lowest tertile, P= 0.020; OR: 2.624; 95% CI: 2.040–3.375 in the highest tertile vs the lowest tertile, P<0.001) (Table 2).
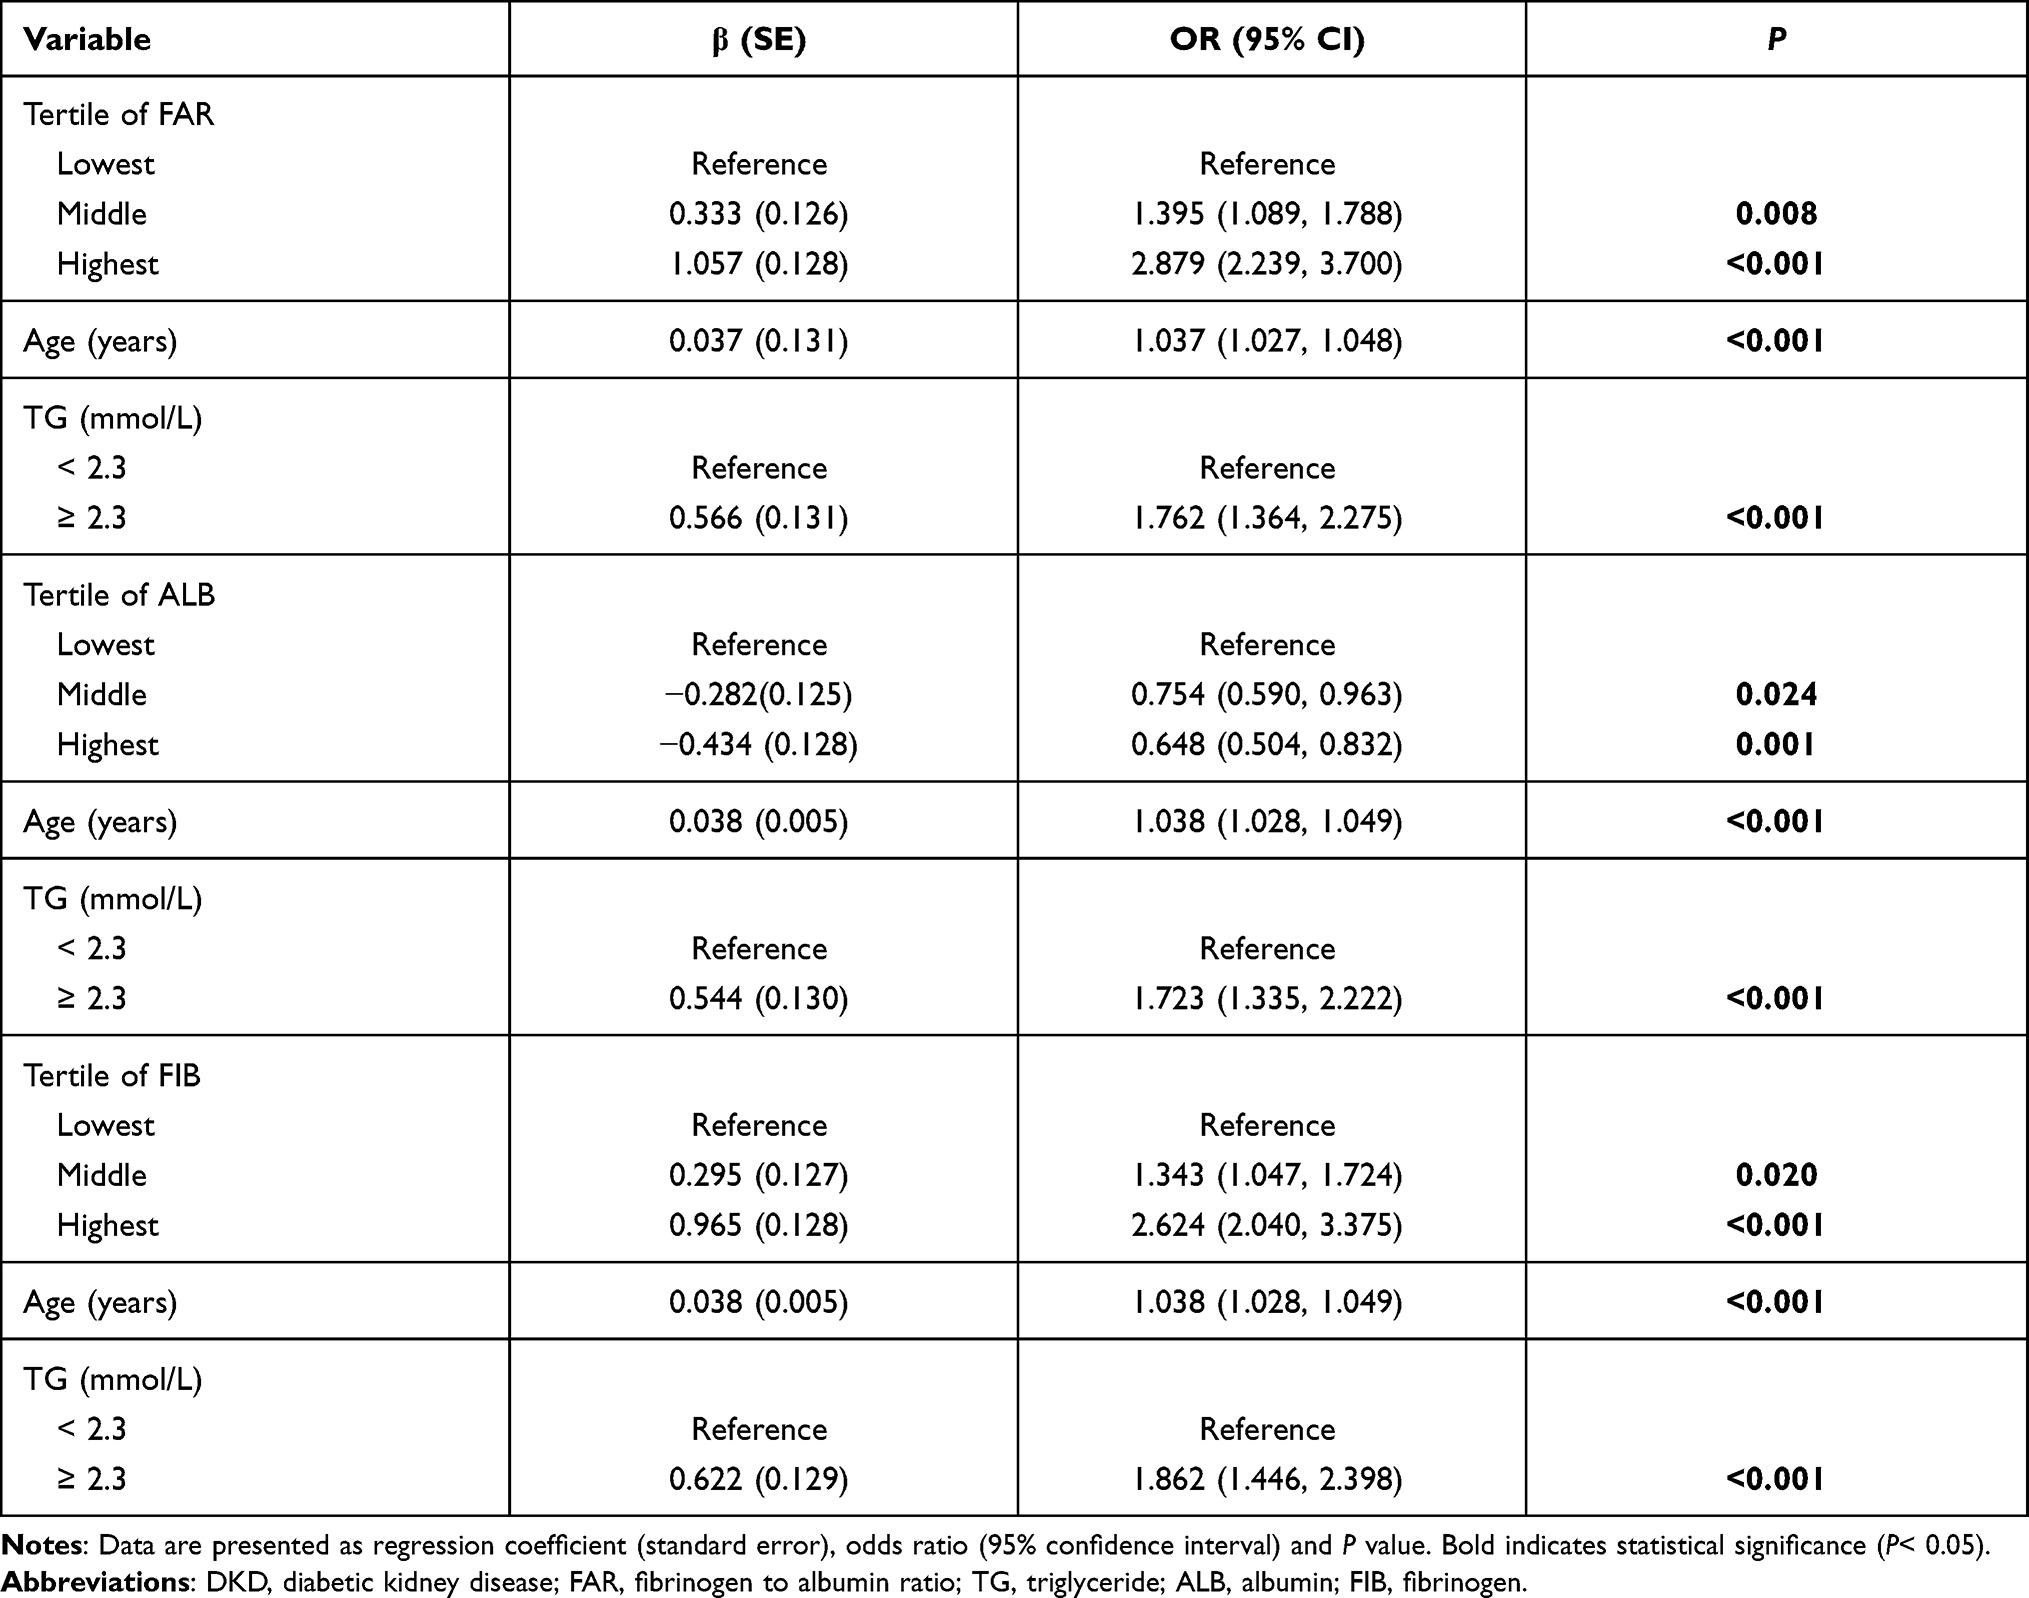 |
Table 2 Logistic Regression Analysis (Enter Method) to Determine Risk Factors for Development of DKD in the Case-Control Study |
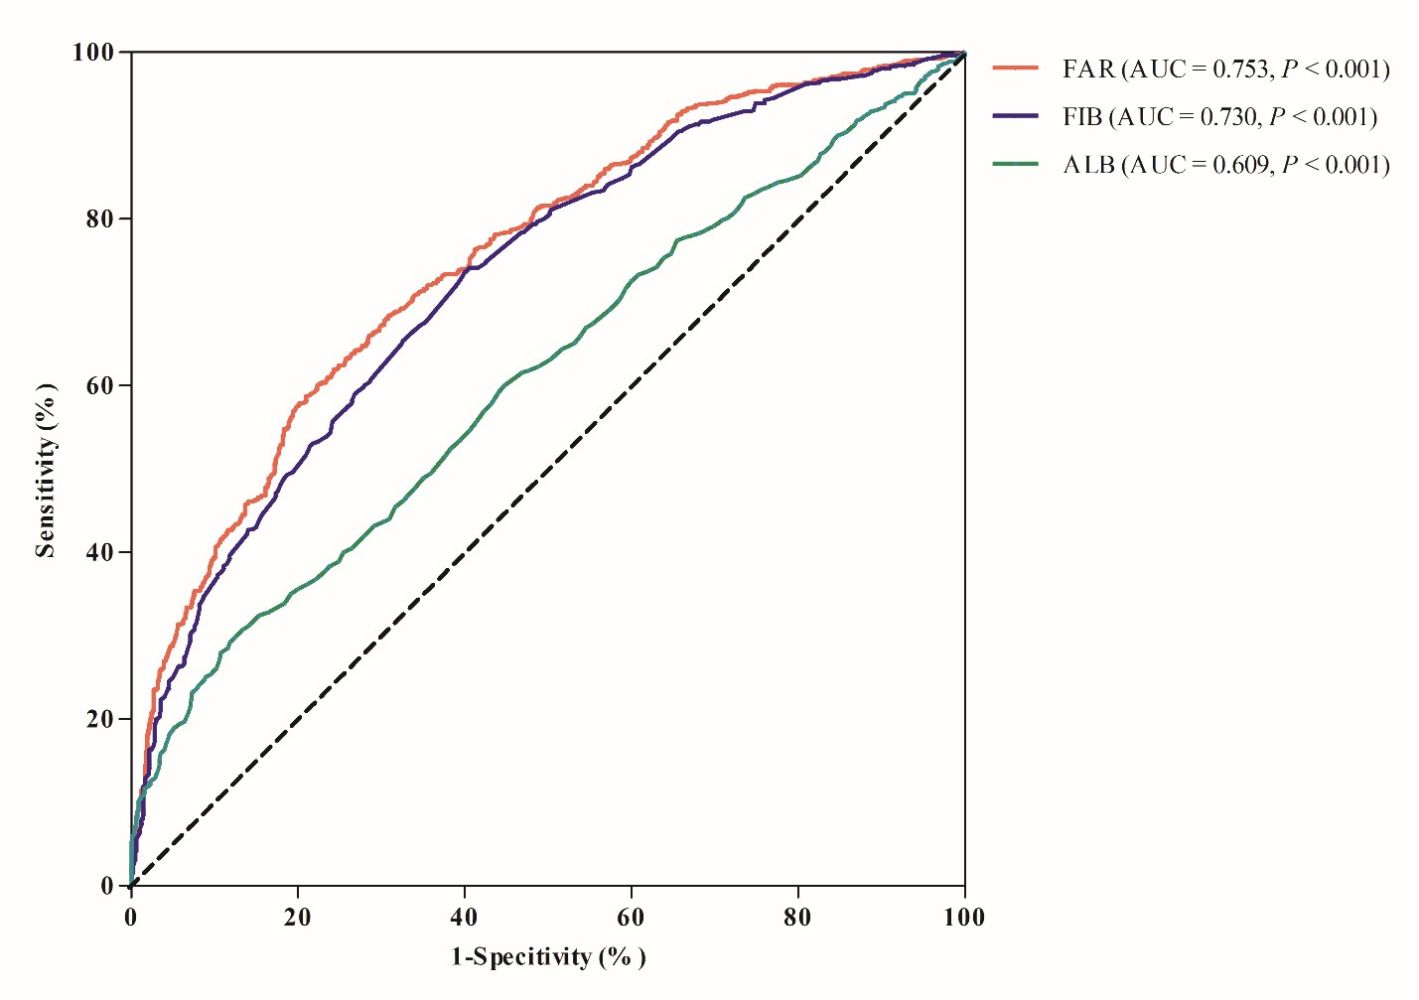
In addition, FAR had the highest area under receiver operating characteristic curve (AUC) for prediction of DKD compared with ALB and FIB (0.753, 0.730 and 0.609 respectively) (Figure 2). The optimal value of FAR as an indicator for monitoring the development of DKD was 71.7 mg/g, which yielded a sensitivity of 58.8% and a specificity of 79.9%.
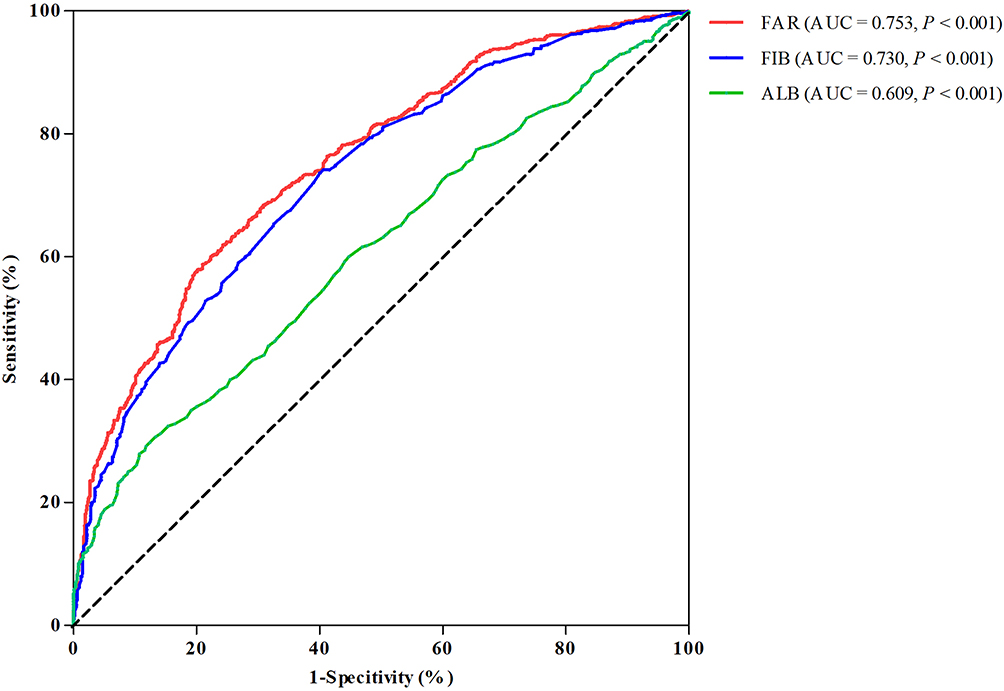 |
Figure 2 ROC curve of FAR, FIB and ALB for diagnosing DKD. Abbreviations: FAR, fibrinogen to albumin ratio; FIB, fibrinogen; ALB, albumin; AUC, area under ROC curve. |
Comparison of Clinical Parameters Among Three Groups Categorized by Tertile of FAR in the Cohort Study
Subjects were divided into three groups according to tertile of FAR, lowest group (below 61.2 mg/g), middle group (61.2 to 75.4 mg/g), and highest group (above 75.4 mg/g). Significant differences were observed on age, disease duration, SBP, NEU, NLR, HbA1c, UN, UA, Crea, eGFR, ACR, ALT, ALB (43.5 ± 3.7 g/L vs 42.4 ± 3.8 g/L vs 39.0 ± 5.1 g/L, P<0.001), FIB (2337.0 ± 301.7 mg/L vs 2857.0 ± 293.7 mg/L vs 3906.2 ± 909.7 mg/L, P<0.001) cross the lowest, middle, and highest groups, respectively (Table 3).
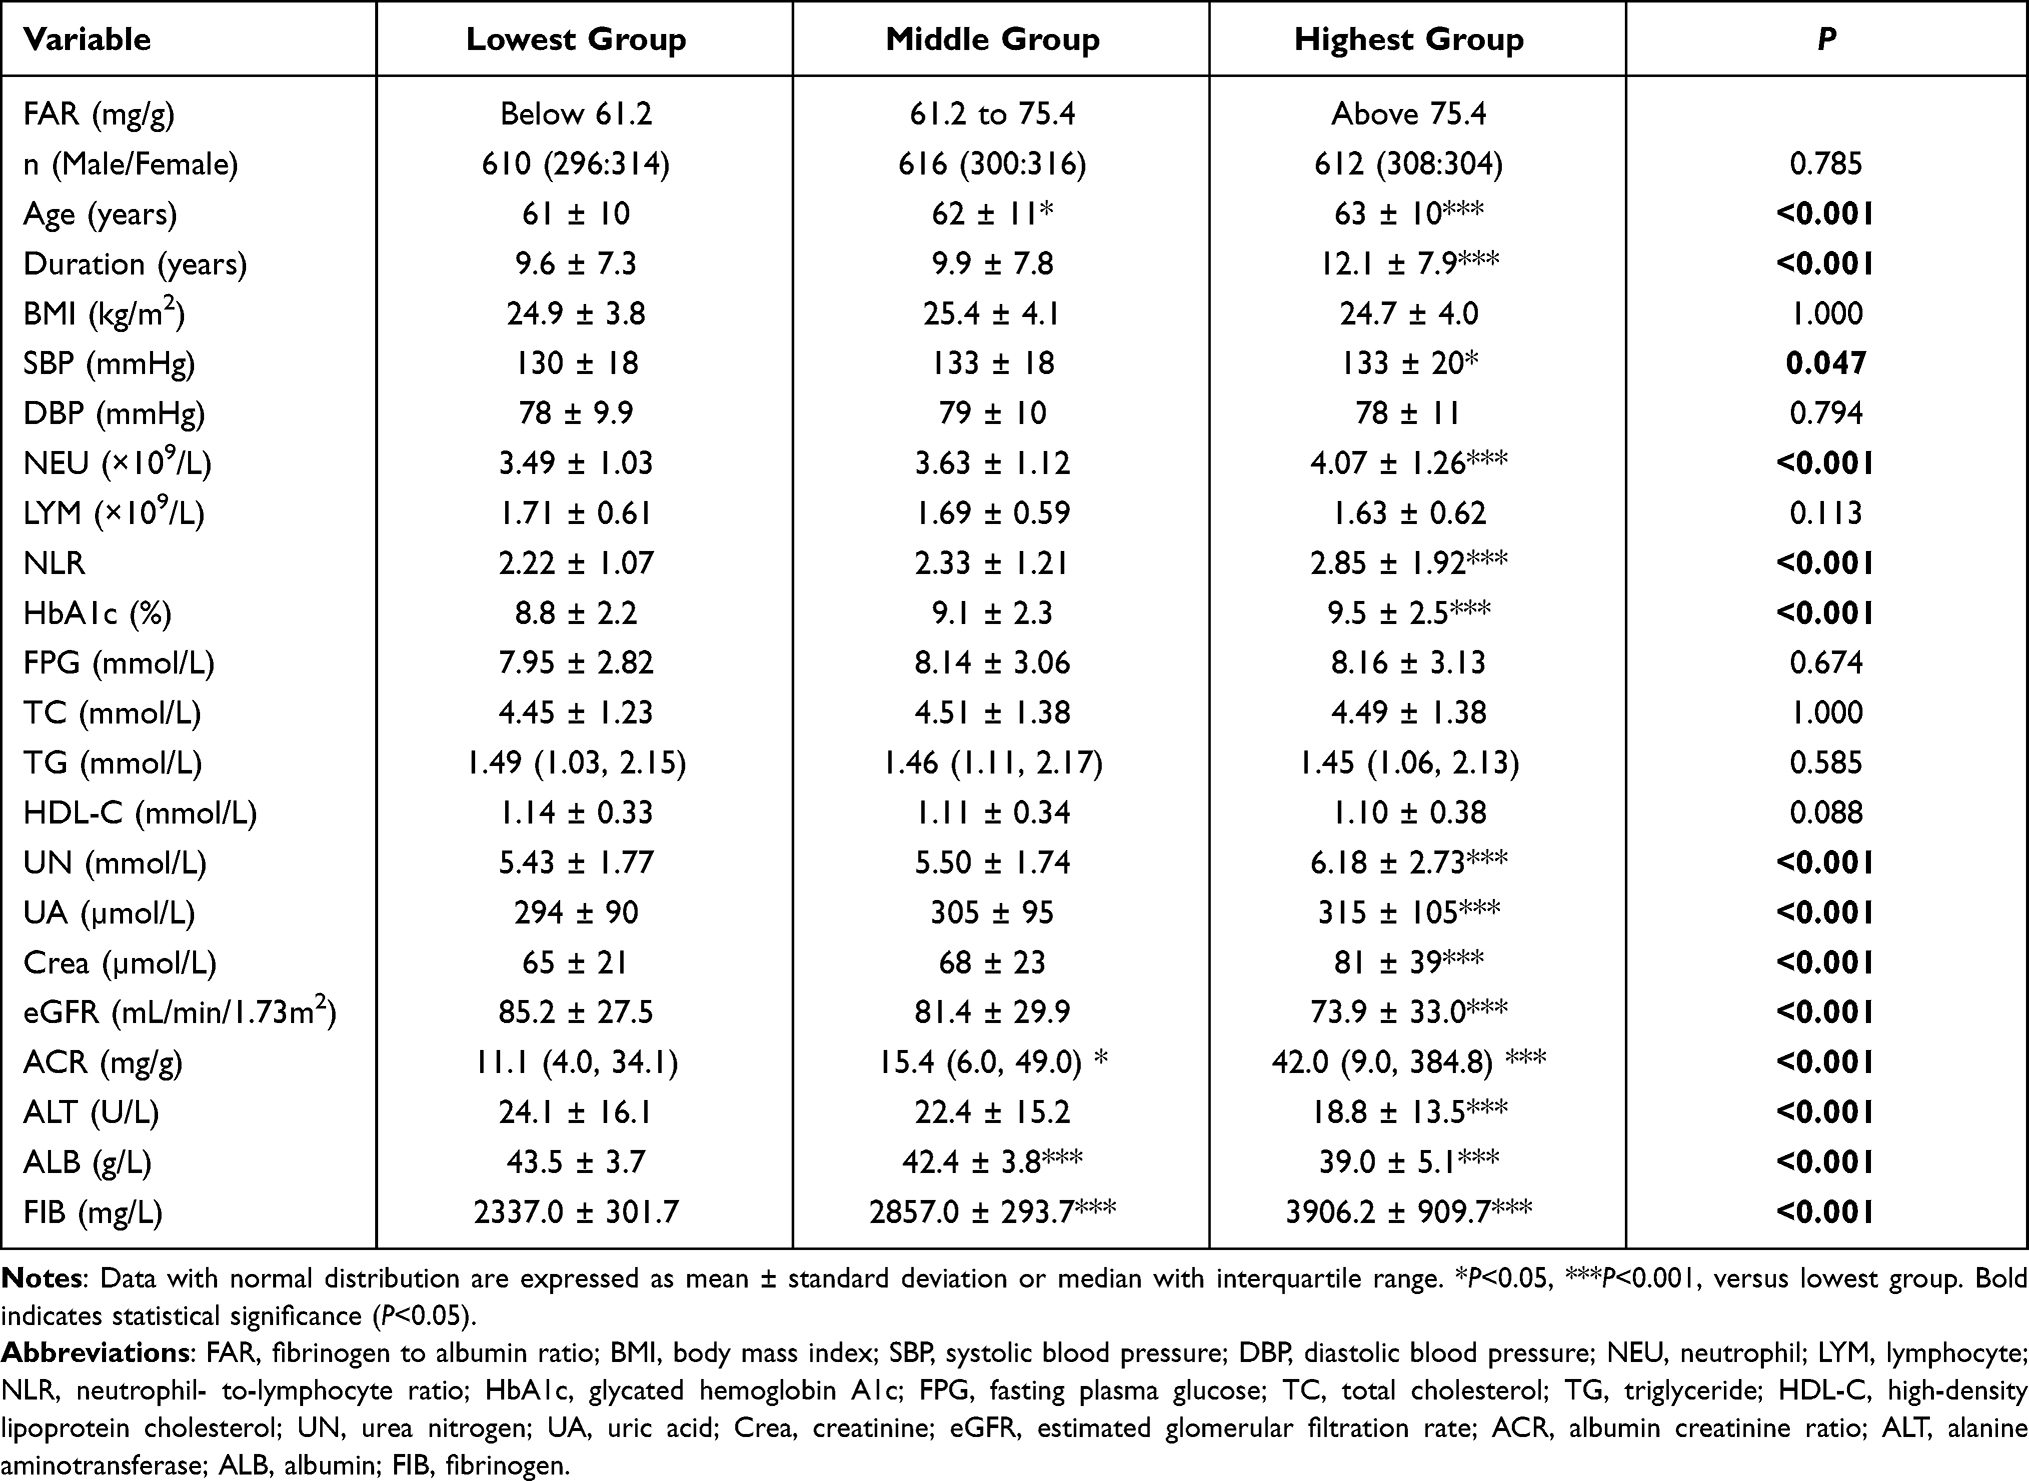 |
Table 3 Comparison of Parameters Among Three Groups Categorized by Tertile of FAR in the Cohort Study |
FAR Was Closely Associated with NEU and NLR
Linear regression and correlation analysis revealed a significant and linear correlation of FAR with NEU (adjusted R2 = 0.070; P<0.001) (Figure 3A) and NLR (adjusted R2 = 0.078; P<0.001) (Figure 3B).
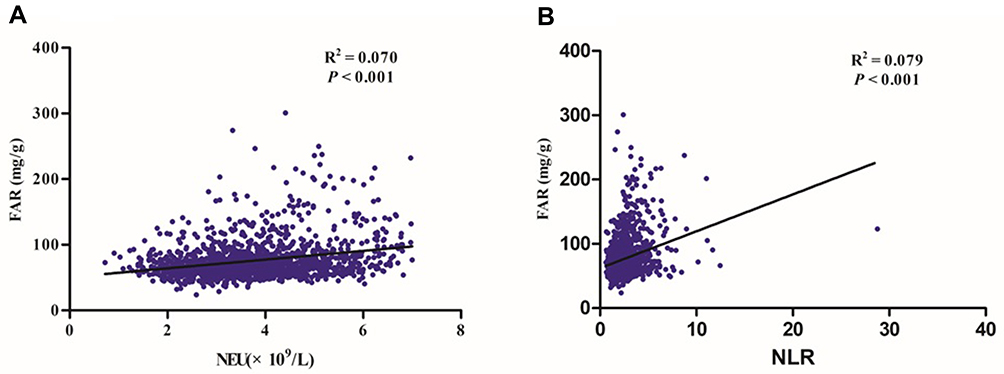 |
Figure 3 Simple linear regression analysis among FAR, NEU (A) and NLR (B). Abbreviations: FAR, fibrinogen to albumin ratio; NEU, neutrophil; NLR, neutrophil-to-lymphocyte ratio. |
FAR Was an Independent Risk Factor for the Development of DKD in the Cohort Study
To determine independent risk factors for the development of DKD in the cohort study, tertile of FAR, age, disease duration, and tertile of NLR, HbA1c, FPG, TG and ALT were entered into logistic regression analysis with enter selection. Age, disease duration, SBP, and TG were identified as significant risk factors. Of note, FAR (OR: 1.334; 95% CI: 0.878–2.027 in the middle tertile vs the lowest tertile, P=0.176; OR: 2.403; 95% CI: 1.566–3.686 in the highest tertile vs the lowest tertile, P<0.001) remained a risk factor for development of DKD independent of these factors (Table 4).
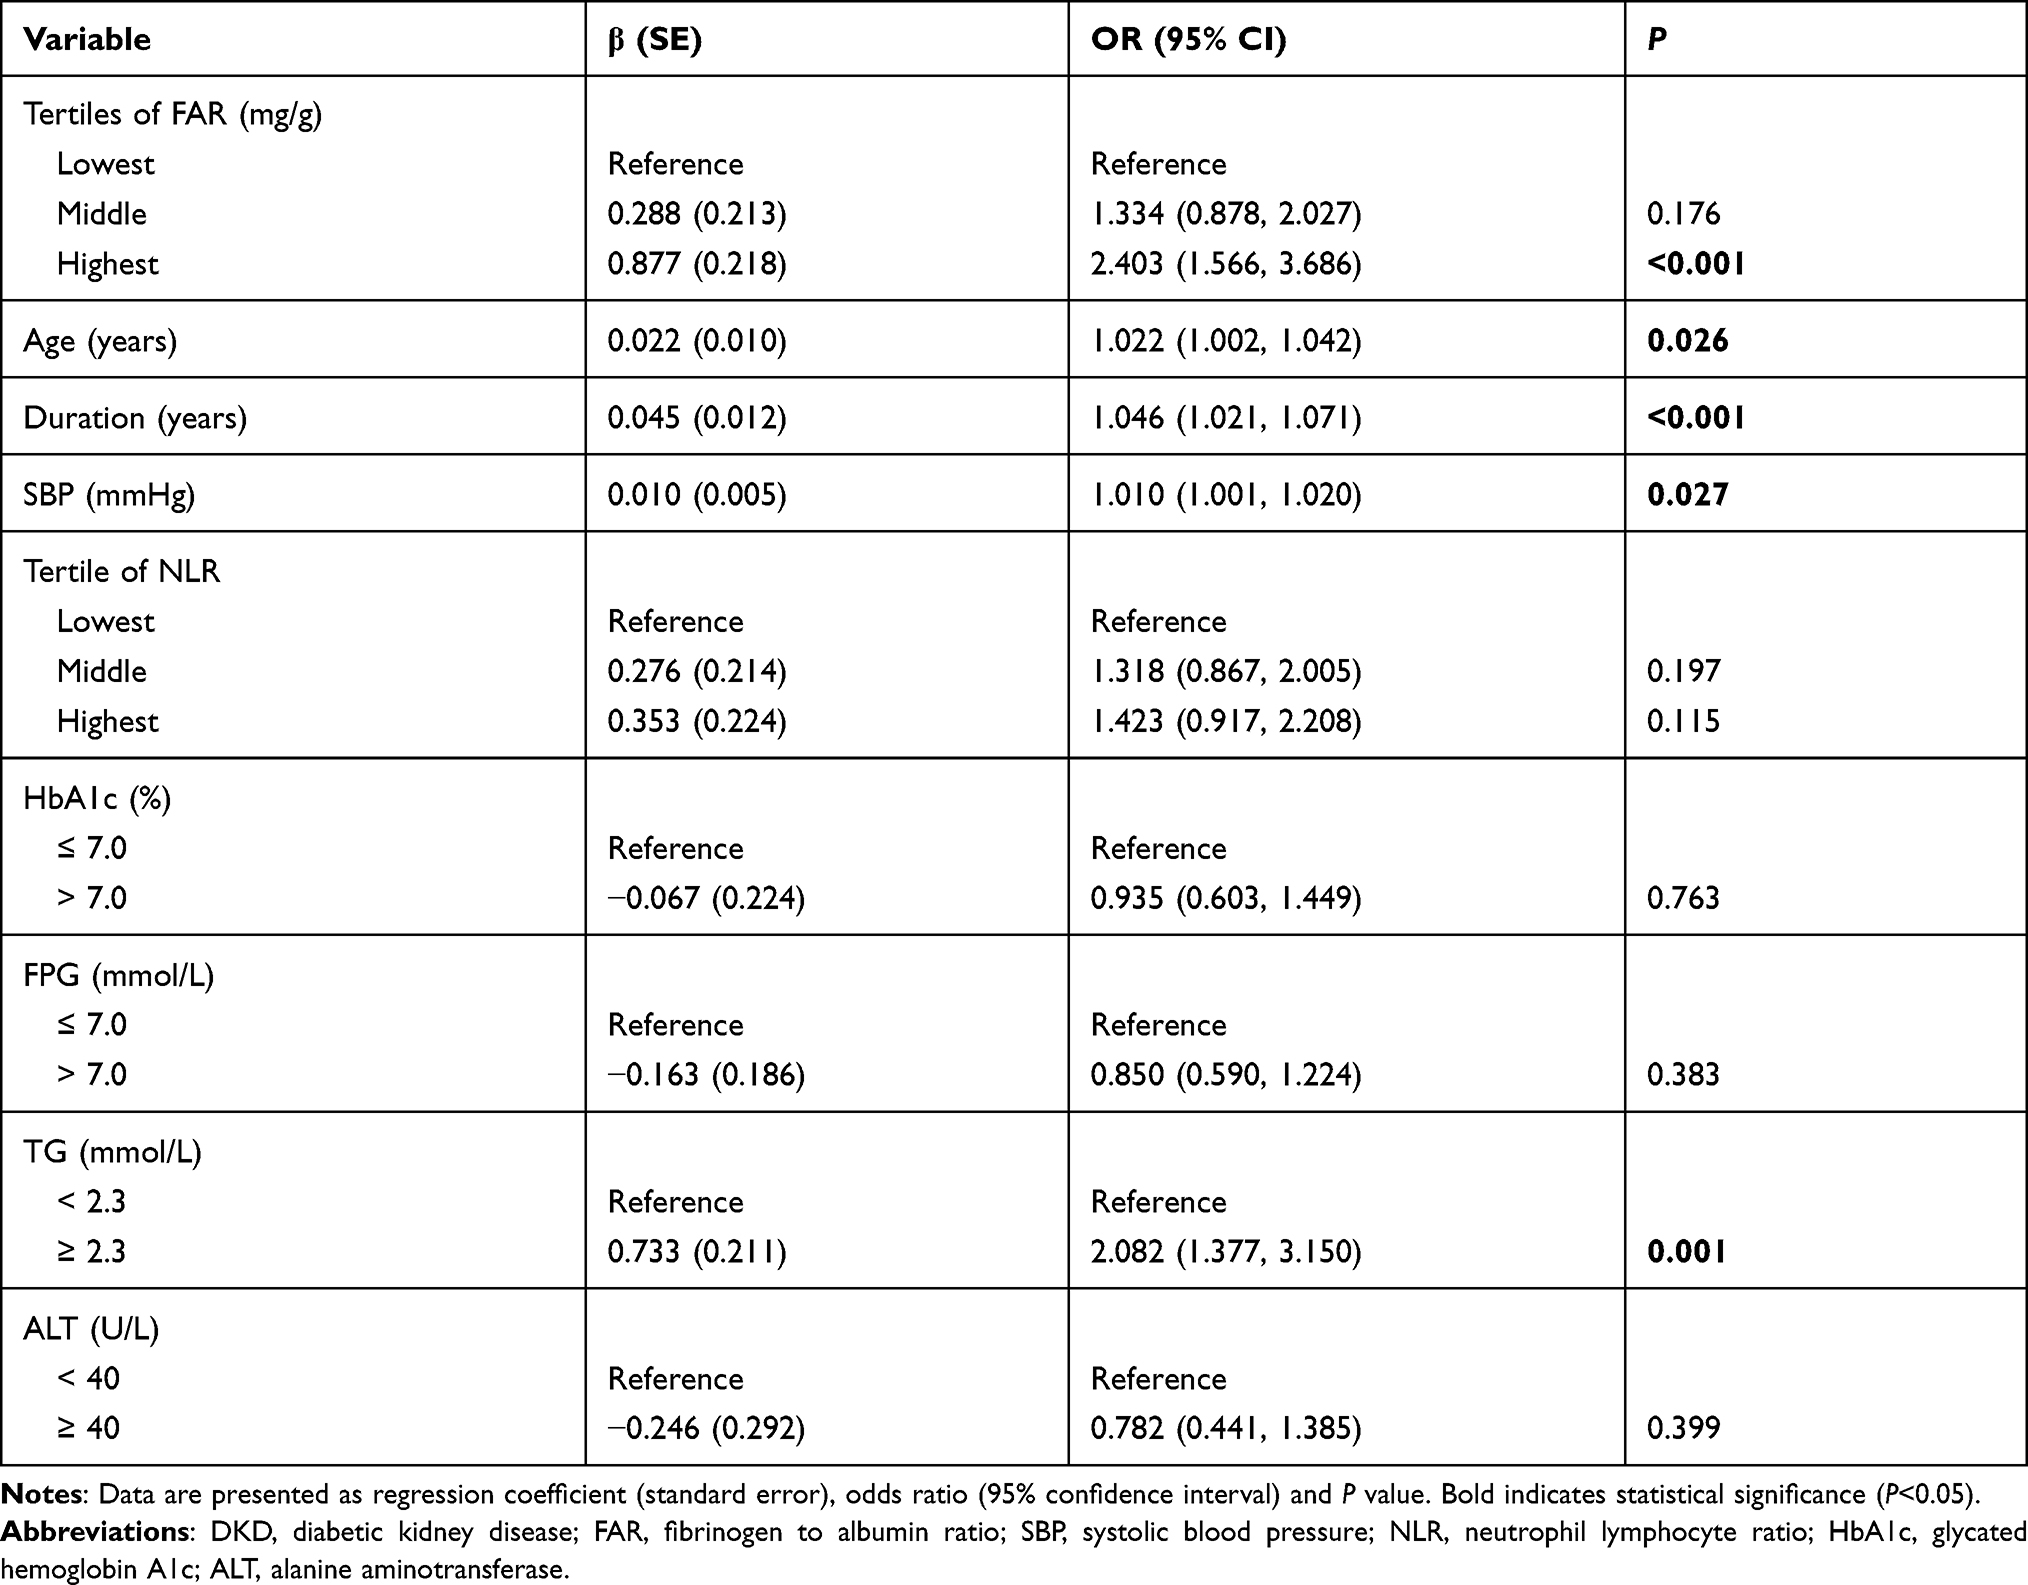 |
Table 4 Logistic Regression Analysis (Enter Method) to Determine the Risk Factors for Development of DKD in the Cohort Study |
Continuous FAR Was Closely Associated with the Incidence of DKD in the Cohort Study
After adjusting for age, disease duration, SBP and TG, a spline model showed a significant relationship between continuous FAR and DKD incidence. The risk of developing DKD increased when FAR exceeded 67.3 mg/g (Figure 4).
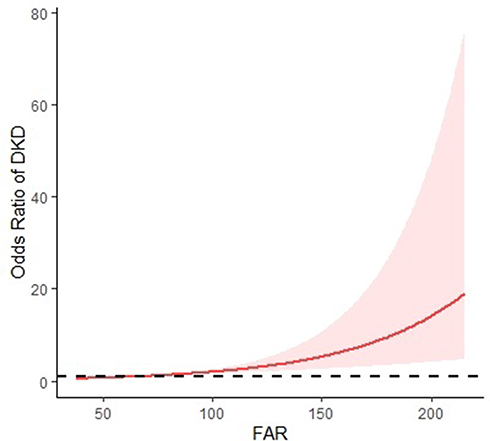 |
Figure 4 Continuous association of FAR with the incidence of DKD. Adjusted for age, disease duration, SBP and TG. Abbreviations: FAR, fibrinogen to albumin ratio; DKD, diabetic kidney disease; SBP, systolic blood pressure; TG, triglyceride. |
Discussion
In this study, we have shown that FAR is significantly higher in patients with DKD. The diagnostic efficacy of FAR is higher than that of FIB and ALB. FAR may be considered an independent risk factor and help to predict the development of DKD.
FIB is a soluble glycoprotein that plays a vital role in coagulation and inflammation.20,21 It has been shown to be significantly elevated in DKD22,23 and a powerful predictor of DKD occurrence.24,25 Elevated serum levels of FIB have been associated with diabetic ESRD in patients with T2DM.10 ALB, the most prevalent plasma protein, is synthesized in the liver and secreted into the vascular space for distribution to all body tissues.26 It has anti-inflammatory functions and antioxidant properties11,12 and is associated with a poor renal prognosis in patients with T2DM and DKD.13 Synthesis of FIB and ALB is upregulated in T2DM patients with increased urinary albumin excretion.27 In our case-control study, after matching the possible confounding factors, FIB and ALB were all associated with the development of DKD, consistent with previous studies.10,13
Fibrinogen to albumin ratio (FAR) could be a more significant prognostic marker than each single marker itself in cancer study.14–16 Previous studies showed that FAR could predict severity of coronary artery disease and all-cause mortality in patients with myocardial infarction.28–31 Patients with exaggerated metabolic syndrome had a higher FAR and FAR may be a better predictor than FIB and ALB of exaggerated metabolic syndrome.32 Similarly, in cancer studies, FAR was a valuable marker that could predict progression-free survival and overall survival and a stronger prognostic factor than FIB and ALB alone in breast, gallbladder, renal and gastric cancer and in glioblastoma.14–16,33,34 In accordance with these results, we also found that FAR had the highest OR and possessed the most predictive value in DKD and was superior to FIB and ALB. Moreover, fully adjusted spline regression showed a significant correlation of continuous FAR with DKD incidence and the risk abruptly increased when FAR exceeded 67.3mg/g.
Although NEU and NLR are classic inflammatory indicators, studies have suggested that NEU level is associated with the incidence of DKD.35,36 A higher NLR level has been associated with an increased prevalence of DKD in diabetic adults.37–42 In our study, the differences in NEU and NLR among subjects with DKD were monitored separately. NEU and NLR were significantly higher in the highest tertile FAR group compared with the lowest. FAR was positively correlated with NEU and NLR. We speculate that FAR may participate in the pathogenesis of DKD by affecting inflammation.
Clinical diagnosis of DKD allows us to identify a group of patients at very high cardiorenal risk, for whom care is really difficult.43 At the same time, by using FAR as a potential indicator for predicting and preventing the progress of DKD in early stage, multifactorial intensive therapy is applied and induces a remarkable benefit on the risk of major adverse cardiovascular events (MACEs) and mortality in high-risk DKD patients.44
This study also has some limitations. First, enrolled patients were only from two hospitals and may lack representativeness, which could lead to biased results. Second, the two study groups, despite our efforts to match them, were different in age, eGFR and disease duration etc. Third, the two study groups have relatively poor glycemic control, which could make the study results non-generalizable to diabetic subjects with relatively good glycemic control. Finally, although we have indicated that the pathophysiological role of FAR in DKD development could be associated with an inflammatory state, it is unclear whether these changes are a cause or consequence of DKD development. Future longitudinal studies may provide further clarification.
Conclusion
FAR is significantly higher in patients with DKD. The diagnostic efficacy of FAR is higher than that of FIB and ALB. FAR may be a stronger independent predictor of the presence of DKD than FIB and ALB. FAR is an independent risk factor for DKD development when it exceeded 67.3mg/g. FAR might be one of novel diagnostic biomarkers to predict and prevent DKD progression. However, a prospective study to validate the prognostic model is still needed.
Data Sharing Statement
The experimental data sets generated and/or analyzed during the current study are available from the corresponding author upon reasonable request.
Ethics Approval
The study complied with the Declaration of Helsinki, and all subjects gave written informed consent. The study was approved by the ethics committees of Shanghai Fifth People’s Hospital (No.2018-213) and Zhejiang Kaihua County Hospital of Chinese Medicine (No.2019-002).
Funding
This work was supported in part by Science Foundation of Shanghai Fifth People’s Hospital (No.2018WYZT03), Medical Key Faculty Foundation of Shanghai (No. ZK2019B15), Science Foundation of Kaihua County (No.2019004), and Science and Technology Foundation of Quzhou City (No.2019147).
Disclosure
The authors report no conflicts of interest in this work.
References
1. GBD Chronic Kidney Disease Collaboration. Global, regional, and national burden of chronic kidney disease, 1990-2017: a systematic analysis for the Global Burden of Disease Study 2017. Lancet. 2020;395(10225):709–733. doi:10.1016/S0140-6736(20)30045-3.
2. Martínez-Castelao A, Navarro-González JF, Górriz JL, de Alvaro F. The concept and the epidemiology of diabetic nephropathy have changed in recent years. J Clin Med. 2015;4(6):1207–1216. doi:10.3390/jcm4061207
3. Ninomiya T, Perkovic V, de Galan BE, et al.; ADVANCE Collaborative Group. Albuminuria and kidney function independently predict cardiovascular and renal outcomes in diabetes. J Am Soc Nephrol. 2009;20(8):1813–1821. doi:10.1681/ASN.2008121270
4. Berhane AM, Weil EJ, Knowler WC, Nelson RG, Hanson RL. Albuminuria and estimated glomerular filtration rate as predictors of diabetic end-stage renal disease and death. Clin J Am Soc Nephrol. 2011;6(10):2444–2451. doi:10.2215/CJN.00580111
5. Navarro-González JF, Mora-Fernández C, Muros de Fuentes M, García-Pérez J. Inflammatory molecules and pathways in the pathogenesis of diabetic nephropathy. Nat Rev Nephrol. 2011;7(6):327–340. doi:10.1038/nrneph.2011.51
6. Pérez-Morales RE, Del Pino MD, Valdivielso JM, Ortiz A, Mora-Fernández C, Navarro-González JF. Inflammation in diabetic kidney disease. Nephron. 2019;143(1):12–16. doi:10.1159/000493278
7. Luyendyk JP, Schoenecker JG, Flick MJ. The multifaceted role of fibrinogen in tissue injury and inflammation. Blood. 2019;133:511–520. doi:10.1182/blood-2018-07-818211
8. Nguyen XM, Lane J, Smith BR, Nguyen NT. Changes in inflammatory biomarkers across weight classes in a representative US population: a link between obesity and inflammation. J Gastrointest Surg. 2009;13:1205–1212. doi:10.1007/s11605-009-0904-9
9. Hsieh JY, Smith TD, Meli VS, Tran TN, Botvinick EL, Liu WF. Differential regulation of macrophage inflammatory activation by fibrin and fibrinogen. Acta Biomater. 2017;47:14–24. doi:10.1016/j.actbio.2016.09.024
10. Zhang J, Wang Y, Zhang R, et al. Serum fibrinogen predicts diabetic ESRD in patients with type 2 diabetes mellitus. Diabetes Res Clin Pract. 2018;141:1–9. doi:10.1016/j.diabres.2018.04.025
11. Fanali G, Di Masi A, Trezza V, Marino M, Fasano M, Ascenzi P. Human serum albumin: from bench to bedside. Mol Aspects Med. 2012;33(3):209–290. doi:10.1016/j.mam.2011.12.002
12. Arques S, Ambrosi P. Human serum albumin in the clinical syndrome of heart failure. J Card Fail. 2011;17(6):451–458. doi:10.1016/j.cardfail.2011.02.010
13. Zhang J, Zhang R, Wang Y, et al. The level of serum albumin is associated with renal prognosis in patients with diabetic nephropathy. J Diabetes Res. 2019;2019:7825804. doi:10.1155/2019/7825804
14. Hwang KT, Chung JK, Roh EY, et al. Prognostic influence of preoperative fibrinogen to albumin ratio for breast cancer. J Breast Cancer. 2017;20(3):254–263. doi:10.4048/jbc.2017.20.3.254
15. Xu WY, Zhang HH, Xiong JP, et al. Prognostic significance of the fibrinogen-to-albumin ratio in gallbladder cancer patients. World J Gastroenterol. 2018;24(29):3281–3292. doi:10.3748/wjg.v24.i29.3281
16. Zhang L, Wang Z, Xiao J, et al. Prognostic value of fibrinogen-to-albumin ratio in patients with gastric cancer receiving first-line chemotherapy. Oncol Lett. 2020;20(4):10. doi:10.3892/ol.2020.11871
17. American Diabetes Association. 2. Classification and diagnosis of diabetes: standards of medical care in diabetes-2018, Diabetes Care. 2018;41(Suppl 1):S13–S27. PMID: 29222373. doi:10.2337/dc18-S002
18. KDOQI. KDOQI clinical practice guidelines and clinical practice recommendations for diabetes and chronic kidney disease. Am J Kidney Dis. 2007;49(2 Suppl 2):S12–154.
19. Ma YC, Zuo L, Chen JH, et al. Modified glomerular filtration rate estimating equation for Chinese patients with chronic kidney disease. J Am Soc Nephrol. 2006;17:2937–2944.
20. Sörensen I, Susnik N, Inhester T, et al. Fibrinogen, acting as a mitogen for tubulointerstitial fibroblasts, promotes renal fibrosis. Kidney Int. 2011;80(10):1035–1044. doi:10.1038/ki.2011.214
21. Mosesson MW. Fibrinogen and fibrin structure and functions. J Thromb Haemost. 2005;3(8):1894–1904. doi:10.1111/j.1538-7836.2005.01365.x
22. Myrup B, de Maat M, Rossing P, Gram J, Kluft C, Jespersen J. Elevated fibrinogen and the relation to acute phase response in diabetic nephropathy. Thromb Res. 1996;81(4):485–490. doi:10.1016/0049-3848(96)00021-7
23. Lin J, Hu FB, Rimm EB, Rifai N, Curhan GC. The association of serum lipids and inflammatory biomarkers with renal function in men with type II diabetes mellitus. Kidney Int. 2006;69(2):336–342. doi:10.1038/sj.ki.5000021
24. Pan L, Ye Y, Wo M, et al. Clinical significance of hemostatic parameters in the prediction for Type 2 diabetes mellitus and diabetic nephropathy. Dis Markers. 2018;2018:5214376. doi:10.1155/2018/5214376
25. Le DS, Miles R, Savage PJ, et al. The association of plasma fibrinogen concentration with diabetic microvascular complications in young adults with early-onset of type 2 diabetes. Diabetes Res Clin Pract. 2008;82(3):317–323. doi:10.1016/j.diabres.2008.08.019
26. Gatta A, Verardo A, Bolognesi M. Hypoalbuminemia. Intern Emerg Med. 2012;7Suppl 3:S193–9. doi:10.1007/s11739-012-0802-0
27. Tessari P, Kiwanuka E, Barazzoni R, Vettore M, Zanetti M. Diabetic nephropathy is associated with increased albumin and fibrinogen production in patients with type 2 diabetes. Diabetologia. 2006;49(8):1955–1961. doi:10.1007/s00125-006-0288-2
28. Karahan O, Acet H, Ertaş F, et al. The relationship between fibrinogen to albumin ratio and severity of coronary artery disease in patients with STEMI. Am J Emerg Med. 2016;34(6):1037–1042. doi:10.1016/j.ajem.2016.03.003
29. Erdoğan G, Arslan U, Yenercağ M, Durmuş G, Tuğrul S, Şahin İ. Relationship between the fibrinogen-to-albumin ratio and SYNTAX score in patients with non-St-Elevation myocardial infarction. Rev Invest Clin. 2021. doi:10.24875/RIC.20000534
30. Xiao L, Jia Y, Wang X, Huang H. The impact of preoperative fibrinogen-albumin ratio on mortality in patients with acute ST-segment elevation myocardial infarction undergoing primary percutaneous coronary intervention. Clin Chim Acta. 2019;493:8–13. doi:10.1016/j.cca.2019.02.018
31. Zhao Y, Yang J, Ji Y, et al. Usefulness of fibrinogen-to-albumin ratio to predict no-reflow and short-term prognosis in patients with ST-segment elevation myocardial infarction undergoing primary percutaneous coronary intervention. Heart Vessels. 2019;34(10):1600–1607. doi:10.1007/s00380-019-01399-w
32. Özdemir M, Yurtdaş M, Asoğlu R, Yildirim T, Aladağ N, Asoğlu E. Fibrinogen to albumin ratio as a powerful predictor of the exaggerated morning blood pressure surge in newly diagnosed treatment-naive hypertensive patients. Clin Exp Hypertens. 2020;42(8):692–699. doi:10.1080/10641963.2020.1779282
33. Liu J, Gan Y, Song H, Zhu K, Zhang Q. The predictive value of the preoperative fibrinogen-albumin ratio on the postoperative prognosis of renal cell carcinoma. Transl Androl Urol. 2020;9(3):1053–1061. doi:10.21037/tau-19-873
34. Li J, Zhou X, Xiang Y, et al. Clinical significance of preoperative fibrinogen to albumin ratio in patients with glioblastoma: a singe center experience. Cancer Manag Res. 2021;13:3259–3269. doi:10.2147/CMAR.S305025
35. Winter L, Wong LA, Jerums G, et al. Use of readily accessible inflammatory markers to predict diabetic kidney disease. Front Endocrinol (Lausanne). 2018;9:225. doi:10.3389/fendo.2018.00225
36. Yu Y, Lin Q, Ye D, et al. Neutrophil count as a reliable marker for diabetic kidney disease in autoimmune diabetes. BMC Endocr Disord. 2020;20(1):158. doi:10.1186/s12902-020-00597-2
37. Wan H, Wang Y, Fang S, et al. Associations between the neutrophil-to-lymphocyte ratio and diabetic complications in adults with diabetes: a cross-sectional study. J Diabetes Res. 2020;2020:6219545. doi:10.1155/2020/6219545
38. Mattared AM, Esheba NE, Elshora OA, Mohamed WS. Mean platelet volume and neutrophil to lymphocyte ratio in prediction of early diabetic nephropathy in type 2 diabetics. Diabetes Metab Syndr. 2019;13(2):1469–1473. doi:10.1016/j.dsx.2019.02.029
39. DiGangi C. Neutrophil-lymphocyte ratio: predicting cardiovascular and renal complications in patients with diabetes. J Am Assoc Nurse Pract. 2016;28(8):410–414. doi:10.1002/2327-6924.12366
40. Assulyn T, Khamisy-Farah R, Nseir W, Bashkin A, Farah R. Neutrophil-to-lymphocyte ratio and red blood cell distribution width as predictors of microalbuminuria in type 2 diabetes. J Clin Lab Anal. 2020;34(7):e23259. doi:10.1002/jcla.23259
41. Huang W, Huang J, Liu Q, et al. Neutrophil-lymphocyte ratio is a reliable predictive marker for early-stage diabetic nephropathy. Clin Endocrinol (Oxf). 2015;82(2):229–233. doi:10.1111/cen.12576
42. Akase T, Kawamoto R, Ninomiya D, Kikuchi A, Kumagi T. Neutrophil-to-lymphocyte ratio is a predictor of renal dysfunction in Japanese patients with type 2 diabetes. Diabetes Metab Syndr. 2020;14(4):481–487. doi:10.1016/j.dsx.2020.04.029
43. Sasso FC, De Nicola L, Carbonara O, et al. Cardiovascular risk factors and disease management in type 2 diabetic patients with diabetic nephropathy. Diabetes Care. 2006;29(3):498–503. doi:10.2337/diacare.29.03.06.dc05-1776
44. Sasso FC, Pafundi PC; NID-2 Study Group Investigators, et al. Efficacy and durability of multifactorial intervention on mortality and MACEs: a randomized clinical trial in type-2 diabetic kidney disease. Cardiovasc Diabetol. 2021;20(1):145. doi:10.1186/s12933-021-01343-1
 © 2021 The Author(s). This work is published and licensed by Dove Medical Press Limited. The full terms of this license are available at https://www.dovepress.com/terms.php and incorporate the Creative Commons Attribution - Non Commercial (unported, v3.0) License.
By accessing the work you hereby accept the Terms. Non-commercial uses of the work are permitted without any further permission from Dove Medical Press Limited, provided the work is properly attributed. For permission for commercial use of this work, please see paragraphs 4.2 and 5 of our Terms.
© 2021 The Author(s). This work is published and licensed by Dove Medical Press Limited. The full terms of this license are available at https://www.dovepress.com/terms.php and incorporate the Creative Commons Attribution - Non Commercial (unported, v3.0) License.
By accessing the work you hereby accept the Terms. Non-commercial uses of the work are permitted without any further permission from Dove Medical Press Limited, provided the work is properly attributed. For permission for commercial use of this work, please see paragraphs 4.2 and 5 of our Terms.