")
Back to Journals » International Journal of General Medicine » Volume 14
Ferroptosis Patterns Correlate with Immune Microenvironment Characterization in Gastric Cancer
Authors Jiang X , Liu F, Liu P, Yan Y, Lan S, Zhuang K, Liu Y, Jiang K, Huang Y, Nie K, Zheng Z, Pan J, Zheng J, Liu F , Xu S, Li P, Wen Y
Received 27 July 2021
Accepted for publication 15 September 2021
Published 12 October 2021 Volume 2021:14 Pages 6573—6586
DOI https://doi.org/10.2147/IJGM.S331291
Checked for plagiarism Yes
Review by Single anonymous peer review
Peer reviewer comments 3
Editor who approved publication: Dr Scott Fraser
Xiaotao Jiang,1,2 Fan Liu,2,3 Peng Liu,1,2 Yanhua Yan,1,2 Shaoyang Lan,1 Kunhai Zhuang,1,4 Yufeng Liu,5 Kailin Jiang,1,2 Yuancheng Huang,1,2 Kechao Nie,1,2 Zhihua Zheng,1,2 Jinglin Pan,6 Junhui Zheng,1,2 Fengbin Liu,1,4 Shijie Xu,5 Peiwu Li,1 Yi Wen1
1Department of Gastroenterology, The First Affiliated Hospital of Guangzhou University of Chinese Medicine, Guangzhou, Guangdong, People’s Republic of China; 2First Clinical Medical College, Guangzhou University of Chinese Medicine, Guangzhou, Guangdong, People’s Republic of China; 3Zhaoqing Hospital of Chinese Medicine Affiliated to Southern Medical University, Zhaoqing, Guangdong, People’s Republic of China; 4Baiyun Hospital of the First Affiliated Hospital of Guangzhou University of Chinese Medicine, Guangzhou, Guangdong, People’s Republic of China; 5Guangzhou University of Chinese Medicine, Guangzhou, Guangdong, People’s Republic of China; 6Department of Gastroenterology, Hainan Provincial Hospital of Traditional Chinese Medicine, Haikou, Hainan, People’s Republic of China
Correspondence: Peiwu Li; Yi Wen Email [email protected]; [email protected]
Objective: We aimed to build a ferroptosis-based classifier to characterize the molecular features of gastric cancers (GC) and investigate the relationship between different ferroptosis patterns and GC tumor microenvironment (TME).
Methods: Based on the genomic and clinical information from TCGA portal and GEO database, non-negative matrix factorization (NMF) was used to identify ferroptosis subtypes in GC patients. In order to estimate the ferroptosis levels, we established ferroptosis subtype score (FSS) to quantify ferroptosis patterns and ferroptosis potential index (FPI) by principal component analysis (PCA). The correlations of different ferroptosis patterns with TME cell-infiltrating characteristics (including immune cell infiltration, immune checkpoints expression levels, tumor mutational burden (TMB) and immunotherapy response) were systematically analyzed.
Results: Two ferroptosis subtypes, C1 (with lower FSS) and C2 (with higher FSS), were determined. C2 displayed a significantly lower FPI than C1. Besides, C2 was associated with diffuse subtype while C1 with intestinal subtype. As for TME characteristics, C2 was in accordance with the immune-excluded phenotype as it showed more active immune and stromal activities but lower TMB, less probability of immunotherapy response and poorer prognosis. C1 was linked to immune-inflamed phenotype as it had lower stromal activities but increased neoantigen load, enhanced response to immunotherapy and relatively better prognosis.
Conclusion: The systematic assessment of ferroptosis patterns and ferroptosis levels presented in our study implied that ferroptosis serves as an important factor in the formation of TME, which may expand the understanding of TME and provide a novel perspective for the development of targeted immunotherapeutic strategies for GC patients.
Keywords: ferroptosis, gastric cancer, immune cell infiltration, tumor microenvironment, immunotherapy
Introduction
Gastric cancer (GC) is the fifth most common malignancy with a third leading reason of cancer-related mortality.1 A high rate of recurrence, metastasis, resistance to conventional chemotherapy and toxic side effects are the primary death causes of GC patients.2
Over recent years, immunotherapy has bloomed into the new therapeutic frontier of cancer treatment and emerged evident survival benefits in a variety of malignancies.3,4 Unfortunately, only a small fraction of patients can benefit from it in clinic.5 Therefore, it is urgently needed to discover promising biomarkers with the potential to identify GC subgroups that respond to immunotherapy.
Ferroptosis, a newly discovered form of regulating cell death, is driven by the accumulation of lipid peroxidation and lethal reactive oxygen species (ROS).6 Several studies have indicated a dual role of ferroptosis in antitumor immunity. For example, CD8+T cells responding to immune checkpoint blockade secrete interferon gamma to suppress tumors through the induction of ferroptosis.7,8 In contrast, tumor cells undergoing ferroptosis might act as arachidonic acid (AA) donors for the transcellular biosynthesis of eicosanoids and participate in the production of immunomodulatory AA metabolites, exerting an impact on antitumor immunity.9 Besides, the increased intratumor production of prostaglandin E2 (PGE2), a principal mediator of inflammation associated with cells undergoing ferroptosis,10 assists tumor escaping from immune surveillance.11,12 Collectively, the dual role of ferroptosis in antitumor immunity suggests the complexity of their interaction, which indispensably requires further exploration.
In this study, based on the genomic and clinical information from TCGA portal and GEO database, we identified two ferroptosis subtypes with distinct prognosis and ferroptosis levels in GC and revealed a remarkable correlation between the ferroptosis patterns and TME cell-infiltrating characteristics. To evaluate the ferroptosis level and quantify the ferroptosis patterns, we established the ferroptosis potential index (FPI) and ferroptosis subtype score (FSS), both of which were demonstrated as precise predictors for the immunotherapy response and clinical outcome.
Materials and Methods
The overview of study design is displayed in Figure 1.
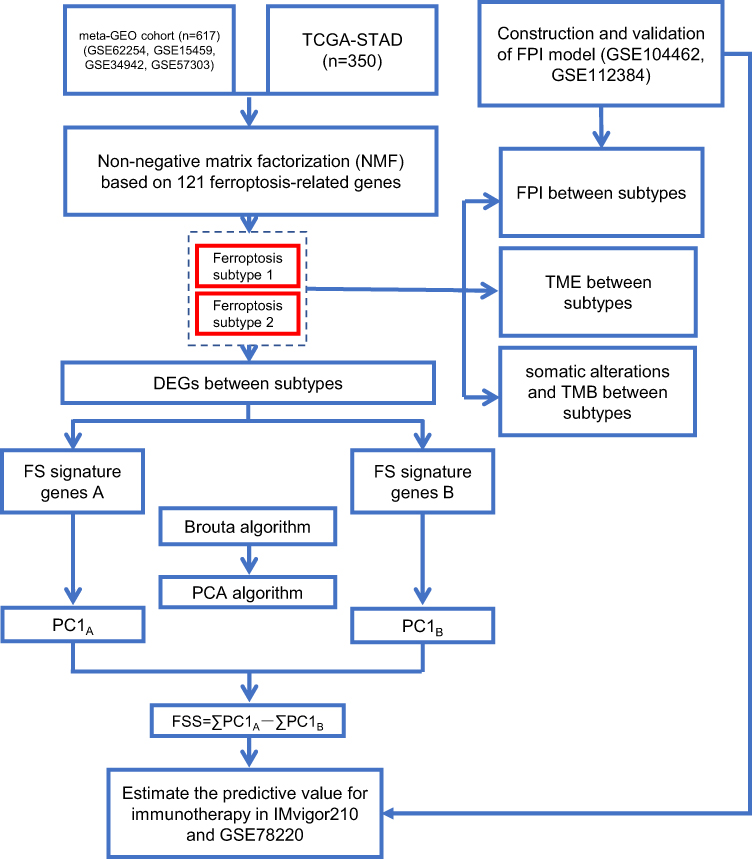 |
Figure 1 Overview of study design. |
Data Collection and Preprocessing
Gene expression data and corresponding clinical information of GSE62254,13 GSE15459,14 GSE3494215 and GSE5730316 datasets were retrieved from the Gene Expression Omnibus database (GEO) and consolidated as a GC meta-GEO cohort comprising 626 GC patients, 9 of which were removed due to lack of follow-up information or 0-day follow-up time. Above four GEO datasets were performed on the same microarray platform of [HG-U133_Plus_2] Affymetrix Human Genome U133 Plus 2.0 Array. The batch effects between different datasets were reduced by the “combat” algorithm of the “sva” package within R.17 The gene expression and corresponding clinical information of stomach adenocarcinoma (STAD) samples of TCGA cohort were downloaded from the UCSC Xena browser (https://xenabrowser.net/).18 After removing samples without follow-up information or with a 0-day follow-up duration, 350 STAD samples were collected. The clinical characteristics of the patients included are detailed in Table 1. In addition, FerrDb (http://www.zhounan.org/ferrdb/)19 collected 259 ferroptosis-related genes including driver, suppressor and marker. The confidence levels of genes involved in ferroptosis were assigned to 4 degrees including validated, screened, predicted and deduced. The species involved included human, mice, rat and drosophila. To ensure the accuracy and stability of the model, 121 human-related and validated ferroptosis-related genes were obtained and provided in Supplementary Table S1.
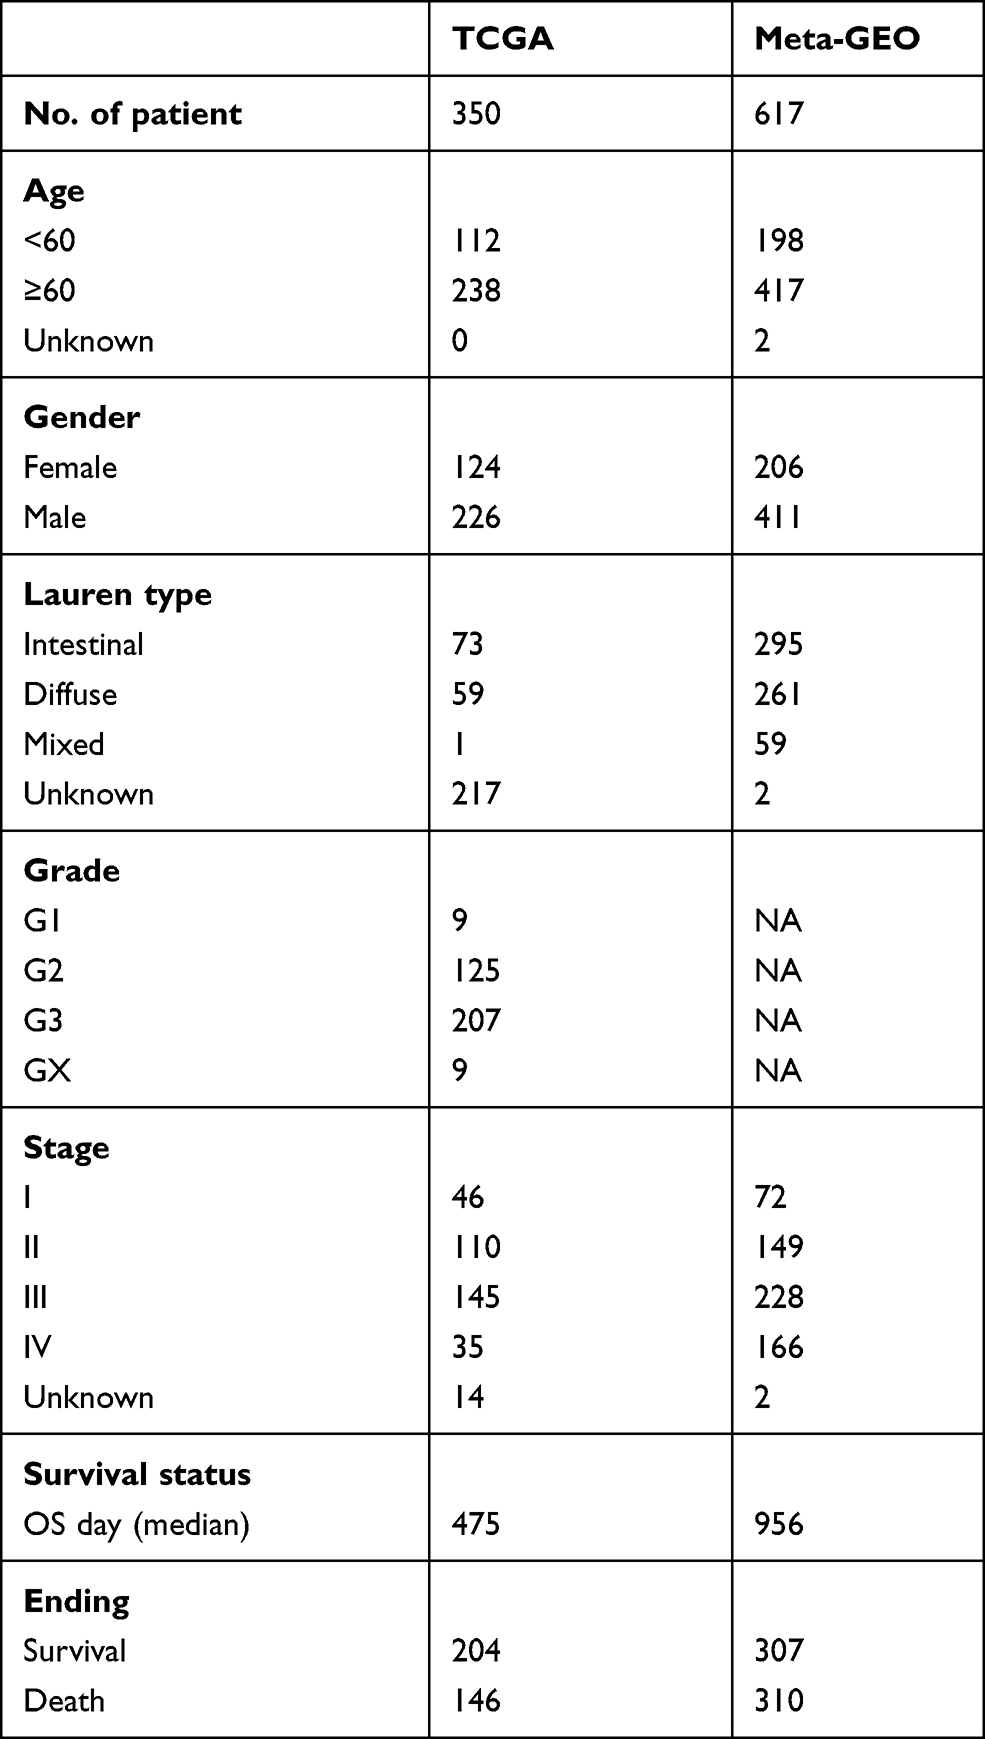 |
Table 1 Clinical Characteristic of the GC Patient Used in This Study |
Consensus Clustering for Ferroptosis-Related Genes
Non-negative matrix factorization (NMF) involves in factorization into matrices with nonnegative entries that can identify the original component of the composite data and decompose the complex data intuitively.20 NMF clustering of 121 ferroptosis-related gene expression profiles was applied to categorize the patients in the meta-GEO and TCGA cohorts into distinct subtypes, individually. Using “NMF” package of R, the samples were decomposed into clusters for k = 2–6 against 50 random initializations of both the actual and a permuted gene expression matrix. The k value reaching the largest difference between cophenetic correlation coefficients calculated from the actual and permutated data was chosen. Principal component analysis (PCA) projected high-dimensional data into low-dimensional space and constructs a new linear combination with maximum variance to realize data dimension reduction. Subsequent PCA was built around the ferroptosis-related gene expressions to visualize and validate the subtype distribution.
Dimension Reduction and Generation of FPI
To evaluate the ferroptosis level, we adapted a method similar to Liu’s research21 to construct the ferroptosis potential index (FPI). We downloaded the gene expression profiling of HepG2 cells treated with ferroptosis inducer erastin and inhibitor ferrostatin (GSE104462) which was performed using the GPL16791 Illumina HiSeq 2500 (Homo sapiens) from GEO database.22 Spearman correlation analysis was employed to select the genes positively and negatively correlated with the ferroptosis level with |r| ≥ 0.9 and p < 0.05, which were designated FPI gene signatures A and B, respectively. Principal component 1 was chosen as the signature scores for FPI gene signatures through PCA. The FPI of each sample was calculated by the following formula: FPI=∑PC1A-∑PC1B. To verify its effectiveness and robustness, FPI of different subgroups in GSE104462 was compared. Also, an external cohort, GSE112384, was downloaded and analyzed as another validation cohort. GSE112384 was performed on GPL10558 platform Illumina HumanHT-12 v4.0 expression beadchip, consisted of gene expression profiles from IMR32 and SKNSH cell lines treated with withaferin A (WA, a natural ferroptosis inducing agent in neuroblastoma) and DMSO (control).23
Dimension Reduction and Generation of FSS
After the decomposition of GC samples, the differentially expressed genes (DEGs) between ferroptosis subtypes were identified in the meta-GEO cohort with the significance cutoff criteria set as adjusted p < 0.05 and |logFC| ≥ 0.585, via the “limma” package of R. The functions of DEGs were annotated based on the Reactome Knowledgebase (https://reactome.org) using the FunRich software (version 3.1.3). DEGs with positive and negative correlation to clusters were designated FS gene signatures A and B, respectively. The Boruta algorithm was conducted to further reduce noise and redundant genes.24 To quantify the ferroptosis pattern, we applied a method similar to Gene expression grade index25 to define the FSS score of each sample: FSS=∑PC1A-∑PC1B.
Difference of TME Between Ferroptosis Subtypes
To explore the difference of TME between ferroptosis subtypes, we used the R “estimate” package26 to calculate the stromal score, immune score and ESTIMATE score of each included sample and compare them grouped by subtypes. The correlations between immune-stromal score and FSS or FPI were also evaluated using correlation test. To assess the relative immune cell infiltration levels, the single sample gene set enrichment analysis (ssGSEA) programme27 was performed according to the geneset provided in the study of Charoentong,28(Table S2). The level of immune cell infiltration and gene expression of 9 immune checkpoints were compared between subtypes.
Collection of Somatic Alteration Data
With the goal of determining the tumor mutation burden (TMB) of GC patients in different ferroptosis subtypes, their non-synonymous mutations were computed according to the corresponding mutation data. The correlations between TMB and FSS or FPI were also analyzed using correlation test. Then, we compared the somatic alterations of GC driver genes which were identified within R “maftool” package29 between ferroptosis subtypes. The driver genes of top 20 mutation frequency were elected to represent the overall mutation level.
Collection of Immunotherapy Gene Expression Data
Two independent immunotherapeutic cohorts, IMvigor210 and GSE78220, were used to estimate the predictive value of the FSS and FPI. The gene expression data and clinical information of IMvigor210 cohort, which contains urothelial cancer cases received intervention of atezolizumab, an anti-PD-L1 antibody, was downloaded from http://research-pub.gene.com/IMvigor210CoreBiologies under the Creative Commons 3.0 license.30 As for GSE78220, it contains metastatic melanoma cases treated with pembrolizumab, an anti-PD-1 antibody, and the expression data as well as clinical information were available from GEO (https://www.ncbi.nlm.nih.gov/geo/query/acc.cgi?acc=GSE78220).31 Totally, 298 urothelial cancer cases and 26 metastatic melanoma cases received immunotherapy with complete clinical features were used to investigate whether the FSS and FPI could predict patients’ response to immunotherapy via comparison and prognostic analysis.
Statistical Analysis
All statistical analyses were conducted using GraphPad Prism version 8.0 or R programming. Comparison of continuous variables between two subgroups was performed using Student’s t test (normally distributed) or Mann–Whitney U-test (non-normally distributed). The prognostic analysis was conducted using the Kaplan–Meier method with the significance of differences identified utilizing Log rank tests. For FPI and FSS, the “survminer” software package in R was used to determine the optimal cut-off value. The correlation between ferroptosis subtypes and the clinical characteristics was estimated by Chi-square analysis. Correlations between two variables were examined via Spearman or Pearson correlation analysis in appropriate situations. A two-tailed p < 0.05 was considered statistically significant.
Results
Generation of FPI
With the aim of understanding the role of ferroptosis during gastric carcinogenesis, we built a FPI model to estimate the ferroptosis level based on the gene expression of a GEO dataset (GSE104462) of liver cancer cell lines treated with ferroptosis inducer erastin, or inhibitor ferrostatin. PCA was performed to define the FPI of each sample as positive principal component 1 minus negative principal component 1. As presented in Figure S1A, in comparison with controls, FPI was markedly elevated in the erastin group (p = 0.0023) while significantly decreased in the ferrostatin group (p = 0.0491). To validate this result, we calculated the FPI of the neuroblastoma cells, including IMR32 and SKNSH cell lines, from another GEO dataset (GSE112384), which showed a similar significant increase of FPI in the ferroptosis inducer (WA) than control group (DMSO) (Figure S1B and S1C). Collectively, these outcomes implied that the FPI may be a representative of the ferroptosis level based upon transcriptome data.
Identification of Two Ferroptosis Subtypes in GC by NMF
Based on the expression profiles of 121 ferroptosis-related genes in 617 GC samples from the meta-GEO cohort and 350 STAD samples from the TCGA cohort, we applied NMF consensus clustering to describe the patterns of ferroptosis in GC patients. The numbers of sample clusters decomposed by NMF depend on a desired rank k. For both primary and validation cohorts, the optimal k value turned out to be 2, that is, assigning them into two ferroptosis subtypes (meta-GEO: C1, n = 292 and C2, n = 325; TCGA: C1, n = 228 and C2, n = 122). The consensus matrix heatmap with sharp and clear edges indicated the stableness and robustness for our clustering (Figure 2A). Besides, the scatter diagram plotted by PCA also confirmed the two-dimensional distribution patterns (Figure 2B). According to the survival analysis (Figure 2C), the meta-GEO GC patients of C1 showed longer survival time than that of C2 (log rank test, p < 0.0001). Similar difference was also observed in TCGA cohort, with C1 showing better overall survival (OS) than C2 (log rank test, p = 0.0133).
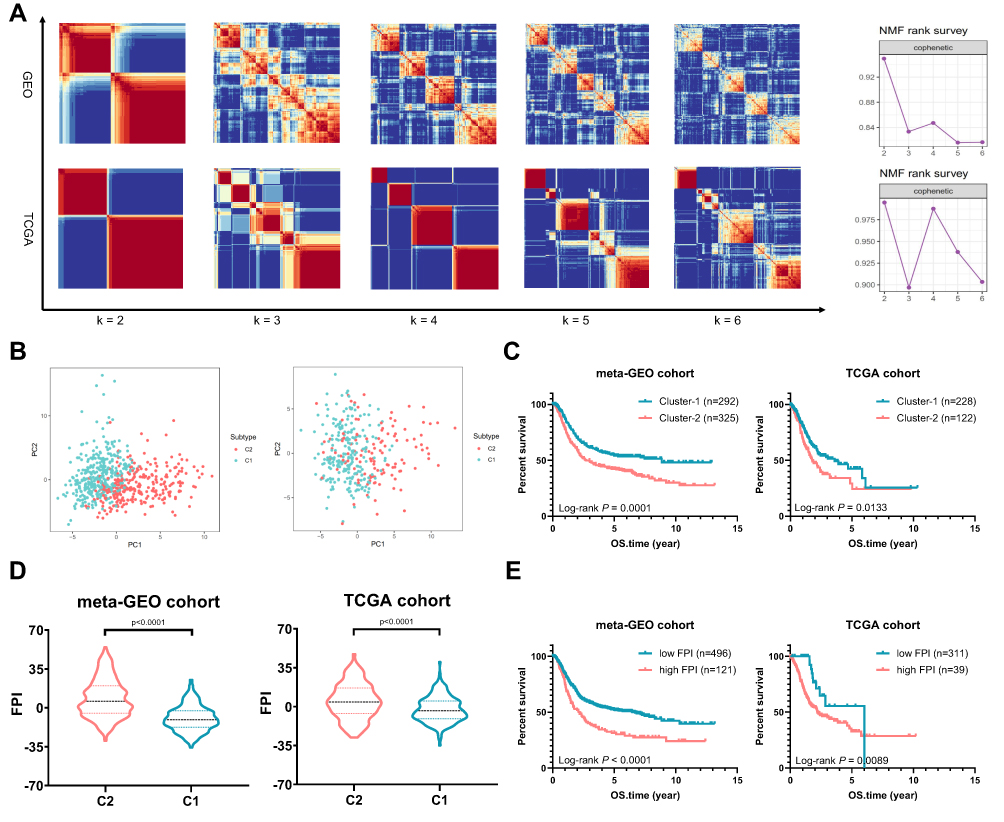 |
Figure 2 Distribution of Ferroptosis Subtypes using NMF Consensus Clustering. (A) NMF clustering based on 121 ferroptosis-related genes decomposes the samples in meta-GEO and TCGA cohorts. The corresponding cophenetic correlation coefficient of k value between 2 and 6 is shown. (B) Scatter diagrams plotted by PCA sustained decomposition of two clusters. (C) Kaplan–Meier curves show OS for patients in C1 and C2. (D) The violin plots show FPI between C1 and C2. (E) Kaplan–Meier curves show OS for patients stratified by high FPI and low FPI. |
The FPI of GC patients were also computed and drew in violin plots (Figure 2D). Compared to C1, the FPI of C2 was elevated in both primary and validation cohorts (meta-GEO: Mann–Whitney test, p < 0.0001; TCGA: Mann–Whitney test, p < 0.0001). Using the “survival” package in R, we grouped the GC patients into high FPI and low FPI subclasses according to the optimal cut-off value (Figure 2E). The Kaplan–Meier curves revealed that patients in low FPI showed better OS than patients in high FPI (meta-GEO: Log rank test, p < 0.0001; TCGA: Log rank test, p = 0.0089).
Generation of FSS
To quantify the ferroptosis pattern, FSS was constructed. Firstly, 1297 DEGs were identified between two subtypes in the meta-GEO primary cohort (Table S3). Eight hundred and forty-three genes were positively correlated with the ferroptosis subtypes (FS signature genes A) while the left 454 genes were negatively correlated (FS signature genes B). After utilizing Boruta algorithm to further reduce noise and redundant genes, 91 of FS signature genes A and 46 of FS signature genes B were reserved. Figure 3A delineates the transcriptomic profiling of the reserving signature genes in the meta-GEO cohort. Applying the screened signature genes obtained from the meta-GEO cohort, GC samples in TCGA cohort could be divided into C1 and C2 as well (Figure 3B). Functional enrichment analysis revealed that FS signature genes A were associated with epithelial–mesenchymal transition while FS signature genes B showed opposite enriched results (mesenchymal–epithelial transition) (Figure 3C). Then, FSS was constructed based on the expression profiles of FS signature genes A and B obtained from the meta-GEO cohort. FSS of each patient in TCGA cohort was also calculated using signatures the same with the meta-GEO cohort. As expected, a higher FSS was observed in C2 both in meta-GEO and TCGA cohorts (Mann–Whitney test, p < 0.0001, Figure 3D). Based on the optimal cut-off value, FSS had an ability to distinguish the prognosis of patients with GC (meta-GEO: log rank test, p < 0.0001; TCGA: log rank test, p = 0.0011, Figure 3E). FSS also exhibited a positive correlation with FPI (meta-GEO: Spearman coefficient: R = 0.67, p < 2.2e-16; TCGA: Spearman coefficient: R = 0.20, p = 0.00017, Figure 3F).
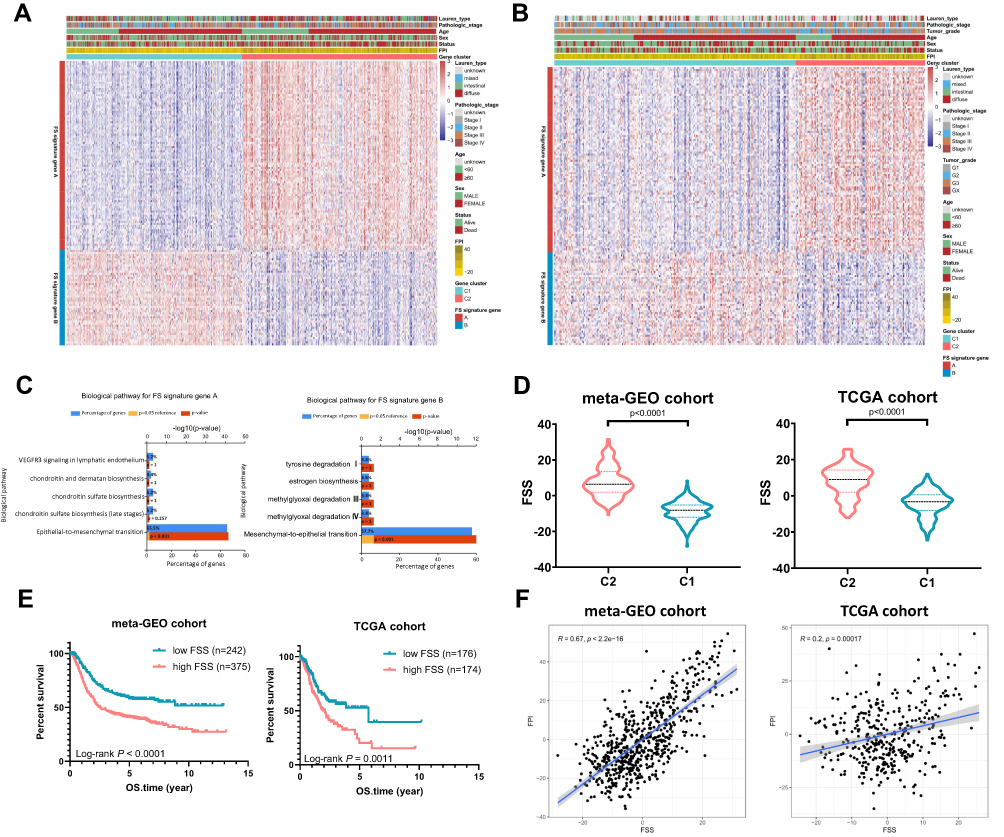 |
Figure 3 Generation of FSS. (A) Heatmap of DEGs between C1 and C2 to assign patients in meta-GEO cohort into two subgroups: FS gene signature A and B. (B) Heatmap shows FS gene signatures obtained from the meta-GEO cohort can classify patients in TCGA cohort into C1 and C2. (C) Reactome enrichment analysis of the FS signature genes A and B. (D) The violin plots show FSS between C1 and C2. (E) Kaplan–Meier curves show OS for patients stratified by high FSS and low FSS. (F) Scatterplots exhibit the positive correlation between FPI and FSS. |
Difference of TME Between Ferroptosis Subtypes
According to the ESTIMATE algorithm, compared to C1, C2 had a significantly higher level of immune score, stromal score and ESTIMATE score in the meta-GEO cohort (Figure 4A) and TCGA cohort (Figure 4B). We also unveiled that both FSS and FPI were positively correlated with immune score, stromal score and estimate score with all p-value < 0.01 (Figures 4C and D). Combining with the ssGSEA outcomes in meta-GEO (Figure 4E) and TCGA (Figure 4F) cohorts, C2 had a higher abundance in 21 immune cell populations (activated B cell, CD8 T cell, central memory CD4 T cell, effector memory CD4 T cell and CD8 T cell, gamma delta T cell, immature B cell, regulatory T cell, T follicular helper cell, type 1 and 17 helper cell, CD56dim natural killer, eosinophil, immature dendritic cell, macrophage, mast cell, MDSC, monocyte, natural killer cell, natural killer T cell and plasmacytoid dendritic cell). For immune checkpoint genes, LAG3, CTLA4, HAVCR2, CD80, IDO1, TIGIT, PDL1 and CD86 were remarkedly overexpressed in C2 while only PDCD1 showed inconsistent expression trend in these two GC cohorts (Figures 4G and H).
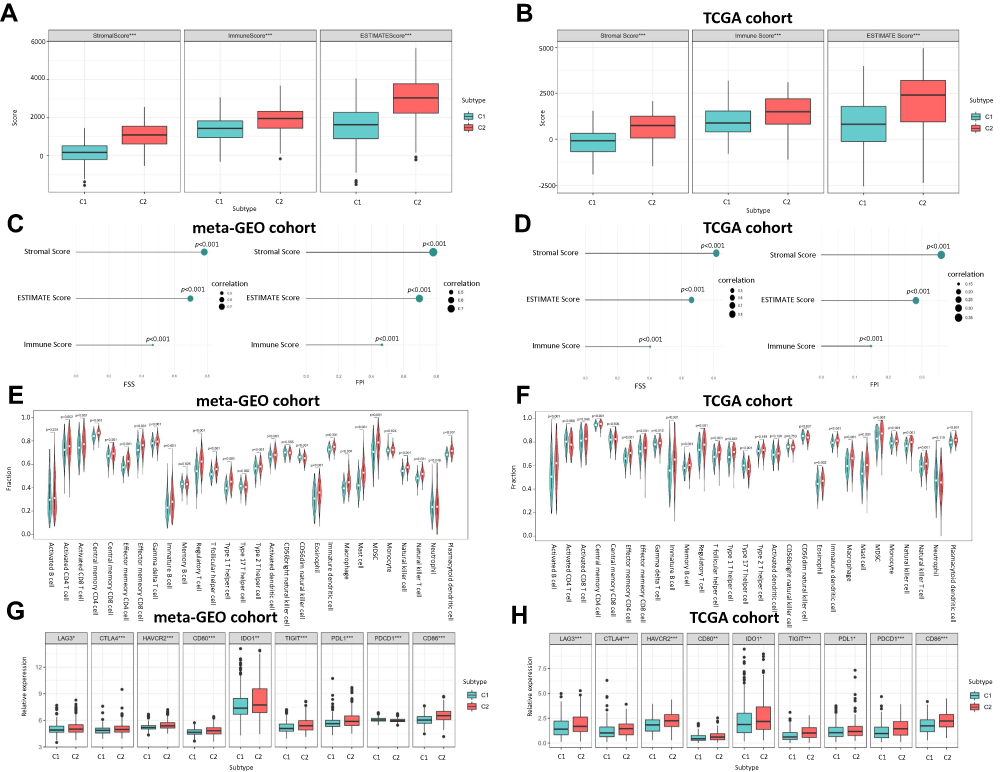 |
Figure 4 The Correlation between Ferroptosis Subtypes and TME. (A) Boxplot shows the differences of immune score, stromal score and estimate score between C1 and C2 in meta-GEO cohort. (B) Boxplot shows the differences of immune score, stromal score and estimate score between C1 and C2 in TCGA cohort. (C) Correlation of FSS and FPI with the Immune score, stromal score and estimate score in meta-GEO cohort. (D) Correlation of FSS and FPI with the Immune score, stromal score and estimate score in TCGA cohort. (E) Violin plot shows the abundance of 21 immune cell populations distinguished by C1 and C2 in meta-GEO cohort. (F) Violin plot shows the abundance of 21 immune cell populations distinguished by C1 and C2 in TCGA cohort. The green box represents C1, red one represents C2. (G) Boxplot shows the expression levels of 9 immune checkpoint genes between C1 and C2 in meta-GEO cohort. (H) Boxplot shows the expression levels of 9 immune checkpoint genes between C1 and C2 in TCGA cohort. *p < 0.05; **p < 0.01; ***p < 0.001. |
The Correlation Between FSS, FPI and Somatic Variants
Over past decades, efforts to develop more effective treatment approaches facilitate the wide application of immunotherapy (immune checkpoint inhibition) in many malignant tumors, including GC. Accumulating evidence have illustrated that high tumor mutational burden (TMB), also known as non-synonymous variants, was closely related to tumor CD8+ T-cell infiltration and immune response such as activity of anti-PD-1 therapies.32 Although the TMB was considered with significance in predicting clinical response to immune cell infiltration, the intrinsic relationship between TMB and ferroptosis needs to be elucidated. First, the TMB of GC samples in C1 and C2 was compared. As demonstrated in Figure 5A, a higher TMB was observed in the TCGA-GC patients of C1 than that of C2 (Mann–Whitney test, p < 0.0001). Figures 5B and C exhibited that TMB were higher in low FSS or FPI than high FSS or FPI (p = 0.0006, p < 0.0001, respectively, Mann–Whitney test). After categorizing the patients into low TMB (n = 300) and high TMB (n = 43) subclasses with the optimal cut-off value, we evaluated their survival time using Kaplan–Meier curves, which indicated that prognosis of patients with low TMB was better than that with high TMB (Log rank test, p = 0.0021; Figure 5D). Then, we analyzed the correlation between TMB and FSS or FPI. As shown in Figures 5E and F, TMB exhibited a significant negative correlation with both FSS (Spearman coefficient: R = −0.29, p = 4.2e-08) and FPI (Spearman coefficient: R = −0.45, p < 2.2e-16). Moreover, the distribution of somatic alterations in GC driven genes were estimated. We listed the top 20 GC driver genes with highest mutation frequency, which showed that the overall mutation rate of driver genes in C1 was higher than C2 (Figure 5G).
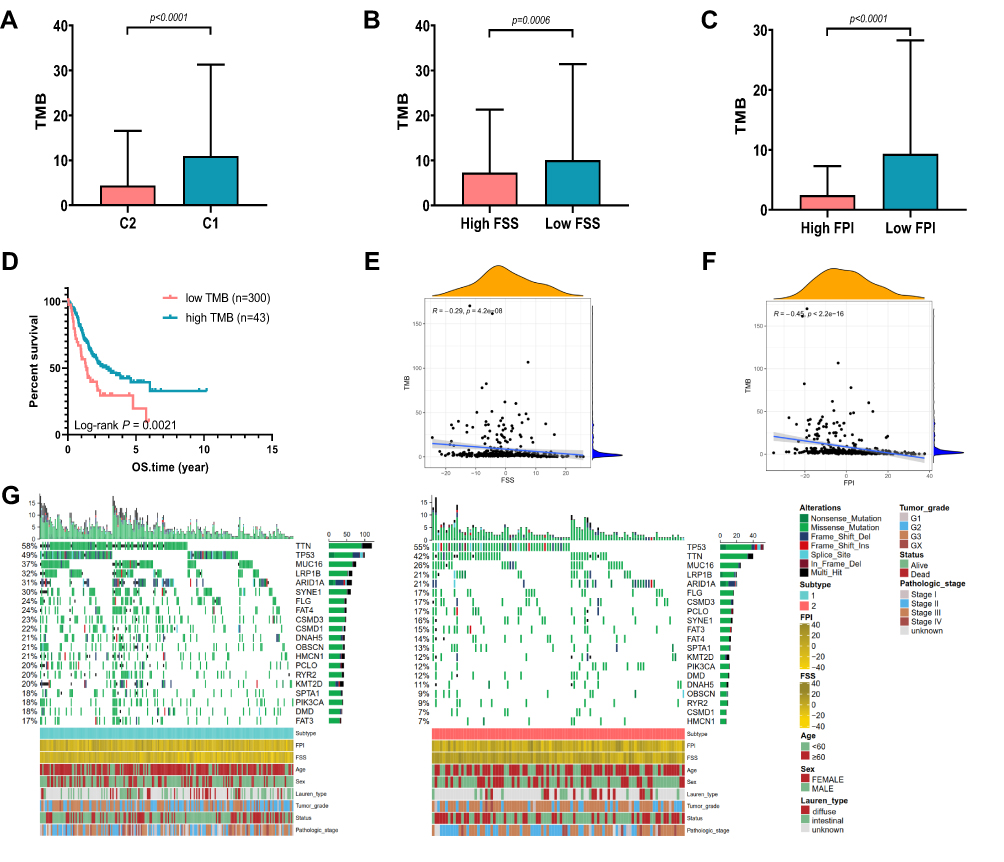 |
Figure 5 The Correlation between Somatic Variants and FSS, FPI. (A) TMB difference between C1 and C2 in the TCGA cohort. (B) TMB difference between high FSS and low FSS in the TCGA cohort. (C) TMB difference between high FPI and low FPI in the TCGA cohort. (D) Kaplan–Meier curves show OS for patients stratified by high TMB and low TMB. (E) Scatterplots depict the negative correlations between TMB and FSS. (F) Scatterplots depict the negative correlations between TMB and FPI. (G) The oncoPrint grouped by C1 on the left (green) and C2 on the right (red), with individual patients represented as columns. |
The Correlation Between Clinical Characteristics and Ferroptosis Subtypes
The relationship between clinical features and subtypes in the meta-GEO and TCGA cohorts was analyzed by Chi-square test. Table 2 illustrates that there was no significant difference between subtypes in gender both in the meta-GEO and TCGA cohorts. In terms of age and tumor grade, C2 tended to be diagnosed at a younger age and have a higher tumor grade in the meta-GEO cohort (age: p = 0.0077; tumor grade: p = 0.0003). As for Lauren type and stage, C2 was inclined to have a higher proportion of diffuse-type and associate with more advanced-stage in the TCGA cohort (Lauren type: p = 9.045e-7; stage: p = 0.0052).
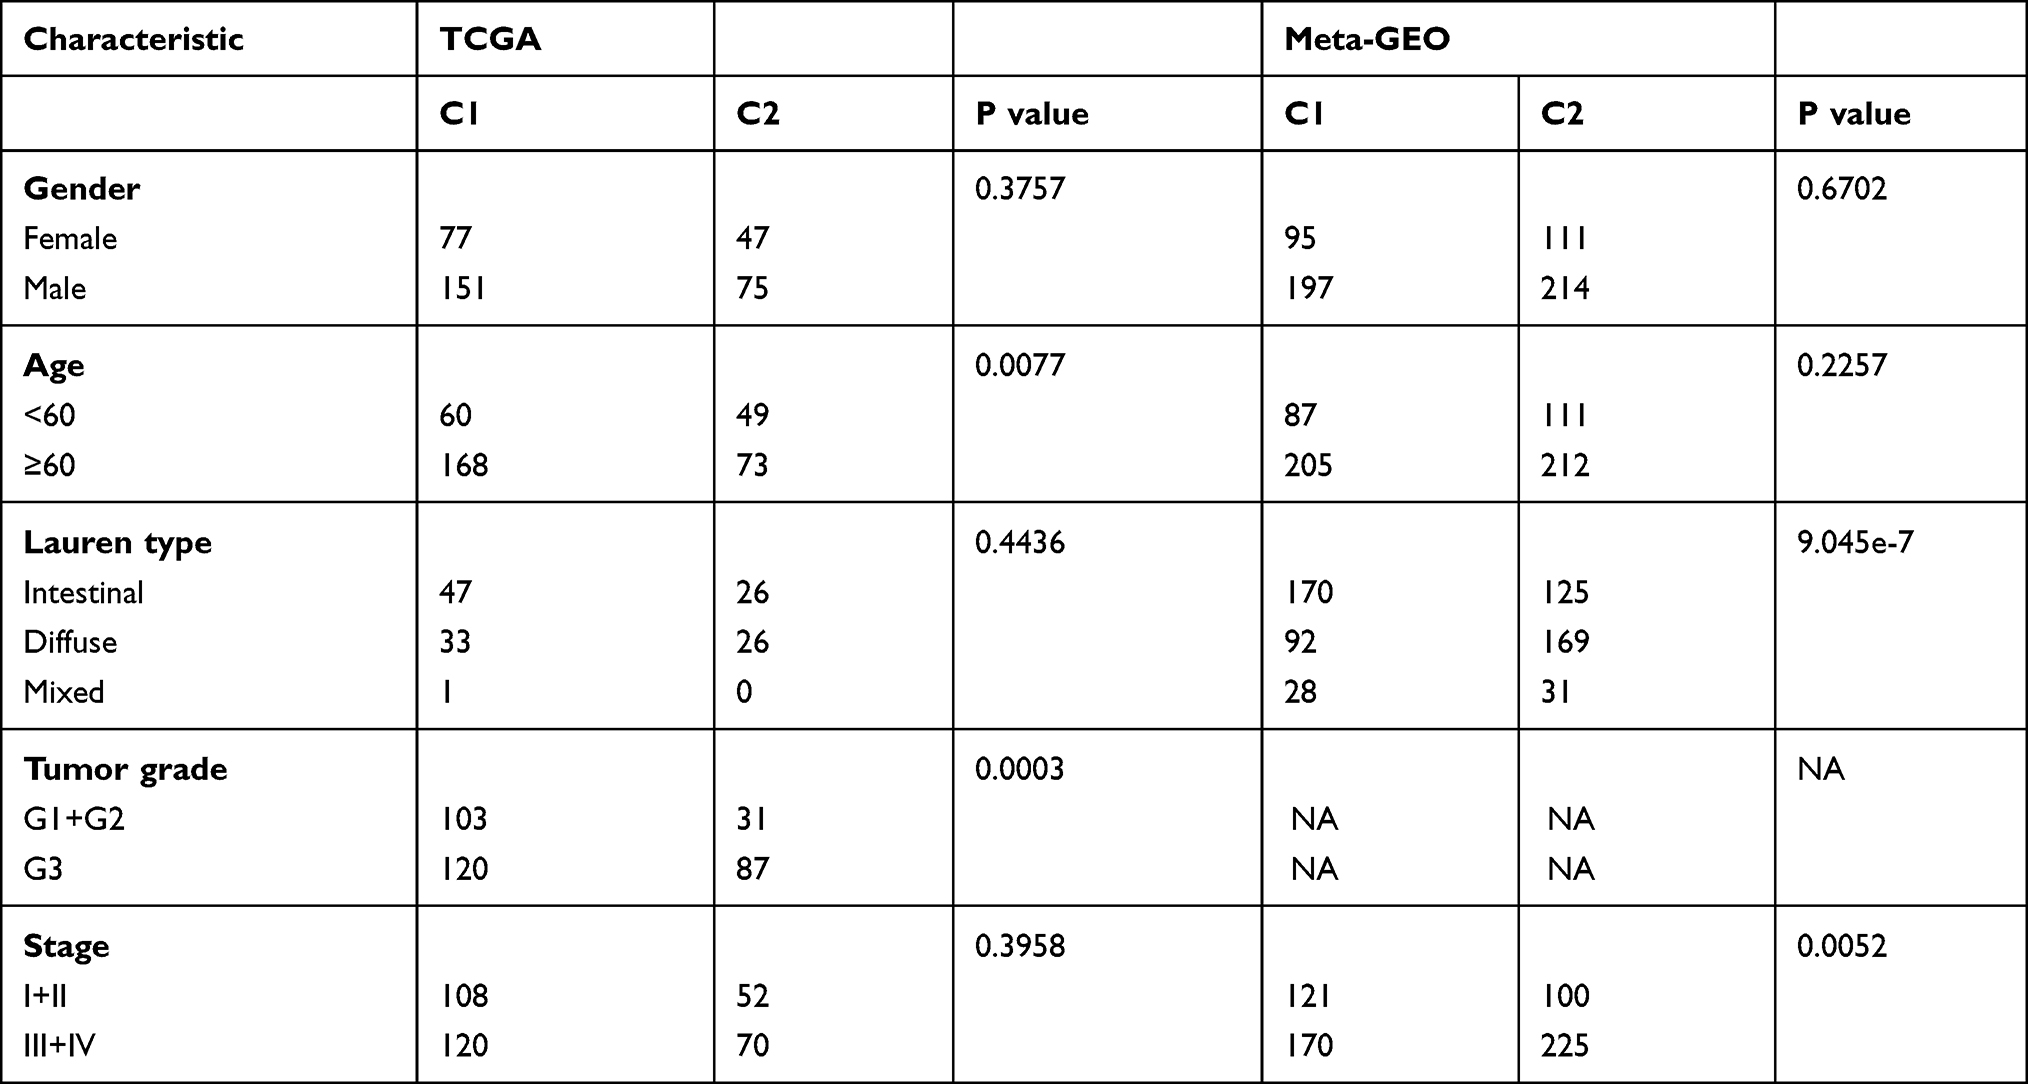 |
Table 2 Baseline Characteristic of the Patient in Different Ferroptosis Subtypes |
Ferroptosis Patterns and Ferroptosis Potential Level in the Role of Anti-PD-1/L1 Immunotherapy
The characteristics of FSS and FPI in speculating the therapeutic benefit of anti-PD-1 and anti-PD-L1 were further investigated. For FSS, both in anti-PD-L1 cohort (IMvigor210) and anti-PD-1 cohort (GSE78220), patients with low level exhibited significantly clinical benefits and a markedly prolonged survival (IMvigor210: Log rank test, p = 0.0336, Figure 6A; GSE78220: Log rank test, p = 0.0293, Figure 6D). Better therapeutic benefit in patients with low FSS compared to those with high FSS were confirmed (Figure 6B, C, E and F). Similar outcomes were observed in the FPI (Figure 6G–L). Collectively, FSS and FPI could be correlated with response to anti-PD-1/L1 immunotherapy.
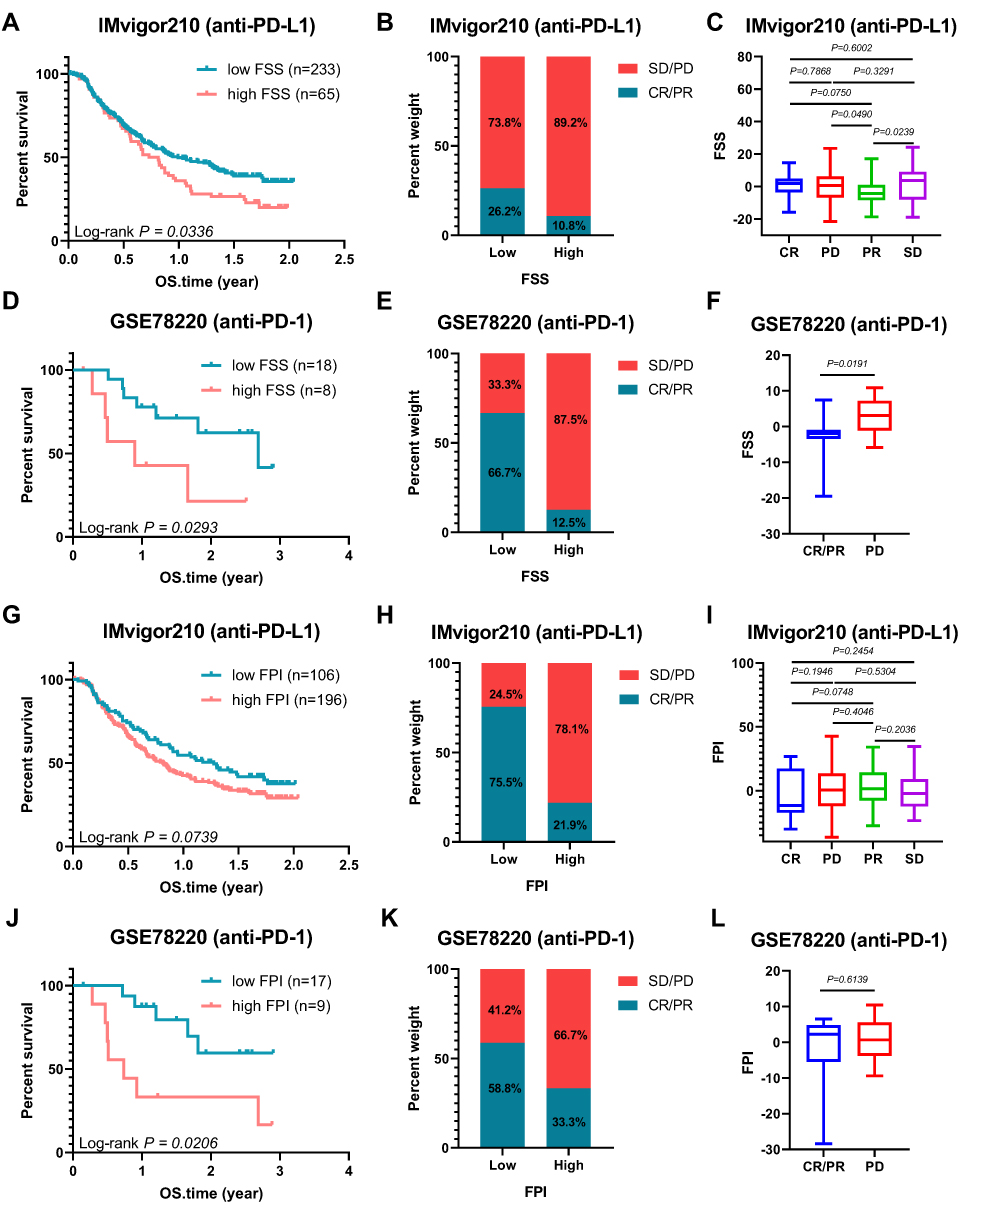 |
Figure 6 Ferroptosis Patterns and Ferroptosis Potential Level in the Role of Anti-PD-1/L1 Immunotherapy. (A) Kaplan–Meier curves of low and high FSS patient groups in the anti-PD-L1 immunotherapy cohort (IMvigor210). (B) The proportion of patients with response to PD-L1 blockade immunotherapy in low or high FSS groups; SD: stable disease, PD: progressive disease; CR, complete response; PR, partial response. (C) Distribution of FSS in different anti-PD-L1 clinical response groups. (D) Kaplan–Meier curves of low and high FSS patient groups in the anti-PD-1 immunotherapy cohort (GSE78220). (E) The proportion of patients with response to anti-PD-1 immunotherapy in low or high FSS groups. (F) Differences in FSS among different anti-PD-1 clinical response groups. (G) Kaplan–Meier curves of low and high FPI patient groups in the anti-PD-L1 immunotherapy cohort (IMvigor210). (H) The proportion of patients with response to anti-PD-L1 immunotherapy in low or high FPI groups. (I) Distribution of FSS in different anti-PD-L1 clinical response groups. (J) Kaplan–Meier curves of low and high FPI patient groups in the anti-PD-1 immunotherapy cohort (GSE78220). (K) The proportion of patients with response to PD-1 blockade immunotherapy in low or high FPI groups. (L) Differences in FPI among different anti-PD-1 clinical response groups. The statistical significance of differences in all survival analysis was determined via the Log rank test. |
Discussion
Although immunotherapy has opened a new frontier in GC treatment, only a part of patients could obtain clinical benefits, which demanded novel biomarkers enabling to predict the response to immunotherapy. Ferroptosis has been reported closely related to tumorigenesis and immunity but with a dual role. Therefore, identifying distinct ferroptosis patterns is helpful to construct an effective immunotherapy strategy.
In the current study, two ferroptosis subtypes (C1 and C2) with different prognosis and ferroptosis level in GC were identified with a relationship to the characteristics of TME. Compared with C1, C2 showed higher immune score and stromal score. Besides, C2 had a higher abundance of immune cell infiltration and was significantly enriched in epithelial–mesenchymal transition, which suggested a correlation with active immune and stromal activities. It was reported that immune infiltration in the TME is generally characterized into three patterns:33 1) Immune-inflamed: dense infiltration of immune cell within the tumor ensures the high probability of response to immunotherapy, 2) Immune-excluded: a large number of immune cells infiltrated around the tumor but not penetrating inward lowers the probability of response, 3) Immune-desert: lacking of T cells in both tumor cells and peripheral matrix leads to immune tolerance or immune ignorance. According to the exhibitions that C2 with a higher abundance of immune cell infiltration but lower probability in response to immunotherapy and associated with stromal activities, it was reasonable to speculate that C2 was in accordance with the immune-excluded phenotype. As a successful immunotherapy depends on the ability of innate and adaptive immune cells to penetrate into the tumor parenchyma and eradicate cancer cells,34 in the background of immune-excluded phenotype, activated immune cells cannot effectively penetrate into the tumor parenchyma to interact with tumor cells, resulting in no intended targets for immunotherapy. Conclusively, although C2 was described with a more active immunity and a higher expression of immune checkpoints, it was not surprising C2 tended to carry a poorer prognosis. Previously, we developed a ferroptosis-related model to predict the prognosis of GC and found that the high-risk group also exhibited higher Immune Score, Stromal Score, and ESTIMATE Score, suggesting higher levels in immune cells infiltration and stromal component in the TME of high-risk group.35 Additionally, the high-risk group was also speculated in accordance with the immune-excluded subtype. Therefore, we inferred that C2 patients in this study have a high-risk score in the ferroptosis-related model. As for C1, it was reasonable to deduce as immune-inflamed phenotype because of lower stromal activities but increased neoantigen load, enhanced response to immunotherapy and relatively better prognosis.
In the meta-GEO cohort, we observed that C2 was significantly associated with diffuse-type while C1 with intestinal-type. The TME characteristic of diffuse-type GC is similar to immune-excluded phenotype as it is accompanied with extensive stromal fibrosis and abundant extracellular matrix,36,37 which also impede the accessibility of T-cells.38 As for intestinal-type, it is considered as the result of Correa pathway under chronic inflammation stress,39 which increases the infiltration of immunosuppressive cells and results T cell exhaustion.40
There also existed a negative correlation between FSS and TMB in GC. Previous studies have indicated that gene mutations were associated with cancer immunotherapy response.41–43 It was also reported that tumors with higher levels of TMB are more likely to produce new immunogenic neo-antigens, making tumors more susceptible to immunotherapy.44 Our analysis demonstrated that the FSS integrated not only the characteristics of stromal and immune TME but also tumor mutation load, which could serve as an accurate predictor for patient response to immunotherapy and thereby direct the individual immunotherapy of GC.
To evaluate the ferroptosis level, we constructed a FPI model. Similar to FSS, a higher FPI was observed in C2 and carried with a poorer prognosis. Besides, the correlations of FPI with the characteristics TME and TMB resemble to FSS. A higher FPI was associated with more active immune and stromal activities but a lower probability of immunotherapy response. Liu et al21 systematically analyzed the aberrances and functional implications of ferroptosis in cancer and found that epithelial–mesenchymal transition (stromal-related pathway) and IL-6/JAK/STAT3 (immune-related pathway) signaling were enriched in the high-FPI group. Besides, they also demonstrated that higher FPI was correlated with a worse survival in glioblastoma multiforme (GBM), kidney renal clear cell carcinoma (KIRC), kidney renal papillary cell carcinoma (KIRP), liver hepatocellular carcinoma (LIHC), and lung adenocarcinoma (LUAD). The unconventional phenomena that a high ferroptosis level was associated with worse status in GC, GBM, KIRC, KIRP, LIHC and LUAD indicated that ferroptosis plays a dual role in tumor immune response. Also, regulating the ferroptosis level in TME with different strategies may benefit patients and improve prognosis.
In our study, C2 corresponding to diffuse-type GC had a higher level of FPI compared with C1 corresponding to intestinal-type GC. It was reported that low-grade inflammation could increase the cell population size due to a decreased rate of DNA damage-independent apoptosis, whereas higher grade inflammation could suppress cell growth through an increasing rate of DNA damage-induced apoptosis.45 These may be due to different levels of ROS corresponding to different grades of inflammation. At low levels, ROS could exert a protective effect through activating protective signaling pathways against inflammation and increase cell proliferation as well as survival but at high levels ROS cause DNA damage and trigger apoptosis.46 Ferroptosis, an iron-dependent form of regulated cell death, is also induced by the accumulation of lethal lipid ROS.6 Diffuse-type GC characterized with highly active inflammation47,48 may have a higher level of ROS, which induce ferroptosis in a higher proportion of cells, and therefore a higher FPI was observed. For intestinal-type GC, it undergoes chronic inflammatory process49,50 and is accompanied with a relatively lower level of ROS. As a result, the proportion of cells that undergo ferroptosis is smaller.
There were some limitations that must be emphasized. Firstly, our findings mainly come from retrospective data and prospective clinical validation in a larger GC cohort receiving immunotherapy is demanded henceforth. Secondly, the mechanism of ferroptosis shaping TME characteristics in GC was unknown and should be investigated experimentally in the future.
In conclusion, we analyzed the ferroptosis patterns in GC and its relationship with TME. The difference of ferroptosis patterns possessing significantly different ferroptosis levels was associated with the heterogeneity and complexity of individual TME. Therefore, the systematic assessment of ferroptosis patterns in this study may be helpful for the further understanding of TME and guiding immunotherapy.
Data Sharing Statement
Publicly available datasets were analyzed in this study. This data can be found here: http://xena.ucsc.edu; https://www.ncbi.nlm.nih.gov/geo.
Acknowledgments
We thank TCGA and GEO database providing available data. We express our sincere gratitude to reviewers for their constructive comments.
Funding
This study was supported by following fundings: Basic research program of Guangzhou Science and technology program – basic and applied basic research program (Doctoral young scientific and technological personnel) (Grant No. 202102020535); The First Affiliated Hospital of Guangzhou University of Chinese Medicine “Innovative Strong Hospital” Clinical Research Project (Grant No. No.2019IIT19); Natural Science Foundation of China (Grant No. 81973819); Youth Program of Natural Science Foundation of China (Grant No. 81904139); Major Subject Research Projects of Guangzhou University of Traditional Chinese Medicine (Grant No. A1-2606-19-110-007); Liu Fengbin, Guangdong Famous Traditional Chinese Medicine Inheritance Studio (Grant No. Guangdong TCM office [2020] no. 1); “Innovation Foster Hospital” Program of First Affiliated Hospital of Guangzhou University of Chinese Medicine (Grant No. 2017TD05); Natural Science Foundation of Guangdong Province (Grant No. 2017A030310121, 2019A1515011145); Guangdong Medical Science and Technology Research Fund (Grant No. A2020186); Innovation Development Project of the First Affiliated Hospital, Guangzhou University of Chinese Medicine (Grant No. 2019QN01).
Disclosure
The authors report no conflicts of interest in this work.
References
1. Smyth EC, Nilsson M, Grabsch HI, van Grieken NC, Lordick F. Gastric cancer. Lancet. 2020;396(10251):635–648. doi:10.1016/S0140-6736(20)31288-5
2. Li L, Zhang S, Xie D, Chen H, Zheng X, Pan D. Dual inhibitor of PI3K and mTOR (NVP-BEZ235) augments the efficacy of fluorouracil on gastric cancer chemotherapy. Onco Targets Ther. 2018;11:6111–6118. doi:10.2147/OTT.S172957
3. Saleh R, Elkord E. Acquired resistance to cancer immunotherapy: role of tumor-mediated immunosuppression. Semin Cancer Biol. 2020;65:13–27. doi:10.1016/j.semcancer.2019.07.017
4. Ribas A, Wolchok JD. Cancer immunotherapy using checkpoint blockade. Mar. 2018;359(6382):1350–1355.
5. Akin Telli T, Bregni G, Camera S, Deleporte A, Hendlisz A, Sclafani F. PD-1 and PD-L1 inhibitors in oesophago-gastric cancers. Cancer Lett. 2020;469:142–150. doi:10.1016/j.canlet.2019.10.036
6. Dixon SJ, Lemberg KM, Lamprecht MR, et al. Ferroptosis: an iron-dependent form of nonapoptotic cell death. Cell. 2012;149(5):1060–1072. doi:10.1016/j.cell.2012.03.042
7. Wang W, Green M, Choi J, et al. CD8 T cells regulate tumour ferroptosis during cancer immunotherapy. Nature. 2019;569(7755):270–274. doi:10.1038/s41586-019-1170-y
8. Lang X, Green M, Wang W, et al. Radiotherapy and immunotherapy promote tumoral lipid oxidation and ferroptosis via synergistic repression of SLC7A11. Cancer Discov. 2019;9(12):1673–1685. doi:10.1158/2159-8290.CD-19-0338
9. Friedmann Angeli J, Krysko D, Conrad M. Ferroptosis at the crossroads of cancer-acquired drug resistance and immune evasion. Nat Rev Cancer. 2019;19(7):405–414. doi:10.1038/s41568-019-0149-1
10. Yang W, SriRamaratnam R, Welsch M, et al. Regulation of ferroptotic cancer cell death by GPX4. Cell. 2014;156:317–331. doi:10.1016/j.cell.2013.12.010
11. Veglia F, Tyurin V, Blasi M, et al. Fatty acid transport protein 2 reprograms neutrophils in cancer. Nature. 2019;569(7754):73–78. doi:10.1038/s41586-019-1118-2
12. Kalinski P. Regulation of immune responses by prostaglandin E2. J Immunol. 2012;188(1):21–28. doi:10.4049/jimmunol.1101029
13. Cristescu R, Lee J, Nebozhyn M, et al. Molecular analysis of gastric cancer identifies subtypes associated with distinct clinical outcomes. Nat Med. 2015;21(5):449–456. doi:10.1038/nm.3850
14. Ooi CH, Ivanova T, Wu J, et al. Oncogenic pathway combinations predict clinical prognosis in gastric cancer. PLoS Genet. 2009;5(10):e1000676. doi:10.1371/journal.pgen.1000676
15. Lei Z, Tan IB, Das K, et al. Identification of Molecular Subtypes of Gastric Cancer With Different Responses to PI3-Kinase Inhibitors and 5-Fluorouracil. Gastroenterology. 2013;145(3):554–565. doi:10.1053/j.gastro.2013.05.010
16. Qian Z, Zhu G, Tang L, et al. Whole genome gene copy number profiling of gastric cancer identifies PAK1 and KRAS gene amplification as therapy targets. Genes Chromosomes Cancer. 2014;53(11):883–894. doi:10.1002/gcc.22196
17. Leek JT, Johnson WE, Parker HS, Jaffe AE, Storey JD. The sva package for removing batch effects and other unwanted variation in high-throughput experiments. Bioinformatics. 2012;28(6):882–883. doi:10.1093/bioinformatics/bts034
18. Tyner C, Barber GP, Casper J, et al. The UCSC genome browser database: 2017 update. Nucleic Acids Res. 2017;45(D1):D626–D634.
19. Zhou N, Bao J. FerrDb: a manually curated resource for regulators and markers of ferroptosis and ferroptosis-disease associations. Database. 2020;2020:baaa021. doi:10.1093/database/baaa021
20. Possemato R, Marks KM, Shaul YD, et al. Functional genomics reveal that the serine synthesis pathway is essential in breast cancer. Nature. 2011;476(7360):346–350. doi:10.1038/nature10350
21. Liu Z, Zhao Q, Zuo Z, et al. Systematic analysis of the aberrances and functional implications of ferroptosis in cancer. iScience. 2020;23(7):101302. doi:10.1016/j.isci.2020.101302
22. Zhang X, Du L, Qiao Y, et al. Ferroptosis is governed by differential regulation of transcription in liver cancer. Redox Biol. 2019;24:101211. doi:10.1016/j.redox.2019.101211
23. Hassannia B, Wiernicki B, Ingold I, et al. Nano-targeted induction of dual ferroptotic mechanisms eradicates high-risk neuroblastoma. J Clin Invest. 2018;128(8):3341–3355. doi:10.1172/JCI99032
24. Kursa M, Rudnicki W. Feature Selection with Boruta Package. J Stat Softw. 2010;36:1–13. doi:10.18637/jss.v036.i11
25. Luo D, Kuang F, Du J, et al. Characterization of the Immune cell infiltration profile in pancreatic carcinoma to aid in immunotherapy. Front Oncol. 2021;11:677609. doi:10.3389/fonc.2021.677609
26. Yoshihara K, Shahmoradgoli M, Martínez E, et al. Inferring tumour purity and stromal and immune cell admixture from expression data. Nat Commun. 2013;4:2612. doi:10.1038/ncomms3612
27. Hänzelmann S, Castelo R, Guinney J. GSVA: gene set variation analysis for microarray and RNA-seq data. BMC Bioinform. 2013;14:7. doi:10.1186/1471-2105-14-7
28. Charoentong P, Finotello F, Angelova M, et al. Pan-cancer Immunogenomic analyses reveal genotype-immunophenotype relationships and predictors of response to checkpoint blockade. Cell Rep. 2017;18(1):248–262. doi:10.1016/j.celrep.2016.12.019
29. Mayakonda A, Lin DC, Assenov Y, Plass C, Koeffler HP. Maftools: efficient and comprehensive analysis of somatic variants in cancer. Genome Res. 2018;28(11):1747–1756. doi:10.1101/gr.239244.118
30. Mariathasan S, Turley SJ, Nickles D, et al. TGFβ attenuates tumour response to PD-L1 blockade by contributing to exclusion of T cells. Nature. 2018;554(7693):544–548. doi:10.1038/nature25501
31. Hugo W, Zaretsky JM, Sun L, et al. Genomic and Transcriptomic Features of Response to Anti-PD-1 Therapy in Metastatic Melanoma. Cell. 2017;168(3):542. doi:10.1016/j.cell.2017.01.010
32. Rizvi NA, Hellmann MD, Snyder A, et al. Cancer immunology. Mutational landscape determines sensitivity to PD-1 blockade in non-small cell lung cancer. Science. 2015;348(6230):124–128. doi:10.1126/science.aaa1348
33. Li SC, Vu LT, Luo JJ, et al. Tissue Elasticity Bridges Cancer Stem Cells to the Tumor Microenvironment Through microRNAs: implications for a “Watch-and-Wait” Approach to Cancer. Curr Stem Cell Res Ther. 2017;12(6):455–470. doi:10.2174/1574888X12666170307105941
34. Zhang X, Ashcraft KA, Betof Warner A, Nair SK, Dewhirst MW. Can Exercise-Induced Modulation of the Tumor Physiologic Microenvironment Improve Antitumor Immunity? Cancer Res. 2019;79(10):2447–2456. doi:10.1158/0008-5472.CAN-18-2468
35. Jiang X, Yan Q, Xie L, et al. Construction and validation of a ferroptosis-related prognostic model for gastric cancer. J Oncol. 2021;2021:6635526. doi:10.1155/2021/6635526
36. Fukamachi H, Kim S-K, Koh J, et al. A subset of diffuse-type gastric cancer is susceptible to mTOR inhibitors and checkpoint inhibitors. J Exp Clin Cancer Res. 2019;38(1):127. doi:10.1186/s13046-019-1121-3
37. Kuroda K, Yashiro M, Sera T, et al. The clinicopathological significance of Thrombospondin-4 expression in the tumor microenvironment of gastric cancer. PLoS One. 2019;14(11):e0224727–e0224727. doi:10.1371/journal.pone.0224727
38. Pai SI, Cesano A, Marincola FM. The paradox of cancer immune exclusion: immune oncology next frontier. Cancer Treat Res. 2020;180:173–195.
39. Toyoshima O, Nishizawa T, Yoshida S, et al. Comparison of endoscopic gastritis based on Kyoto classification between diffuse and intestinal gastric cancer. World J Gastrointest Endosc. 2021;13(5):125–136. doi:10.4253/wjge.v13.i5.125
40. Jiang Y, Li Y, Zhu B. T-cell exhaustion in the tumor microenvironment. Cell Death Dis. 2015;6(6):e1792. doi:10.1038/cddis.2015.162
41. Dong ZY, Zhong WZ, Zhang XC, et al. Potential Predictive Value of TP53 and KRAS Mutation Status for Response to PD-1 Blockade Immunotherapy in Lung Adenocarcinoma. Clin Cancer Res. 2017;23(12):3012–3024. doi:10.1158/1078-0432.CCR-16-2554
42. George S, Miao D, Demetri GD, et al. Loss of PTEN Is Associated with Resistance to Anti-PD-1 Checkpoint Blockade Therapy in Metastatic Uterine Leiomyosarcoma. Immunity. 2017;46(2):197–204. doi:10.1016/j.immuni.2017.02.001
43. Burr ML, Sparbier CE, Chan Y-C, et al. CMTM6 maintains the expression of PD-L1 and regulates anti-tumour immunity. Nature. 2017;549(7670):101–105. doi:10.1038/nature23643
44. Riaz N, Morris L, Havel JJ, Makarov V, Desrichard A, Chan TA. The role of neoantigens in response to immune checkpoint blockade. Int Immunol. 2016;28(8):411–419. doi:10.1093/intimm/dxw019
45. Guo Y, Nie Q, MacLean AL, Li Y, Lei J, Li S. Multiscale modeling of inflammation-induced tumorigenesis reveals competing oncogenic and oncoprotective roles for inflammation. Cancer Res. 2017;77(22):6429–6441. doi:10.1158/0008-5472.CAN-17-1662
46. Sena LA, Chandel NS. Physiological roles of mitochondrial reactive oxygen species. Mol Cell. 2012;48(2):158–167. doi:10.1016/j.molcel.2012.09.025
47. Lee I. Critical pathogenic steps to high risk Helicobacter pylori gastritis and gastric carcinogenesis. World J Gastroenterol. 2014;20(21):6412–6419. doi:10.3748/wjg.v20.i21.6412
48. Watanabe M, Kato J, Inoue I, et al. Development of gastric cancer in nonatrophic stomach with highly active inflammation identified by serum levels of pepsinogen and Helicobacter pylori antibody together with endoscopic rugal hyperplastic gastritis. Int J Cancer. 2012;131(11):2632–2642. doi:10.1002/ijc.27514
49. Piazuelo MB, Riechelmann RP, Wilson KT, Algood HMS. Resolution of gastric cancer-promoting inflammation: a novel strategy for anti-cancer therapy. Curr Top Microbiol Immunol. 2019;421:319–359.
50. Krishnan V, Lim DXE, Hoang PM, et al. DNA damage signalling as an anti-cancer barrier in gastric intestinal metaplasia. Gut. 2020;69(10):1738–1749. doi:10.1136/gutjnl-2019-319002
 © 2021 The Author(s). This work is published and licensed by Dove Medical Press Limited. The full terms of this license are available at https://www.dovepress.com/terms.php and incorporate the Creative Commons Attribution - Non Commercial (unported, v3.0) License.
By accessing the work you hereby accept the Terms. Non-commercial uses of the work are permitted without any further permission from Dove Medical Press Limited, provided the work is properly attributed. For permission for commercial use of this work, please see paragraphs 4.2 and 5 of our Terms.
© 2021 The Author(s). This work is published and licensed by Dove Medical Press Limited. The full terms of this license are available at https://www.dovepress.com/terms.php and incorporate the Creative Commons Attribution - Non Commercial (unported, v3.0) License.
By accessing the work you hereby accept the Terms. Non-commercial uses of the work are permitted without any further permission from Dove Medical Press Limited, provided the work is properly attributed. For permission for commercial use of this work, please see paragraphs 4.2 and 5 of our Terms.