")
Back to Journals » Patient Preference and Adherence » Volume 12
Feasibility of visual aids for risk evaluation by hospitalized patients with coronary artery disease: results from face-to-face interviews
Authors Magliano CAS , Monteiro AL, Tura BR, Oliveira CSR , Rebelo ARO, Pereira CCA
Received 2 February 2018
Accepted for publication 27 March 2018
Published 8 May 2018 Volume 2018:12 Pages 749—755
DOI https://doi.org/10.2147/PPA.S164385
Checked for plagiarism Yes
Review by Single anonymous peer review
Peer reviewer comments 2
Editor who approved publication: Dr Johnny Chen
Carlos Alberto da Silva Magliano,1 Andrea Liborio Monteiro,2 Bernardo Rangel Tura,1 Claudia Silvia Rocha Oliveira,1 Amanda Rebeca de Oliveira Rebelo,1 Claudia Cristina de Aguiar Pereira3
1NATS, Instituto Nacional de Cardiologia, INC, Rio de Janeiro, Rio de Janeiro, Brazil; 2Department of Pharmacy Systems, Outcomes and Policy, College of Pharmacy, University of Illinois at Chicago, Chicago, IL, USA; 3Escola Nacional de Saúde Pública, ENSP, FIOCRUZ, Rio de Janeiro, Brazil
Purpose: Communicating information about risk and probability to patients is considered a difficult task. In this study, we aim to evaluate the use of visual aids representing perioperative mortality and long-term survival in the communication process for patients diagnosed with coronary artery disease at the National Institute of Cardiology, a Brazilian public hospital specializing in cardiology.
Patients and methods: One-on-one interviews were conducted between August 1 and November 20, 2017. Patients were asked to imagine that their doctor was seeking their input in the decision regarding which treatment represented the best option for them. Patients were required to choose between alternatives by considering only the different benefits and risks shown in each scenario, described as the proportion of patients who had died during the perioperative period and within 5 years. Each participant evaluated the same eight scenarios. We evaluated their answers in a qualitative and quantitative analysis.
Results: The main findings were that all patients verbally expressed concern about perioperative mortality and that 25% did not express concern about long-term mortality. Twelve percent considered the probabilities irrelevant on the grounds that their prognosis would depend on “God’s will.” Ten percent of the patients disregarded the reported likelihood of perioperative mortality, deciding to focus solely on the “chance of being cured.” In the quantitative analysis, the vast majority of respondents chose the “correct” alternatives, meaning that they made consistent and rational choices.
Conclusion: The use of visual aids to present risk attributes appeared feasible in our sample. The impact of heuristics and religious beliefs on shared health decision making needs to be explored better in future studies.
Keywords: patients’ preferences, coronary revascularization, angina, cardiology, coronary artery bypass grafting, percutaneous coronary intervention
Introduction
Patients are key, albeit often unrepresented, players in health care decision making. Understanding how patients value different aspects of health care interventions may help decision makers optimize resource allocation, foresee treatment uptake, and raise treatment adherence.1 For instance, patients diagnosed with coronary artery disease (CAD) and their clinicians may face difficult decisions regarding treatment options, mainly between coronary artery bypass grafting (CABG) and percutaneous coronary intervention (PCI). This kind of arrangement may be considered “preference sensitive,” meaning that the “right” treatment choice may depend on the relative weight the patient gives to the risks and benefits of treatments.
Stated preference methods, such as discrete choice experiments (DCEs), may be applied to elicit patients’ preferences regarding the benefits and risks of treatments. However, the inclusion of risk attributes in DCEs should encompass a serious consideration of the best strategy of communicating risk information to patients in an understandable and clear manner. It is well documented that conveying information about risk and probability both to patients and to the general population can be a difficult task.2,3
When patients fail to understand relevant information over the course of a DCE, their response patterns are likely to be affected, which may result in biased estimates.1 Consequently, their overall engagement with the choice experiment may be affected, and they may resort to simplified decision heuristics to complete the experiment (eg, they may ignore the risk attributes altogether). These phenomena may be especially relevant among patient groups with low health literacy and low numeracy.4,5
When probability information is not understood as intended, the validity, usefulness, and applicability of the results are limited; therefore, researchers must seek effective means of communication between clinician and patients.6,7 In recent years, several efforts have been undertaken to explore effective ways to communicate risk, and best-practices recommendations endorse the use of pictures and graphics to better illustrate the information.8,9
This article discusses the challenges faced by clinicians and patients in using visual aids to represent risk information in an inpatient sample in Brazil.
Patients and methods
Data collection was conducted by trained interviewers, comprising one cardiologist and two nurses, at the National Institute of Cardiology (INC – Instituto Nacional de Cardiologia), a public hospital specializing in cardiology. These professionals had not had any previous contact with the participants, and none of them was responsible for the care of any of those patients.
The study used a convenience sample of hospitalized patients with stable CAD, most of them waiting for a coronary revascularization procedure. Respondents were selected randomly based on their ward number using a list of random numbers generated from Microsoft Excel. We chose patients with CAD because we judged that they would be more committed to the interviews than any alternative sample from the general population.
This study was conceived according to the best-practices recommendations. Patients’ eligibility to participate in the study was determined by the following inclusion criteria: diagnosis of CAD; willingness to participate in a face-to-face interview and answer questions about preferences regarding possible treatment complications; willingness to have the interview audio recorded; willingness to provide informed consent; and currently being considered for a revascularization treatment. Participants were deemed ineligible if they had already undergone surgery, such as angioplasty, or if they believed themselves unable to understand the experiment.
Ethical approval was obtained from the National Institute of Cardiology Ethical Department (Comitê de ética e pesquisa do Instituto Nacional de Cardiologia), and written informed consent was obtained from each study participant (CAAE number 63684017.0.0000.5240).
One-on-one interviews were conducted between August 1 and November 20, 2017. Patients were asked to imagine that their doctor was seeking their input in the decision regarding which treatment represented the best option for them. Visual aids were used as a strategy to support communication by overcoming problems with numerical literacy (Figures 1–5).
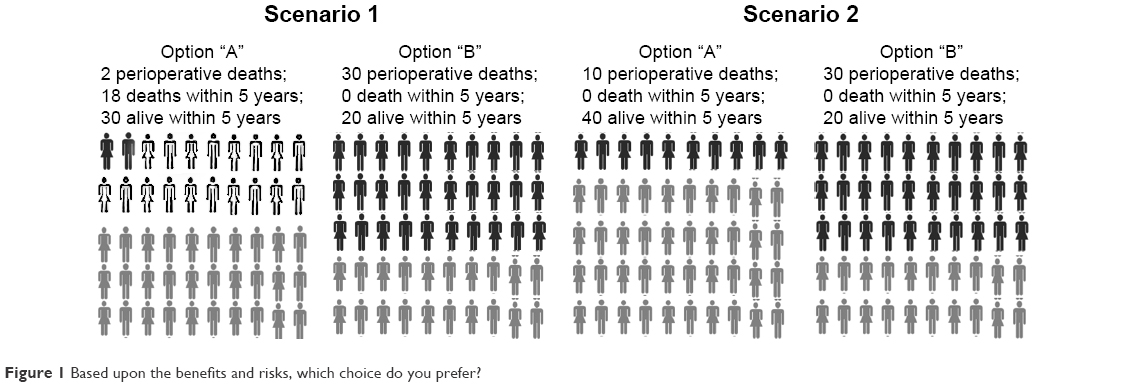 | Figure 1 Based upon the benefits and risks, which choice do you prefer? |
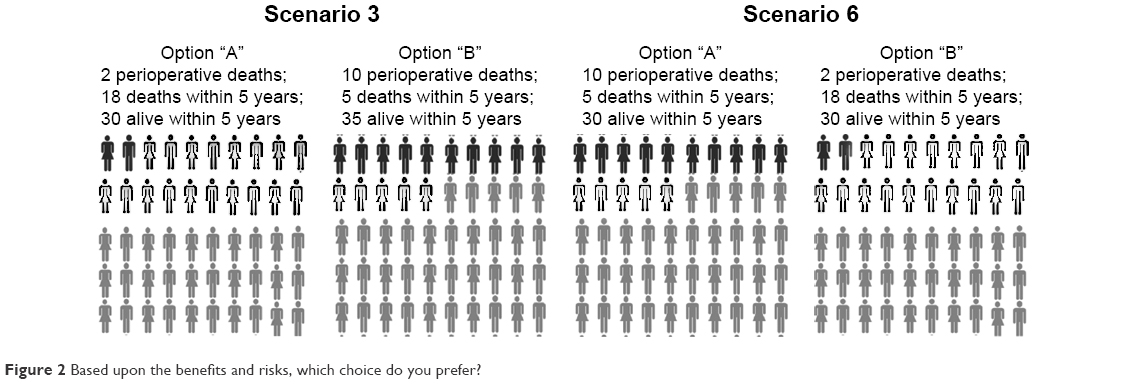 | Figure 2 Based upon the benefits and risks, which choice do you prefer? |
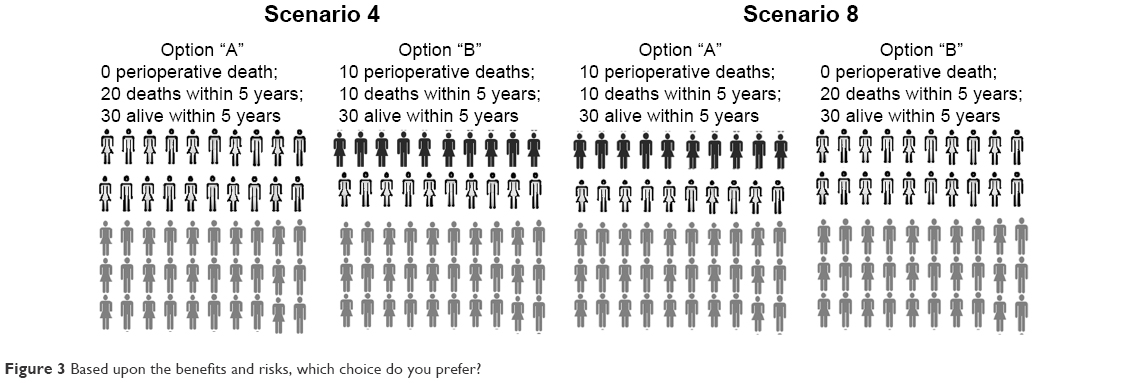 | Figure 3 Based upon the benefits and risks, which choice do you prefer? |
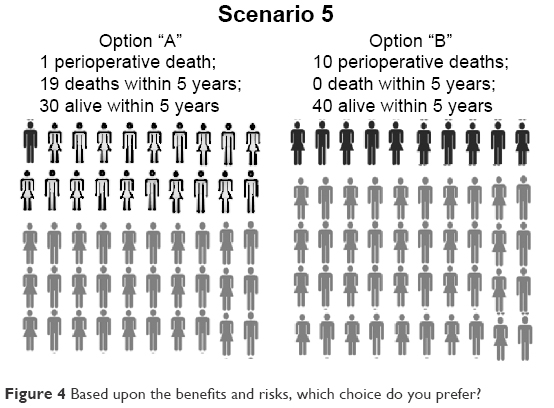 | Figure 4 Based upon the benefits and risks, which choice do you prefer? |
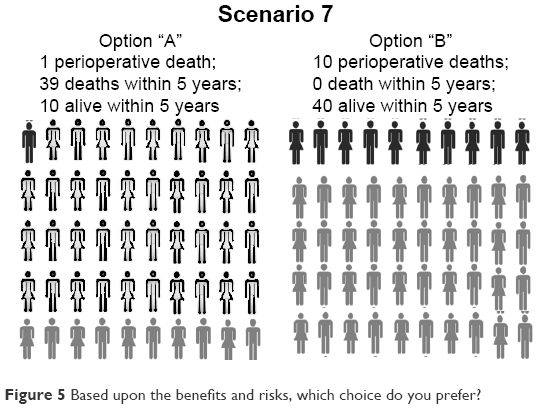 | Figure 5 Based upon the benefits and risks, which choice do you prefer? |
As no treatment labels were used, the subjects were required to choose between option “A” and option “B,” considering only the different benefits and risks shown in each scenario. The risks and benefits were represented by the various proportions of patients who had died during the perioperative period and within 5 years. The main trade-off was an increase in the risk of dying during the treatment for the benefit of greater long-term (5-year) survival. After each task, we asked the same open-ended question for a think-aloud exercise in which patients were asked to explain in their own words the reasons why they had chosen a particular option. Each participant evaluated the same eight scenarios.
We made the basic assumptions that dying in surgery is worse (less utility) than dying in 5 years and that dying in 5 years is worse than being alive. We also assumed that if we presented two options with different percentages of mortality and survival, the individual would choose according to his preferences (the option with the greatest utility) and that his choice would be the same regardless of which options were represented by the letters A and B and independently of the order in which the options had been displayed.
In keeping with economic theory (continuity axiom), we expected that in the first two scenarios patients would choose option “A,” since the first option had lower perioperative and overall risk (Figure 1). The third and sixth scenarios had the same probabilities, the only difference being that the options were inverted; consequently, we expected that whoever chose option “A” in the third scenario would choose “B” in the sixth and vice versa (Figure 2). The fourth and eighth scenarios contained dominated options and presented the same probabilities in different orders. We expected that the subjects would choose option “A” in the fourth and option “B” in the last scenario (Figure 3).
Qualitative approach
We performed a qualitative analysis with the main objective of identifying which arguments would be used by the patients when we asked them why they had made a particular choice. As described earlier, our quantitative analysis was based on “adequate response” assumptions. Notwithstanding, to classify the choices only as right or wrong answers would have been very simplistic. We searched for the words that were most used by the interviewees to justify their choices, expressions that could represent misunderstandings and any other possible reasoning that could have led them to choose in an alternative way (not necessarily meaning they were unable to understand the task).
All interviews were audio recorded in a digital format, and the data collected were analyzed qualitatively in a three-stage procedure: 1) transcribing the data in preparation for analysis, 2) reducing the data to themes, and 3) representing the data. First, the data were fully transcribed and properly compared with the audio versions to detect errors. Then, we reviewed the data in search of repeated ideas or concepts, which were grouped into categories. A qualitative analysis was conducted on the patients’ transcribed responses, preserving the terms they used to justify their choices. Such terms were cataloged in groups with similar meanings. No data analysis software was used to perform this task. Two researchers analyzed the transcripts independently. The criterion used to terminate data collection was sampling saturation.10
Quantitative approach
In the first scenario, option “A” presented a risk of perioperative death of 2/50 (4%) and a risk of 18/50 (36%) of dying within 5 years. Option “B” presented a 30/50 (60%) risk of perioperative death and no further deaths during the 5-year period. We assumed that patients would choose the first option because there were fewer perioperative deaths and more long-term survivors (Figure 1).
In scenario two, the superiority of option “A” is even greater than in scenario one. The perioperative mortality is 10/50 (20%), as opposed to 30/50 (60%) for the second option. Our assumption was that patients would choose option “A” (Figure 1).
Scenario three presented a trade-off between worse/better perioperative mortality and better/worse long-term survival (Figure 2). We hypothesized that in scenarios three and six, patients would keep their first choice, regardless of the option, when they repeated the task. We merely inverted the order of the alternatives, maintaining the same proportions of perioperative and long-term deaths.
In scenario four, we assumed that patients would choose option “A,” since there were 30 patients still living within 5 years in both options, but option “A” had no perioperative mortality while option “B” had perioperative mortality of 10/50 (20%). We still hypothesized that in scenarios four and eight, patients would keep their first choice, regardless of the option, when they repeated the same task, similar to scenarios three and six. Between scenarios four and eight, we merely inverted the order of the alternatives, maintaining the exact proportions of perioperative and long-term deaths (Figure 3).
In scenarios five and seven (Figure 4), there was no assumption of a “correct” answer. Scenario seven was designed to estimate the proportion of patients who were choosing between the options using a heuristic based solely on perioperative mortality. With a single perioperative death (2%) and another 39 deaths (78%) within 5 years, option “A” had a long-term survival of only 10/50 (20%). Option “B” presented high perioperative mortality, 10/50 (20%), and the 5-year survival was 40/50 (80%).
A z-test for proportions was used to calculate whether choices made by patients were different from random choices. The null hypothesis was that the proportion of “correct” answers would be less than or equal to 50%. A p-value less than 0.05 was considered significant.
The latter part of the questionnaire included questions regarding demographic information (age, gender, ethnicity, income, and level of education). We summarized the data by means, medians, or percentages, as indicated.
Results
Each interview was ~45 minutes in duration. We enrolled 34 respondents; two of them were excluded because they considered themselves unable to understand. Overall, the respondents were likely to be male, retired, married, and religious (Table 1).
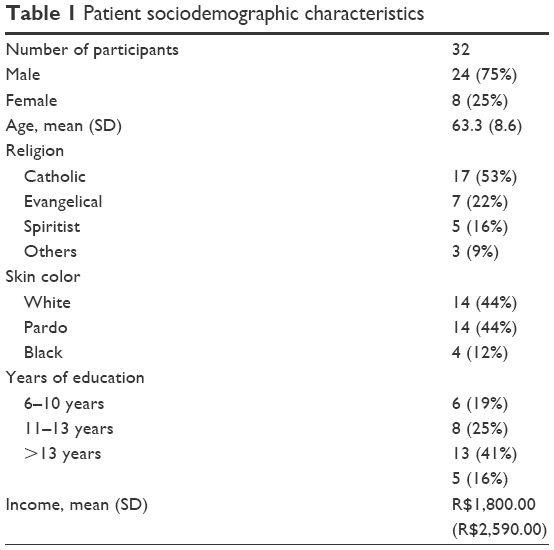 | Table 1 Patient sociodemographic characteristics |
Qualitative analysis results
The transcripts of the 32 interviews were analyzed, and the most frequently used terms were as follows: “death” (85 times), “live” (34 times), “cure” (9 times), and “God” (9 times). The preliminary analysis identified six categories: 1) “concern about perioperative death,” 2) “concern about long-term survival,” 3) “long-term survival depends exclusively on me,” 4) “long-term survival depends exclusively on God’s will,” 5) “the most important attribute is to be cured,” and 6) “difficulty in answering the questionnaire.”
Although they were asked to consider exclusively the probabilities presented, 20% of the patients considered the possibility that long-term mortality could be minimized through lifestyle changes. This belief may have impacted their choices. All patients verbally expressed concern about perioperative mortality, and 75% of respondents expressed concern about long-term mortality. Notably, 25% of patients based their decisions only on short-term risk.
Ninety-four percent of the patients were religious, most of them Catholic (53% of all subjects). Considering the small sample size, it is not possible to evaluate differences between religion-based subgroups or the impact of religion on choices. Nonetheless, it is interesting to note that 12% of respondents considered the probabilities irrelevant on the grounds that their prognosis would depend solely on God’s will.
In this study, we made assumptions regarding what constitutes a “correct answer.” During the interviews, it became evident that some patients were making unexpected choices, but those choices were clearly not related to misunderstanding or low numeracy skills. For example, in scenario one, some subjects argued that in option B, if one did not die during the perioperative process, one could be regarded as cured. Ten percent of the patients disregarded the reported probability of perioperative mortality, deciding to focus solely on the chance of being cured.
Finally, although our sample came from a public hospital located in a middle-income country, the subjects’ educational levels varied, ranging from patients who had studied less than 3 years to patients with a bachelor’s degree. The small sample size limits subgroup analysis by education level. With the exception of two patients who considered themselves incapable of understanding the experiment, only one patient verbally stated that the questionnaire was difficult to interpret.
Quantitative analysis results
For the first two scenarios, 29/32 (90.6%) of respondents chose the “correct” alternative, the one we had considered to have the greater benefit (option “A,” Figure 1), indicating significant rational economic behavior (p = 0.01). In scenario one, the vast majority of respondents, 30/32 (93.7%), responded according to our assumption (p < 0.01). We had judged option “B” as an irrational economic behavior choice, but some patients considered it reasonable because “if you survived the surgery, you would be cured” since no one had died in the following 5 years.
In scenario two, the superiority of option “A” was even greater, and there were no patients who died after the perioperative period. We assumed that patients would choose option “A,” which occurred in 31/32 cases (97%). The only person who chose option “B” was a patient with a college degree, who did not justify his choice.
In scenario three, 14 patients chose option “A” and 18 chose option “B.” We wanted to test whether patients would maintain their choice in comparison to scenario six. Most patients, 22/32 (68.7%), kept their choice, although this percentage cannot be considered significantly different from a random choice (p = 0.20).
In scenario four, most respondents 25/32 (78%) chose the “right answer” (p = 0.037). Nonetheless, we were surprised by many patients’ answers when they consciously opted for option “B.” They argued that option “B” presented the lowest risk for those who had survived the surgery. Instead of being a matter of right or wrong answers as we had originally thought, scenarios four and eight could be judged as a preference task. Between scenarios four and eight, the majority of patients 25/32 (78%) maintained their choice, and the consistency of patients’ choices was statistically significant (p = 0.04).
In scenarios five and seven (Figure 4), there was no assumption of a “right” answer. Half of the patients chose option “A” in scenario five, mainly because they considered the perioperative mortality in option “B” (20%) too high. The other half of respondents chose option “B,” mainly because there was better long-term survival, as they explained in the recorded conversations. In scenario seven (Figure 4), despite the enormous mortality (80% within 5 years), 25% of respondents preferred option “A,” which may be related to a heuristic process as some of these patients declared that they were focusing on perioperative death.
Discussion
Individuals faced with a choice between two treatments need to evaluate the benefits and risks of each option. It is recognized that patients’ risk perception and preferences are poorly understood;6 therefore, it is possible that cardiologists have been making recommendations based on outcomes that may not represent patients’ preferences adequately.
There are differences between patients’ and physicians’ values. For example, compared with physicians, patients seem to be willing to accept considerably heightened risks with PCI to avoid CABG. In a study by Bowling,11 angioplasty was the preferred treatment for 80% of respondents, and in this study, when patients were asked which treatment they would prefer between PCI and CABG if the risks and benefits were equal, 94% of patients chose PCI.
Besides the differences between patients and physicians in weighing up risks, the impact of the patients’ empowerment and participation on health decisions is unknown. For example, the results from the Bari study have shown inconsistency regarding treatment impact in randomized versus registry diabetic patients. Their choices may, at least in part, explain these differences, since patients’ preferences may be related to some characteristics that influence adherence to prescribed medications and compliance with treatment. The impact of the incorporation of patients’ preferences in coronary disease treatment needs to be researched in future trials.12
In this study, we undertook a series of face-to-face semi-structured interviews with stable hospitalized patients with CAD to appraise the feasibility of using visual aids to represent risks. The rationality and consistency of the responses were evaluated quantitatively according to utility assumptions. The pattern of responses was also qualitatively assessed, bringing inferences to inform future studies.
Understanding probabilities may be a challenge for patients, but in this study, we demonstrated that it is possible to present risk trade-offs in scenarios with visual aids and to obtain consistent and rational answers with the potential to reveal patients’ preferences. Future studies may test the impact of such visual aids in discussions between stakeholders regarding coronary revascularization treatment options.
Another important aspect identified in our study was the impact caused by the religious beliefs of patients. In this study, 12% of respondents had not considered the probabilities based on their prognosis, depending solely on God’s will. Our small sample does not permit us to infer the impact of religion (50% Catholic and 50% Evangelical), skin color (50% white, 25% black, and 25% brown), origin (100% from Rio de Janeiro), or level of education (75% with more than 9 years of study and 25% with more than 6 years, not one had a college degree). The impact of religious beliefs needs to be explored in future preference studies.
Our study does have several limitations. Only a small number of patients were recruited; consequently, the study did not have enough power for subgroup analysis. In addition, the participants came from a single hospital in Brazil; this common factor limits the generalizability of the study. The number of scenarios selected could have led to survey fatigue. Furthermore, the outcome definitions and survey structure were tested in pilot studies but were not validated. Finally, although the use of visual aids was considered feasible, some patients were averse to short-term risks and preferred treatment options with a lower expected value. The impact of religious beliefs and heuristics on shared health care decision making merits future research.
Conclusion
Physicians and health care organizations have the obligation to overcome linguistic, cultural, and health literacy barriers to successfully make safe and high-quality recommendations considering patients’ values.
The use of visual aids to present risk attributes was feasible in a sample of hospitalized patients at a public tertiary hospital in Brazil. The patients considered themselves able to understand and participate in decisions, and most of them presented answers consistent with economic theory.
Acknowledgments
There was no financial or material support for this study.
Disclosure
The authors report no conflicts of interest in this work.
References
Ali S, Ronaldson S. Ordinal preference elicitation methods in health economics and health services research: using discrete choice experiments and ranking methods. Br Med Bull. 2012;103(1):21–44. | ||
Harrison M, Rigby D, Vass C, Flynn T, Louviere J, Payne K. Risk as an attribute in discrete choice experiments: a critical review. Patient. 2014;7(2):151–170. | ||
Vass CM, Payne K. Using discrete choice experiments to inform the benefit-risk assessment of medicines: are we ready yet? Pharmacoeconomics. 2017;35(9):859–866. | ||
Lipkus I, Samsa G, Rimer B. General performance on a numeracy scale among highly educated samples. Med Decis Making. 2001;21(1):37–44. | ||
Gigerenzer G, Gaissmaier W, Kurz-Milcke E, Schwartz LM, Woloshin S. Helping doctors and patients make sense of health statistics. Psychol Sci Public Interest. 2007;8(2):53–96. | ||
Ahmed H, Naik G, Willoughby H, Edwards A. Communicating risk. BMJ. 2012;344:e3996. | ||
Veldwijk J, Essers BA, Lambooij MS, Dirksen CD, Smit HA, de Wit GA. Survival or mortality: does risk attribute framing influence decision-making behavior in a discrete choice experiment? Value Health. 2016;19(2):202–209. | ||
Price M, Cameron R, Butow P. Communicating risk information: the influence of graphical display format on quantitative information perception – accuracy, comprehension and preferences. Patient Educ Couns. 2007;69(1–3):121–128. | ||
Galesic M, Garcia-Retamero R, Gigerenzer G. Using icon arrays to communicate medical risks: overcoming low numeracy. Health Psychol. 2009;28(2):210–216. | ||
Seale C. Grounding theory. In: Seale C, editor. The Quality of Qualitative Research. London: Sage Publications Ltd; 1999:87–105. | ||
Bowling A, Culliford L, Smith D, Rowe G, Reeves BC. What do patients really want? Patients’ preferences for treatment for angina. Health Expect. 2008;11(2):137–147. | ||
Detre KM, Guo P, Holubkov R, et al. Coronary revascularization in diabetic patients: a comparison of the randomized and observational components of the Aypass Angioplasty Revascularization Investigation (BARI). Circulation. 1999;99(5):633–640. |
 © 2018 The Author(s). This work is published and licensed by Dove Medical Press Limited. The full terms of this license are available at https://www.dovepress.com/terms.php and incorporate the Creative Commons Attribution - Non Commercial (unported, v3.0) License.
By accessing the work you hereby accept the Terms. Non-commercial uses of the work are permitted without any further permission from Dove Medical Press Limited, provided the work is properly attributed. For permission for commercial use of this work, please see paragraphs 4.2 and 5 of our Terms.
© 2018 The Author(s). This work is published and licensed by Dove Medical Press Limited. The full terms of this license are available at https://www.dovepress.com/terms.php and incorporate the Creative Commons Attribution - Non Commercial (unported, v3.0) License.
By accessing the work you hereby accept the Terms. Non-commercial uses of the work are permitted without any further permission from Dove Medical Press Limited, provided the work is properly attributed. For permission for commercial use of this work, please see paragraphs 4.2 and 5 of our Terms.