")
Back to Journals » Diabetes, Metabolic Syndrome and Obesity » Volume 9
Fatty acid desaturase 1 knockout mice are lean with improved glycemic control and decreased development of atheromatous plaque
Authors Powell D , Gay J, Smith M, Wilganowski N, Harris A, Holland A, Reyes M, Kirkham L, Kirkpatrick L, Zambrowicz B , Hansen G, Platt K, van Sligtenhorst I , Ding Z, Desai U
Received 20 February 2016
Accepted for publication 16 March 2016
Published 22 June 2016 Volume 2016:9 Pages 185—199
DOI https://doi.org/10.2147/DMSO.S106653
Checked for plagiarism Yes
Review by Single anonymous peer review
Peer reviewer comments 2
Editor who approved publication: Professor Ming-Hui Zou
David R Powell, Jason P Gay, Melinda Smith, Nathaniel Wilganowski, Angela Harris, Autumn Holland, Maricela Reyes, Laura Kirkham, Laura L Kirkpatrick, Brian Zambrowicz, Gwenn Hansen, Kenneth A Platt, Isaac van Sligtenhorst, Zhi-Ming Ding, Urvi Desai
Metabolism Research, Lexicon Pharmaceuticals, Inc., The Woodlands, TX, USA
Abstract: Delta-5 desaturase (D5D) and delta-6 desaturase (D6D), encoded by fatty acid desaturase 1 (FADS1) and FADS2 genes, respectively, are enzymes in the synthetic pathways for w3, w6, and w9 polyunsaturated fatty acids (PUFAs). Although PUFAs appear to be involved in mammalian metabolic pathways, the physiologic effect of isolated D5D deficiency on these pathways is unclear. After generating >4,650 knockouts (KOs) of independent mouse genes and analyzing them in our high-throughput phenotypic screen, we found that Fads1 KO mice were among the leanest of 3,651 chow-fed KO lines analyzed for body composition and were among the most glucose tolerant of 2,489 high-fat-diet-fed KO lines analyzed by oral glucose tolerance test. In confirmatory studies, chow- or high-fat-diet-fed Fads1 KO mice were leaner than wild-type (WT) littermates; when data from multiple cohorts of adult mice were combined, body fat was 38% and 31% lower in Fads1 male and female KO mice, respectively. Fads1 KO mice also had lower glucose and insulin excursions during oral glucose tolerance tests along with lower fasting glucose, insulin, triglyceride, and total cholesterol levels. In additional studies using a vascular injury model, Fads1 KO mice had significantly decreased femoral artery intima/media ratios consistent with a decreased inflammatory response in their arterial wall. Based on this result, we bred Fads1 KO and WT mice onto an ApoE KO background and fed them a Western diet for 14 weeks; in this atherogenic environment, aortic trees of Fads1 KO mice had 40% less atheromatous plaque compared to WT littermates. Importantly, PUFA levels measured in brain and liver phospholipid fractions of Fads1 KO mice were consistent with decreased D5D activity and normal D6D activity. The beneficial metabolic phenotype demonstrated in Fads1 KO mice suggests that selective D5D inhibitors may be useful in the treatment of human obesity, diabetes, and atherosclerotic cardiovascular disease.
Keywords: delta-5 desaturase, delta-6 desaturase, obesity, diabetes, atherosclerosis
Introduction
Polyunsaturated fatty acids (PUFAs) have multiple crucial functions in mammals.1–4 PUFAs readily undergo mitochondrial beta oxidation, making them an important energy source. They are also important structural components of cell membranes, particularly in the central nervous system; their incorporation into membrane phospholipids alters membrane fluidity and permeability which in turn can influence the activity of membrane-bound receptors, transporters, and enzymes. In addition, PUFAs can alter the activity of multiple metabolic pathways; they can act directly as ligands for a number of transcription factors that orchestrate the activity of crucial metabolic pathways, or they can regulate synthesis of secondary messengers such as inflammatory eicosanoids or endocannabinoids.
PUFAs have two or more double bonds in their long hydrocarbon chains. They are classified according to the number of carbon atoms, number of double bonds, and position of the double bond closest to the terminal methyl group. Of the four PUFA families, ω3 and ω6 families are considered the most important. The PUFA profile in mammals reflects both dietary intake and endogenous metabolism.4 The precursor of the ω3 PUFAs, α-linolenic acid, and the ω6 PUFAs, linoleic acid (LA), are essential fatty acids that cannot be synthesized by mammals.1,4 Additional PUFAs are synthesized by the activity of a series of enzymes including delta-6 desaturase (D6D), which is the first and rate-limiting enzyme in the ω3 and ω6 pathways, and delta-5 desaturase (D5D), also active in the ω3 and ω6 pathways; these two desaturases, widely expressed in mammalian liver and in other tissues, catalyze the insertion of additional double bonds into the PUFA carbon chain.1–4 D5D and D6D enzyme activities are difficult to measure directly. Alternatively, the desaturase index, calculated as the ratio of the enzyme product/enzyme substrate present in cell membranes, has been successfully used in epidemiologic studies as an indirect measure of enzyme activity.2–4 For example, using PUFAs in the ω6 pathway, D5D activity is estimated by arachidonic acid/dihomo-γ-linolenic acid (AA/DGLA) levels and D6D activity is estimated by γ-linolenic acid (GLA)/LA levels.
Considering the physiologic importance of PUFAs, it seems likely that D5D and D6D activities, by regulating PUFA levels, influence a number of pathways that regulate metabolism and inflammation. Consistent with this notion, numerous studies have linked D5D and D6D activities to multiple metabolic and inflammation-associated phenotypes including obesity,4 type 2 diabetes (T2D),3,4 nonalcoholic steatohepatitis (NASH),4 dyslipidemia,2,4 and coronary artery disease (CAD).2,4 However, it has been difficult to determine whether changes in D5D or D6D activities contribute to, or are a response to, associated changes in these phenotypes.2,4
D5D and D6D are encoded by the fatty acid desaturase 1 (FADS1) and FADS2 genes, respectively, which are located head to head on human chromosome 11q12-13.1 in a FADS gene cluster.1,5 In the mouse, these genes have a similar organization, with the homologous cluster located in the syntenic region of chromosome 19.1 We used a high-throughput approach to knockout (KO) and phenotype mouse orthologs of >4,650 potentially druggable genes present in the human genome; as part of our phenotypic screen, we performed tests designed to identify genes that might encode drug targets for a number of therapeutic areas, including obesity, diabetes, osteoporosis, and dyslipidemia.6–10 In this article, we report that Fads1 KO mice studied in our high-throughput phenotypic screen had low body fat and improved glucose tolerance relative to wild-type (WT) control mice. In addition, we present follow-up studies that not only confirm that Fads1 KO mice are lean with improved glycemic control but also show that they have decreased serum lipids and are resistant to the development of atheromatous plaque when maintained in an atherogenic environment.
Materials and methods
Generation of KO mice
ApoE KO mice were obtained from Taconic Biosciences (Hudson, NY, USA; catalog no: APOE-M). Both Fads1 KO lines were generated at Lexicon Pharmaceuticals, Inc. (The Woodlands, TX, USA) on a 129S5/SvEvBrd x C57BL/6-Tyrc-Brd hybrid background. The first Fads1 KO line was generated by gene trapping as part of our effort to knock out and phenotype mouse orthologs of nearly 5,000 druggable human genes.6–10 Methods for gene trapping in embryonic stem (ES) cells, identifying trapped genes using OmniBank Sequence Tags (OSTs), characterizing retroviral gene trap vector insertion sites, and reverse-transcription polymerase chain reaction (PCR) analysis of KO and WT transcripts are published.11 Briefly, a retroviral gene trap vector was used to produce OmniBank clone OST118368, which contains an insertion into the intron between the first and second coding exons that truncates the Fads1 gene product immediately after the first coding exon; this clone was then used to generate Fads1 KO mice (Figure S1). Mice heterozygous (HET) for this Fads1 mutation were bred to ApoE HET mice to ultimately generate Fads1 HET/ApoE KO mice; these mice were then used to generate Fads1 KO and WT mice on the ApoE KO background.
A second Fads1 KO line was generated by homologous recombination, using a conditional targeting vector derived with the lambda knockout shuttle (KOS) system12 and a strategy which is outlined in Figure S2A. The lambda KOS phage library, arrayed into 96 superpools, was screened by PCR using exon 1-specific primers Fads1-4 (5′-CTTTGCTACCCGAGAGAGGCGGAG-3′) and Fads1-5 (5′-CGGTCTCTCAGGCGCTTGCATC-3′). The PCR-positive phage superpools were plated and screened by filter hybridization using the 548 bp amplicon derived from primers Fads1-4 and Fads1-5 as a probe. One pKOS genomic clone, pKOS-86, was isolated from the library screen and confirmed by sequence and restriction analysis. Gene-specific arms (5′-CGGCGGTCTCCGGGCGCGCGCTCGAGGCAGCCCGAC-3′) and (5′-CTCAAGACTCCCAAGAACCGTCACCTGTGATCCTATGC-3′) were appended by PCR to a yeast selection cassette containing the URA3 marker. The yeast selection cassette and pKOS-86 were co-transformed into yeast, and clones that had undergone homologous recombination to replace a 2,134 bp region containing exons 1 and 2 with the yeast selection cassette were isolated. This 2,134 bp fragment was independently amplified by PCR and cloned into the intermediate vector pLF-Neo introducing flanking LoxP sites and a Neo selection cassette (Fads1-pLFNeo). The yeast cassette was subsequently replaced with the Fads1-pLFNeo selection cassette to complete the conditional Fads1 targeting vector that had exons 1 and 2 flanked by LoxP sites. The NotI-linearized targeting vector was electroporated into 129S5/SvEvBrd (Lex-2) ES cells. G418/FIAU-resistant ES cell clones were isolated, and correctly targeted clones were identified and confirmed by Southern analysis using a 253 bp 5′ external probe (1/2), generated by PCR using primers Fads1-1 (5′-GCCAGAGCAAGAGCGAAACTCCAAG-3′) and Fads1-2 (5′-GGAGACAGTAGGACGCAATCAATCG-3′), and a 309 bp 3′ internal probe (8/9), amplified by PCR using primers Fads1-8 (5′-CCAAGGATGCCAAGAACCAATGGTTG-3′) and Fads1-9 (5′-GCCTGGCTAAGGCCTTCTCACAGAC-3′). Southern analysis using probe 1/2 detected a 7.6 kb WT band and 8.9 kb mutant band in SpeI-digested genomic DNA, while probe 8/9 detected a 9 kb WT band and 11 kb mutant band in HindIII-digested genomic DNA (Figure S2B). Two targeted ES cell clones were microinjected into C57BL/6-Tyrc-Brd blastocysts. The resulting chimeras were mated to C57BL/6-Tyrc-Brd females to generate Fads1 HET mice, which were then bred to generate Fads1 KO and WT mice. For all KO lines, genotyping was performed on tail DNA as described earlier.11
Mouse care and study
All studies were performed in strict accordance with the recommendations in the Guide for the Care and Use of Laboratory Animals of the National Institutes of Health. The protocols for all studies were approved by the Lexicon Institutional Animal Care and Use Committee (OLAW Assurance Number, A4152-01; AAALAC International Accreditation Number, 001025). General methods for mouse care have been described.11 Mice were fed with a standard rodent chow that has 22% kcal from fat and contains 0.02% (w/w) AA (9F 5020; Purina, St Louis, MO, USA), high-fat diet (HFD) that has 45% kcal from fat and contains 0.06% (w/w) AA (45% HFD; D12451; Research Diets, New Brunswick, NJ, USA), HFD that has 60% kcal from fat and contains 0.09% (w/w) AA (60% HFD; D12492, Research Diets), or Western diet that has 41% kcal from fat and contains no AA (D12079B; Research Diets). Food intake studies were performed as described earlier.13
Body composition determinations
Body composition was measured using either dual-energy X-ray absorptiometry (DEXA; PIXImus; Inside Outside Sales, Fitchburg, WI, USA) or quantitative magnetic resonance (QMR; Echo Medical Systems, Houston, TX, USA) technologies as described earlier.9,13 For our phenotypic screen performed on chow-fed mice at 14 weeks of age, body fat was analyzed by DEXA and data are presented as described earlier.9 For our phenotypic screen performed on 45% HFD-fed male mice at 11 weeks of age, body fat was analyzed by QMR and data are presented as described earlier.9,13 For studies quantitating the amount of liver fat, individual livers were harvested at necropsy and analyzed for fat content by QMR.
Measurements of physical activity
Fads1 KO and WT mice were studied in an open-field chamber as described earlier.14,15 An independent cohort of mice was also studied in a second system that measures physical activity, the ER-4000 physiological measurement system (Mini Mitter, Bend, OR, USA) as described earlier.14
Blood and stool sample analysis
Blood was obtained from mice by retro-orbital bleed, and serum was assayed for fasting total cholesterol and total triglycerides (TG) by Cobas Integra 400 analyzer (Hoffman-La Roche Ltd., Basel, Switzerland) as described earlier.14 To test for malabsorption, stools were collected from Fads1 KO and WT mice and analyzed as described earlier.14
Oral glucose tolerance tests
Oral glucose tolerance tests (OGTTs) were performed on conscious unanesthetized mice as described earlier.14 In addition, as part of our phenotypic screen, we performed OGTTs on 10-week-old male KO and WT mice fed 45% HFD from weaning, as described earlier.13
Vascular injury model
Vascular cuff construction
Silicone vascular cuffs were constructed using Silastic MDX4-4210 Biomedical Grade Elastomer (Dow Corning Corporation, Midland, MI, USA) and sufficient copper powder (product #42623; Alfa Aesar, Ward Hill, MA, USA) to achieve a final concentration of 300 mg/mL. The cuff mold was prepared by placing 17 mm of the smallest end of a transfer pipette (Samco transfer pipettes, product # 212; Thermo Fisher Scientific, Waltham, MA, USA) onto a 26 G needle; the copper/elastomer mixture was then introduced through an 18 G needle into the pipette/needle mold. This was followed by curing the mixture overnight at 75°C, allowing the cuff to cool at room temperature for 30 minutes, harvesting the cuff from the mold, and then trimming it to a length of ~1 mm. Freshly made cuffs were briefly stored in a small Petri dish in 70% ethanol until they were introduced into mice.
Vascular injury model protocol
Vascular injury surgery was performed on 12–16-week-old Fads1 KO and WT mice. Mice were anesthetized by 2% isoflurane/oxygen, their left femoral artery was exposed, a vascular cuff was placed around the artery, and the mice were then allowed to recover. On postsurgery day 16, mice were again anesthetized, their chest cavity was opened, and they were perfused first with 15 mL saline and then with 15 mL neutral buffered formalin. The left femoral artery of each mouse was then dissected to expose the cuff. After removal of the cuff, the arterial fragment was placed into formalin overnight and then processed for histologic analysis, including routine hematoxylin and eosin staining, as described earlier.13 After serial sections of each artery were reviewed to identify those where the section represented a clean cut through the entire length of the artery, a picture was taken of the optimal section, and this picture was analyzed to determine the medial and intimal areas present, using Image-Pro software (Media Cybernetics, Rockville, MD, USA).
Aortic plaque measurement
Male and female Fads1 KO and WT littermate mice bred onto an ApoE KO background were switched from chow to Western diet at weaning. After 4 weeks, 8 weeks, and 12 weeks on Western diet, mice had fasting blood samples obtained for the analysis of total cholesterol and total TG. In addition, mice were weighed on the day of each bleed. Mice underwent necropsy after 14 weeks on Western diet; at this time, the aortic tree of each mouse was collected and stained with Sudan IV to identify areas of plaque. The percent of the aortic surface that stained for plaque was then quantified using Image-Pro software.
Quantitative measurement of fatty acid levels
Brain and liver samples obtained from 44-week-old male Fads1 KO, HET, and WT mice (2/genotype) were analyzed in the Lipomics TrueMass panel (Lipomics Technologies, Sacramento, CA, USA). Briefly, lipids from brain or liver samples were extracted in chloroform:methanol in the presence of internal standards. After neutral and polar lipids were separated by solid phase chromatography, the polar lipid fraction was separated into individual lipid classes by HPLC. Individual phospholipid class fractions (cardiolipin, phosphatidylserine, phosphatidylethanolamine, phosphatidylcholine, and lysophosphatidylcholine) were collected, trans-esterified in sulfuric acid/methanol to create fatty acid methyl esters, extracted into hexane, and then prepared for gas chromatography. Individual fatty acids from each of the five phospholipid samples were separated by capillary gas chromatography and quantified by comparing the peak area to that of the internal standard.
Statistics
Data are presented as mean ± standard deviation (SD). Unless stated otherwise, comparisons between two groups were analyzed by unpaired Student’s t-test and comparisons among three or more groups were analyzed by one-way analysis of variance (ANOVA) with post hoc analysis performed using the Bonferroni correction. All statistical tests were performed using PRISM 4.03 (GraphPad Software, Inc., La Jolla, CA, USA). Differences were considered statistically significant when P<0.05.
Results
Fads1 KO mice generated by a gene-trapping strategy (Figure S1) were lean relative to WT littermates in our previously reported high-throughput phenotypic screen of 3,651 KO lines maintained on chow diet13 (Figure 1A). These Fads1 mice had a normal Mendelian distribution at weaning (561 WT, 1,105 HET, and 543 KO mice) and appeared healthy. To confirm the lean phenotype observed during this screen, a cohort of 8–20-week-old chow-fed male Fads1 KO mice was studied and they were found to have decreased body weight and body fat relative to WT littermates (Figure 2A and B; Table S1). In addition, cohorts of 8–32-week-old male and female Fads1 KO mice fed 45% HFD had decreased body weight and body fat relative to WT littermates (Figure 2C and D; Table S1). Interestingly, when data were combined from all male and female mouse cohorts studied just after weaning at 4 weeks of age, Fads1 KO mice did not have the body fat phenotype that was apparent at 8 weeks of age; their body fat at 4 weeks was 2.3±0.6 g (n=95), identical to the 2.3±0.5 g (n=87) value of their WT littermates. In contrast, when data were combined from all mouse cohorts studied at 15–22 weeks of age, body weight and body fat were significantly decreased by 16% and 38%, respectively, in male Fads1 KO mice; data from all female mice showed a similar result, with body weight and body fat significantly decreased by 12% and 31%, respectively, in female Fads1 KO mice (Figure 3A–D; Tables S1 and S2). The Fads1 KO had less of an effect on lean body mass (LBM) at 16–22 weeks of age; male and female Fads1 KO mice showed a 7% and 2% decrease, respectively, in LBM when compared to that of WT littermates (Figure 3E and F; Tables S1 and S2). A subset of these mouse cohorts included HET mice, which were found to have significantly more body fat than KO littermates but no difference in body fat when compared to WT littermates (Figure 3G; Table S2). To confirm these findings from the Fads1 KO line generated by gene trapping, a second Fads1 KO line was generated by homologous recombination (Figure S2). These Fads1 KO mice were lean relative to WT littermates in our previously reported high-throughput phenotypic screen of 2,463 KO lines maintained on 45% HFD13 (Figure 1B), and additional cohorts showed the same body composition phenotype observed in the Fads1 KO line generated by gene trapping (Table S3); these Fads1 KO mice also had a normal Mendelian distribution at weaning (165 WT, 332 HET, and 163 KO mice) and appeared healthy. In both Fads1 KO lines, the low body fat phenotype persisted with age and was present in mice aged >1 year (Table S4). Consistent with the finding that Fads1 KO mice had relatively normal LBM, organ weights from 71-week-old male gene trap Fads1 KO mice fed 45% HFD from weaning were not different from those of WT littermates, with the exceptions that Fads1 KO mice had significantly lower liver and heart weights (Table 1). The lower liver weight of Fads1 KO mice, confirmed in two additional cohorts of 45% HFD-fed male mice, suggested the possibility of less liver fat. This hypothesis was supported by QMR analysis of livers from one of these cohorts, which showed 73% less fat in the livers of Fads1 KO mice compared to those of WT littermates (Figure 3H); in the other cohort, the lower liver weights found in the male Fads1 KO mice were accompanied by lower serum levels of the liver enzymes alanine and aspartate aminotransferase (Table S5).
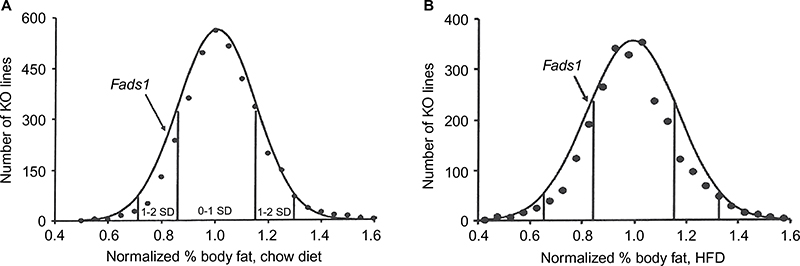 | Figure 1 Fads1 KO mice have low body fat in high-throughput phenotypic screens. Notes: (A) Histogram of normalized % body fat for 3,651 KO lines maintained on chow diet. Body composition analyses performed by DEXA on 14-week-old male mice fed chow diet from weaning were used to calculate normalized % body fat for each KO line. Solid points indicate actual numbers of KO lines. Curved line shows the calculated curve; the range for 1 and 2 SD from the mean are indicated by lines located below the curve, and the mean value for the two Fads1 KO mouse lines is indicated by an arrow shown above the curve. (B) Histogram of normalized % body fat for 2,463 KO lines maintained on 45% HFD. Body composition analyses performed by QMR on 11-week-old male mice fed 45% HFD from weaning were used to calculate normalized % body fat for each KO line. Solid points indicate actual numbers of KO lines. Curved line shows the calculated curve; the range for 1 and 2 SD from the mean are indicated by lines located below the curve, and the value for the Fads1 KO mouse line generated by homologous recombination is indicated by an arrow shown above the curve. Abbreviations: DEXA, dual-energy X-ray absorptiometry; HFD, high-fat diet; KO, knockout; QMR, quantitative magnetic resonance; SD, standard deviation. |
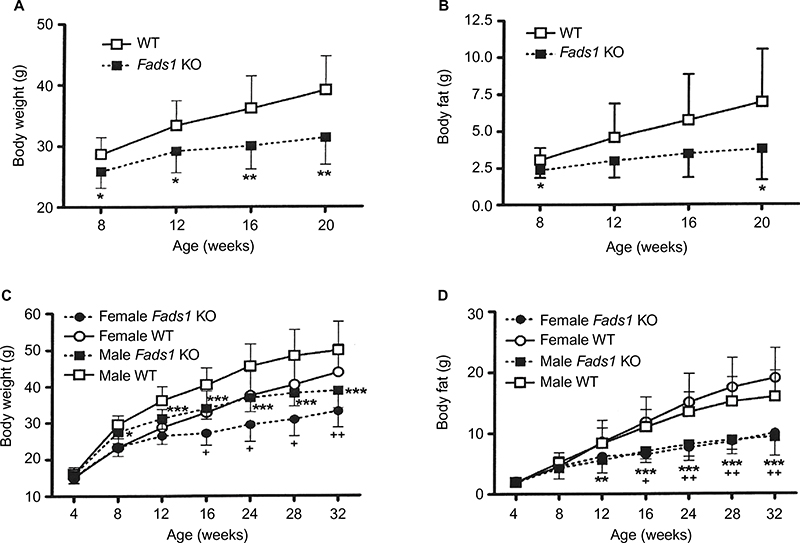 | Figure 2 Fads1 KO mice have low body weight and body fat: time course data. Notes: Male Fads1 KO mice (n=11) and their WT littermates (n=11), fed chow diet from weaning, were studied from 8 weeks to 20 weeks of age for (A) body weight and (B) body fat measured by QMR. Fads1 KO mice (n=15 males and seven females) and their WT littermates (n=17 males and seven females), fed 45% HFD from weaning, were studied from 4 weeks to 32 weeks of age for (C) body weight and (D) body fat measured by QMR. Male KO mice different from WT mice of the same age and sex, *P<0.05, **P<0.01, ***P<0.001; female KO mice different from WT mice of the same age and sex, +P<0.05, ++P<0.01. Abbreviations: HFD, high-fat diet; KO, knockout; QMR, quantitative magnetic resonance; WT, wild type. |
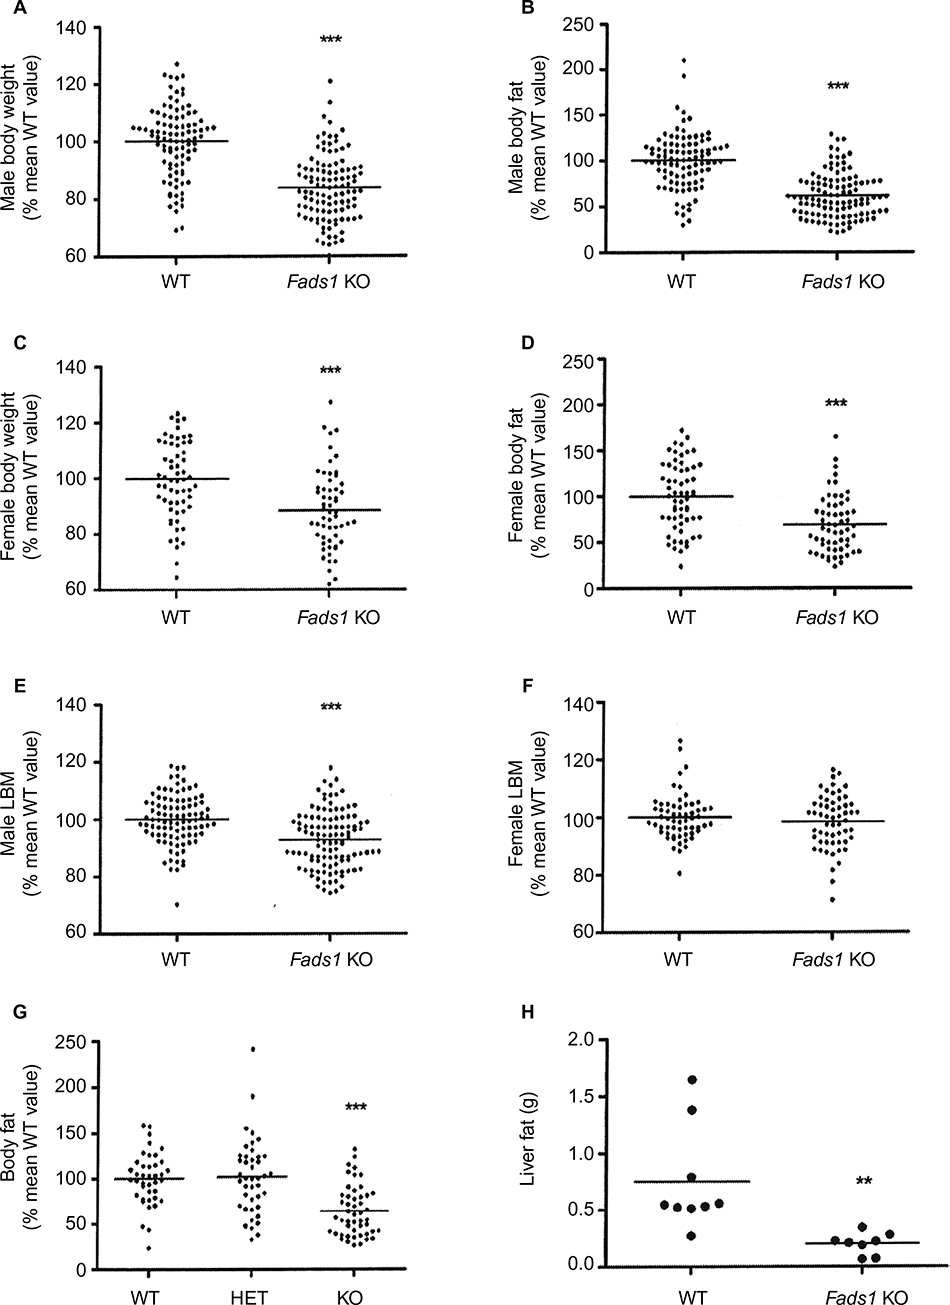 | Figure 3 Fads1 KO mice have low body weight and body fat. Notes: Body weight, body fat, and LBM data were normalized and combined from all mouse cohorts that were weighed and analyzed by QMR at 16–22 weeks of age: (A) body weight and (B) body fat data for male Fads1 KO mice (n=109) and their WT littermates (n=95); (C) body weight and (D) body fat data for female Fads1 KO mice (n=58) and their WT littermates (n=60); LBM data for the (E) male and (F) female Fads1 KO mice and their WT littermates that were studied in panels A–D. For panels A–F: KO mice different from WT mice, ***P<0.001. (G) Normalized body fat data from the subset of cohorts that had Fads 1 KO (n=49), HET (n=42), and WT (n=40) littermate mice; because normalized data from male and female mice were comparable, they were combined in this analysis. KO mice different from HET and WT mice, ***P<0.001. (H) Liver fat measured by QMR in 75-week-old male Fads1 KO mice (n=8) and their WT littermates (n=9); KO mice different from WT mice, **P<0.01. Abbreviations: HET, heterozygous; KO, knockout; LBM, lean body mass; QMR, quantitative magnetic resonance; WT, wild type. |
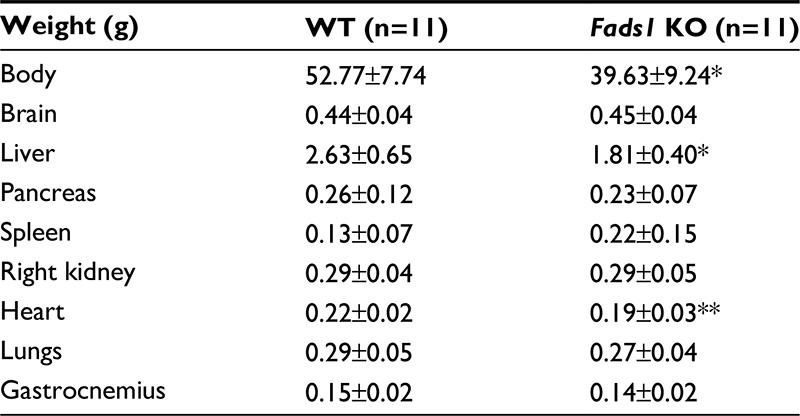 | Table 1 Body and organ weights of 71-week-old Fads1 KO and WT littermate mice fed 45% HFD from weaning Notes: n, number of mice. KO mice different from WT mice, *P<0.05, **P<0.01. Abbreviations: HFD, high-fat diet; KO, knockout; WT, wild type. |
We sought to identify the mechanism behind the low body fat phenotype of Fads1 KO mice. A 19-day food intake study, initiated in 4-week-old group-housed male Fads1 KO and WT mice when their body weights did not differ, showed no difference in food intake. These same group-housed mice underwent a 14-day food intake study starting at 66 weeks of age when the KO mice had significantly lower body weights, and again no difference in food intake was noted (Figure S3A and B). To investigate the possibility that a significant difference in food intake between Fads1 KO and WT littermate mice might best be observed at the time that the body fat phenotype was developing, we monitored a cohort of group-housed mice and found that, similar to other cohorts, Fads1 KO mice had significantly less body fat at 8 weeks of age but not at 4 weeks of age (Figure 4A). The food intake of these mice was studied for 21 days beginning at 8 weeks of age, and no significant difference in food intake was found (Figure 4B). Fecal weight and fecal fat were also measured as part of this study, and no differences were noted between Fads1 KO and WT mice (Figure 4C and D). An additional cohort of 40-week-old mice was studied for 9 days, with Fads1 KO mice again exhibiting normal food intake without evidence of malabsorption (data not shown). Two independent cohorts of Fads1 KO and WT mice also showed no significant difference in activity at 11 weeks of age in an open-field chamber (Figure S3C) or at 65 weeks of age using a different technology that measured activity over a full 24 hours (Figure S3D). Finally, Fads1 KO mice and their WT littermates exhibited similar changes in their body temperatures when they were housed for an hour at 4°C (Figure S3E–G).
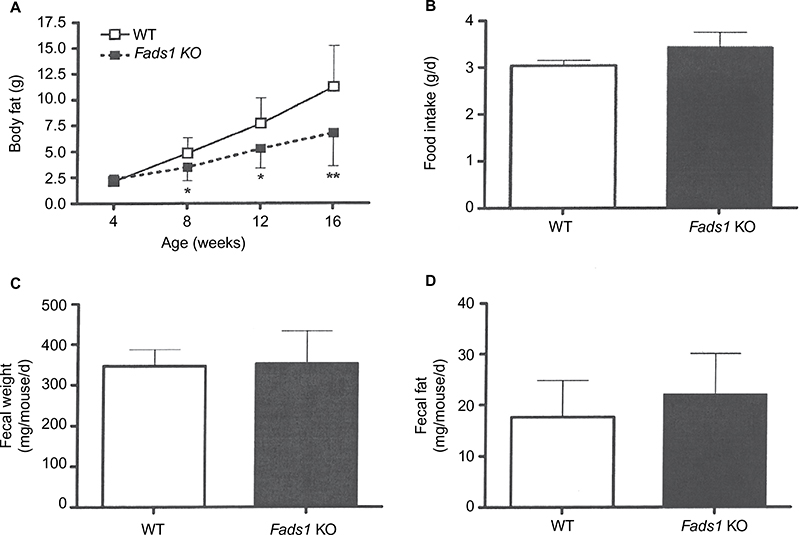 | Figure 4 Effect of Fads1 KO on food intake, fecal weight, and fecal fat. Notes: (A) Time course of body fat measurements in group-housed male Fads1 KO mice (n=15) and their WT littermates (n=8). KO mice different from WT mice, *P<0.05, **P<0.01. At 8 weeks of age, these group-housed mice (two to three mice per cage, three to four cages per genotype) were studied for (B) intake of 45% HFD, (C) fecal weight, and (D) fecal fat. Abbreviations: HFD, high-fat diet; KO, knockout; WT, wild type; d, day. |
We evaluated the effect of Fads1 deficiency on metabolic parameters. We found that male Fads1 KO mice had a lower glucose area under the curve relative to WT mice in our previously reported high-throughput OGTT phenotypic screen of 2,489 KO lines maintained on 45% HFD11 (Figure 5A). The decreased OGTT glucose excursions observed on phenotypic screening of Fads1 KO mice were confirmed with multiple additional cohorts of male Fads1 KO mice and their WT littermates from both KO lines, and they were also found to have fasting blood glucose levels that were significantly lower than WT levels (Figure 5B; data not shown). In addition, Fads1 KO mice had fasting insulin levels, and insulin levels measured 30 minutes after glucose challenge, that were significantly lower than WT levels (Figure 5C); thus, less insulin was required to achieve improved postprandial glucose excursions in these nondiabetic mice. Further studies showed that fasting total cholesterol and TG levels tended to be numerically lower in multiple cohorts of Fads1 KO mice fed 45% HFD (Table S5); when data were normalized such that mean WT values for each male and female cohort were assigned a value of 100%, and all data were then combined, total cholesterol and TG levels were significantly lower in Fads1 KO mice, measuring 74% and 84% of WT littermate values, respectively (Figure 5D).
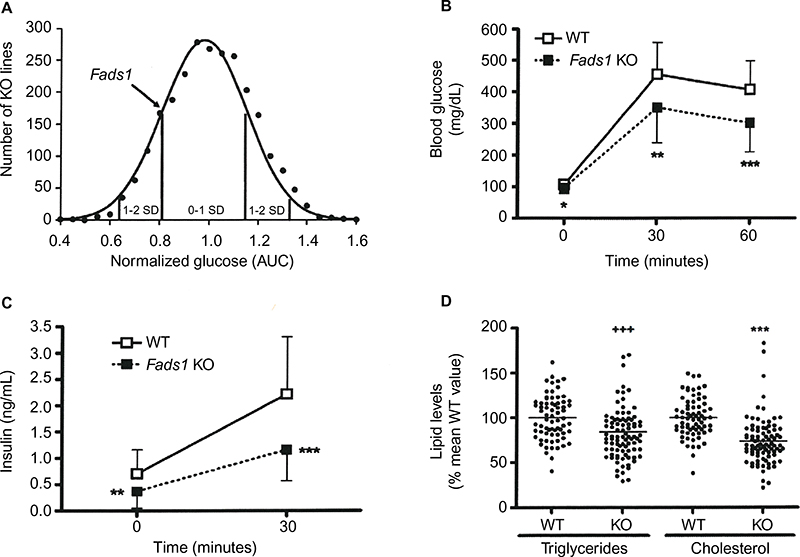 | Figure 5 Improved OGTT and fasting serum lipid measurements in Fads1 KO mice. Notes: (A) Histogram of normalized glucose AUC values from OGTTs performed on 10-week-old male mice from 2,489 KO lines maintained on 45% HFD from weaning. Solid points indicate actual numbers of KO lines. Curved line shows the calculated curve; the range for 1 and 2 SD from the mean are indicated by lines located below the curve, and the values for Fads1 KO mice are indicated by an arrow shown above the curve. (B) Glucose excursions, and (C) 0-minute and 30-minute insulin levels, from OGTTs performed on 45% HFD-fed male Fads1 KO mice (n=26) and their WT littermates (n=21) at 12–17 weeks of age. (D) Normalized total cholesterol and TG data from 30-to-46-week-old Fads1 KO mice (n=89) and their WT littermates (n=70). KO mice different from WT mice, *P<0.05, **P<0.01, ***P<0.001 by Student’s t-test, and +++P<0.001 by Mann–Whitney test. Abbreviations: AUC, area under the curve; OGTT, oral glucose tolerance test; HFD, high-fat diet; KO, knockout; TG, triglyceride; WT, wild type; SD, standard deviation. |
We used a vascular injury model to measure the effect of an inflammatory stimulus on the arterial intima of Fads1 KO and WT littermate mice. We found significant decreases of 62% and 57% in the femoral artery intima/media ratio of Fads1 KO mice relative to WT littermates in two independent cohorts of mice using this vascular injury model (Figure 6A and B, respectively). Because of this result and the tendency of Fads1 KO mice to have lower lipid levels, we then bred Fads1 KO and WT mice onto an ApoE KO background and fed these mice Western diet for 14 weeks in an attempt to create an atherogenic environment. We found that, on the ApoE KO background, Fads1 KO mice had significantly lower body weight than WT mice, but we did not observe significant differences in fasting levels of either total cholesterol or TG in Fads1 KO mice relative to WT littermates during this study (Figure 6C; Table S6). Nevertheless, the aortic tree of the Fads1 KO mice was found to have a significant 40% decrease in plaque relative to that observed in WT littermates (Figure 6D–F).
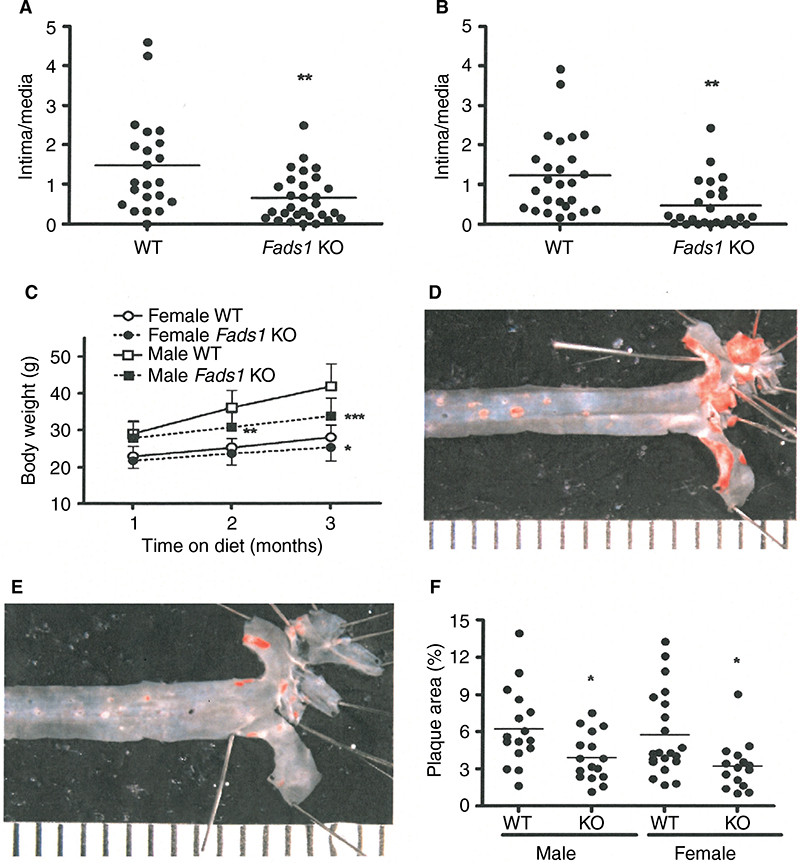 | Figure 6 Fads1 KO mice are less susceptible to vascular injury and, when exposed to an atherogenic environment, exhibit less aortic plaque. Notes: (A) The left femoral artery of 18-week-old, chow-fed male and female Fads1 KO mice (n=29) and their WT littermates (n=22) was exposed to a cuff containing copper, which served as a chemical irritant. After 16 days, this artery was harvested from each mouse and the thickness of the arterial wall intima and media was used to calculate an intima/media ratio. (B) An independent cohort of 18–20-week-old, chow-fed male and female Fads1 KO mice (n=25) and their WT littermates (n=26) was studied using the same vascular injury model described in (A). (C) Male Fads1 KO (n=16) and WT (n=17) mice, and female Fads1 KO (n=15) and WT (n=21) mice, all on an ApoE KO background, were fed Western diet from weaning and had their body weight measured after 4 weeks, 8 weeks, and 12 weeks on Western diet. After 14 weeks on Western diet, the mice presented in (C) had their aortic trees collected and stained for plaque; representative images of Sudan IV-stained (D) WT and (E) KO aortic trees are each positioned beside a ruler that is divided into 1 mm increments. (F) The percentage of aortic surface that stained for plaque was quantified for all mice presented in (C). KO mice different from WT mice, *P<0.05, **P<0.01, ***P<0.001. Abbreviations: KO, knockout; WT, wild type. |
To determine the effects of D5D inhibition on ω6 fatty acid levels in the ω6 fatty acid pathway (Figure 7A), we studied levels of these fatty acids in brain and liver tissue from Fads1 KO, HET, and WT littermate mice fed 45% HFD from weaning. As can be seen in Figure 7B and C, levels of the D5D substrate DGLA were markedly increased, while levels of the D5D product AA were markedly decreased, in brain phospholipids from Fads1 KO mice relative to WT littermate values, while DGLA and AA levels were quite similar in brain phospholipids from Fads1 HET and WT mice. Similar results were observed when ω6 fatty acid levels were measured in liver phospholipid fractions (Figure 7D and E). In brain, KO mice exhibited a markedly decreased AA/DGLA ratio (0.23±0.02) relative to HET (10.7±1.87) and WT (17.73±3.7) littermates, and in liver, KO mice also exhibited a markedly decreased AA/DGLA ratio (0.55±0.04) relative to HET (6.4±0.47) and WT (9.86±1.06) littermates; these findings suggest that D5D activity is markedly decreased in Fads1 KO mice. In contrast, levels of the D6D substrate LA were similar, while levels of the D6D product GLA were slightly increased, in brain and liver phospholipids from Fads1 KO mice relative to WT and HET littermate values; the resulting GLA/LA ratios present in Fads1 KO mice were consistent with normal D6D activity. Similar results were noted when ω3 fatty acid levels in the ω3 fatty acid pathway were examined (Figure S4). In this analysis, levels of the D5D substrate eicosatetraenoic acid were markedly increased and levels of the D5D product eicosapentaenoic acid (EPA) were markedly decreased in brain and liver phospholipids from Fads1 KO mice relative to WT littermate values, while eicosatetraenoic acid and EPA levels were quite similar in brain and liver phospholipids from Fads1 HET and WT mice, suggesting markedly decreased D5D activity in Fads1 KO mice.
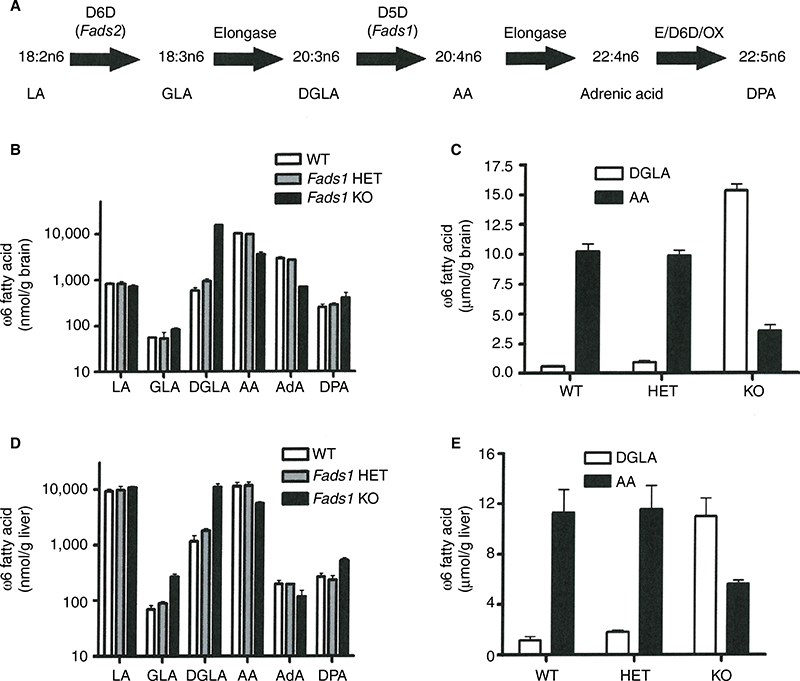 | Figure 7 Levels of ω6 fatty acids present in phospholipids isolated from brain and liver of Fads1 KO, HET, and WT mice. Notes: Individual ω6 fatty acids were quantitated in five phospholipid fractions (cardiolipin, phosphatidylserine, phosphatidylethanolamine, phosphatidylcholine, and lysophosphatidylcholine) isolated from brain and liver samples of 44-week-old Fads1 KO (n=2), HET (n=2), and WT (n=2) littermate mice; data from the five phospholipid fractions were then combined to yield a single pooled value for each individual ω6 fatty acid in brain or liver tissue of each mouse. (A) Enzymes and fatty acids that comprise the ω6 fatty acid pathway. (B) Brain levels of ω6 fatty acids along the ω6 fatty acid pathway. (C) Brain levels of DGLA and AA, the substrate and product, respectively, of Fads1. (D) Liver levels of ω6 fatty acids along the ω6 fatty acid pathway. (E) Liver levels of DGLA and AA. All data are presented as nanomole of ω6 fatty acid present in the five phospholipid fractions isolated from 1 g of tissue. Abbreviations: AA, arachidonic acid; AdA, adrenic acid; DGLA, dihomo-γ-linolenic acid; DPA, n6 docosapentaenoic acid; D5D, delta-5 desaturase; D6D, delta-6 desaturase; E, elongase; Fads1, fatty acid desaturase 1; Fads2, fatty acid desaturase 2; GLA, γ-linolenic acid; HET, heterozygous; KO, knockout; LA, linoleic acid; OX, peroxisomal oxidation; WT, wild type. |
Discussion
Fads1 KO mice had low body fat in our primary phenotypic screen of 3,651 KO lines fed chow diet and 2,463 KO lines fed 45% HFD, and these findings were confirmed by studying multiple additional cohorts of Fads1 KO mice generated by two independent KO strategies. In humans, D5D and D6D have been linked to body fat stores in many studies.16–23 Most of these studies, which measured desaturase activity either directly in liver tissue or indirectly using desaturase ratios obtained from analyzing various lipid fractions, found that an increase in various surrogate measures of obesity, or in liver fat, was associated with a decrease in D5D activity and an increase in D6D activity. However, these studies were unable to determine whether the changes in desaturase activity contributed to, or were a response to, the changes in body fat, or if the desaturase activities might be confounded by another variable such as diet.16–22 One way around this problem is to study markers such as single-nucleotide polymorphisms located within or close to the gene of interest in an attempt to uncover a genetic predisposition for a change in D5D activity. Indeed, there is strong evidence in humans that single-nucleotide polymorphisms near FADS1 are associated with higher levels of LA and lower levels of AA, and this association has been found in European, Asian, Hispanic, and African populations; unfortunately, there is strong linkage disequilibrium in this region that includes the FADS1 gene and much of the FADS2 gene, and studies suggest that the alleles associated with lower AA/LA are also associated with lower activity of both D5D and D6D.24,25 In a recent study, these alleles were not associated with obesity in a European population,23 which could merely reflect offsetting effects of lower D5D and D6D activities. Interestingly, in the Greenland Inuit population, who eat a diet rich in ω3 PUFAs, these same alleles have been strongly selected and are associated with a significant decrease in body weight and body mass index.23 This suggests that the Inuit diet may have played a major role in the selection of alleles with lower desaturase activities, but again it is unclear whether lower D5D activity contributes to the lower weight observed in the Inuit population.23
Fads1 KO mice had a low glucose area under the curve in our high-throughput OGTT phenotypic screen of 2,489 KO lines fed 45% HFD. Additional cohorts of mice confirmed this finding and in addition demonstrated that Fads1 KO mice had lower fasting glucose, fasting insulin, and fed insulin levels relative to WT littermates. In humans, desaturase ratios and liver desaturase activities have linked D5D and D6D activities to a number of glycemic traits and to T2D in cross-sectional studies16,17,19–22 and to T2D in longitudinal studies.26–29 These data showed that an increase in T2D, and/or in glycemic traits found in patients with T2D, was consistently associated with decreased D5D activity and increased D6D activity. Unfortunately, similar to the problem with relating desaturase activities to surrogate measures of obesity, these studies were unable to determine whether changes in desaturase activity influenced the development of T2D. Additional studies that examined FADS alleles that exhibit low D5D and D6D activities revealed either weak or absent association of these alleles with improved glycemic traits or lower risk of T2D.23,29–33
Our studies show that, on an atherogenic ApoE background and Western diet, Fads1 KO mice develop significantly less aortic plaque than WT littermates. Decreased serum total cholesterol and TG might contribute to fewer atheromatous lesions, at least in humans,34 and we did observe modestly lower levels of these serum lipids in many cohorts of Fads1 KO mice. However, our Fads1 KO mice with less aortic plaque did not have lower levels of these lipids. In humans, FADS allelic variants and desaturase activities have been linked to changes in serum lipid levels; although these changes were considered unlikely to influence cardiovascular outcomes, the independent role of D5D was again difficult to assess.4,19,34–37 Decreased plaque formation could also be related to a decreased arterial wall inflammatory response,38,39 a possibility supported by our use of a vascular injury model to show that a localized inflammatory stimulus in vivo resulted in less of an inflammatory response in the arterial wall of Fads1 KO mice. The lower AA levels and AA/LA in tissue phospholipids of our D5D KO mice may contribute to this protective effect, because AA is the precursor of a number of pro-inflammatory molecules that are likely to contribute to the atherosclerotic process.40–42 In humans, FADS alleles associated with decreased AA/LA are also associated with decreased production of pro-inflammatory eicosanoids in vitro, and with lower levels of non-enzymatic oxidative products of AA that serve as biomarkers for increased CAD risk.43–45 These findings are consistent with the observation that FADS alleles associated with decreased AA/LA are also associated with decreased risk of CAD and lower C-reactive protein levels.42,46,47 Unfortunately, these alleles do not separate the effects of D5D and D6D, and not all studies are in agreement, as a separate study that measured desaturase activities found that increased D5D, but not AA levels, prospectively predicted lower cardiovascular mortality.48
The problem with the human studies discussed earlier is that they do not clearly delineate the metabolic response to an isolated decrease in D5D activity. Our KO is specific for Fads1 and D5D; the GLA/LA and ratios were consistent with normal D6D activity, thus separating these results from FADS cluster alleles where D5D and D6D activities are always linked in the same direction and from many studies of metabolic traits where D5D activity is inversely correlated with D6D activity. In addition, there are many examples where mouse gene KOs closely model the physiology present in humans with a genetic or drug-induced deficiency of the protein product of the same gene,7,9–11,13,14,49–54 suggesting that the favorable metabolic phenotype observed in Fads1 KO mice might also be present in humans with an isolated decrease in D5D activity. The phenotype of cannabinoid receptor 1 (Cnr1) KO mice is relevant to this discussion for two reasons. First, these KO mice are lean with improved glycemic control and lower circulating total cholesterol and TG levels, a phenotype that is reproduced in mice and humans treated with the CNR1 inverse agonist rimonabant.14 Second, the phenotype of Cnr1 KO mice has some similarity to the phenotype of Fads1 KO mice, possibly because the two enzymes participate in the same metabolic pathway. Recent work shows that mice lacking diacylglycerol lipase α (DAGLA), an enzyme that uses AA as a substrate to synthesize the endocannabinoid 2-arachidonoyl glycerol (2-AG), have the same phenotype as Cnr1 KO mice; this suggests that DAGLA provides the 2-AG needed to signal through CNR1 to counteract the shared metabolic phenotype of Cnr1 and Dagla KO mice.14 It is conceivable that the markedly lower AA levels present in Fads1 KO mice may limit the production of 2-AG by DAGLA, resulting in decreased signaling through CNR1. The possibility that the Fads1 KO metabolic phenotype might result, at least in part, from a decrease in 2-AG formation is an interesting hypothesis that will require further study because 2-AG levels have not been measured in Fads1 KO mice.
An independent Fads1 KO line has been reported.55 These KO mice, fed an AA-free diet from weaning, appeared healthy up to the time of their sudden death at 6–12 weeks of age; there were no pathology findings at necropsy that could explain their early death. These KO mice exhibited markedly decreased AA/DGLA ratios relative to their WT and HET littermates, similar to what we observed in our KO mice, and they also exhibited a marked decrease in AA-derived eicosanoids. These KO mice were not rescued by diets containing 0.1% or 0.4% (w/w) AA, but their survival was comparable to that of WT and HET mice when fed a diet containing 2% (w/w) AA; no additional data were reported on the KO mice fed the high AA diet. Interestingly, we saw no obvious decrease in the survival of our gene trap Fads1 KO mice fed 45% HFD containing 0.06% (w/w) AA for more than 1 year, and they also appeared healthy and steadily gained weight when placed on an AA-free Western diet for 14 weeks. Based on the survival data from Fan et al,55 our results strongly suggest that our gene trap Fads1 KO mice are hypomorphs56 that retain the residual D5D activity necessary for long-term survival on an AA-deficient diet. Nevertheless, these gene trap KO mice exhibit significantly decreased D5D activity, as demonstrated by their markedly decreased AA/DGLA ratios.2–4 Because they exhibit this significant decrease in D5D activity, these Fads1 KO mice are an excellent mammalian model for predicting the long-term, on-target metabolic effects of potent and selective D5D inhibitors, and all studies reported here were performed to take advantage of this predictive model before embarking on a drug discovery program.
Although our Fads1 KO mice had an intermediate decrease in body fat when compared to other KO lines we have studied,9 the accompanying improvements in glycemic control, lipid levels, and atheromatous plaque development suggested that D5D inhibitors might be of particular therapeutic value because they may target multiple metabolic abnormalities. However, a number of potential problems may impact the development of D5D inhibitors for these metabolic indications. 1) D5D inhibition will have pleiotropic effects due to altered levels of many ω3, ω6, and ω9 pathway PUFAs and their metabolites; thus, understanding of potentially undesirable on-target effects is needed. For example, brain levels of the ω3 PUFA docosahexaenoic acid are 32% lower in our Fads1 KO mice, and levels of the ω3 PUFA EPA are even lower than this, which may be a problem considering the evidence that these PUFAs are neuroprotective.57 2) Varying the dietary intake of AA and other PUFAs may alter the efficacy and safety of D5D inhibitors. 3) The role of the endocannabinoid system in mediating the metabolic effects of D5D inhibition must be explored; in particular, the possibility that neuropsychiatric side effects are an on-target response to D5D inhibition must be assessed.14 4) D5D inhibitors may not reproduce the metabolic phenotype observed in Fads1 KO mice. Recently, a dual D5D/D6D inhibitor was shown to decrease oleic acid-induced TG accumulation in cultured hepatocytes; this was consistent with findings of increased liver D5D mRNA in humans with NASH, and increased liver D5D mRNA, protein, and AA/DGLA ratio in mice with NASH.58 More importantly, orally available and highly selective D5D inhibitors are being developed for metabolic indications, and recent data suggest that some of these compounds can decrease atheromatous plaque formation and body weight while improving glycemic control in mice.59,60 5) D5D inhibitors may not provide the same metabolic benefits in humans as they do in Fads1 KO mice. This possibility is suggested by many publications showing that increased rather than decreased D5D activity is associated with a desirable metabolic profile in humans.16–22,26–29,48 We believe there is a good chance that humans and mice with D5D deficiency will exhibit the same metabolic phenotype; in our experience, the metabolic phenotype found in a mouse gene KO line is often reproduced in humans with a genetic or drug-induced decrease in the activity of the protein product of that gene.7,9–11,13,14,49–54
Conclusion
We find that Fads1 KO mice have low body fat, improved glycemic control, and decreased circulating lipid levels, and that they are resistant to the development of arterial atheromatous plaque. We predict that, in mice and humans, selective D5D inhibitors will reproduce some or all components of the metabolic phenotypes observed in Fads1 KO mice. We also emphasize the need for in-depth preclinical and clinical studies exploring whether D5D inhibitors can provide these metabolic benefits in the absence of additional undesirable on-target effects in individuals maintained on diets containing a wide range of PUFAs.
Acknowledgments
The authors wish to thank Kristi Boehm, MS, ELS, for her help in preparing the figures and tables. This work was presented in part at the 98th Annual Meeting of the Endocrine Society, April 1–4, 2016 in Boston, MA, USA.
Author contributions
DRP, MS, BZ, GH, KP, IS, ZMD, and UD made substantial contributions to the conception or design of the work. All authors contributed toward data analysis, drafting and critically revising the paper and agree to be accountable for all aspects of the work in ensuring that questions related to the accuracy or integrity of any part of the work are appropriately investigated and resolved.
Disclosure
All authors were employed by Lexicon Pharmaceuticals, Inc. at the time these studies were performed and received compensation in the form of salary and stock options. The authors report no other conflicts of interest in this work.
References
Nakamura MT, Nara TY. Structure, function, and dietary regulation of delta6, delta5, and delta9 desaturases. Annu Rev Nutr. 2004;24:345–376. | ||
Merino DM, Ma DW, Mutch DM. Genetic variation in lipid desaturases and its impact on the development of human disease. Lipids Health Dis. 2010;9:63. | ||
Kröger J, Schulze MB. Recent insights into the relation of Δ5 desaturase and Δ6 desaturase activity to the development of type 2 diabetes. Curr Opin Lipidol. 2012;23(1):4–10. | ||
Tosi F, Sartori F, Guarini P, Olivieri O, Martinelli N. Delta-5 and delta-6 desaturases: crucial enzymes in polyunsaturated fatty acid-related pathways with pleiotropic influences in health and disease. Adv Exp Med Biol. 2014;824:61–81. | ||
Marquardt A, Stöhr H, White K, Weber BH. cDNA cloning, genomic structure, and chromosomal localization of three members of the human fatty acid desaturase family. Genomics. 2000;66(2):175–183. | ||
Beltrandelrio H, Kern F, Lanthorn T, et al. Saturation screening of the druggable mammalian genome. In: Carroll PM, Fitzgerald K, editors. Model Organisms in Drug Discovery. Chichester: Wiley & Sons; 2003:251–278. | ||
Zambrowicz BP, Sands AT. Knockouts model the 100 best-selling drugs–will they model the next 100? Nat Rev Drug Discov. 2003;2(1):38–51. | ||
Zambrowicz BP, Abuin A, Ramirez-Solis R, et al. Wnk1 kinase deficiency lowers blood pressure in mice: a gene-trap screen to identify potential targets for therapeutic intervention. Proc Natl Acad Sci U S A. 2003;100(24):14109–14114. | ||
Brommage R, Desai U, Revelli JP, et al. High-throughput screening of mouse knockout lines identifies true lean and obese phenotypes. Obesity. 2008;16(10):2362–2367. | ||
Brommage R, Liu J, Hansen G, et al. High-throughput screening of mouse gene knockouts identifies established and novel skeletal phenotypes. Bone Res. 2014;2:14034. | ||
Powell DR, DaCosta CM, Gay J, et al. Improved glycemic control in mice lacking Sglt1 and Sglt2. Am J Physiol Endocrinol Metab. 2013;304(2):E117–E130. | ||
Wattler S, Kelly M, Nehls M. Construction of gene targeting vectors from lambda KOS genomic libraries. Biotechniques. 1999;26(6):1150–1160. | ||
Revelli JP, Smith D, Allen J, et al. Profound obesity secondary to hyperphagia in mice lacking kinase suppressor of ras 2. Obesity (Silver Spring). 2011;19(5):1010–1018. | ||
Powell DR, Gay JP, Wilganowski N, et al. Diacylglycerol lipase a knockout mice demonstrate metabolic and behavioral phenotypes similar to those of cannabinoid receptor 1 knockout mice. Front Endocrinol (Lausanne). 2015;6:86. | ||
Savelieva KV, Zhao S, Pogorelov VM, et al. Genetic disruption of both tryptophan hydroxylase genes dramatically reduces serotonin and affects behavior in models sensitive to antidepressants. PLoS One. 2008;3(10):e3301. | ||
Pan DA, Lillioja S, Milner MR, et al. Skeletal muscle membrane lipid composition is related to adiposity and insulin action. J Clin Invest. 1995;96(6):2802–2808. | ||
Warensjö E, Risérus U, Vessby B. Fatty acid composition of serum lipids predicts the development of the metabolic syndrome in men. Diabetologia. 2005;48(10):1999–2005. | ||
Warensjö E, Ohrvall M, Vessby B. Fatty acid composition and estimated desaturase activities are associated with obesity and lifestyle variables in men and women. Nutr Metab Cardiovasc Dis. 2006;16(2):128–136. | ||
Steffen LM, Vessby B, Jacobs DR Jr, et al. Serum phospholipid and cholesteryl ester fatty acids and estimated desaturase activities are related to overweight and cardiovascular risk factors in adolescents. Int J Obes (Lond). 2008;32(8):1297–1304. | ||
Warensjö E, Rosell M, Hellenius ML, Vessby B, De Faire U, Risérus U. Associations between estimated fatty acid desaturase activities in serum lipids and adipose tissue in humans: links to obesity and insulin resistance. Lipids Health Dis. 2009;8:37. | ||
Araya J, Rodrigo R, Pettinelli P, Araya AV, Poniachik J, Videla LA. Decreased liver fatty acid delta-6 and delta-5 desaturase activity in obese patients. Obesity (Silver Spring). 2010;18(7):1460–1463. | ||
Saito E, Okada T, Abe Y, et al. Abdominal adiposity is associated with fatty acid desaturase activity in boys: implications for C-reactive protein and insulin resistance. Prostaglandins Leukot Essent Fatty Acids. 2013;88(4):307–311. | ||
Fumagalli M, Moltke I, Grarup N, et al. Greenlandic Inuit show genetic signatures of diet and climate adaptation. Science. 2015;349(6254):1343–1347. | ||
Lemaitre RN, Tanaka T, Tang W, et al. Genetic loci associated with plasma phospholipid n-3 fatty acids: a meta-analysis of genome-wide association studies from the CHARGE Consortium. PLoS Genet. 2011;7(7):e1002193. | ||
Sergeant S, Hugenschmidt CE, Rudock ME, et al. Differences in arachidonic acid levels and fatty acid desaturase (FADS) gene variants in African Americans and European Americans with diabetes or the metabolic syndrome. Br J Nutr. 2012;107(4):547–555. | ||
Hodge AM, English DR, O’Dea K, et al. Plasma phospholipid and dietary fatty acids as predictors of type 2 diabetes: interpreting the role of linoleic acid. Am J Clin Nutr. 2007;86(1):189–197. | ||
Krachler B, Norberg M, Eriksson JW, et al. Fatty acid profile of the erythrocyte membrane preceding development of Type 2 diabetes mellitus. Nutr Metab Cardiovasc Dis. 2008;18(7):503–510. | ||
Patel PS, Sharp SJ, Jansen E, et al. Fatty acids measured in plasma and erythrocyte-membrane phospholipids and derived by food-frequency questionnaire and the risk of new-onset type 2 diabetes: a pilot study in the European Prospective Investigation into Cancer and Nutrition (EPIC)-Norfolk cohort. Am J Clin Nutr. 2010;92(5):1214–1222. | ||
Kröger J, Zietemann V, Enzenbach C, et al. Erythrocyte membrane phospholipid fatty acids, desaturase activity, and dietary fatty acids in relation to risk of type 2 diabetes in the European Prospective Investigation into Cancer and Nutrition (EPIC)-Potsdam Study. Am J Clin Nutr. 2011;93(1):127–142. | ||
Dupuis J, Langenberg C, Prokopenko I, et al. New genetic loci implicated in fasting glucose homeostasis and their impact on type 2 diabetes risk. Nat Genet. 2010;42(2):105–116. | ||
Hu C, Zhang R, Wang C, et al. Variants from GIPR, TCF7L2, DGKB, MADD, CRY2, GLIS3, PROX1, SLC30A8 and IGF1 are associated with glucose metabolism in the Chinese. PLoS One. 2010;5(11):e15542. | ||
Ingelsson E, Langenberg C, Hivert MF, et al. Detailed physiologic characterization reveals diverse mechanisms for novel genetic Loci regulating glucose and insulin metabolism in humans. Diabetes. 2010;59(5):1266–1275. | ||
Liu C, Li H, Qi L, et al. Variants in GLIS3 and CRY2 are associated with type 2 diabetes and impaired fasting glucose in Chinese Hans. PLoS One. 2011;6(6):e21464. | ||
Aulchenko YS, Ripatti S, Lindqvist I, et al. Loci influencing lipid levels and coronary heart disease risk in 16 European population cohorts. Nat Genet. 2009;41(1):47–55. | ||
Nakayama K, Bayasgalan T, Tazoe F, et al. A single nucleotide polymorphism in the FADS1/FADS2 gene is associated with plasma lipid profiles in two genetically similar Asian ethnic groups with distinctive differences in lifestyle. Hum Genet. 2010;127(6):685–690. | ||
Willer CJ, Schmidt EM, Sengupta S, et al. Global Lipids Genetics Consortium. Discovery and refinement of loci associated with lipid levels. Nat Genet. 2013;45(11):1274–1283. | ||
Do R, Willer CJ, Schmidt EM, et al. Common variants associated with plasma triglycerides and risk for coronary artery disease. Nat Genet. 2013;45(11):1345–1352. | ||
Ross R. Atherosclerosis – an inflammatory disease. N Engl J Med. 1999;340(2):115–126. | ||
Tedgui A, Mallat Z. Cytokines in atherosclerosis: pathogenic and regulatory pathways. Physiol Rev. 2006;86(2):515–581. | ||
De Caterina R, Zampolli A. From asthma to atherosclerosis – 5-lipoxygenase, leukotrienes, and inflammation. N Engl J Med. 2004;350(1):4–7. | ||
Schaeffer L, Gohlke H, Müller M, et al. Common genetic variants of the FADS1 FADS2 gene cluster and their reconstructed haplotypes are associated with the fatty acid composition in phospholipids. Hum Mol Genet. 2006;15(11):1745–1756. | ||
Martinelli N, Girelli D, Malerba G, et al. FADS genotypes and desaturase activity estimated by the ratio of arachidonic acid to linoleic acid are associated with inflammation and coronary artery disease. Am J Clin Nutr. 2008;88(4):941–949. | ||
Schwedhelm E, Bartling A, Lenzen H, et al. Urinary 8-iso-prostaglandin F2alpha as a risk marker in patients with coronary heart disease: a matched case-control study. Circulation. 2004;109(7):843–848. | ||
Wolfram R, Oguogho A, Palumbo B, Sinzinger H. Enhanced oxidative stress in coronary heart disease and chronic heart failure as indicated by an increased 8-epi-PGF(2alpha). Eur J Heart Fail. 2005;7(2):167–172. | ||
Hester AG, Murphy RC, Uhlson CJ, et al. Relationship between a common variant in the fatty acid desaturase (FADS) cluster and eicosanoid generation in humans. J Biol Chem. 2014;289(32):22482–22489. | ||
Lu Y, Vaarhorst A, Merry AH, et al. Markers of endogenous desaturase activity and risk of coronary heart disease in the CAREMA cohort study. PLoS One. 2012;7(7):e41681. | ||
Li SW, Lin K, Ma P, et al. FADS gene polymorphisms confer the risk of coronary artery disease in a Chinese Han population through the altered desaturase activities: based on high-resolution melting analysis. PLoS One. 2013;8(1):e55869. | ||
Warensjö E, Sundström J, Vessby B, Cederholm T, Risérus U. Markers of dietary fat quality and fatty acid desaturation as predictors of total and cardiovascular mortality: a population-based prospective study. Am J Clin Nutr. 2008;88(1):203–209. | ||
Powell DR. Obesity drugs and their targets: correlation of mouse knockout phenotypes with drug effects in vivo. Obes Rev. 2006;7(1):89–108. | ||
Desai U, Lee E-C, Chung K, et al. Lipid-lowering effects of anti-angiopoietin-like 4 antibody recapitulate the lipid phenotype found in angiopoietin-like 4 knockout mice. Proc Natl Acad Sci U S A. 2007;104(28):11766–11771. | ||
Smart-Halajko MC, Kelley-Hedgepeth A, Montefusco MC, et al. ANGPTL4 variants E40K and T266M are associated with lower fasting triglyceride levels in Non-Hispanic White Americans from the Look AHEAD Clinical Trial. BMC Med Genet. 2011;12:89. | ||
Lee E-C, Desai U, Gololobov G, et al. Identification of a new functional domain in angiopoietin-like 3 and angiopoietin-like 4 involved in binding and inhibition of lipoprotein lipase. J Biol Chem. 2009;284(20):13735–13745. | ||
Musunuru K, Pirruccello JP, Do R, et al. Exome sequencing, ANGPTL3 mutations, and familial combined hypolipidemia. N Engl J Med. 2010;363(23):2220–2227. | ||
Pearce LR, Atanassova N, Banton MC, et al. KSR2 mutations are associated with obesity, insulin resistance and impaired cellular fuel oxidation. Cell. 2013;155(4):765–777. | ||
Fan YY, Monk JM, Hou TY, et al. Characterization of an arachidonic acid-deficient (Fads1 knockout) mouse model. J Lipid Res. 2012;53(7):1287–1295. | ||
Abuin A, Hansen GM, Zambrowicz B. Gene trap mutagenesis. Handb Exp Pharmacol. 2007;178:129–147. | ||
Dyall SC. Long-chain omega-3 fatty acids and the brain: a review of the independent and shared effects of EPA, DPA and DHA. Front Aging Neurosci. 2015;7:52. | ||
López-Vicario C, González-Périz A, Rius B, et al. Molecular interplay between Δ5/Δ6 desaturases and long-chain fatty acids in the pathogenesis of non-alcoholic steatohepatitis. Gut. 2014;63(2):344–355. | ||
Baugh SDP, Pabba PK, Barbosa J, et al. Design and synthesis of novel inhibitors of delta-5 desaturase for the treatment of metabolic syndrome. Bioorg Med Chem Lett. 2015;25(18):3836–3839. | ||
Suzuki H, Fujimoto T, Yamamoto T, Kobayashi H, inventors; Takeda Pharmaceuticals, Inc., assignee. Delta-5-desaturase inhibitors. Patent WO/2010/087467. 2010. |
 © 2016 The Author(s). This work is published and licensed by Dove Medical Press Limited. The full terms of this license are available at https://www.dovepress.com/terms.php and incorporate the Creative Commons Attribution - Non Commercial (unported, v3.0) License.
By accessing the work you hereby accept the Terms. Non-commercial uses of the work are permitted without any further permission from Dove Medical Press Limited, provided the work is properly attributed. For permission for commercial use of this work, please see paragraphs 4.2 and 5 of our Terms.
© 2016 The Author(s). This work is published and licensed by Dove Medical Press Limited. The full terms of this license are available at https://www.dovepress.com/terms.php and incorporate the Creative Commons Attribution - Non Commercial (unported, v3.0) License.
By accessing the work you hereby accept the Terms. Non-commercial uses of the work are permitted without any further permission from Dove Medical Press Limited, provided the work is properly attributed. For permission for commercial use of this work, please see paragraphs 4.2 and 5 of our Terms.