")
Back to Journals » Clinical Interventions in Aging » Volume 13
Fat infiltration in the gluteus minimus muscle in older adults
Authors Takano Y, Kobayashi H, Yuri T , Yoshida S, Naito A, Kiyoshige Y
Received 17 November 2017
Accepted for publication 11 April 2018
Published 23 May 2018 Volume 2018:13 Pages 1011—1017
DOI https://doi.org/10.2147/CIA.S157402
Checked for plagiarism Yes
Review by Single anonymous peer review
Peer reviewer comments 2
Editor who approved publication: Dr Richard Walker
Yuta Takano,1 Hiroto Kobayashi,2 Takuma Yuri,1 Saori Yoshida,2 Akira Naito,2 Yoshiro Kiyoshige1
1Graduate School of Health Science, Yamagata Prefectural University of Health Science, Yamagata, Japan; 2Department of Anatomy, Yamagata University Faculty of Medicine, Yamagata, Japan
Purpose: Fat infiltration (FI) in the gluteus minimus muscle (GMin) has been reported as being restricted to the anterior part. The aim of this study was to verify whether FI is localized only to the anterior part of the GMin through the dissection of large number of elderly cadavers and to clarify the underlying mechanism of FI localized to a specific region.
Materials and methods: Thirty-eight hips from 20 embalmed elder cadavers were dissected for verification of FI localization. The samples of three regions – the fat infiltrated region of the anterior part (FI), the region without FI (non-FI), and the posterior region – were harvested from nine hips for the histological fiber type assessment.
Results: The FI area was distributed at 2.6°–38° from the anterior border within the anterior part, of which function is responsible for hip extension and internal rotation and is likely reduced by disuse following aging. The number of type I fibers was lowest in FI, followed by non-FI, while the number of type I fibers was highest in the posterior. Meanwhile, the number of type II fibers was equivalent across the three regions. Atrophic type II fibers were observed in overall samples of the three regions, and grouped atrophy, which is evidence of denervation, was observed in FI and non-FI samples. Type grouping, which suggests to be reinnervated, was found in the non-FI and posterior samples but very little in the FI samples.
Conclusion: FI in the GMin in older adults restricted to deep within the anterior part is secondary to disuse and is strongly related to impaired denervation–reinnervation process.
Keywords: gluteus minimus, fat infiltration, disuse, denervation, fiber type
Introduction
There have been many reports on the decline in physical activity and the risk of falls associated with the atrophy of the gluteus medius and minimus muscles (GMed and GMin, respectively), including fat infiltration (FI).1–6 FI in the GMin is localized deep within the anterior part, and its content increases with increasing age.2,4 Only one study has investigated the degree of FI in the GMin using cadavers, revealing that out of 12 cadavers, mild FI and extensive FI were found in 6 and 2 cadavers, respectively. Furthermore, FI was restricted to the anterior part, suggesting that FI is associated with aging.
Muscle fiber type studies assessing aging process that results in muscle atrophy, especially reduction in the cross-sectional areas (CSAs) of type II fibers, have been investigated.7–12 Type II fiber has a short contraction time and an ability to produce high tension. With aging and being inactive, the muscles lose their activity for rapid force production as a result of preferential atrophy of type II fibers. The strength decline in old age was correlated with the CSAs of type II fibers.7 The aim of this study was to verify whether FI is localized only into the anterior part of the GMin through the dissection of a large number of elderly cadavers and to clarify the underlying mechanism of FI localized to a specific region of the GMin through a muscle fiber-type assessment.
Materials and methods
Macroscopic observation
We dissected 38 hips from 20 embalmed cadavers of elderly individuals (14 males and 6 females) to expose the GMin. Their mean age at death was 82.8 (ranged 64–95) years. Two hips were excluded due to previous surgery invading the tendon of the GMin.
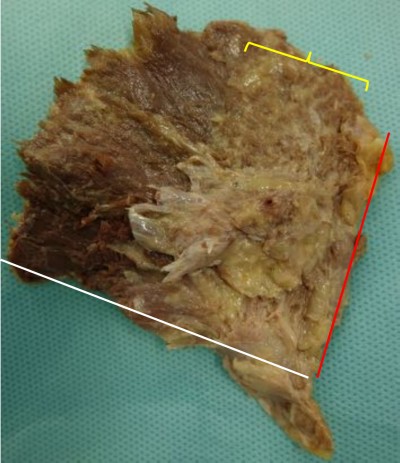
According to the previous radiological studies that FI localized to the bony surface of muscle, the dissection was performed using a technique described by Walters et al.13 The muscle belly was elevated from its attachment to the outer aspect of the pelvis. The capsular attachment and the tendinous insertion to the greater trochanter were sharply dissected. The specimens formed a fan with an apex assuming the tendinous insertion. The fat content in the muscle, which was greater than or equal to the muscle tissue content (corresponding to stages III and IV of Goutallier’s classification on computer tomography14), was observed on the deep surface and measured as the angle from the anterior border (Figure 1).
 | Figure 1 Appearance of the deeper surface of gluteus minimus. |
Microscopic observation
Tissue sampling and immunohistochemistry
We assessed randomly selected 9 hips from 38 cadavers and harvested the samples from three regions: the fat infiltrated region of the anterior part by gross inspection (FI), the region without FI (non-FI), and the posterior (C) region.
Samples of muscle tissue, each ~10–20 mm in length and 5–10 mm in depth, were collected from three regions of the GMin of each specimen. Each sample was post-fixed overnight in Bouin’s solution at 4°C. Tissues were then dehydrated and embedded in Paraplast embedding media (Sigma, St Louis, MO, USA). Cross sections of each sample were cut at a thickness of 5 μm.
The sections were deparaffinized and hydrophilized. H&E staining for GMin was performed according to conventional methods. Nearly adjacent sections were incubated with an antigen retrieval agent (pH 9.0; Nichirei Co., Tokyo, Japan) at 95°C for 20 minutes. A blocking solution consisting of 2% bovine serum albumin (Sigma) in PBS was applied at 37°C for 30 minutes. Two primary antibodies, anti-fast myosin skeletal heavy chain (1:1,000, #ab91506; Abcam, Cambridge, UK) and anti-slow myosin skeletal heavy chain (1:10,000, #ab11083; Abcam), were used to label the myosin heavy chains of type I and type II fibers, respectively. Sections were incubated overnight at 37°C with the primary antibody. The secondary antibodies, anti-mouse IgG Alexa Fluor 488 (1:400, #A-11029; Thermo Fisher Scientific Inc., Cambridge, MA, USA) and anti-rabbit IgG Alexa Fluor 568 (1:400, #A-11036; Thermo Fisher Scientific Inc.), were used for an hour at 37°C. As a negative control of immunohistochemistry, nearly adjacent sections were incubated without the primary antibody and then incubated with the secondary antibody. No labeling was confirmed in these control sections.
Imaging, counting the fiber types, and determining the fiber size
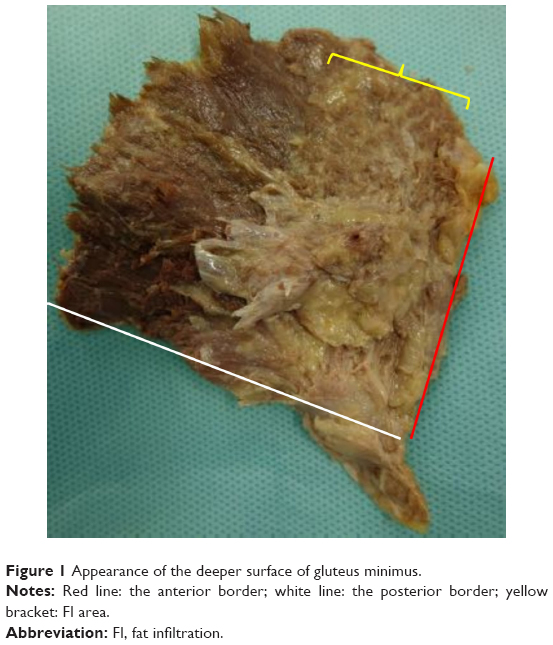
A total of five images were obtained for each specimen. Each fiber was counted on the Adobe Photoshop (Adobe Systems Inc., San Jose, CA, USA); the number of fibers was then expressed in terms of the number of fibers/mm2 (Figure 2). The hybrid fibers were excluded because they were so few in this study. The CSA of each fiber was determined using ImageJ (National Institutes of Health, Bethesda, MD, USA). Over 50 sections coming from nine specimens (six sections from a single specimen) were examined. In adult male, the diameter of muscle fibers of the quadriceps is regarded as between 40 and 80 μm. We defined the fiber with more than 80 μm of diameter as enlarged fiber or hypertrophy and the fiber <40 μm as small fiber or atrophy.
 | Figure 2 Complementary immunohistochemical staining for each fiber type. |
Statistical analysis
Free statistical software “R” version 2.8.1 (The R Project for Statistical Computing; open source) was used for statistical analysis. The data were analyzed using repeated measures ANOVAs. The threshold used for statistical significance was p=0.01.
Ethics
The cadavers used in this study were donated for the dissection training for medical students and the related studies for researchers. Written informed consent was obtained from all of them before their death. This study was approved by the Ethics Committee of Yamagata University School of Medicine (#315), Yamagata, Japan, and was also approved by the Ethics Review Board of the Yamagata Prefectural University of Health Sciences (#1701-22), Yamagata, Japan.
Results
Macroscopic observation
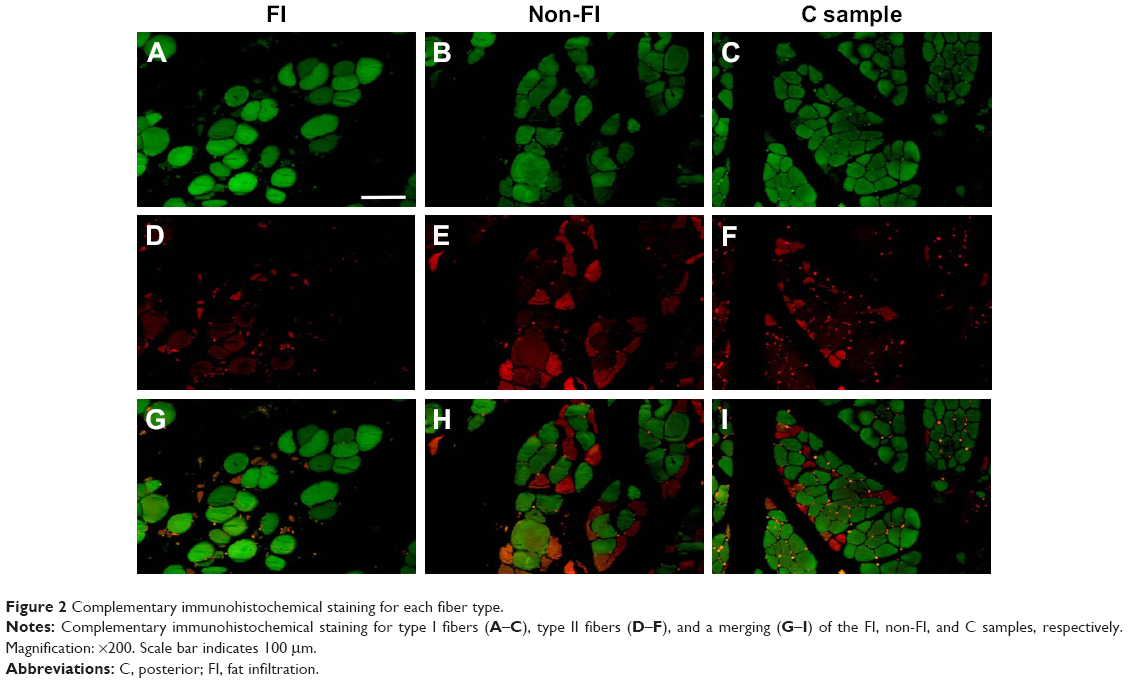
On the superficial surface of the GMin, the muscle fibers ran fan-shaped with a mean angle of 78.9° (60°–110°). The muscle could be divided into two parts because the fibers of the anterior and posterior parts were oriented craniocaudally and horizontally, respectively. The anterior part was larger and amounted to two-thirds of the muscle. The fibers of the posterior part converged on the caudal area of the aponeurosis, while the cranial area centralized the fibers of the anterior part. Then, the aponeurosis gradually turned into tendinous portion (Figure 3). Superficial infiltration of fatty tissue was rarely found other than in one hip in which all muscle fibers became fatty tissue.
 | Figure 3 Appearance of the superficial surface of gluteus minimus. |
The deep surface of the GMin below the inferior gluteal line was covered by the aponeurotic tissue, where the muscle fibers of both parts blended. Therefore, the observation of the FI area was performed on the deep surface between the anterior and inferior gluteal lines.
The macroscopic FI was deeply localized in the bony origin in all specimens. The FI area was distributed at a mean angle of 33.4°, between 2.8° (minimum 0°) and 36.2° (maximum 65°) from the anterior border, within the anterior part. The fatty fibers were hardly found in the posterior part. These findings are summarized in Table 1.
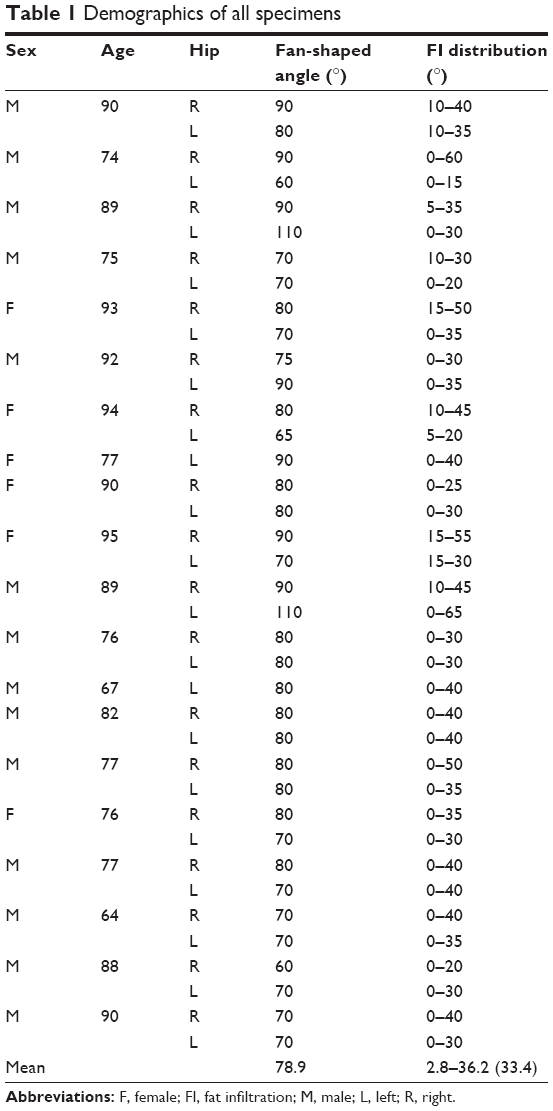 | Table 1 Demographics of all specimens |
Microscopic observation
Predominance of type I fiber was observed in all the three regions (62%–74%). The total number of type I and type II fibers and the number of type I fibers were lowest in the FI, second lowest in the non-FI, and highest in the C regions, while that of type II fibers was equivalent across the three regions. There was a significant difference between the number of type I fibers in the FI and non-FI and that in the C region (p=1.2e–06 and 0.0026, respectively; Figure 4). The CSAs of type I and type II fibers among the three regions were 1,520.18±604.39 and 374.62±170.58 μm2, respectively. The CSAs of type I and type II fibers of each region are shown in Figure 5. In the statistical analysis of the sizes of each fiber type, there were significant differences between the CSAs of type I fibers in the FI and non-FI and that in the C region (p=1.1e–05 and 1.1e–7, respectively). The CSAs of type II fibers in the FI and non-FI were statistically different from that in the C region (p=5.6e–10 and 4.2e–10, respectively). The CSAs of type I and type II fibers in the FI region were equal to those in the non-FI region.
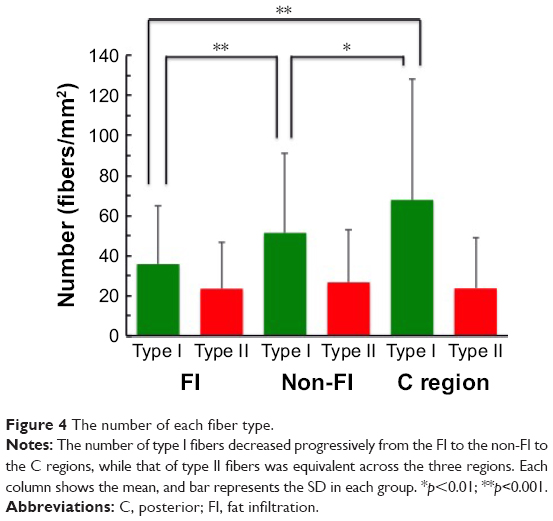 | Figure 4 The number of each fiber type. |
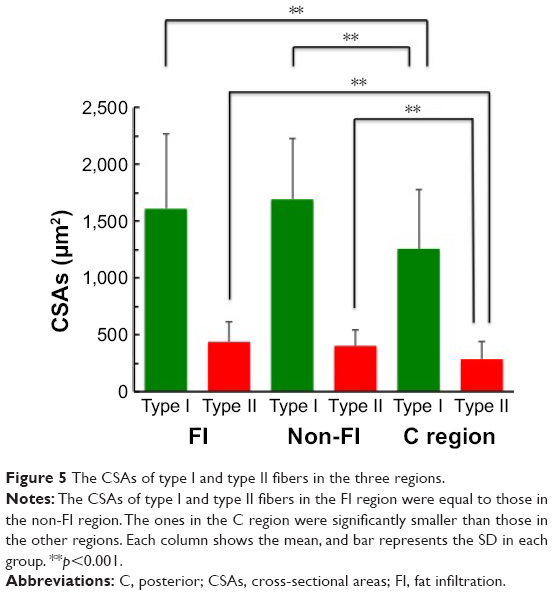 | Figure 5 The CSAs of type I and type II fibers in the three regions. |
From the results of CSA measurement, the diameters of type I and type II fibers were estimated at 60–90 and 28–46 μm, respectively. There were more than a few enlarged type I fibers and small type II fibers. The histologic appearance of the FI samples showed markedly widespread muscle tissue loss and fatty tissue infiltration. The rounded and enlarged type I fibers and atrophied type II fibers were scattered. In the non-FI samples, the interstitial space was slightly widened. The form of type I fibers was varied; some were small, and others were rounded and enlarged. Type II fibers atrophied. In the samples of the C group, small fibers were observed. Type II fibers atrophied as well (Figure 6). Type grouping was found in the non-FI and C samples, but very little was found in the FI samples (Figure 7).
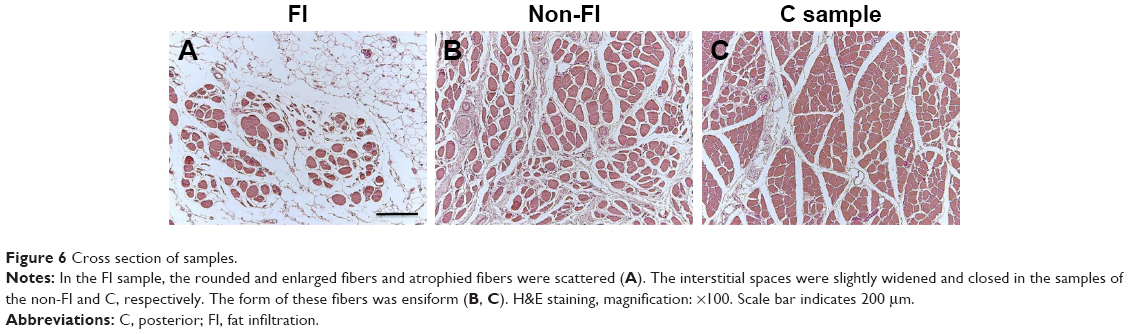 | Figure 6 Cross section of samples. |
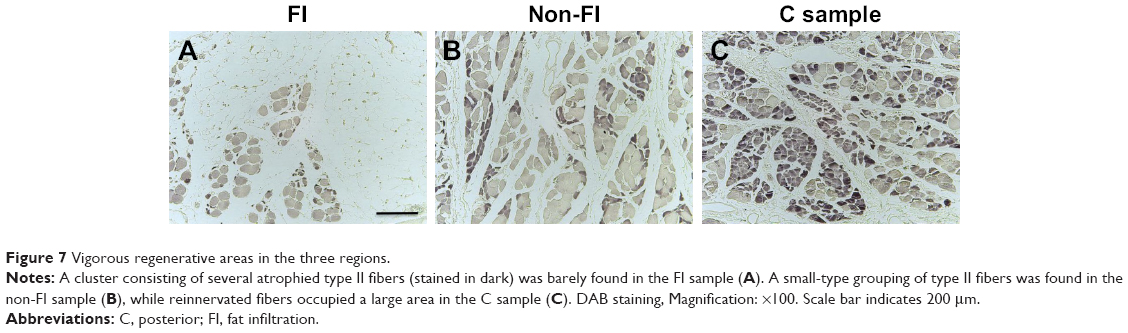 | Figure 7 Vigorous regenerative areas in the three regions. |
Discussion
In macroscopic observation, we found that the FI in the GMin of the elderly cadavers was localized within the angle of 2.8°–36.2° from the anterior border of the GMin. Flack et al2 found that the GMin was composed of four compartments, namely, the anterior, mid-anterior, mid-posterior, and posterior subregions. They also found FI in 8 of 12 embalmed cadaver specimens that were predominantly restricted within the anterior subregion and throughout the mid-anterior subregion. The finding in this study coincides with Flack’s results.
Pfirrmann et al1 previously noted in an MRI study that the FI of the GMin was evident in the anterior two-thirds and uncommon in the posterior part. We previously reported that the FI of the GMin was localized deep within the anterior region, and the fat content increased with increasing age.4
Beck et al15 artificially divided the GMin into four sectors, and sectors I and II, which correspond to the anterior and mid-anterior subregions of Flack’s divisions, worked well in abduction and acted as internal rotators with hip extension. Semciw et al16 demonstrated different roles between the anterior and posterior parts of the GMin electromyographically. The posterior part is more active in the early stance phase, both parts co-contract in the late mid-stance phase, and the anterior part has a large internal rotational torque and counteracts the hip extension moment. Flack et al2 also reported that the physiological CSAs of the anterior and mid-anterior subregions were smaller than those of the mid-posterior and posterior subregions. It is well known that with increasing age, stride length is reduced and hip extension capacity decreases, followed by a decline in stance phase. Using MRI, Kumagai et al17 reported that the GMin worked more actively in hip abduction because the increase in signal intensity of the GMin was greater than that of the GMed immediately after a one-legged stance, and even the GMed has a larger CSA. In an electromyographical study, Ganderton et al18 suggested that a lack of terminal hip extension and internal rotation reduces the stimulus for the anterior part to contract. A reduction of gait performance with increasing age, such as reduced stance phase duration and a loss of hip extension and subsequent loss of internal rotation, may be exacerbated predominantly in the thinner anterior part of the GMin.
The details of individual activities of the specimens during lifetime were unidentified because the specimens were donated elder cadavers. However, to a greater or lesser extent, all specimens showed FI in the deep anterior part of the GMin. Therefore, aging or disuse secondary to aging might influence the FI localization in the anterior part of the GMin.
In microscopic assessment of the muscular fiber type, the number of type I fibers was lowest in the FI, second lowest in the non-FI, and highest in the C regions, while the number of type II fibers was equivalent across all the three regions. The CSAs of type I and type II fibers in the C region were significantly lower than those in the FI and non-FI regions. The CSAs of type I and type II fibers were 1,520.18 and 374.62 μm2, respectively. These values were relatively low, especially those of type II. Lexell et al8 found that the total number of fibers in the vastus lateralis significantly decreases with increasing age. Nilwik et al12 reported that age-related reduction in muscle mass was mainly attributed to specific type II fiber atrophy with no substantial decline in the number of fibers, namely, a decline in the CSAs of type II fibers. Lexell and Tayler found a selective reduction in the size of type II fibers in the elders compared with the youngers. They concluded that such a finding was very common in the elders due to inactivity and immobilization.9 Larsson et al revealed that type II fiber atrophy was responsible for age-related strength in the quadriceps muscle.7 The type II fiber size in the GMin was very small in this study compared with those of the vastus lateralis in previous studies. The reason for small size of the type II fiber was not only the subjects’ age (mean age at death was 82.8 years) but may be characteristic of the GMin. In an 11-year study, Aniansson et al10 established that there was a significant increase in both type I and type II fiber areas instead of significant reductions in the proportion of type II fibers. Frontera et al11 also reported that the number of both fiber types declined, while their diameter increased with age due to compensatory hypertrophy, as determined through an 8.9-year longitudinal study with a sample of participants with a mean age of 71 years. In the FI and non-FI regions, the number of type I fibers was lower, while the CSAs of both types were larger in the present study. These fiber characteristics suggest an influence of inactivity and aging in the FI and non-FI regions.
In the histological analysis of the FI samples, the residual fibers with rounded and/or enlarged type I and atrophied and/or rounded type II fibers were scattered. Fiber hypertrophy in aged muscle is considered to be a compensatory mechanism to correct for a muscle size deficit resulting from motor unit loss.9–11 The rounded and enlarged forms seen in the FI and non-FI samples seemed to result from fiber splitting and myogenic compensation.
Neurogenic changes in histologic appearance are characterized as atrophic fibers in acutely denervated muscle and as grouped atrophy in progressively denervated one. Type grouping occupied by type II, which is evidence of muscle reinnervation by sprouting, was found in the non-FI and C samples but very little in the FI samples. This finding suggests that the fibers in the non-FI and C regions have a capacity to regenerate. In the FI region, denervation outpaces reinnervation because the fibers were replaced by fatty tissue subsequent to fiber loss without any alteration of fiber type. In other words, the fibers in the FI region no longer had any regenerative capacity. These facts suggest that the denervation–reinnervation process was impaired in the FI region.
The number of motor neurons in the spinal anterior horn decreases with increasing age.19 Aging also brings about changes in the motor unit and neuromuscular junction in the context of the impaired denervation–reinnervation process. Campbell et al20 found motor unit loss apparent over the age of 60 years. Hourigan et al21 demonstrated that neuromuscular junction instability (increased near fiber jiggle) is associated with aging. In a study using mice, Butikofer et al22 indicated that aging is associated with neuromuscular junction fragmentation and that neuromuscular junction fragmentation and muscle fiber loss are not secondary to the loss of motor neurons. Chai et al23 found that the denervation of muscles is not due to the loss of motor neurons but rather results from the denervation of neuromuscular junctions. These findings suggest that for muscle fiber loss to occur, motor neuron loss is not essential, but neuromuscular junction instability is necessary. Baehr et al24 reported that poor muscle recovery following disuse was associated with neuromuscular junction instability in a rat hind limb unloading model. That is, prolonged disuse induces neuromuscular junction instability and delays the reinnervation process.
When denervation outpaces reinnervation, denervated fibers will degenerate, and much space will consequently be created. Beeler et al25 proposed that with chronic muscle denervation, the muscle fiber atrophy and fat fills the space created by the reduction in fiber size. In the present study, fat filled the space that was created by the loss of fibers resulting from an impaired denervation–reinnervation process. Therefore, we advocate another hypothesis: the interstitial spaces created by muscle tissue loss followed by an impaired denervation–reinnervation process can lead to a crude FI-related implicitly to disuse but directly to denervation in the anterior GMin.
Conclusion
FI in the GMin in older adults restricted to deep within the anterior part is secondary to disuse and strongly related to impairment of denervation–reinnervation process.
Disclosure
The authors report no conflicts of interest in this work.
References
Pfirrmann CW, Notzli HP, Dora C, Hodler J, Zanetti M. Abductor tendons and muscles assessed at MR imaging after total hip arthroplasty in asymptomatic and symptomatic patients. Radiology. 2005;235(3):969–976. | ||
Flack NA, Nicholson HD, Woodley SJ. The anatomy of the hip abductor muscle. Clin Anat. 2014;27(2):241–253. | ||
Addison O, Young P, Inacio M, et al. Hip but not thigh intramuscular adipose tissue is associated with poor balance and increased temporal gait variability in older adults. Curr Aging Sci. 2014;7(2):137–143. | ||
Kiyoshige Y, Watanabe E. Fatty degeneration of gluteus minimus muscle as a predictor for falls. Arch Gelontol Geriatr. 2015;60(1):59–61. | ||
Chi AS, Long SS, Zoga AC, et al. Prevalence and pattern of gluteus medius and minimus tendon pathology and muscle atrophy in older individuals using MRI. Skeletal Radiol. 2015;44(12):1727–1733. | ||
Chi AS, Long SS, Zoga AC, Parker L, Morrison WB. Association of gluteus medius and minimus muscle atrophy and fall-related hip fracture in older individuals using computed tomography. J Comput Assist Tomogr. 2016;40(2):238–242. | ||
Larsson L, Grimby G, Karlsson J. Muscle strength and speed of movement in relation to age and muscle morphology. J Appl Physiol Respir Environ Exerc Physiol. 1979;46(3):451–456. | ||
Lexell J, Talor CC, Sjostrom M. What is the cause of ageing atrophy? Total number, size and proportion of different fiber types studied in whole vastus lateralis muscle from 15- to 83-year-old men. J Neurol Sci. 1988;84(2–3):275–294. | ||
Lexell J, Tayler CC. Variety in muscle fibre areas in whole human quadriceps muscle: effects of increasing age. J Anat. 1991;174:239–249. | ||
Aniansson A, Grimby G, Hedberg M. Compensatory muscle fiber hypertrophy in elderly men. J Appl Physiol (1985). 1992;73(3):812–816. | ||
Frontera WR, Reid KF, Phillips EM, et al. Muscle fiber size and function in elderly human: a longitudinal study. J Appl Physiol (1985). 2008;105(2):637–642. | ||
Nilwik R, Snijders T, Leenders M, et al. The decline in skeletal muscle mass with aging is mainly attribute to a reduction in type II muscle fiber size. Exp Gerontol. 2013;48(5):492–498. | ||
Walters J, Solomons M, Davies J. Gluteus minimus: observation on its insertion. J Anat. 2001;198(Pt 2):239–242. | ||
Goutallier D, Postel JM, Bernageau J, Lavau L, Voisin MC. Fatty muscle degeneration in cuff ruptures: pre- and postoperative evaluation by CT scan. Clin Orthop Relat Res. 1994;304:78–83. | ||
Beck M, Sledge JB, Gautier E, Dora CF, Ganz R. The anatomy and function of the gluteus minimus muscle. J Bone Joint Surg Br. 2000;82(3):358–363. | ||
Semciw AI, Green RA, Murley GS, Pizzari T. Gluteus minimus: an intramuscular EMG investigation of anterior and posterior segments during gait. Gait Posture. 2014;39(2):822–826. | ||
Kumagai M, Shiba N, Higuchi F, Nishimura H, Inoue A. Functional evaluation of hip abductor muscles with use of magnetic resonance imaging. J Orthop Res. 1997;15(6):888–893. | ||
Ganderton C, Pizzari T, Harle T, Cook J, Semciw A. A comparison of gluteus medius, gluteus minimus and tensor fascia latae muscle activation during gait in post-menopausal women with and without greater trochanteric pain syndrome. J Electromyogr Kinesiol. 2017;33:39–47. | ||
Tomlinson BE, Irving D. The numbers of limb motor neurons in the human lumbosacral cord throughout life. J Neurol Sci. 1977;34(2):213–219. | ||
Campbell MJ, McComas AJ, Petito F. Physiological changes in aging muscle. J Neurol Neurosurg Psychiatry. 1973;36(2):174–182. | ||
Hourigan ML, McKinnon NB, Johnson M, Rice CL, Stashuk DW, Doherty TJ. Increased motor unit potential shape variability across consecutive motor unit discharges in the tibialis anterior and vastus medialis muscles of healthy older subjects. Clin Neurophysiol. 2015;126(12):2381–2389. | ||
Butikofer L, Zurlinden A, Bolliger MF, Kunz B, Sonderegger P. Destabilization of the neuromuscular junction by proteolytic cleavage of agrin results in precocious sarcopenia. FASEB J. 2011;25(12):4378–4393. | ||
Chai RJ, Vukovic J, Dunlop S, Grounds MD, Shavlakadze T. Striking denervation of neuromuscular junctions without lumbar motoneuron loss in geriatric mouse muscle. PLoS One. 2011;6(12):e28090. | ||
Baehr LM, West DW, Marcotte G, et al. Age-related deficits in skeletal muscle recovery following disuse are associated with neuromuscular junction instability and ER stress, not impaired protein synthesis. Aging (Albany NY). 2016;8(1):127–146. | ||
Beeler S, Ek ET, Gerber C. A comparative analysis of fatty infiltration and muscle atrophy in patients with chronic rotator cuff tears and suprascapular neuropathy. J Shoulder Elbow Surg. 2013;22(11):1537–1546. |
 © 2018 The Author(s). This work is published and licensed by Dove Medical Press Limited. The full terms of this license are available at https://www.dovepress.com/terms.php and incorporate the Creative Commons Attribution - Non Commercial (unported, v3.0) License.
By accessing the work you hereby accept the Terms. Non-commercial uses of the work are permitted without any further permission from Dove Medical Press Limited, provided the work is properly attributed. For permission for commercial use of this work, please see paragraphs 4.2 and 5 of our Terms.
© 2018 The Author(s). This work is published and licensed by Dove Medical Press Limited. The full terms of this license are available at https://www.dovepress.com/terms.php and incorporate the Creative Commons Attribution - Non Commercial (unported, v3.0) License.
By accessing the work you hereby accept the Terms. Non-commercial uses of the work are permitted without any further permission from Dove Medical Press Limited, provided the work is properly attributed. For permission for commercial use of this work, please see paragraphs 4.2 and 5 of our Terms.