")
Back to Journals » International Journal of General Medicine » Volume 15
FAM3B Serves as a Biomarker for the Development and Malignancy of Oral Lichen Planus
Authors Wang W , Wang M, Ahmed MMS , Zhao Y, Wu H, Musa M , Chen X
Received 3 November 2021
Accepted for publication 11 January 2022
Published 20 January 2022 Volume 2022:15 Pages 763—776
DOI https://doi.org/10.2147/IJGM.S346617
Checked for plagiarism Yes
Review by Single anonymous peer review
Peer reviewer comments 2
Editor who approved publication: Dr Scott Fraser
Wenfang Wang,1 Meijuan Wang,2 Madiha Mohammed Saleh Ahmed,1 Yunshan Zhao,1 Hao Wu,1 Mazen Musa,1 Xi Chen1
1Department of Stomatology, First Affiliated Hospital, College of Medicine, Xi’an Jiaotong University, Xi’an, Shaanxi, People’s Republic of China; 2Anesthesiology Department, Second Affiliated Hospital, College of Medicine, Xi’an Jiaotong University, Xi’an, Shaanxi, People’s Republic of China
Correspondence: Xi Chen, Department of Stomatology, First Affiliated Hospital, College of Medicine, Xi’an Jiaotong University, 227 West Yanta Road, Xi’an, 710000, People’s Republic of China, Tel +86-13038598996, Fax +86-2985252580, Email [email protected]
Purpose: Oral lichen planus (OLP) is a potentially malignant condition with unclear etiology. This study aimed to identify potential biomarkers and mechanisms for OLP progression through bioinformatics analyses.
Methods: Gene Expression Omnibus (GEO) datasets were screened to identify differentially expressed genes (DEGs) between OLP patients and healthy individuals. The functions and enriched pathways of the DEGs were identified. Sequencing dataset GSE70665 was then used to analyze the role of DEGs in the development of OLP to oral squamous cell carcinoma (OSCC). Oncomine and The Cancer Genome Atlas (TCGA) databases were utilized to evaluate clinicopathological characters of OSCC. Univariate and multivariate Cox regression models were used to identify independent prognostic factors.
Results: A total of 24 DEGs were identified between OLP and normal samples. FAM3B was under-expressed in OLP compared with normal samples and was further significantly downregulated in OSCC compared with OLP. Under-expression of FAM3B was significantly correlated with tumor stage and disease-specific survival (DSS), progression-free interval (PFI) and overall survival (OS) of OSCC patients. With univariate and multivariate Cox regression analysis, FAM3B was an independent prognostic factor.
Conclusion: Under-expression of FAM3B was associated with the development and malignancy of OLP. FAM3B may serve as a potential prognostic biomarker for OLP.
Keywords: bioinformatics, potentially malignant condition, oral squamous cell carcinoma, prognosis
Introduction
Oral lichen planus (OLP) is a localized chronic inflammatory oral mucosal disease that is induced by T-cell dysfunction and typically characterized by the presence of white lace-like lesions.1 The global pooled prevalence of OLP is 1.01%, with a higher prevalence in Europe (1.43%).2 The disease is most common in middle-aged people and occurs predominantly in females (2:1).3,4 There are six clinical patterns: reticular (the most common), atrophic/erosive, ulcerative, plaque, papular, and vesicles/bullous.5 Oral lesions are commonly chronic and asymptomatic when there are no concomitant atrophic or erosive lesions.6 Histopathological features include liquefaction degeneration of the basal epithelial cell layer, a well-defined sub-epithelial band-like zone of lymphocytic infiltration, and the absence of epithelial dysplasia.7 Although genetic background, immunologic status and infections are considered to be the main predisposing or provoking factors, the etiology and pathogenesis of OLP remain incompletely understood.3
Variation in patient response to specific therapies is a well-recognized issue. The clinical management of OLP presents great challenges for oral physicians.8 OLP shows little spontaneous regression, and it is classified as a potentially malignant condition by the World Health Organization. About 1.37% of OLP patients develop oral squamous cell carcinoma (OSCC).9 The malignant transformation rate of OLP is actually underestimated owing to restrictive diagnostic criteria and inadequate data.10 Tongue localization, presence of atrophic-erosive lesions, tobacco use, alcohol consumption, and hepatitis C virus infection are considered to be risk factors for malignant transformation.10 OSCC accounts for 90% of head and neck squamous cell carcinomas.11 Owing to the high recurrence rate and tendency to metastasis of OSCC, the prognosis of OSCC patients is unsatisfactory, with a 5-year survival rate of only 50%.12 Early diagnosis and treatment of OLP can effectively prevent disease progression and reduce the burden on patients and society. To date, the underlying mechanisms initiating development of cancer in OLP lesions have not been understood. It is vital to identify robust biomarkers for the diagnosis, prognosis and treatment of OLP.
The development of microarray and RNA sequencing technology provides a new perspective for biomedical research. In the current study, on the basis of various databases, we quantified changes in mRNA expression in OLP patients and healthy individuals to identify the potential regulatory mechanism of OLP. Moreover, we analyzed the differential mRNA expression between OLP and OSCC in the same patients, and explored its correlations with clinicopathological features and prognosis, in order to identify potential biomarkers of OLP malignant transformation. This study provides insight into the mechanisms of OLP development at the transcriptome level and explores potential biomarkers for the development and malignancy of OLP.
Materials and Methods
Acquisition of Data of Gene Expression Profiles
The expression profiling datasets GSE38616, GSE52130, and GSE70665 were acquired from the Gene Expression Omnibus (GEO, https://www.ncbi.nlm.nih.gov/geo/). In GSE38616, there were seven samples from OLP patients and seven samples from healthy individuals.13 Similarly, in GSE52130, the numbers of samples from OLP patients and normal individuals were both seven.14 GSE70665 included paired OLP and OSCC and adjacent normal oral mucosa from the same patients.15
Differential Expression Analysis and Validation of Common Differentially Expressed Genes (DEGs)
The online GEO2R tool was used to identify DEGs. The following criteria were applied: (1) |log2 (fold change)| ≥ 1; (2) p-value < 0.05. A t-test was performed to determine p-values, and adjusted p-values were calculated. In GSE38616 and GSE52130, DEGs between OLP and normal samples were identified, and heatmaps and volcano plots analyses were used to visualize these DEGs using the complex heatmap and ggplot2 packages of the R software. The online tool Venny 2.1 (http://bioinfogp.cnb.csic.es/tools/venny/index.html) was used to identify the DEGs in common for the two datasets.
Functional Enrichment Analysis of Common DEGs
DAVID (https://david.ncifcrf.gov/tools.jsp) was used for gene ontology (GO) enrichment and Kyoto Encyclopedia of Genes and Genomes (KEGG) pathway analyses of the common DEGs. The GO terms included biological process (BP), cellular component (CC) and molecular function (MF) terms. A p-value < 0.05 was considered significant.
Protein-Protein Interaction (PPI) Network Analysis
STRING (https://string-db.org/) was used for PPI network analysis. The DEGs were mapped onto the PPI network with a minimum interaction score of 0.4. Cytoscape v3.7.1 software was used to visualize the PPI network. Gene network clustering analysis was performed to identify the key PPI network modules, using the MCODE app from the Cytoscape software suite. An adjusted p-value < 0.05 was set as the significance threshold.
Identification and Validation of Key Genes in OLP Malignancy
Genes showing continuous upregulation or downregulation patterns between normal tissue and OLP and between OLP and OSCC in the GSE70665 dataset were identified and denoted “up tendency genes” and “down tendency genes”. The intersection of “up/down tendency genes” in GSE70665 and the 24 common DEGs between GSE38616 and GSE52130 were carried forward as potential key genes in malignant progression to OSCC.
The Cancer Genome Atlas (TCGA, https://www.cancer.gov/about-nci/organization/ccg/research/structural-genomics/tcga) and Oncomine (https://www.oncomine.org/resource/login.html) gene expression datasets were used to verify the mRNA levels of the key genes. The cutoffs for p-value and |fold change| were defined as 0.01 and 2, respectively. The TCGA OSCC cohort contained 502 OSCC samples and 44 normal samples, including 40 paired samples of OSCC vs adjacent normal tissue, and the level 3 HTSeq-FPKM data were transformed into TPM (transcripts per million reads) for further analyses. A receiver operating characteristic (ROC) curve was created using the pROC R package to investigate the biomedical predictive value of the key genes. The Human Pathology Atlas project (HPA, https://www.proteinatlas.org) was used to confirm the transcriptomic results. Immunohistochemistry (IHC) images in OSCC and normal tissues from the same patient were obtained from HPA project.
Tissue sections from OLP and OSCC patients were collected for IHC staining, which was performed as previously described.16 Primary antibodies (anti-FAM3B, 1:100, Proteintech, Chicago, IL, USA; anti-KRT75, 1:100, Santa Cruz Biotechnology, Santa Cruz, CA, USA; anti-PI3, 1:50, Proteintech) and a secondary antibody two-step kit (EliVisionTM Super Plus, Fuzhou, China) were used. The staining was visualized with a DAB chromogenic reagent kit (MXB, Fuzhou, China). The images were captured using a microscopy (Olympus, Japan).
Prognostic Value of FAM3B
In the TCGA cohort, clinical traits were analyzed according to patient characteristics, including ethnicity, gender, age, smoking status, stage and grade. Survival analysis was performed using the Kaplan-Meier method, and Cox regression analysis was used to compare differences between groups. Prognostic factors were evaluated by univariate Cox regression. All variables identified as significant in the univariate Cox regression analysis (p < 0.05) were subjected to multivariate Cox regression analysis. Multivariate Cox regression was performed to identify independent prognostic factors. All statistical analyses were performed in R (v3.6.2). The cut-off value for FAM3B expression was determined by its median value. A p-value < 0.05 was considered significant in all tests. Then, a prognostic nomogram was constructed to facilitate prediction of 3-, 5-, and 7-year disease-specific survival (DSS) for OSCC patients using the rms R package. The discrimination of the nomogram was calculated based on the concordance index.
Results
Identification of DEGs
The datasets GSE38616 and GSE52130 were downloaded from the GEO database, and the DEGs between OLP patients and normal individuals were analyzed using the online analysis tool GEO2R. A total of 57 upregulated and 22 downregulated genes were identified in GSE38616, and 521 upregulated and 331 downregulated genes were identified in GSE52130. Volcano plots and heat maps of the DEGs are shown in Figure 1A–D. As shown in Figure 1E and Table 1, we identified the intersection of DEGS from these two datasets and obtained a total of 24 common DEGs, comprising 20 upregulated and four downregulated genes.
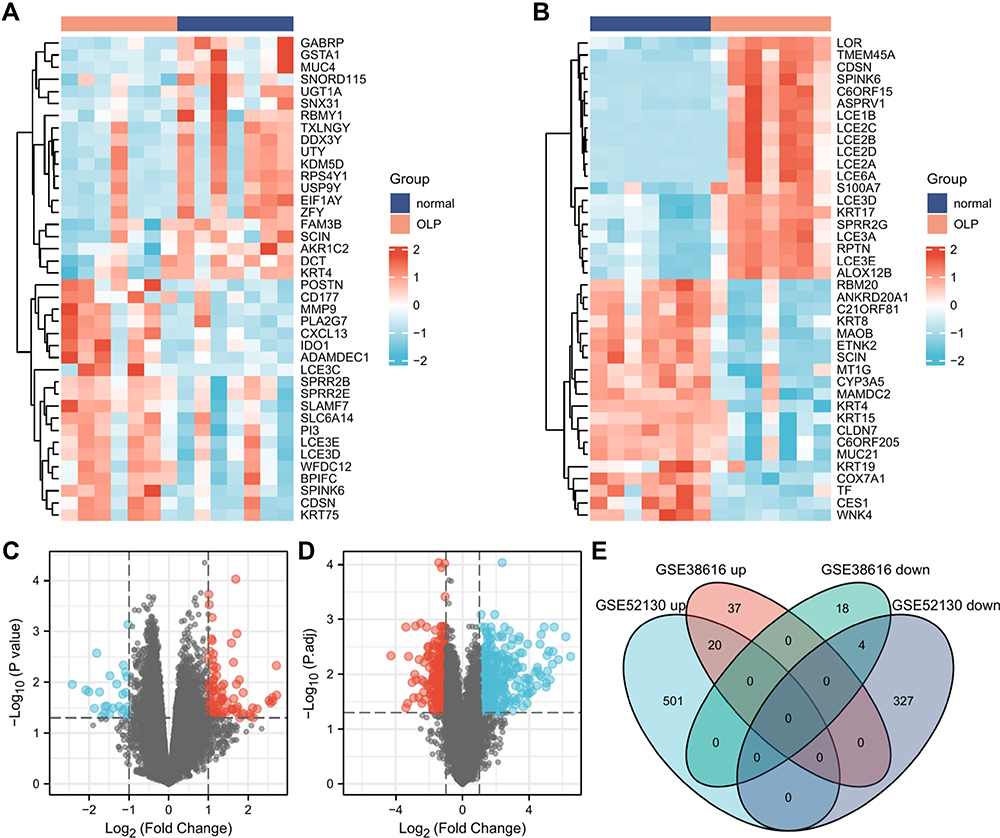 |
Figure 1 Identification of DEGs. (A and B) Heatmaps of top 20 up- and downregulated DEGs between the OLP samples and normal samples in datasets GSE38616 and GSE52130. Red rectangles represent high expression, and blue rectangles represent low expression. (C and D) Volcano plot of DEGs between the OLP samples and normal samples in datasets GSE38616 and GSE52130. The red plots represent upregulated genes, the blue plots represent downregulated genes, and the black plots represent nonsignificant genes. (E) Venn diagram of DEGs between the OLP samples and normal samples in datasets GSE38616 and GSE52130. Up represents upregulated genes, and down represents downregulated genes. |
Functional and Pathway Enrichment of DEGs
GO and pathway enrichment analyses of DEGs were performed using the DAVID 6.8 online tool. The GO analysis demonstrated that the DEGs were mainly enriched in the cornification, keratinization, keratinocyte differentiation, epidermal cell differentiation, and skin development BPs; the cornified envelope, keratin filament, cluster of actin-based cell projections, lamellar body, and intermediate filament CCs; and the serine-type endopeptidase inhibitor activity, endopeptidase inhibitor activity, peptidase inhibitor activity, endopeptidase regulator activity, and peptidase regulator activity MFs. The main KEGG pathways in which DEGs were enriched were Tryptophan metabolism, steroid hormone biosynthesis, chemical carcinogenesis, Fc gamma R-mediated phagocytosis, and C-type lectin receptor signaling pathway. The details of these results are displayed in Figure 2A and Table 2.
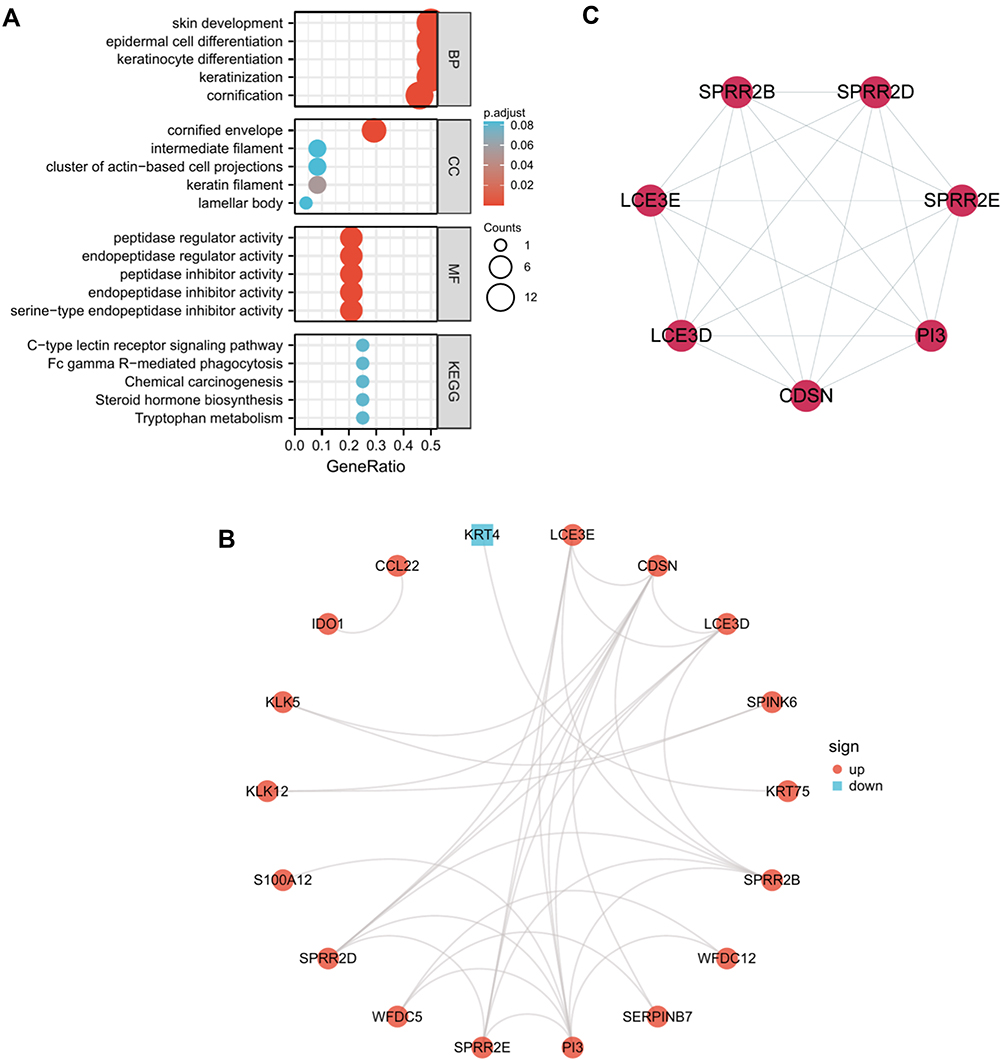 |
Figure 2 Functional enrichment analysis and PPI network of the common DEGs. (A) GO and KEGG pathway enrichment analysis of the DEGs in common between GSE38616 and GSE52130. The screening criterion for significance was p < 0.05. (B) Interaction network of proteins encoded by the common DEGs. The nodes represent genes, and the edges represent links between genes. Red represents upregulated genes, and blue represents downregulated genes. (C) The one key module extracted by MCODE. |
PPI Network Analysis of DEGs
The interactions of 24 DEGs were analyzed using the STRING online database. The PPI network was obtained using the Cytoscape software (Figure 2B). The MCODE plugin was then used to investigate the key PPI network modules. As shown in Figure 2C, one key module with seven upregulated genes (SPRR2B, SPRR2D, SPRR2E, LCE3D, LCE3E, CDSN, and PI3) was identified.
Identification and Validation of Key Genes in OLP Malignancy
A Venn diagram of “up/down tendency genes” in GSE70665 and the 24 common DEGs between GSE38616 and GSE52130 is presented in Figure 3A. As shown in the diagram, three upregulated genes (KRT75, PI3, and S100A12) and one downregulated gene (FAM3B) were identified.
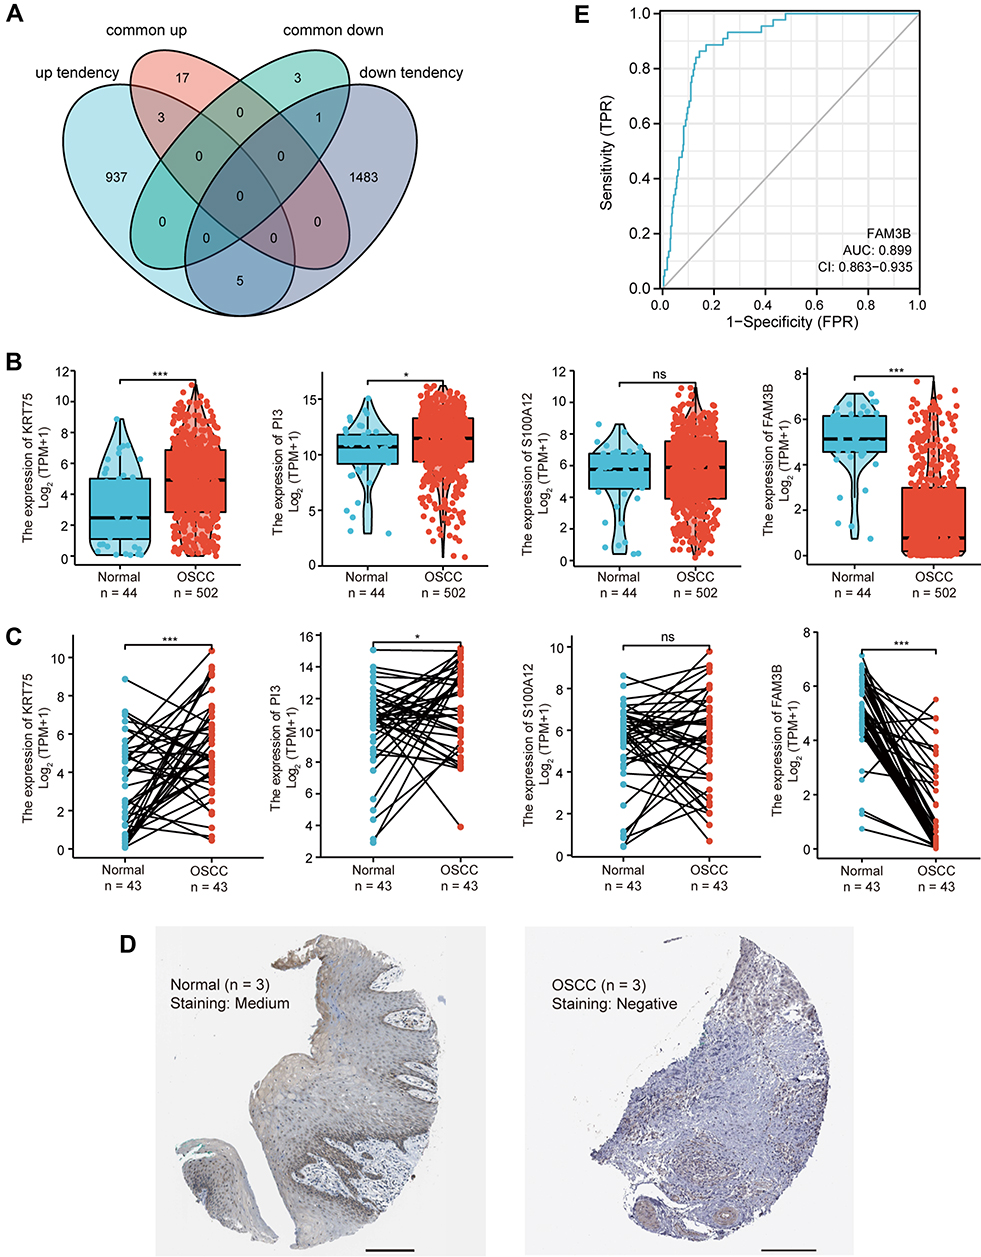 |
Figure 3 Identification and validation of key genes in OLP malignancy. (A) Venn diagram of the DEGs significantly associated with OLP malignancy; “common up” and “common down” represent upregulated and downregulated DEGs in common for GSE38616 and GSE52130 datasets; “up tendency” and “down tendency” represent genes showing continuous upregulation and downregulation patterns from normal tissue to OLP to OSCC in GSE70665. (B) Expression of KRT75, PI3, S100A12 and FAM3B in OSCC (TCGA, unpaired samples). *p < 0.05; ***p < 0.001; (C) Expression of KRT75, PI3, S100A12 and FAM3B in OSCC (TCGA, paired samples). *p < 0.05; ***p < 0.001; NS, not significant. (D) IHC staining of OSCC and normal oral mucosa from HPA project. Scale bar = 200μm. (E) ROC curve for FAM3B. Abbreviation: NS, not significant. |
Next, the expression of these four genes in OSCC was analyzed based on TCGA. As shown in Figure 3B, KRT75, PI3, and FAM3B were differentially expressed in patients with OSCC compared within healthy individuals. In addition, among the 40 paired samples of OSCC vs adjacent normal tissue, KRT75, PI3, and FAM3B showed significantly differential expression in OSCC compared with adjacent normal tissue (Figure 3C). However, there were no statistically significant changes in S100A12 expression in either the unpaired or the paired samples.
Next, the expression levels of KRT75, PI3, and FAM3B in OSCC were analyzed using the Oncomine gene expression microarray database. As shown in Figure 4, FAM3B showed significantly lower expression in OSCC than in normal tissue in all four relevant analyses. KRT75 and PI3 were over-expressed in OSCC compared with normal individuals in only five of the seven relevant analyses.
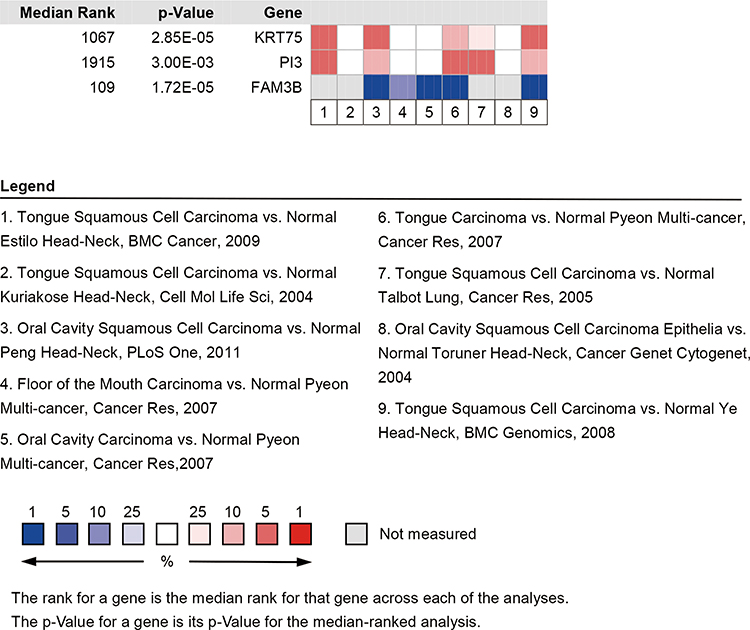 |
Figure 4 Oncomine analysis comparison on the expression of KRT75, PI3, and FAM3B. |
We then examined whether the mRNA changes of these three genes (KRT75, PI3, and FAM3B) were reflected at the protein level. As shown in Figure 3D, IHC staining of tumor and normal tissue in the same OSCC patient from HPA project suggested that FAM3B protein expression was lower in the tumor tissue compared with normal tissue. As shown in Figures S1–S3, FAM3B was downregulated in OLP compared with adjacent normal tissues, and it was under-expressed in OSCC compared with OLP. However, PI3 was more highly expressed in OLP than in normal tissue, and were more abundantly expressed in OSCC than in OLP. KRT75 was expressed in OLP, OSCC, and normal tissue at a similar level.
ROC Curves were constructed to investigate the diagnostic value of KRT75, PI3, and FAM3B in distinguishing OSCC tissues from normal controls. We found that FAM3B yielded an area under the ROC curve (AUC) value of 0.899 (Figure 3E), KRT75 yielded an AUC value of 0.689 (Figure S4A), and PI3 yielded an AUC value of 0.600 (Figure S4B), suggesting that FAM3B could have an important role in diagnosing OSCC.
Relationship Between FAM3B and Clinicopathological Parameters of Patients with OSCC
The clinicopathological traits of OSCC patients were analyzed. As shown in Table 3 and Figure 5A–D, the mRNA expression of FAM3B was significantly correlated with tumor TNM stages (T1 and T2 vs T3 and T4, p = 0.013; N0 and N1 vs N2 and N3, p = 0.009), smoking status (yes vs no, p = 0.006), and ethnicity (Asian vs Black or African American, p = 0.004; Asian vs White, p = 0.001). As shown in Figure 5E, the expression of FAM3B was positively correlated with the abundance of B cells, natural killer (NK) CD56 cells, T cells, NK cells, etc and negatively correlated with the abundance of Tgd cells, neutrophils, and Th1 cells. These results suggest that OSCC with low FAM3B expression is prone to progress to a more advanced stage, whereas high FAM3B expression is correlated with both acquired and innate immunocytes.
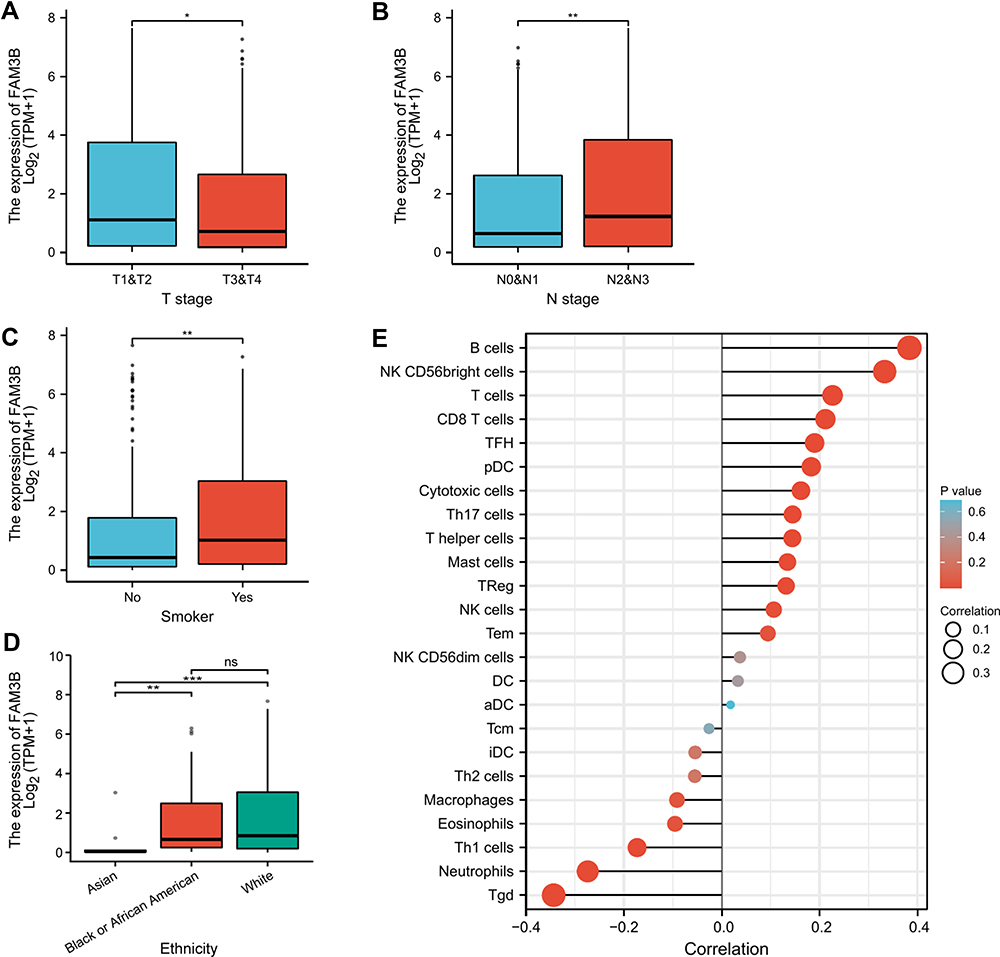 |
Figure 5 Associations of FAM3B expression with clinical pathological characteristics of OSCC. (A–D) FAM3B expression was significantly correlated with tumor TNM stages, smoking status, and ethnicity. *p < 0.05; **p < 0.01; ***p < 0.001; (E) Correlations between FAM3B expression and immune infiltration. Abbreviation: NS, not significant. |
Prognostic Value of FAM3B
Kaplan-Meier survival analysis of OSCC patients stratified by FAM3B (Figure 6A–C) showed that mRNA expression of FAM3B was significantly associated with overall survival (OS), DSS, and progress-free interval (PFI) of OSCC patients in the TCGA cohorts. However, expression of KRT57 and PI3 was not associated with OS, DSS, or PFI of OSCC patients (Figure S5). Then, univariate Cox regression analysis (Table 4) showed that both FAM3B and traditional prognostic factors including N stage and lymphovascular invasion were significantly relevant to DSS. To further determine independent prognostic factors, multivariate Cox regression analysis was performed; the results showed that FAM3B, N stage, and lymphovascular invasion were still relevant to DSS of OSCC patients (Table 5). FAM3B expression is a protective factor, and FAM3B downregulation was significantly associated with poor DSS (HR=0.531, p=0.006) in TCGA cohorts of OSCC patients. As shown in Figure 6D, a nomogram was then created to help predict the probability of 3‐, 5‐, and 7‐year DSS for OSCC patients.
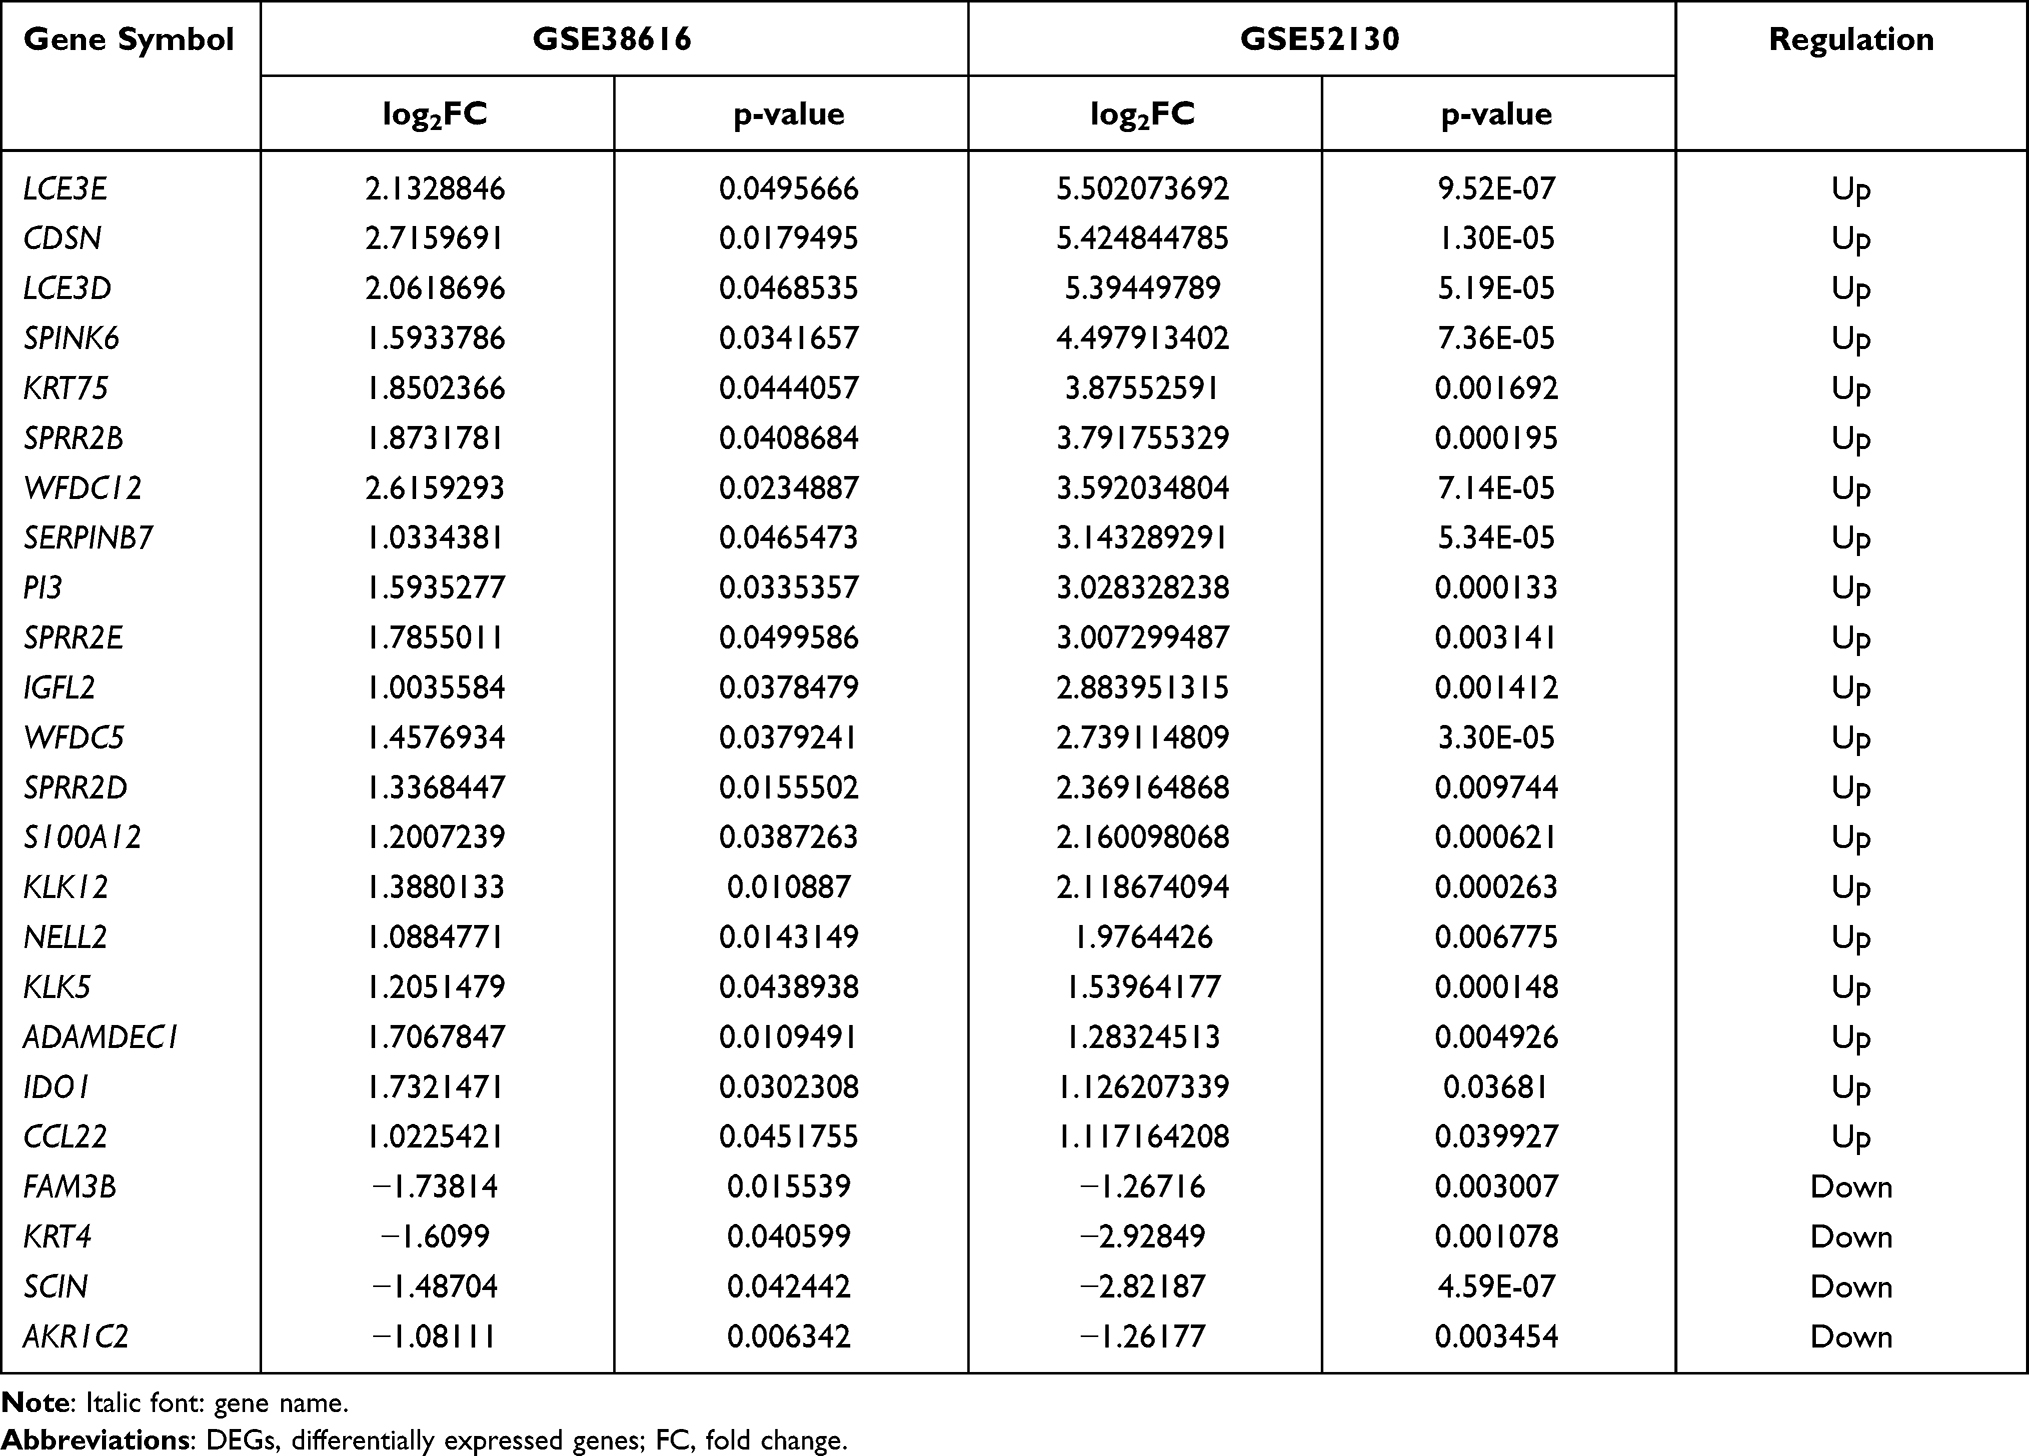 |
Table 1 Twenty-Four DEGs Common to the GSE38616 and GSE52130 Datasets |
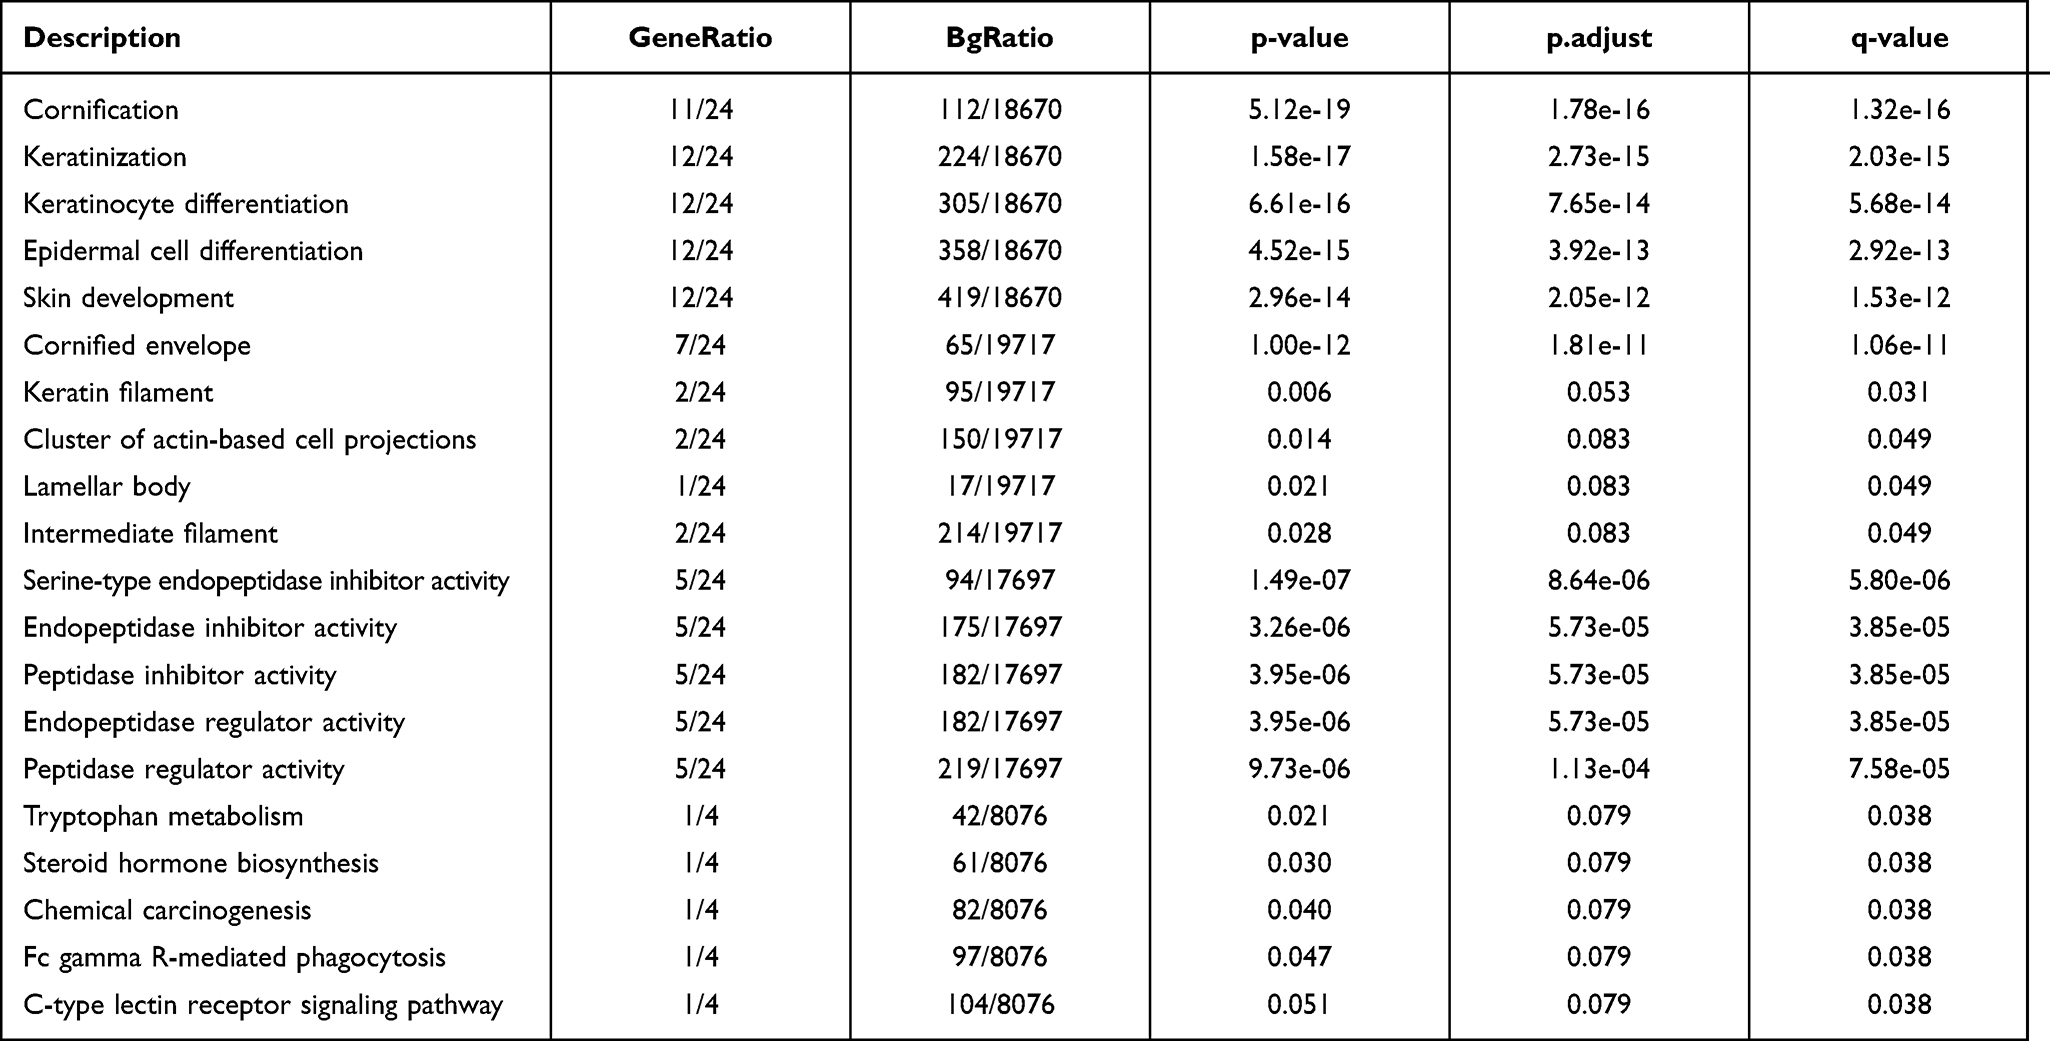 |
Table 2 Enriched Terms for 24 Common DEGs |
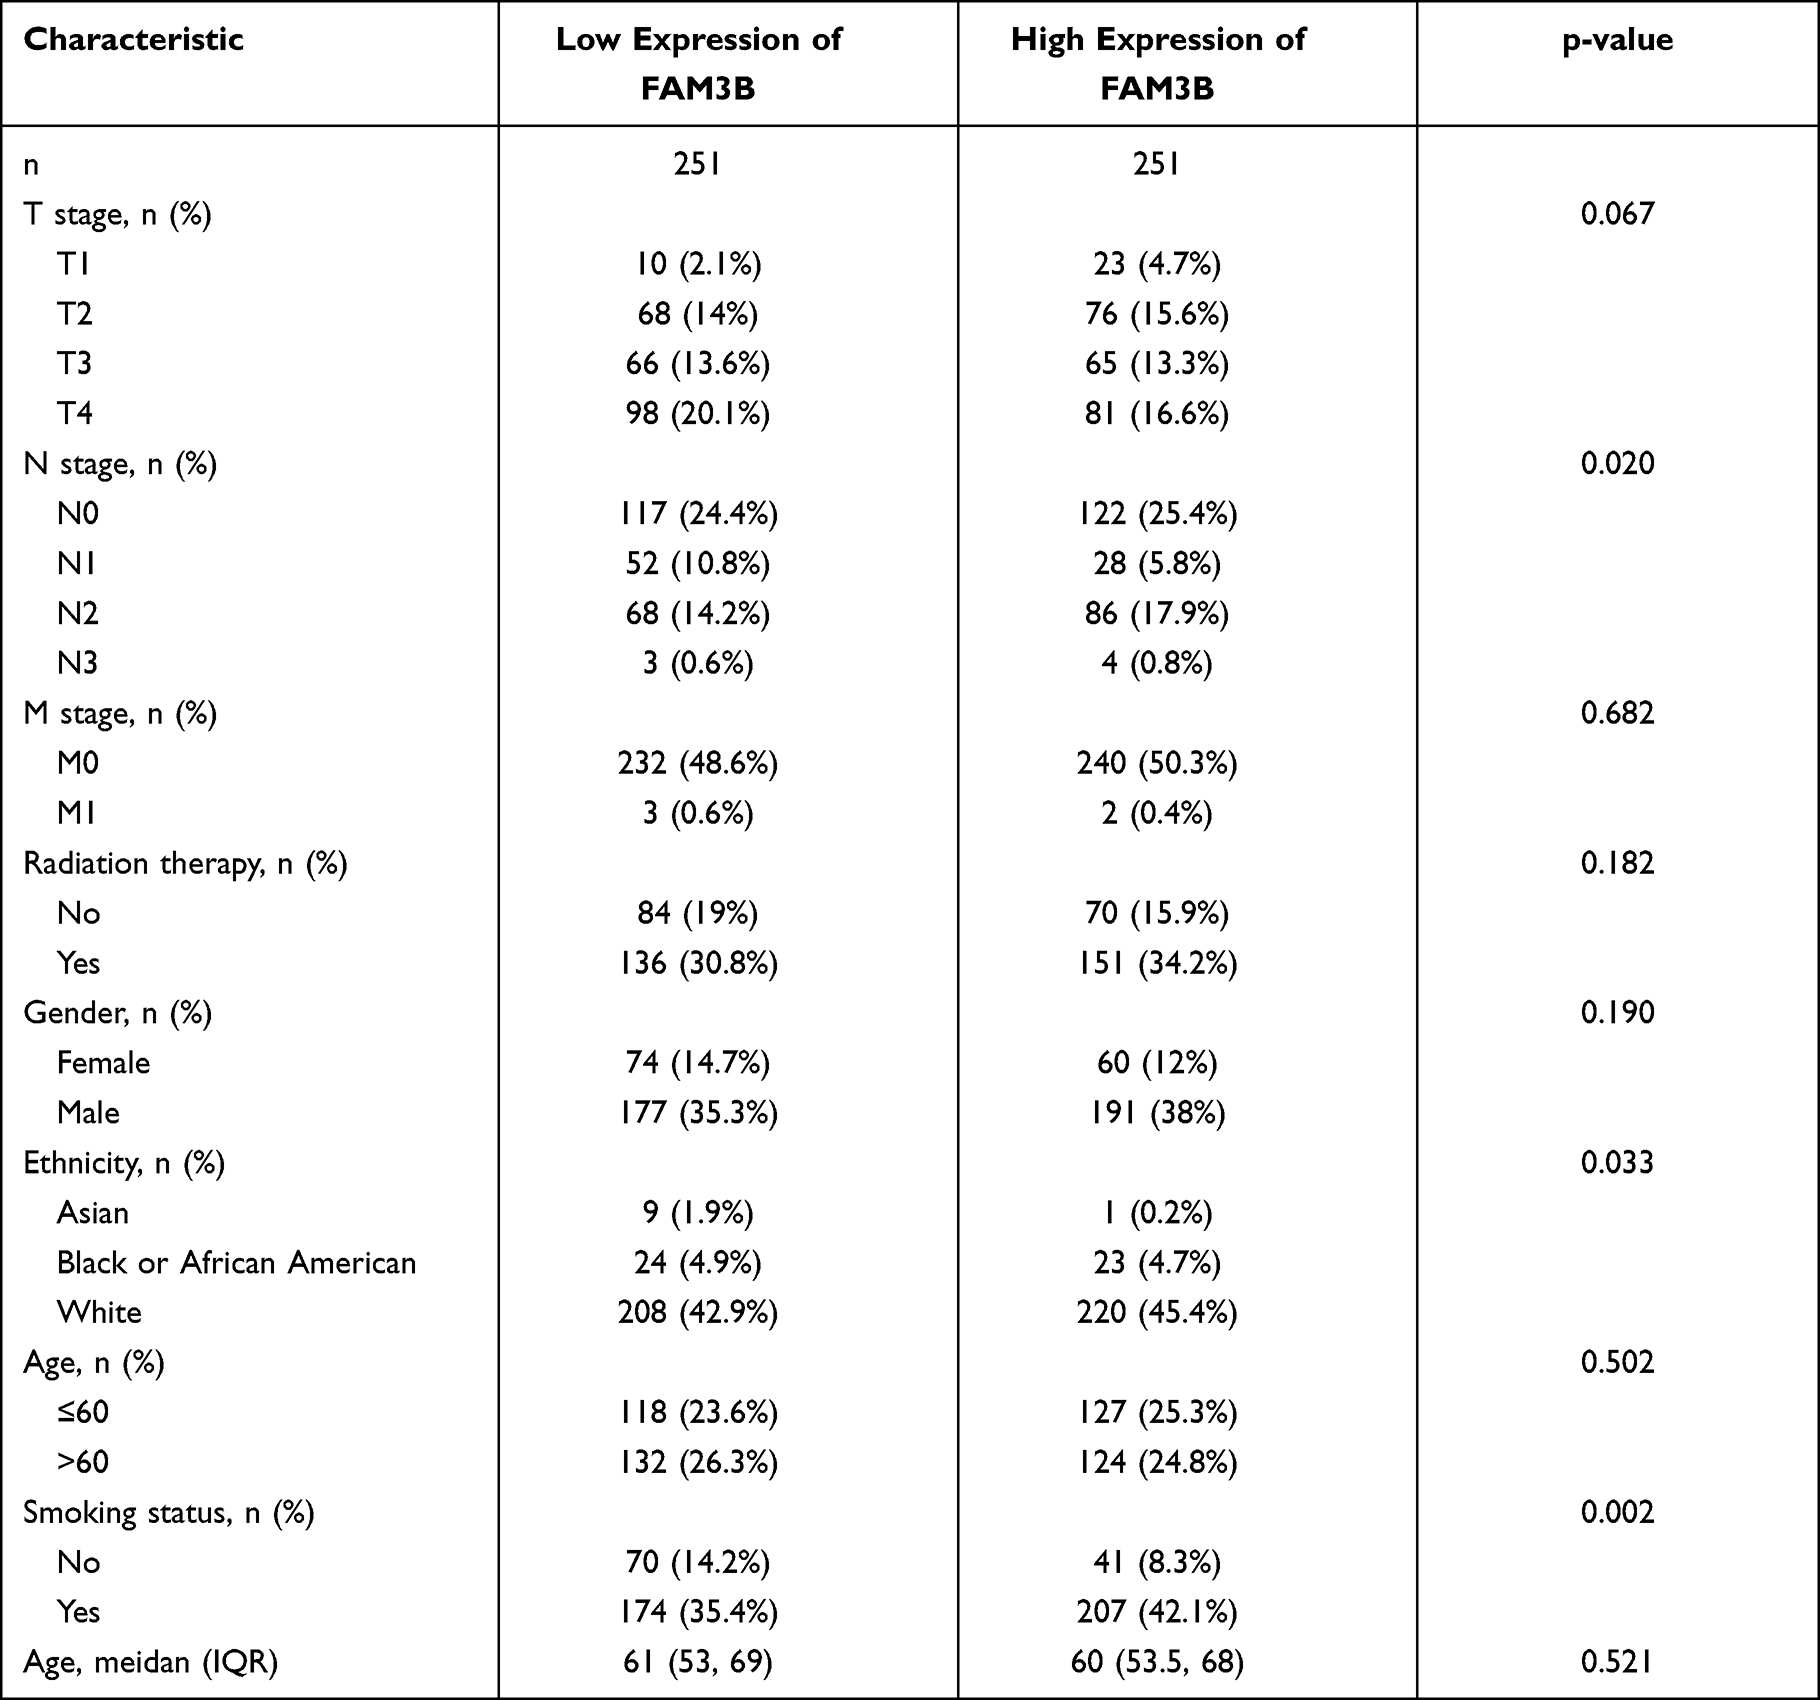 |
Table 3 Correlations Between FAM3B Expression in OSCC Tissues and Patient Clinical Indicators |
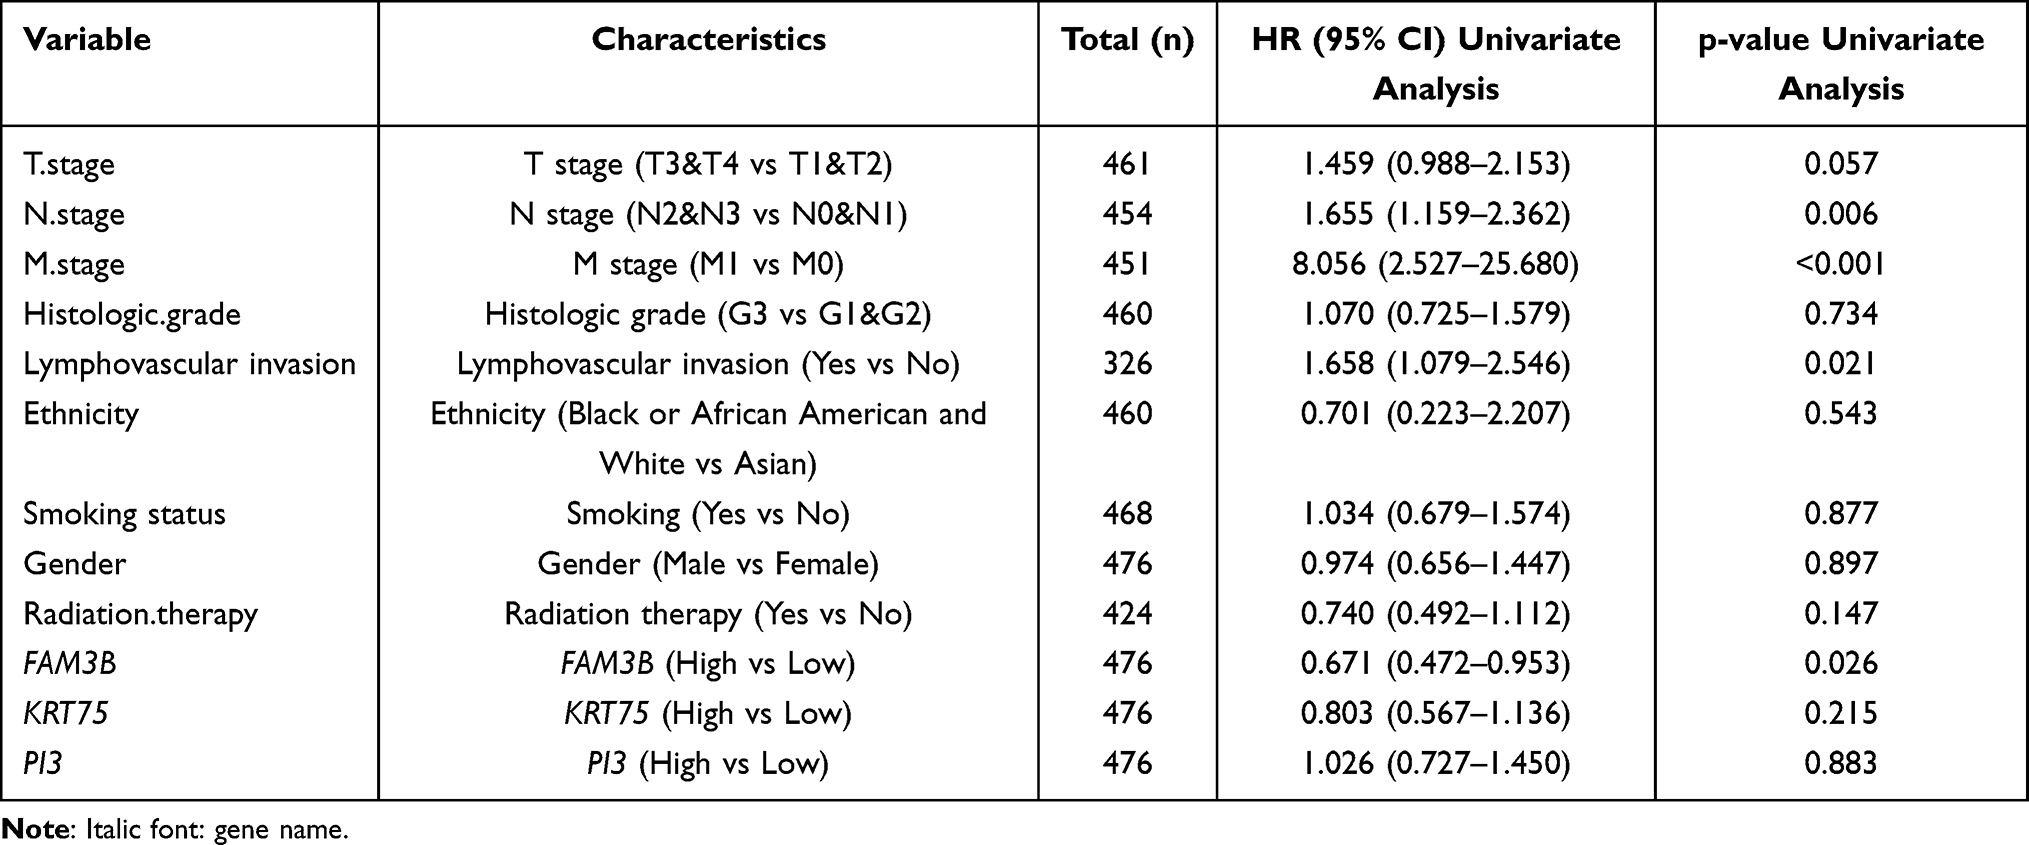 |
Table 4 Univariate Regression of Prognostic Covariates in Patients with OSCC |
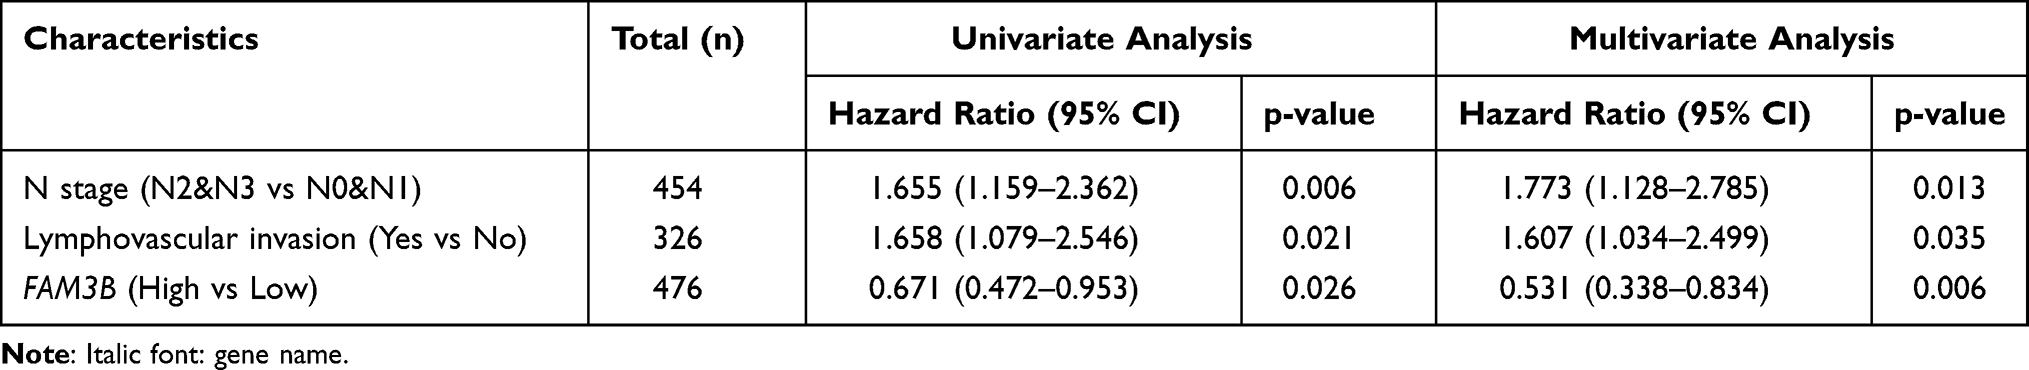 |
Table 5 Multivariate Cox Regression Analysis for DSS in Patients with OSCC |
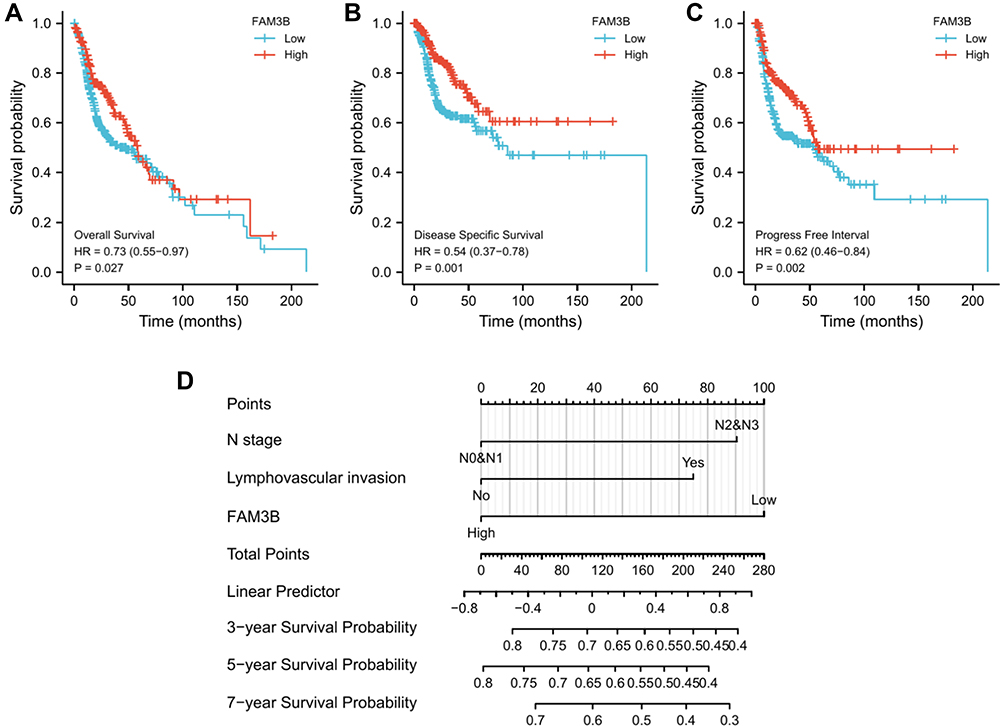 |
Figure 6 Prognostic value of FAM3B in OSCC patients. (A–C) Univariate survival analysis of FAM3B was performed using Kaplan-Meier curves. (D) Nomogram predicting 3‐, 5‐, and 7‐year DSS for OSCC patients in TCGA cohorts. |
Discussion
OLP is one of the most common diseases of the oral mucosa. It is considered to be a refractory chronic inflammatory condition without a clear etiology or pathogenesis. Owing to its high risk of malignant transformation to OSCC, OLP is categorized as a potentially malignant disorder by the World Health Organization.17 Further research to identify the pathogenesis of OLP and to establish what determines its progression to OSCC is urgently needed.
In this study, we identified 24 DEGs, by comparing genes expressed in OLP and normal samples. GO enrichment analysis of the DEGs indicated that they were enriched in BPs including cornification and keratinocyte differentiation, CCs including cornified envelope and keratin filament, and MFs including serine-type endopeptidase inhibitor activity and endopeptidase inhibitor activity were enriched in OLP samples compared with normal samples. This is consistent with the histopathologic features of hyperparakeratosis or hyperorthokeratosis, and lymphocytic infiltrate in the lamina propria in OLP.3 Enriched KEGG pathways included Fc gamma R-mediated phagocytosis and C-type lectin receptor signaling pathway, which have essential roles in infection and immunity. Thus, the GO and KEGG enrichment analyses both showed strong immune activation and signal transduction in OLP, possibly indicating the main cause of OLP. Seven hub upregulated genes were screened using the PPI network, suggesting that overexpression of SPRR2s and LCE3s may represent potential biomarkers for the diagnosis of OLP based on the present datasets. SPRR2B, SPRR2D, SPRR2E are important paralogs and members of the cross-linked envelope keratinocyte protein. SPRR2B expression has been reported to be significantly associated with gastric adenocarcinoma,18 SPRR2D is associated with p73-dependent suppression of chronic inflammation,19 and SPRR2E was identified as a potential biomarker for OS in OSCC patients.20 LCE3D and LCE3E are important paralogs and precursors of the cornified envelope of the stratum corneum. Related pathways include keratinization and developmental biology. They have been found to be related to angiolymphatic invasion of head and neck cancer.21
To identify potential biomarkers for OLP progression, datasets including paired OLP and OSCC tissues and adjacent normal oral mucosa from the same patients were collected, and genes that showed increases or decreases in expression from normal tissue to OLP to OSCC were identified. Among these DEGs, FAM3B showed the same robust low expression in all OSCC analyses, whether based on TCGA or Oncomine data; this was further verified by IHC images. FAM3B (alias C21orf11 or PANDER) is initially known as an islet-specific cytokine that plays an important part in glycolipid metabolism,22 and now has been found to be a pleiotropic cytokine that may exert multiple functions in different tissues. The expression level of FAM3B varies by tumor type. It was reported to be downregulated in gastric cancer,23 but upregulated in colon cancer,24 prostate tumor,25 and esophageal carcinoma.26 Shiiba et al found downregulated expression of FAM3B in five OSCC-derived cell lines and primary OSCC samples.16 To date, all evidence on FAM3B and OSCC has consistently indicated lower expression of FAM3B in OSCC than in normal tissues. In addition, the ROC curve for FAM3B indicated that it has a high diagnostic value in OSCC (AUC = 0.899). We thus considered FAM3B to be a very effective biomarker for the diagnosis of OSCC. Moreover, we found that FAM3B expression in tissues decreased with progression from the normal state to OLP and subsequently to OSCC. Therefore, it may also be a very effective diagnostic indicator for the progression of OLP to OSCC. Given the clinical findings that different clinical types of OLP are associated with prognosis, and erosive type is considered to be the most common OLP type of malignant transformation,10 FAM3B expression in various clinical types of OLP should be evaluated in future research.
We also found that downregulation of FAM3B expression was associated with individual cancer stages and immune infiltration in OSCC patients, which suggested that abnormal inflammation and immune response might have important roles in promoting tumorigenesis of OSCC. In addition, lower expression of FAM3B was significantly associated with shorter OS, DSS, and DFS of OSCC patients. Multivariate analysis showed that down-regulation of FAM3B was an independent prognostic factor for shorter DSS of OSCC patients. These results suggest that FAM3B could serve as a prognostic biomarker for OSCC. The biological roles of FAM3B in tumor progression have been investigated in a few studies. Overexpression of FAM3B promotes the progression of esophageal carcinoma via regulation of the AKT-MDM2-p53 pathway and the epithelial-mesenchymal transition.26 In prostate cancer, increased expression of FAM3B inhibits cell death and promotes tumor growth through upregulation of gene expression of anti-apoptotic Bcl-2 and Bcl-XL.25 On the contrary, FAM3B inhibits of cell growth and reduces tumorigenicity through downregulation of oncogenic AKT signaling pathway in gastric cancer.23 The mechanism of FAM3B downregulation‐induced progression of OSCC remains further investigation. The disparate expression profiles and biological functions of FAM3B among different cancer types may be due to the variable splicing of FAM3B. In contrast to pro-apoptotic role of its secreting form PANDER in gastric cancer,23 a non-secretory form, named as FAM3B-258, was found to promote invasion and metastasis of colon cancer cells via upregulation of Slug expression.24 The various biological functions of proteins encoded by different FAM3B mRNA isoforms have still remained elusive and should be explored in future research.
In this study, we found that the downregulation of FAM3B was significantly associated with the occurrence and development of OLP, and that further decrease in FAM3B expression was related to the progression of OLP to OSCC and to poor survival and immune infiltration in OSCC. Downregulation of FAM3B was found to be very useful in the detection of malignant progression of OLP and to be an independent predictor of DSS of OSCC patients. This study thus provide new and promising insight for further elucidating the molecular mechanism underlying OLP development and malignancy. FAM3B has potential clinical applications as a prognostic marker. However, further experimental studies are needed to confirm our findings.
Conclusions
We found that FAM3B was under-expressed in OLP compared with normal individuals and further significantly downregulated in OSCC compared with OLP. FAM3B could be associated with the development and malignant progression of OLP and might be a potential prognostic biomarker for OLP.
Data Sharing Statement
The data sets used in this study are publicly available (https://www.ncbi.nlm.nih.gov/), and all the related data can be obtained from Wenfang Wang (email: [email protected]) upon reasonable request.
Ethics Approval and Informed Consent
The research was performed in accordance with the principles stated in the Declaration of Helsinki and approved by the Biomedical Ethics Committee of Medical College of Xi’an Jiaotong University (No: 2021-1599). Informed consent was obtained from all subjects involved in the study. Written informed consent has been obtained from the patients to publish this paper.
Acknowledgments
I would like to thank my husband for his encouragement and advice in this study.
Disclosure
The authors report no conflicts of interest in this work.
References
1. Chiang CP, Yu-Fong Chang J, Wang YP, Wu YH, Lu SY, Sun A. Oral lichen planus - differential diagnoses, serum autoantibodies, hematinic deficiencies, and management. J Formos Med Assoc. 2018;117(9):756–765. doi:10.1016/j.jfma.2018.01.021
2. González-Moles M, Warnakulasuriya S, González-Ruiz I, et al. Worldwide prevalence of oral lichen planus: a systematic review and meta-analysis. Oral Dis. 2021;27(4):813–828. doi:10.1111/odi.13323
3. Cheng YS, Gould A, Kurago Z, Fantasia J, Muller S. Diagnosis of oral lichen planus: a position paper of the American Academy of Oral and Maxillofacial Pathology. Oral Surg Oral Med Oral Pathol Oral Radiol. 2016;122(3):332–354. doi:10.1016/j.oooo.2016.05.004
4. Hamour AF, Klieb H, Eskander A. Oral lichen planus. CMAJ. 2020;192(31):E892. doi:10.1503/cmaj.200309
5. Giannetti L, Dello Diago AM, Spinas E. Oral lichen planus. J Biol Regul Homeost Agents. 2018;32(2):391–395.
6. Alrashdan MS, Cirillo N, McCullough M. Oral lichen planus: a literature review and update. Arch Dermatol Res. 2016;308(8):539–551. doi:10.1007/s00403-016-1667-2
7. van der Meij EH, van der Waal I. Lack of clinicopathologic correlation in the diagnosis of oral lichen planus based on the presently available diagnostic criteria and suggestions for modifications. J Oral Pathol Med. 2003;32(9):507–512. doi:10.1034/j.1600-0714.2003.00125.x
8. Oberti L, Alberta L, Massimo P, Francesco C, Dorina L. Clinical management of oral lichen planus: a systematic review. Mini Rev Med Chem. 2019;19(13):1049–1059. doi:10.2174/1389557519666190301144157
9. Giuliani M, Troiano G, Cordaro M, et al. Rate of malignant transformation of oral lichen planus: a systematic review. Oral Dis. 2019;25(3):693–709. doi:10.1111/odi.12885
10. González-Moles M, Ruiz-Ávila I, González-Ruiz L, Ayén Á, Gil-Montoya JA, Ramos-García P. Malignant transformation risk of oral lichen planus: a systematic review and comprehensive meta-analysis. Oral Oncol. 2019;96:121–130. doi:10.1016/j.oraloncology.2019.07.012
11. Tampa M, Caruntu C, Mitran M, et al. Markers of oral lichen planus malignant transformation. Dis Markers. 2018;2018:1959506. doi:10.1155/2018/1959506
12. Sequeira I, Rashid M, Tomás IM, et al. Genomic landscape and clonal architecture of mouse oral squamous cell carcinomas dictate tumour ecology. Nat Commun. 2020;11(1):5671. doi:10.1038/s41467-020-19401-9
13. Gassling V, Hampe J, Açil Y, Braesen JH, Wiltfang J, Häsler R. Disease-associated miRNA-mRNA networks in oral lichen planus. PLoS One. 2013;8(5):e63015. doi:10.1371/journal.pone.0063015
14. Danielsson K, Coates PJ, Ebrahimi M, Nylander E, Wahlin YB, Nylander K. Genes involved in epithelial differentiation and development are differentially expressed in oral and genital lichen planus epithelium compared to normal epithelium. Acta Derm Venereol. 2014;94(5):526–530. doi:10.2340/00015555-1803
15. Shi W, Yang J, Li S, et al. Potential involvement of miR-375 in the premalignant progression of oral squamous cell carcinoma mediated via transcription factor KLF5. Oncotarget. 2015;6(37):40172–40185. doi:10.18632/oncotarget.5502
16. Shiiba M, Ishige S, Saito Y, et al. Down-regulated expression of family with sequence similarity 3, member B (FAM3B), in oral squamous cell carcinoma. Oral Sci Int. 2012;9(1):9–16. doi:10.1016/S1348-8643(12)00004-3
17. Peng Q, Zhang J, Ye X, Zhou G. Tumor-like microenvironment in oral lichen planus: evidence of malignant transformation? Expert Rev Clin Immunol. 2017;13(6):635–643. doi:10.1080/1744666X.2017.1295852
18. Yao L, Yan J, Cheng F, et al. Small proline-rich protein 2B Facilitates gastric adenocarcinoma proliferation via MDM2-p53/p21 signaling pathway. Onco Targets Ther. 2021;14:1453–1463. doi:10.2147/OTT.S281032
19. Kong X, Wang D, Sun W, et al. Small proline-rich protein 2A and 2D are regulated by the RBM38-p73 axis and associated with p73-dependent suppression of chronic inflammation. Cancers (Basel). 2021;13(11):2829. doi:10.3390/cancers13112829
20. Zhang YY, Mao MH, Han ZX. Identification of a gene prognostic signature for oral squamous cell carcinoma by RNA sequencing and bioinformatics. Biomed Res Int. 2021;2021:6657767. doi:10.1155/2021/6657767
21. Metzger K, Moratin J, Freier K, et al. A six-gene expression signature related to angiolymphatic invasion is associated with poor survival in laryngeal squamous cell carcinoma. Eur Arch Otorhinolaryngol. 2021;278(4):1199–1207. doi:10.1007/s00405-020-06214-1
22. Yang J, Robert CE, Burkhardt BR, et al. Mechanisms of glucose-induced secretion of pancreatic-derived factor (PANDER or FAM3B) in pancreatic beta-cells. Diabetes. 2005;54(11):3217–3228. doi:10.2337/diabetes.54.11.3217
23. Kim H, Park S, Jin MK, Kim SJ, Kim S. Role of FAM3B as a novel tumor suppressor gene in gastric cancer. Cancer Res. 2013;73:662. doi:10.1158/0008-5472.CAN-12-0653
24. Li Z, Mou H, Wang T, et al. A non-secretory form of FAM3B promotes invasion and metastasis of human colon cancer cells by upregulating Slug expression. Cancer Lett. 2013;328(2):278–284. doi:10.1016/j.canlet.2012.09.026
25. Maciel-Silva P, Caldeira I, de Assis Santos I, et al. FAM3B/PANDER inhibits cell death and increases prostate tumor growth by modulating the expression of Bcl-2 and Bcl-X(L) cell survival genes. BMC Cancer. 2018;18(1):90. doi:10.1186/s12885-017-3950-9
26. He SL, Wang WP, Yang YS, Li EM, Xu LY, Chen LQ. FAM3B promotes progression of oesophageal carcinoma via regulating the AKT-MDM2-p53 signalling axis and the epithelial-mesenchymal transition. J Cell Mol Med. 2019;23(2):1375–1385. doi:10.1111/jcmm.14040
 © 2022 The Author(s). This work is published and licensed by Dove Medical Press Limited. The full terms of this license are available at https://www.dovepress.com/terms.php and incorporate the Creative Commons Attribution - Non Commercial (unported, v3.0) License.
By accessing the work you hereby accept the Terms. Non-commercial uses of the work are permitted without any further permission from Dove Medical Press Limited, provided the work is properly attributed. For permission for commercial use of this work, please see paragraphs 4.2 and 5 of our Terms.
© 2022 The Author(s). This work is published and licensed by Dove Medical Press Limited. The full terms of this license are available at https://www.dovepress.com/terms.php and incorporate the Creative Commons Attribution - Non Commercial (unported, v3.0) License.
By accessing the work you hereby accept the Terms. Non-commercial uses of the work are permitted without any further permission from Dove Medical Press Limited, provided the work is properly attributed. For permission for commercial use of this work, please see paragraphs 4.2 and 5 of our Terms.